Article

Beyond Carbon Footprint Calculators. New Approaches for Linking Consumer Behaviour and Climate Action

by
Mario Burgui-Burgui
* and
Emilio Chuvieco
Department of Geology, Geography and the Environment, University of Alcalá, 2nd Colegios St., 28801 Madrid, Spain
*
Author to whom correspondence should be addressed.
Sustainability 2020, 12(16), 6529; https://doi.org/10.3390/su12166529
Submission received: 14 July 2020 / Revised: 6 August 2020 / Accepted: 10 August 2020 / Published: 12 August 2020
(This article belongs to the Section Air, Climate Change and Sustainability)

Abstract

:
This paper presents a carbon footprint (CF) observatory recently developed within our research group. It aims to introduce a new concept of CF accountability, which focused not just on measuring CF, but also on making users reflect about and eventually change their lifestyles to reduce their personal emissions. With this conception, the CO2web observatory includes not only a CF calculator, but also the CF of different alternative consumption scenarios. Therefore, the user may be more aware of the impact of different personal decisions, such as emissions linked to different food, cars, home appliances or pets. In addition, the CF calculator provides quantitative comparisons of the emissions linked to current habits of users with those of similar cohorts, along with specific advices for those consumption sectors where emissions are significantly higher than their cohort’s average.

1. Introduction

Climate change is considered the greatest environmental challenge facing humanity today, with wide implications on social and ecological systems [1]. The different Conferences of Parties of the UN Framework for Climate Change have emphasized the need to take solid commitments to reduce greenhouse gas (GHG) emissions, but still trends are far from being optimal to avoid the 2 degree target agreed in the Paris agreement [2]. Therefore, we need to make further efforts and provide creative ways to “flat the curve” and decouple the economic development from rising GHG emissions.
Several authors have shown that a large percentage of GHG emissions (60–70%) are related to personal consumption [3,4], which indicates the relevance of individual decisions on climate change mitigation, and the importance of linking Climate Action and Responsible Consumption, both included in the Sustainable Development Goals (Goals 13 and 12, respectively).
The analysis of the impacts of personal decisions on GHG emissions is part of a growing concern of individual responsibility in climate action beyond governments, industry or NGO [5]. Among the different instruments to improve citizen awareness on climate change and mitigation measures, carbon footprint calculators (CFC) have become a popular tool, as they help educating about the impacts of daily habits on GHG emissions [6,7]. Following Birnik [8]: “carbon calculators constitute a potentially powerful bridge to connect individual action and lifestyle choices with the increasingly urgent need to prevent dangerous climate change” (p. 280). Several calculators are freely available on the web, showing the accumulated emissions of the user from different sectors: food, transport, house energy, clothing, etc. [7,9].
Some studies have shown that these calculators stimulate the interest of users and motivate their commitment, whilst providing them with science-based information to take optimal decisions [10]. Since they account for personalized information to calculate emissions, CFCs increase individual awareness about the impact of daily decisions [11]. CFC users report an increase of personal guilty or satisfaction when they compare their emissions with reference groups, leading to improve or reinforce personal commitments [12]. Finally, CFCs have revealed possibilities for behavioral and technological changes that could significantly reduce household footprint [13]. However, as occurs in other environmental issues, increasing awareness about climate change through CFC does not always translate into change of habits [11].
Several authors have highlighted that there are no standards regarding how CFC should be programmed, nor the methods or calculations they should incorporate to get consistent results [8,14,15]. This implies that very different values can be estimated from similar user behaviors, or even with the same inputs [16], which reduces the credibility of CFC to promote actual changes [17,18]. On the other hand, it is common that calculators are not accompanied by sufficient information to contextualize the results (or this information is not properly communicated) [19], which does not facilitate users’ understanding of the results nor the ways to reduce their personal CF. Some review papers have suggested a list of ‘good practices’, oriented both to the design of CFC, including the information and recommendations that a user should receive [8,20].
In addition, CFCs measure the actual emissions derived from the user’s consumption, but they are less suitable to provide quantitative information on alternative choices, beyond general guidance to reduce personal emissions. In other words, they inform about the impact of the actual behavior (that is after the consumption was made), but they fail to inform about different alternatives before the consumer decision is taken. For instance, most CFCs include information on actual emissions derived from using a certain car, but they do not inform about which cars have lower CO2 emissions when somebody is willing to buy a new one. CF of alternative choices are also a practical way to find out which ones are more important to reduce personal emissions and to focus on those decisions that really matter. Several environmental psychologists have emphasized the need of guiding pro-environmental behavior against those actions that have a greater environmental impact, particularly when they do not require continuous efforts, such is the clear case of technology choices [21,22]. Therefore, personal CFCs should be complemented by information on CF from a wide set of choices, as to foster behavioral changes that will better link responsible consumption and climate action.

2. Objectives

This paper presents an integrated approach to CF estimations that was developed for improving citizen’s awareness about the impact of personal choices. The concept is shown in a web tool that includes information for both before and after the actual consumption is made. Instead of a single CFC, we designed a Carbon Footprint Observatory named CO2web (https://www.huellaco2.org/), freely open for all users, which aimed to provide a comprehensive information on GHG emissions linked to personal consumption of ordinary citizens. The observatory was designed as an easy to use tool for promoting citizens’ awareness about personal GHG emissions and foster behavioral change though focused recommendations. It has three main blocks interrelated. Firstly, the scientific basis of climate change, as well as the concept of CF and its calculation are presented. The second section, “Exploring alternatives”, reports on the CF of activities linked to citizens’ daily habits (food, transportation, clothing, hygiene, home appliances, IT/devices and pets) showing comparisons between them and alternatives with lower emissions in some categories. Finally, the section “Compute your footprint” includes a personal CFC, preceded by an explanation for the user to understand its operation, requirements and results. The CO2 observatory has been developed in Spanish, but will be soon translated to other languages. This paper shows the design and contents of the CO2web observatory, the problems and solutions encountered to implement the web site and the compliance with best recommendations, as well as a first evaluation of its potential

3. Materials and Methods

3.1. Design of the CO2web Observatory

The design of the CO2web observatory started from a comprehensive review of web sites and scientific papers dealing with CFC. More than 60 sites were reviewed and analysed. The main recommendations and good practices indicated by previous studies were taken into account [7,9,19], both including the contents and the graphical interface. The main problems detected in the implementation of similar tools [23] were also considered. The central objective (behavioral change) needs a previous phase of user preparation, for which there is a need to facilitate the appropriate information and highlight the importance of the topic and the user’s contribution to raise awareness. After that, it is necessary to validate the experiences of the users by collecting their opinions and using this feedback to continue improving the whole cycle. Proper dissemination helps in collecting feedback from media and general public (Figure 1).

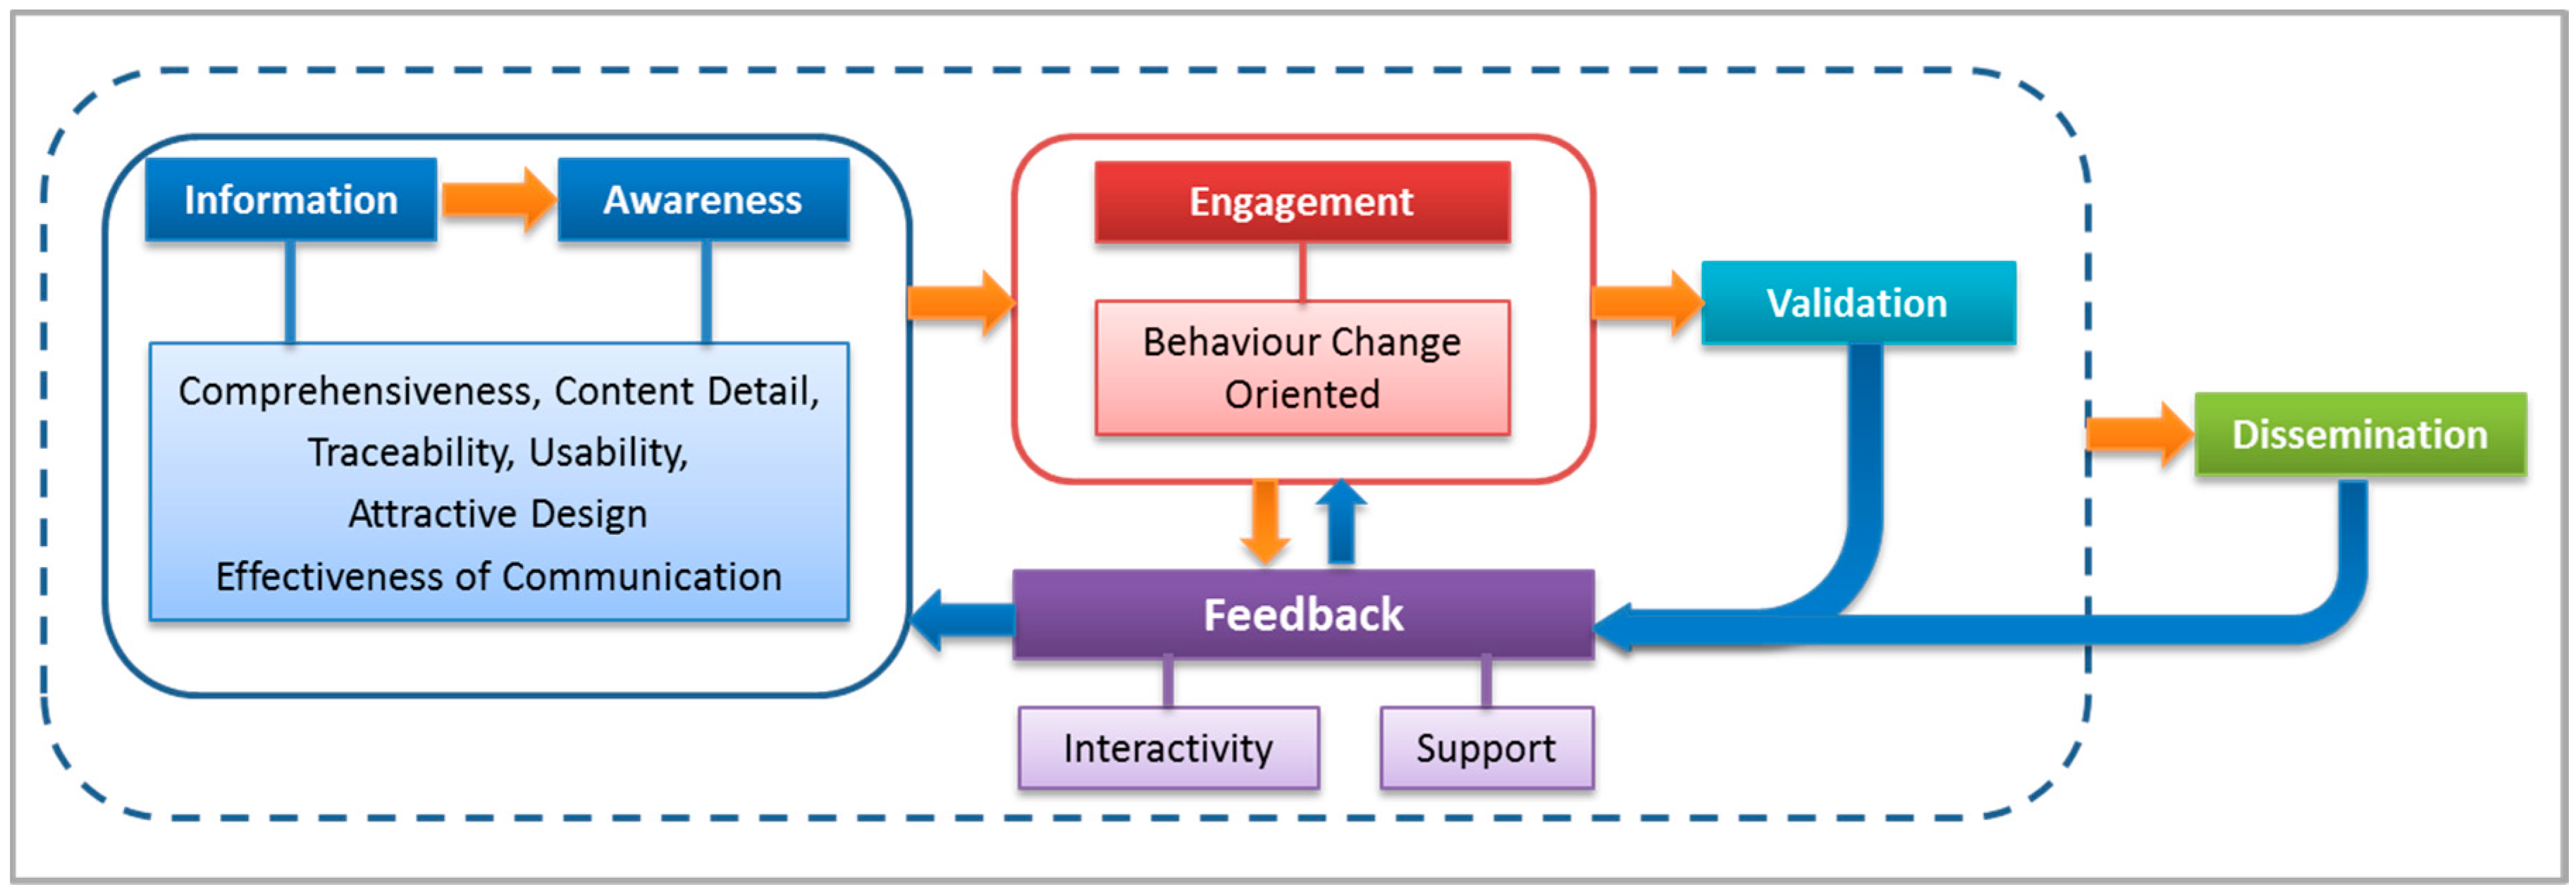
3.1.1. Meeting Conceptual Requirements

The first guide for designing the observatory was to fulfill the requirements recommended in the specialized literature [7,9,19,24]). The following were considered:
  • Information: science-driven, data based on solid sources, whenever possible in the peer-reviewed literature.
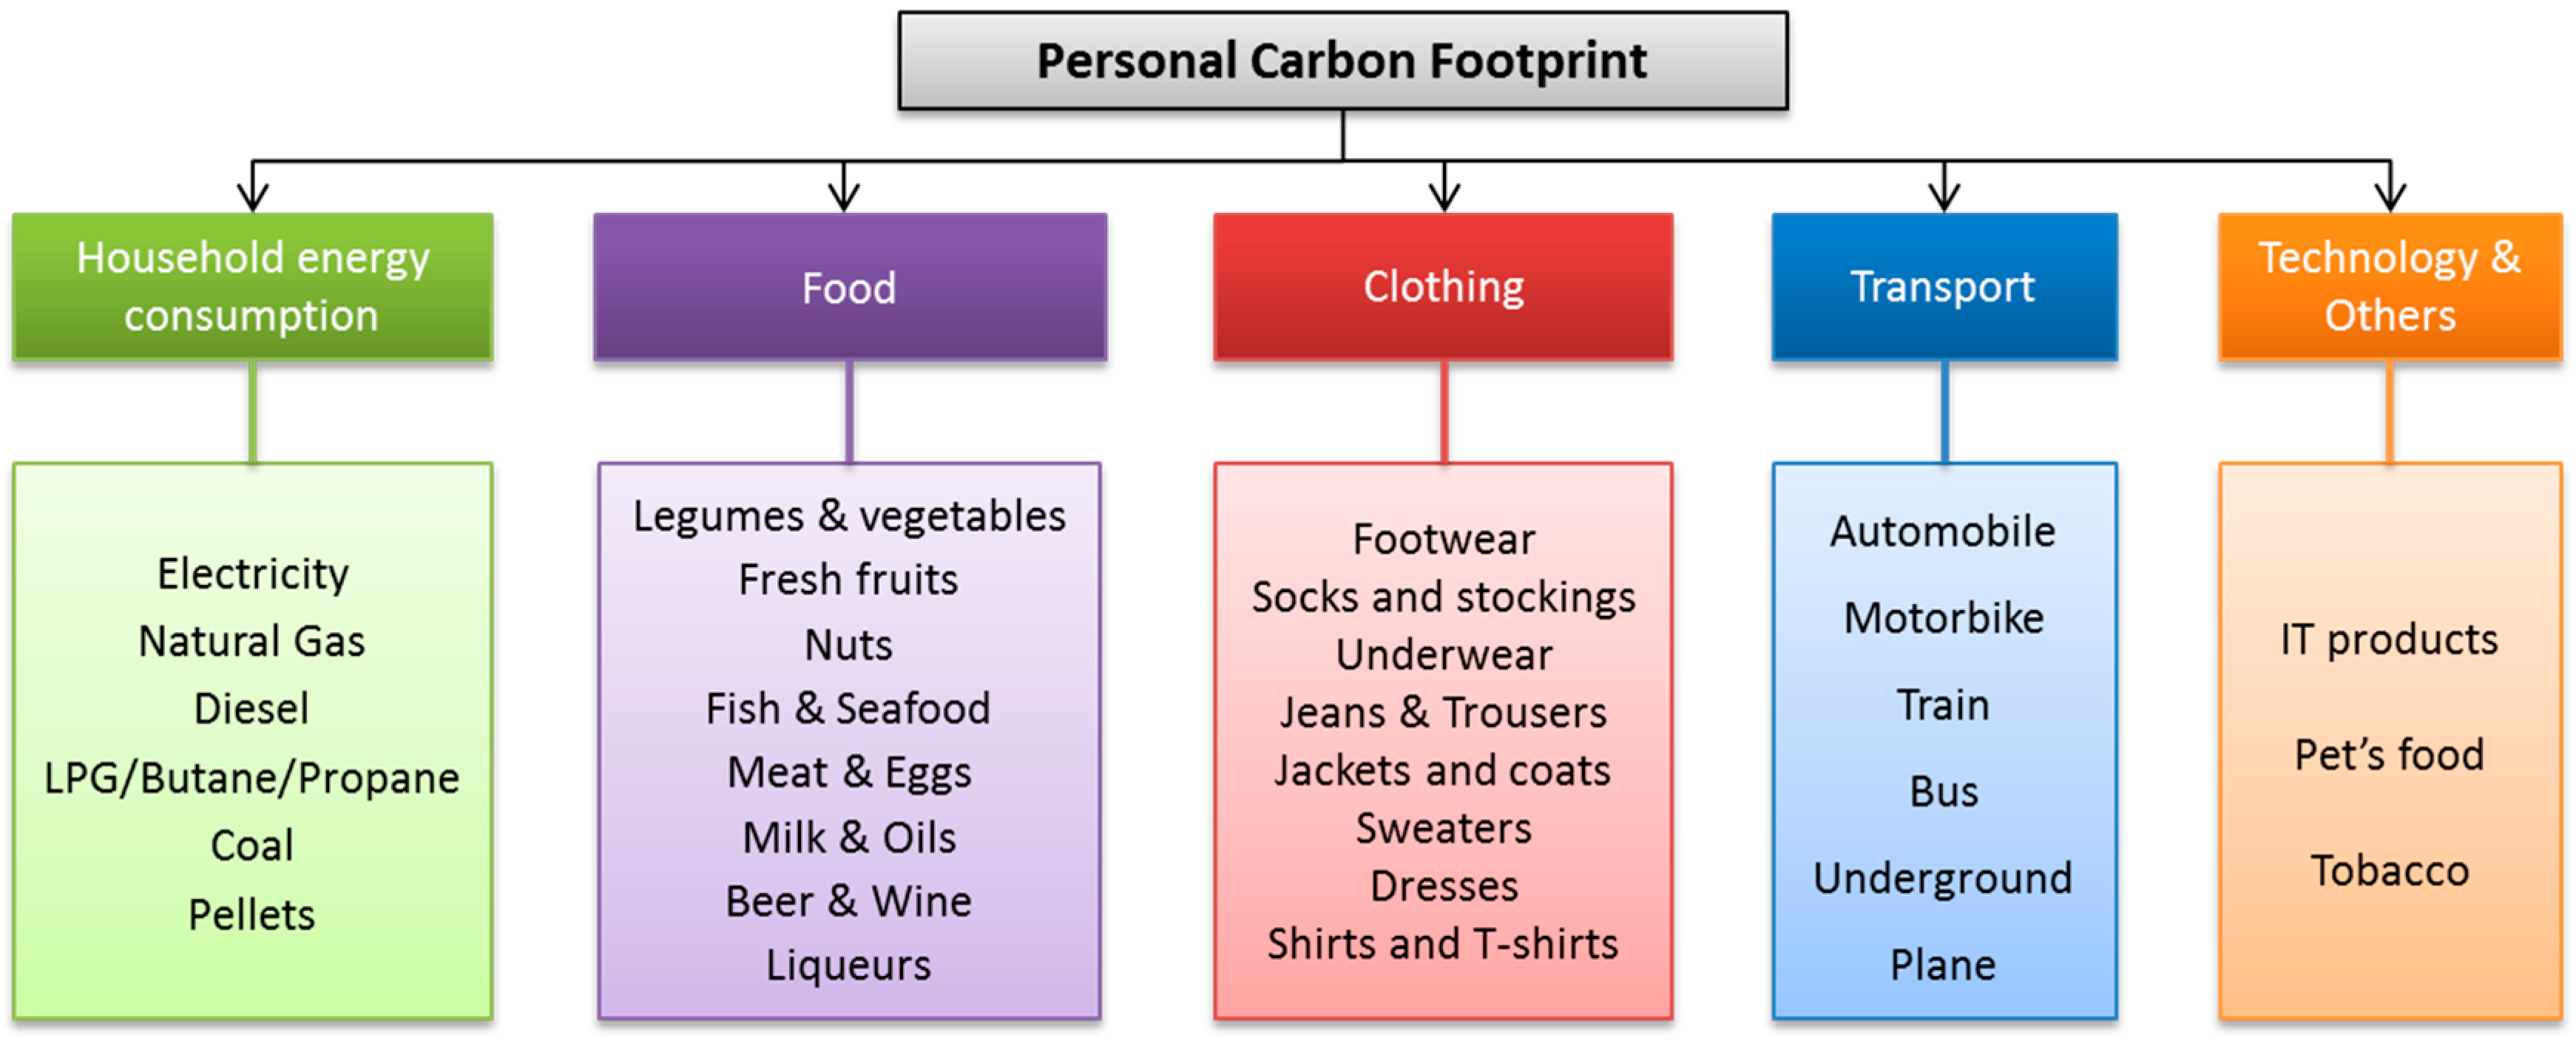
  • Comprehensiveness: include a wide variety of sectors related to personal consumption (those with the greatest impact on GHG emissions).
  • Content detail: provide a proper level of detail and options for the different categories. Equilibrium between being too general to provide just a general estimation of emissions, and being too specific as to make greatly complex to fill the input data.
  • Traceability: all data included in the observatory should be properly referenced.
  • Interactivity: facilitate interaction with the user.
  • Usability: easy access and operation. Handy features and explanations facilitate navigation and use. Functional diversity has been considered.
  • Attractive design: good aesthetic, user-friendly colors and icons. Adapted to all devices.
  • Awareness: beyond the information, it was considered essential to make the user aware about the importance of the topic (climate change as the main current environmental challenge) and his or her individual contribution (through the acquisition of more sustainable habits).
  • Behavior change oriented: comparisons between different options and alternative “low carbon” products, diets or transports; general and personalized suggestions to reduce personal carbon footprint.
  • Effectiveness of communication: parsing and communicating emissions with different levels of detail, both grouped and disaggregated.
  • Support: give guidance and answer questions from users.
  • Feedback: collect user’s opinion and suggestions to improve.
  • Dissemination: open to ordinary citizens, no specialized audiences.

3.1.2. Technical Requirements

In addition to the general requirements established for the global design of the site, the CO2web observatory aimed to comply with technical recommendations of CFC [8,9].
First in terms of functional units, all emissions data in the CO2web site are expressed in “Carbon dioxide equivalent” (CO2e) units, the most standard CF of life cycle analysis. The CO2e integrates emissions from different GHG by expressing them in terms of their potential warming with respect to CO2. The potential warming was estimated from Myhre and collaborators [25], considering a time horizon of 100 years.
As far as the functional unit concerns, it was adapted to the characteristics of the item assessed: for food or cleaning products, we used liters, kilograms or dozens. For computer equipment, household appliances and clothing we computed CF per unit of product (refrigerator, computer, trousers, etc.). The same criteria were applied to pets.

3.2. Target Information of the CO2web Observatory

The CO2web site included two sets of CF data. On the one hand, tables with emissions computed for a wide variety of consumer choices (named “Exploring alternatives” (EA)). On the other, a CFC. The former includes data obtained from a literature review of dedicated studies on LCA. Whenever more than one study was available, the average, maximum and minimum values were included in the final tables, as well as the country where the calculations had been made whenever available. For the CFC, only the average values were included to perform the calculations.
The food section of the EA section includes a summary table, with the CF of different types of viands, including beef, legumes, vegetables, drinks, fruits, etc. Particular tables of each type of food are also included, going up to 145 products. For instance, the fresh fruit section covers 19 products, including apple, orange, avocado, bananas, etc.). Most of the food CF estimations were taken from Clune et al.’s (2017) review paper, databases of government environmental agencies [26,27] and, to a lesser degree, specific academic articles for certain products (cacao, coffee, liquors, beer, wine) or previous own studies [28]. For tobacco consumption, we followed the study of Zafeiridou and collaborators [29].
In the transport section, international and national databases about fuel consumption and related emissions were consulted for various types of vehicle, including urban and interurban buses, underground, short and long-distance trains, and airplanes [22,30,31]. For cars, the calculation included emissions from three phases of the life cycle. Phase 1 includes the extraction and processing of the materials needed to manufacture the vehicle (steel, iron, aluminum, copper, plastic, etc.). Phase 2 refers to the production processes (stamping, molding, spinning, machining, welding, painting, etc.). Phase 3 indicates the emissions due to use, based on the distance travelled, type of fuel and efficiency. The recycling and disposal phase has not been included, because there is still little experience of it, particularly in the case of electric cars. We estimated emissions for seven types of cars (hatchback and compact, sedan, wagon, compact-minivan/MPV, minivan, CUV, SUV). The calculation was made from the five best-selling models in Spain in 2018 for each segment. The calculations of phase 1 and 2 were based on the average emission for the different materials multiplied by the weight of the vehicle. The proportions are a bit different for electric cars, to which the emissions caused by the high-voltage battery manufacture are added, depending on its load capacity (kW). A standard value of 110 kgCO2e/kWh has been used for this calculation [32]. Phase 3 was calculated from the average consumption of the different models (in l/100 km), applying the standard emission factors for Spain in 2018: 2.157 kgCO2e/l for gasoline, 2.493 kgCO2e/l for diesel and 2.71 kgCO2e/kg for compressed natural gas [33,34]. In all cases, it was assumed an average car lifespan of 200,000 km. For electric cars, when all electricity comes from renewable sources, zero emissions were assumed. Otherwise, the emissions average of the Spanish electric energy mix was applied (0.246 kgCO2e/kWh in 2018, https://www.ree.es/es). For motorcycles, a 12 years lifespan is assumed, with an average use of 5000 km per year. An average consumption per engine capacity has been included. For electric ones, an average battery of 8kW is assumed, with a standard consumption of 7 kW/100 km. Same ratio of emissions from battery manufacture as in electric cars.
For ‘clothing’, the same procedure was followed as for food, detailing the maximum and minimum emission values, average, as well as the country where the calculations had been made. We included the 16 main types of clothing and 4 types of footwear [26,35,36,37,38,39]. Following the same method, we listed 13 products in the ‘hygiene and cleaning’ section [40,41,42,43,44,45].
For computers and electronics, as well as for home appliances, both the emissions associated with the manufacture of the different devices, as well as those associated with consumption were included [26,46,47,48]. Two consumption rates were considered for IT products: low (1h/day) and intensive (6 h/day). Again, a distinction was made between the national electricity mix and the case of generating energy fully from renewable sources (in which case the consumption emissions were considered equal to zero).
Finally, the emissions associated to pets (dogs and cats) were focused on their food consumption. This was estimated from their weight, multiplied by the emissions associated with the production of the ingredients (meat, vegetables and other supplements), along with the processing of all the components to obtain ready-to-sell dry food, as well as the transport to the point of sale. However, as some studies point out, part of the food of companion animals comes from human leftover food. Still, this factor is very much dependent on local cultures [49,50,51].

3.3. Programming

The CO2web was programed using standard computer tools. All the web sections were programmed in HTML and PHP, while tables and databases were built using MySQL and Javascript All the CO2web site was designed to be device-independent. It was a requirement that all menus were adapted on the fly to different screen dimensions of most popular devices, including desktop computers, tables and mobile phones.
The tables of the explore alternatives section were programmed with dynamic ranking, so the user might order the data using any of the headers of the tables. The database was linked to a user friendly editing tool, to facilitate the updating of the reference data when new studies are available.
For the CFC, the input fields included minimum and maximum limits to avoid recording unrealistic data. The programming included a verification step, where the user is asked to confirm the value introduced when it was likely to be unrealistic. These thresholds were extracted from the averages for Spain in each category. For instance, if the average consumption of natural gas in Spanish homes is 7000 kWh, users will be asked for confirmation when including a data higher than 50% of the previous one (>11,000 kWh). Yet, they will be free to include elevated consumption data if that is their case. In this way, unintended errors in data introduction were reduced. Once the user fills a certain field, the CFC immediately offers the corresponding data in equivalent emissions. Thus, the user does not need to complete all the sections to know the impact of each product/habit. This was designed to improve the awareness of the impact of different consumption sectors. To better understand personal emissions, a series of control variables were defined in the CFC: sex, age, place of residence, educational level and occupation. Therefore, the estimation of personal CFC could be compared with persons of similar characteristics. The CF database should be updated whenever a new user introduces his-her information so the national and group averages were calculated and updated it with each new entry.

3.4. Validation

The data of the CO2web observatory comes from peer-reviewed papers and well-reputed institutions and, therefore, its input data are validated from their own sources. Validation in this regard refers to the actual achievement of the goals we foreseen when designing the tool. This is an on-going process that would require further effort. We present here a first assessment based on a small sample of environmental science students from the University of Alcalá (Spain), following courses on “Global Change” and “Environmental Ethics”. The objective was to analyze the impressions and difficulties encountered by the students, solve doubts, correct possible malfunctions, facilitate the use of the calculator and make the footprint information collected as complete and reliable as possible.

4. Results and Discussion

4.1. Contents

The observatory consists of four main blocks dedicated respectively to (Figure 2):
Sustainability 12 06529 i001Why an observatory? Includes the background for creating the site and general recommendations for its use.
Sustainability 12 06529 i002Science: describes the scientific bases of climate change, the concept of CF and its calculation.
Sustainability 12 06529 i003Alternatives: includes emissions information on a wide variety of dimensions of personal consumption.
Sustainability 12 06529 i004Calculator: includes a personal calculator of the CF.
The web also includes a section called “further information”, which brings together all the references and databases used in the calculations and the information offered; as well as a “Contact” section, where the users can send their suggestions and record their experience through a simple survey. The three central blocks are briefly described below: Fundamentals, explore alternatives and calculator.

4.1.1. Science

The first block after the presentation includes information on climate change and the scientific bases that explain the human influence on the increase in global temperature. Later, the concept of HC and the main methodologies for its calculation are explained.

4.1.2. Alternatives

As previously indicated, this section collects a compilation of emission data associated with the most common consumption habits, including calculations of emissions linked to the different types of food, automobiles, air transport, clothing, hygiene and cleaning products, home appliances, office/IT products and pets. Furthermore, various alternatives for low carbon meals are included, as well as comparisons between all the categories, in order to show the equivalents between different habits.

4.1.3. CFC

The calculator includes five sections in addition to some control variables (age, gender, profession, education level and size of residence area) and a final section of results and comparisons (Figure 3). The household section includes the option of selecting various sources of energy in the supply, as well as choosing whether all the energy comes from renewable sources or not. To fill in this section, users are required to have the energy bills of the last months. It is also requested to indicate the number of people who live in the house to estimate the per-capita emissions. The energy sources considered are: electricity, natural gas, diesel, other gas sources, coal and pellets. The food section requires the user to enter the approximate amounts consumed per week of different food groups (vegetables and legumes, fresh fruits, meat, etc.). In the clothing section, the user is asked to enter how many pieces are bought per year. In transport, the user can enter the annual km traveled by automobile, motorbike, train, bus, metro or airplane. Finally, the user is requested to include the tobacco use (number of cigarettes/week), pets and technology.
The calculator offers the possibility of comparing the results with people of similar characteristics, using the variables: age, sex, work, place of residence, level of studies. Users can download a personalized report in PDF and EXCEL formats, which includes a summary of annual emissions (in kgCO2e and percentage), a comparison with the user’s cohort (in numerical data, percentage and graphs) and recommendations. In this case, the system includes only specific suggestions, related to the section where the user’s carbon footprint is higher than the national average (+1 standard deviation).

4.2. Validation

Preliminary validation of the CO2web observatory is included here, taking into account three dimensions: compliance with requirements, both from a user and from a technical perspective, and students’ feedback. Further efforts are required for a full validation of the impact of the tool to increase user awareness about climate change and personal CF, and potential consequences on their personal behavior.

4.2.1. Compliance with User Requirements

Table 1 identifies target user requirements and final solutions provided in the CO2web observatory.

4.2.2. Compliance with Technical Requirements

In accordance with the recommendation of best-practices [8,9], the following technical requirements were implemented (see Table 2).

4.2.3. Students Feedback

The students who have used the observatory have positively valued the contents, highlighting aspects such as: (1) the interest of the whole website to reflect on the impact of their daily activities on climate change; (2) the possibility of comparing their emissions with people with similar characteristics; (3) The analysis of the reasons that could explain why their emissions were higher or lower than the average values of that groups (i.e., the impact of transportation depending on their place of residence, or that of food related to specific diets). Some of the comments extracted from the survey are:
  • “I found this work very useful. I was able to check my CF and become more aware of the emissions we emit over the course of a year. This concept should be more present in our day to day lives”.
  • “My footprint has been XX kgCO2e, a very high one in relation to the rest of my colleagues because last summer I traveled to XXX, which has increased my emissions a lot”.
  • “Finally, is transport where the most CO2 emissions are registered compared to the total, because I am below the average in practically in the rest of the sections. The fact of studying and working at the same time implies higher than average emission values”.
This first preliminary validation offers hopeful indications about the acceptance of this type of tools by the user, due to the fact that some of the conditions indicated by previous research as predictors of ‘CFC continuance intention’ are met, according to the former comments: low-carbon attitude, low-carbon behavioral intention, satisfaction and perceived usefulness [53].
Another factor pointed out by the aforementioned study, low carbon subjective norm, does not appear at this point, which may be based on the fact that, in Spain, there is currently still no real social pressure on emissions reduction on a personal level. However, as can be seen from the following asserts, the most aware users do consider that it should exist:
  • “The population should have more information about our HC and thus, little by little, create a new lifestyle with small gestures and try to reduce it”.
  • “This type of technology is very interesting, since many people could see the environmental disaster they may be causing. Let ideas like this proliferate to continue educating people”.
We also found promising reactions in respect of the pedagogical utility, as can be seen in the last remark and others (i.e., “It is a very interesting teaching tool”). Finally, some users point to another factor that seems to influence initial adoption of these technologies, perceived ease of use [54,55]: “I find the accessibility of information very interesting, and the quick connection with personal life habits. They help reflection”.
All this also confirms previous findings on the usefulness of the calculator to make students see environmental issues (climate change in this case) that they would not otherwise pay attention to, providing them with arguments and tools to understand de impact of their life habits [56].

4.3. Difficulties and Limitations

The main difficulties and limitations found to generate the CO2web observatory were related to the accessibility and characteristics of the data. We have tried to provide a comprehensive list of products, but sometimes is difficult to make comparisons among them, as the LCA may proceed from different methods and national conditions. For this reason, whenever the same product had different LCA assessments, we opted to include minimum, average and maximum emission values in the tables, so the user would be better aware of the potential ranges of estimations. Moreover, when incorporating data from different countries, it is also necessary to consider different factors, such as the national energy mix.
We tested the observatory with different users, including those with familiarity with climate science and those who were not familiar with it at all, so we could find out if they understood properly the concepts and the data requirements. We corrected some of the expressions that were not readily understood and include further explanations whenever necessary. For instance, some users thought that the whole house energy consumption was applied to a single user (it was in fact divided by the number of people living in the house), or whether airplane travels refer to single journeys or round trip. With regard to the calculator, it is worth mentioning the difficulty found in some cases regarding the availability and understanding of household energy bills (depending on the age of the user, whether he or she owns the house or rents it, among other factors).

4.4. Accesibility

The CO2web observatory is freely accessible through a dedicated web page (https://huellaco2.org/). It is accessible through the main web browsers (Firefox, Chrome, Safari, etc.), and includes a version for desktop computers and mobile devices (tablets and phones). Access from both iOS and Android devices have been successfully tested. It is currently only available in Spanish, but translation to other languages is expected in the next few months.

5. Conclusions and Future Work

Carbon footprint calculators are valuable tools for estimating GHG emissions, familiarizing the public with issues related to climate change and the concept of carbon footprint. They can also increase public awareness about how their lifestyles impact global warming and suggest behavioral changes. However, many of these tools have shortcomings related, among other things, to transparency, rigor, comprehensiveness or recommendations to reduce the footprint. In order to overcome the aforementioned limitations and others detected to date, we have developed a CO2 observatory, which aimed to develop an integrated approach to personal CF assessment, including information for both before and after the consumption decisions are made. To accomplish the main objective, a series of conceptual and technical requirements were established, which both the observatory and the calculator should meet, following the main recommendations of previous studies. Subsequently, compliance with user and technical requirements were verified. A preliminary validation with university students confirmed the achievement of positive results with respect to the objectives set and provide useful insights into the strengths and drawbacks of the observatory, which will be further evaluated in the next versions.
All of the above indicates that the first version of the site presented here can be used directly for educational purposes in schools, universities and in other institutions related to climate change mitigation. In the current context towards low carbon societies, it can also be helpful in climate policies and sensitization programs focused on the individuals’ responsibility.
The observatory also represent a framework that can serve as the basis for further research related to climate action and responsible consumption in Spain.
Future work will focus primarily on evaluating the response of users, as well as the changes experienced regarding their awareness and actions taken towards a low-carbon life. This could include several options to be developed within the observatory in the short term: simulation of scenarios and alternative options to reduce the computed footprint, tools to engage the users in tracking their emissions through time, among others.
At the same time, it is planned to apply the tool to close real cases that can be followed up, which will mainly include high-school and university students through several consecutive academic years. The research will also be expanded through participation in international projects with partner institutions from other countries, within the current line of emission reduction associated with climate change mitigation.

Author Contributions

Conceptualization, Methodology, Validation, Formal Analysis, Research and Writing: M.B.-B. and E.C.; Data Curation: M.B. Both authors have read and agreed to the published version of the manuscript.

Funding

This paper is based on research performed by the Environmental Ethics Chair, which is funded by the “Tatiana Pérez de Guzmán el Bueno Foundation”.

Acknowledgments

Suggestions on preliminary versions of the CO2 Observatory from Rubén Díaz-Sierra, Carmen Solís and Sílvia Albareda were very useful. José María Vizcaíno created the visual art of the observatory and Daniel García did the programming.

Conflicts of Interest

The authors declare no conflict of interest.

References

  1. Stocker, T.F.; Qin, D.; Plattner, G.-K.; Tignor, M.; Allen, S.K.; Boschung, J.; Nauels, A.; Xia, Y.; Bex, V.; Midgley, P.M. Climate Change 2013—The Physical Science Basis; Contribution of Working Group i to the Fifth Assessment Report of the Intergovernmental Panel on Climate Change; Cambridge University Press: Cambridge, UK, 2013; p. 1535. [Google Scholar]
  2. Victor, D.G.; Akimoto, K.; Kaya, Y.; Yamaguchi, M.; Cullenward, D.; Hepburn, C. Prove paris was more than paper promises. Nat. News 2017, 548, 25. [Google Scholar] [CrossRef]
  3. Hertwich, E.G.; Peters, G.P. Carbon footprint of nations: A global, trade-linked analysis. Environ. Sci. Technol. 2009, 43, 6414–6420. [Google Scholar] [CrossRef] [PubMed] [Green Version]
  4. Ivanova, D.; Stadler, K.; Steen-Olsen, K.; Wood, R.; Vita, G.; Tukker, A.; Hertwich, E.G. Environmental impact assessment of household consumption. J. Ind. Ecol. 2016, 20, 526–536. [Google Scholar] [CrossRef]
  5. Paterson, M.; Stripple, J. My space: Governing individuals’ carbon emissions. Environ. Plan. D Soc. Space 2010, 28, 341–362. [Google Scholar] [CrossRef]
  6. Collins, A.; Galli, A.; Hipwood, T.; Murthy, A. Living within a one planet reality: The contribution of personal footprint calculators. Environ. Res. Lett. 2020, 15, 025008. [Google Scholar] [CrossRef]
  7. Salo, M.; Mattinen-Yuryev, M.K.; Nissinen, A. Opportunities and limitations of carbon footprint calculators to steer sustainable household consumption—analysis of nordic calculator features. J. Clean. Prod. 2019, 207, 658–666. [Google Scholar] [CrossRef]
  8. Birnik, A. An evidence-based assessment of online carbon calculators. Int. J. Greenh. Gas Control 2013, 17, 280–293. [Google Scholar] [CrossRef]
  9. Mulrow, J.; Machaj, K.; Deanes, J.; Derrible, S. The state of carbon footprint calculators: An evaluation of calculator design and user interaction features. Sustain. Prod. Consum. 2019, 18, 33–40. [Google Scholar] [CrossRef]
  10. Gram-Hanssen, K.; Christensen, T.H. Carbon calculators as a tool for a low-carbon everyday life? Sustain. Sci. Prac. Policy 2012, 8, 19–30. [Google Scholar] [CrossRef] [Green Version]
  11. Büchs, M.; Bahaj, A.S.; Blunden, L.; Bourikas, L.; Falkingham, J.; James, P.; Kamanda, M.; Wu, Y. Promoting low carbon behaviours through personalised information? Long-term evaluation of a carbon calculator interview. Energy Policy 2018, 120, 284–293. [Google Scholar] [CrossRef]
  12. Mallett, R.K.; Melchiori, K.J.; Strickroth, T. Self-confrontation via a carbon footprint calculator increases guilt and support for a proenvironmental group. Ecopsychology 2013, 5, 9–16. [Google Scholar] [CrossRef]
  13. Shirley, R.; Jones, C.; Kammen, D. A household carbon footprint calculator for islands: Case study of the united states virgin islands. Ecol. Econ. 2012, 80, 8–14. [Google Scholar] [CrossRef] [Green Version]
  14. Pandey, D.; Agrawal, M.; Pandey, J.S. Carbon footprint: Current methods of estimation. Environ. Monit. Assess. 2013, 178, 135–160. [Google Scholar] [CrossRef] [PubMed]
  15. Weidema, B.P.; Thrane, M.; Christensen, P.; Schmidt, J.; Løkke, S. Carbon footprint. J. Ind. Ecol. 2008, 12, 3–6. [Google Scholar] [CrossRef]
  16. Padgett, J.P.; Steinemann, A.C.; Clarke, J.H.; Vandenbergh, M.P. A comparison of carbon calculators. Environ. Impact Assess. Rev. 2008, 28, 106–115. [Google Scholar] [CrossRef]
  17. Kenny, T.; Gray, N. Comparative performance of six carbon footprint models for use in ireland. Environ. Impact Assess. Rev. 2009, 29, 1–6. [Google Scholar] [CrossRef]
  18. Rahman, F.; O’Brien, C.; Ahamed, S.I.; Zhang, H.; Liu, L. Design and implementation of an open framework for ubiquitous carbon footprint calculator applications. Sustain. Comput. Inform. Syst. 2011, 1, 257–274. [Google Scholar] [CrossRef]
  19. Kim, B.; Neff, R. Measurement and communication of greenhouse gas emissions from us food consumption via carbon calculators. Ecol. Econ. 2009, 69, 186–196. [Google Scholar] [CrossRef]
  20. Salo, M.; Mattinen, M.K. Carbon Footprint Calculators for Citizens: Recommendations and Implications in the Nordic Context; Nordic Countil of Ministers: Copenhagen, Denmark, 2017. [Google Scholar]
  21. Clayton, S.; Myers, G. Conservation Psychology: Understanding and Promoting Human Care for Nature; John Wiley & Sons: Chichester, UK, 2015. [Google Scholar]
  22. Hill, N.; Bonifazi, E.; Bramwell, R.; Karagianni, E.; Harris, B. 2018 Government GHG Conversion Factors for Company Reporting. Methodology Paper for Emission Factors: Final Report; Department for Business Energy & Industrial Strategy. UK Government: London, UK, 2018; p. 141.
  23. Biørn-Hansen, A. Evaluation of a Carbon Calculator: Challenges and Opportunities with Calculating Emissions from Consumption Behaviour. Master’s Thesis, University of Gothenburg, Gothenburg, Sweden, 2019. [Google Scholar]
  24. West, S.E.; Owen, A.; Axelsson, K.; West, C.D. Evaluating the use of a carbon footprint calculator: Communicating impacts of consumption at household level and exploring mitigation options. J. Ind. Ecol. 2016, 20, 396–409. [Google Scholar] [CrossRef] [Green Version]
  25. Myhre, G.; Shindell, D.; Bréon, F.; Collins, W.; Fuglestvedt, J.; Huang, J.; Koch, D.; Lamarque, J.; Lee, D.; Mendoza, B. Anthropogenic and natural radiative forcing. In Climate Change 2013: The Physical Science Basis; Contribution of Working Group i to the Fifth Assessment Report of the Intergovernmental Panel on Climate Change; Cambridge University Press: Cambridge, UK, 2013; pp. 659–740. [Google Scholar]
  26. ADEME. Agribalyse Program; French Environment & Energy Management Agency: Angers, France, 2018.
  27. MFVM. Carbon Footprint Data; The Danish Ministry of Food, Agriculture and Fisheries: Copenhagen, Denmark, 2009.
  28. Chuvieco, E.; Burgui, M.; Carrero, I.; Díaz, E.; Labajo, V.; Valor, C.; López, R. Cálculo y Etiquetado de la Huella de Carbono en Productos Alimentarios; Catedra de Etica Ambiental FTPGB-UAH: Alcala de Henares, Spain, 2018; p. 36. [Google Scholar]
  29. Zafeiridou, M.; Hopkins, N.S.; Voulvoulis, N. Cigarette smoking: An assessment of tobacco’s global environmental footprint acrossits entire supply chain. Environ. Sci. Technol. 2018, 52, 8087–8094. [Google Scholar] [CrossRef]
  30. ICAO. Carbon Emissions Calculator; International Civil Aviation Organization: Montreal, QC, Canada, 2016. [Google Scholar]
  31. IDAE. Estudios, Informes y Estadísticas; Instituto para la Diversificación y Ahorro de la Energía. Ministerio para la Transición Ecológica: Madrid, Spain, 2017.
  32. Peters, J.F.; Baumann, M.; Zimmermann, B.; Braun, J.; Weil, M. The environmental impact of li-ion batteries and the role of key parameters—A review. Renew. Sustain. Energy Rev. 2017, 67, 491–506. [Google Scholar] [CrossRef]
  33. MITECO. Herramientas Para el Cálculo de la Huella de Carbono; Ministerio para la Transición Ecológica. Gobierno de Espana: Madrid, Spain, 2018.
  34. OCCC. Guía Práctica Para el Cálculo de Emisiones de Gases de Efecto Invernadero; Oficina Catalana del Cambio Climatico: Barcelona, Spain, 2020; p. 127. [Google Scholar]
  35. Cheah, L.; Duque Ciceri, N.; Olivetti, E.; Matsumura, S.; Forterre, D.; Roth, R.; Kirchain, R. Manufacturing-focused emissions reductions in footwear production. J. Clean. Prod. 2013, 44, 18–29. [Google Scholar] [CrossRef] [Green Version]
  36. INESCOOP. Footwear Carbon Footprint; INESCOOP Center for Technology and Innovation: Elda, Spain, 2017; p. 59. [Google Scholar]
  37. Munasinghe, M.; Jayasinghe, P.; Ralapanawe, V.; Gajanayake, A. Supply/value chain analysis of carbon and energy footprint of garment manufacturing in sri lanka. Sustain. Prod. Consum. 2016, 5, 51–64. [Google Scholar] [CrossRef]
  38. Rivera Muñoz, Z. Water, Energy and Carbon Footprints of a Pair of Leather Shoes; KTH Royal Institute of Technology: Stockholm, Sweden, 2013. [Google Scholar]
  39. Kirchain, R.; Olivetti, E.; Miller, T.R.; Greene, S. Sustainable Apparel Materials; Massachusetts Institute of Technology: Cambridge, MA, USA, 2015; p. 34. [Google Scholar]
  40. Koehler, A.; Wildbolz, C. Comparing the environmental footprints of home-care and personal-hygiene products: The relevanceof different life-cycle phases. Environ. Sci. Technol. 2009, 43, 8643–8651. [Google Scholar] [CrossRef] [PubMed]
  41. Francke, I.C.M.; Castro, J.F.W. Carbon and water footprint analysis of a soap bar produced in brazil by natura cosmetics. Water Resour. Ind. 2013, 1–2, 37–48. [Google Scholar] [CrossRef] [Green Version]
  42. Weir, C.S. In the Red: A Private Economic Cost and Qualitative Analysis of Environmental and Health Implications for Five Menstrual Products; Dalhousie University: Halifax, NS, Canada, 2015. [Google Scholar]
  43. CoClear. Global Publicly Disclosed Product Carbon Footprints; CoClear: Sydney, Australia, 2019. [Google Scholar]
  44. Gemechu, E.D.; Butnar, I.; Gomà-Camps, J.; Pons, A.; Castells, F. A comparison of the ghg emissions caused by manufacturing tissue paper from virgin pulp or recycled waste paper. Int. J. Life Cycle Assess. 2013, 18, 1618–1628. [Google Scholar] [CrossRef]
  45. Carbon Trust. Product Carbon Footprinting: The New Business Opportunity; UK Government: London, UK, 2008; p. 36.
  46. Belkhir, L.; Elmeligi, A. Assessing ict global emissions footprint: Trends to 2040 & recommendations. J. Clean. Prod. 2018, 177, 448–463. [Google Scholar]
  47. Kalmykova, Y.; Patrício, J.; Rosado, L.; Berg, P.E. Out with the old, out with the new—The effect of transitions in tvs and monitors technology on consumption and weee generation in sweden 1996–2014. Waste Manag. 2015, 46, 511–522. [Google Scholar] [CrossRef] [Green Version]
  48. Sikdar, B. A study of the environmental impact of wired andwireless local area network access. IEEE Trans. Consum. Electron. 2013, 59, 85–92. [Google Scholar] [CrossRef]
  49. Martens, P.; Su, B.; Deblomme, S. The ecological paw print of companion dogs and cats. BioScience 2019, 69, 467–474. [Google Scholar] [CrossRef] [Green Version]
  50. Su, B.; Martens, P. Environmental impacts of food consumption by companion dogs and cats in Japan. Ecol. Indic. 2018, 93, 1043–1049. [Google Scholar] [CrossRef]
  51. Su, B.; Martens, P.; Enders-Slegers, M.-J. A neglected predictor of environmental damage: The ecological paw print and carbon emissions of food consumption by companion dogs and cats in China. J. Clean. Prod. 2018, 194, 1–11. [Google Scholar] [CrossRef]
  52. Myhre, G.; Shindell, D.; Bréon, F.-M.; Collins, W.; Fuglestvedt, J.; Huang, J.; Koch, D.; Lamarque, J.-F.; Lee, D.; Mendoza, B. Anthropogenic and natural radiative forcing. Clim. Chang. 2013, 423, 658–740. [Google Scholar]
  53. Lin, S.-M. Identify predictors of university students’ continuance intention to use online carbon footprint calculator. Behav. Inf. Technol. 2017, 36, 294–311. [Google Scholar] [CrossRef]
  54. Bhattacherjee, A. Understanding information systems continuance: An expectation-confirmation model. MIS Q. 2001, 25, 351–370. [Google Scholar] [CrossRef]
  55. Koo, C.; Chung, N.; Nam, K. Assessing the impact of intrinsic and extrinsic motivators on smart green it device use: Reference group perspectives. Int. J. Inf. Manag. 2015, 35, 64–79. [Google Scholar] [CrossRef]
  56. Edstrand, E. Making the invisible visible: How students make use of carbon footprint calculator in environmental education. Learn. Med. Technol. 2016, 41, 416–436. [Google Scholar] [CrossRef]
Figure 1. Interactions between the processes and requirements established in the CO2 observatory.
Sustainability 12 06529 g001
Figure 2. Frontpage of the Observatory.
Sustainability 12 06529 g002
Figure 3. Sections in the carbon footprint calculator (CFC).
Sustainability 12 06529 g003
Table 1. Target user requirements and solutions implemented [7,9,19,24].
RequirementTargetImplemented
InformationScience-basedAll references included proceed from peer-reviewed papers and official institutions.
Scientific basis of climate change, the calculation of CF and life cycle analysis are included.
ContentCorrect equilibrium between comprehensiveness and parsimonyThe main sectors of consumption were included: transport (airplane, train, car, bus), food (all categories), clothing, computers and home appliances, cleaning and beauty products, tobacco, pets).
TraceabilityAll data properly referencedData were obtained from peer-reviewed papers or databases from reference institutions (National Electrical Grid system, for instance).
Each emission data is linked to its source using a hyperlink.
The section “additional information” includes the complete list of references.
InteractivityInteraction with the userAll tables can be ordered according to the user’s preference criteria (type of product, origin, number of emissions, etc.), so that the differences can be easily observed.
UsabilityEasy access and operationNavigation is minimized to facilitate access to all submenus. Icons were designed to facilitate navigation of people with reduced visibility and functional diversity.
The whole content was also adapted to the different devices and operating systems available.
Attractive designGood estheticDesign an original logo and icons.
Warm colors and fonts for the website.
AwarenessMake the user realize the importance of climate change and individual acts.Comparisons of personal CF with people from the same cohort.
Individual suggestions based on departure from average emissions of the same cohort
Behavior change orientedFacilitate changing habitsEstablishment of comparisons between emissions associated with different activities.
The CFC includes comparing the user’s CF with other people with similar characteristics.
The CFC report includes personalized recommendations.
SupportEasy to introduce user suggestionsContact link, user questionnaire
DisseminationOpen to ordinary citizens, no specialized audiences.The observatory has been referenced in Newspapers and dedicated media, as well as in national and local radio.
Two videos of the site were produced (2 m version to be permanently exposed on the website, and a 20 s version to be distributed by social networks.
FeedbackCollect user’s opinion and suggestions to improve.A brief questionnaire was added once the calculation results were obtained and also in the “contact” section.
Table 2. Technical requirements and compliance.
RequirementCompliance
1.
Express all emissions data in CO2 equivalent (CO2e)
Yes
2.
Base conversions to carbon dioxide equivalents on 100-year GWP conversion factors.
Yes, following Myhre et al. [52].
3.
Base calculations on up-to-date emission factors whenever possible.
Average emission of the Spanish electrical system was obtained from 2018
4.
Provide a comprehensive footprint including allocating emissions for a variety of consumption categories.
Outputs indicated total emissions as well as those derived from food, transport, clothing, pets, etc.
5.
Adjust for the number of people living in a household in the correspondent topics.
Yes
6.
Allow users to estimate their housing emissions in detail.
Yes
7.
Allow users to model their food related emissions in detail.
Yes
8.
Allow users to model their transportation related emissions in detail.
Yes
9.
Permit manual data entry (to get accuracy in calculations) but giving orientations to avoid illogical results.
Yes
10.
Offer both aggregated and detailed results.
Yes, outputs are downloadable in both pdf and excel format
11.
Allow comparisons with several control factors beyond income level.
Yes. Age, Educational level, Size of urban area, sex, profession
12.
Offer personalized recommendations based on each user’s results.
Yes

