Transformation of Urban Surfaces and Heat Islands in Nanjing during 1984–2018

Abstract
1. Introduction
2. Literature Review
3. Methodology
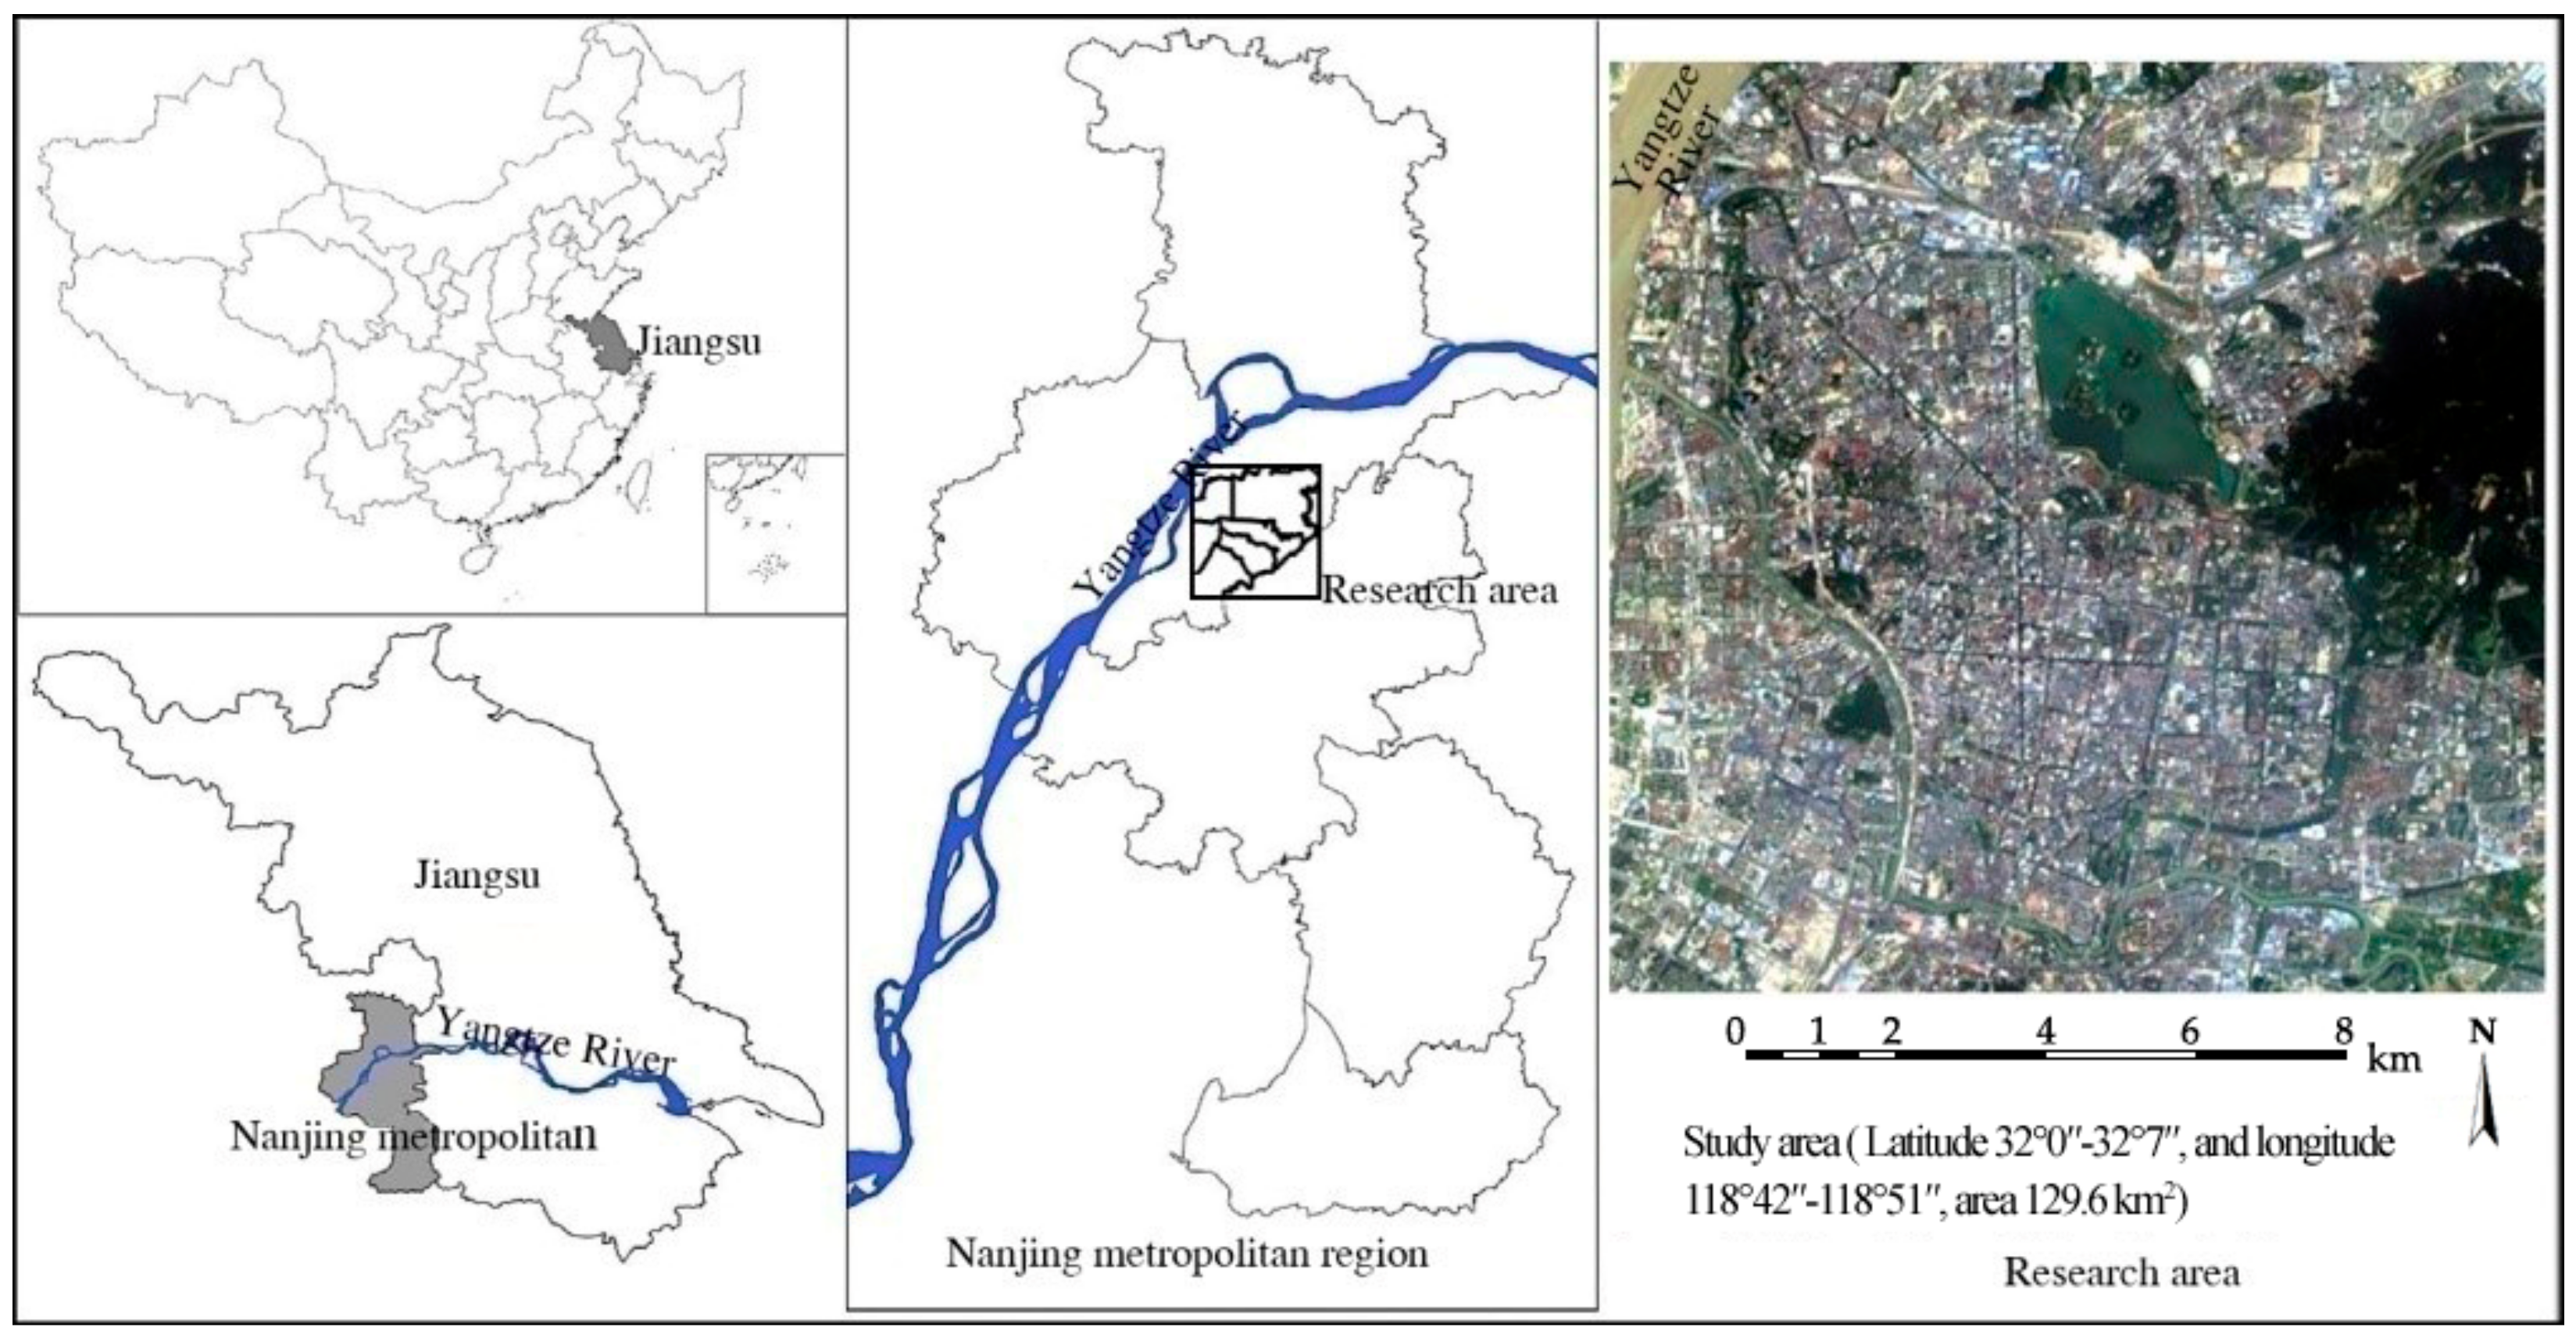
3.1. Data Sources
3.2. The City of Nanjing and Data Selection
3.3. Classification of Urban Underlying Surfaces
3.4. Retrieval of Urban Surface Temperature
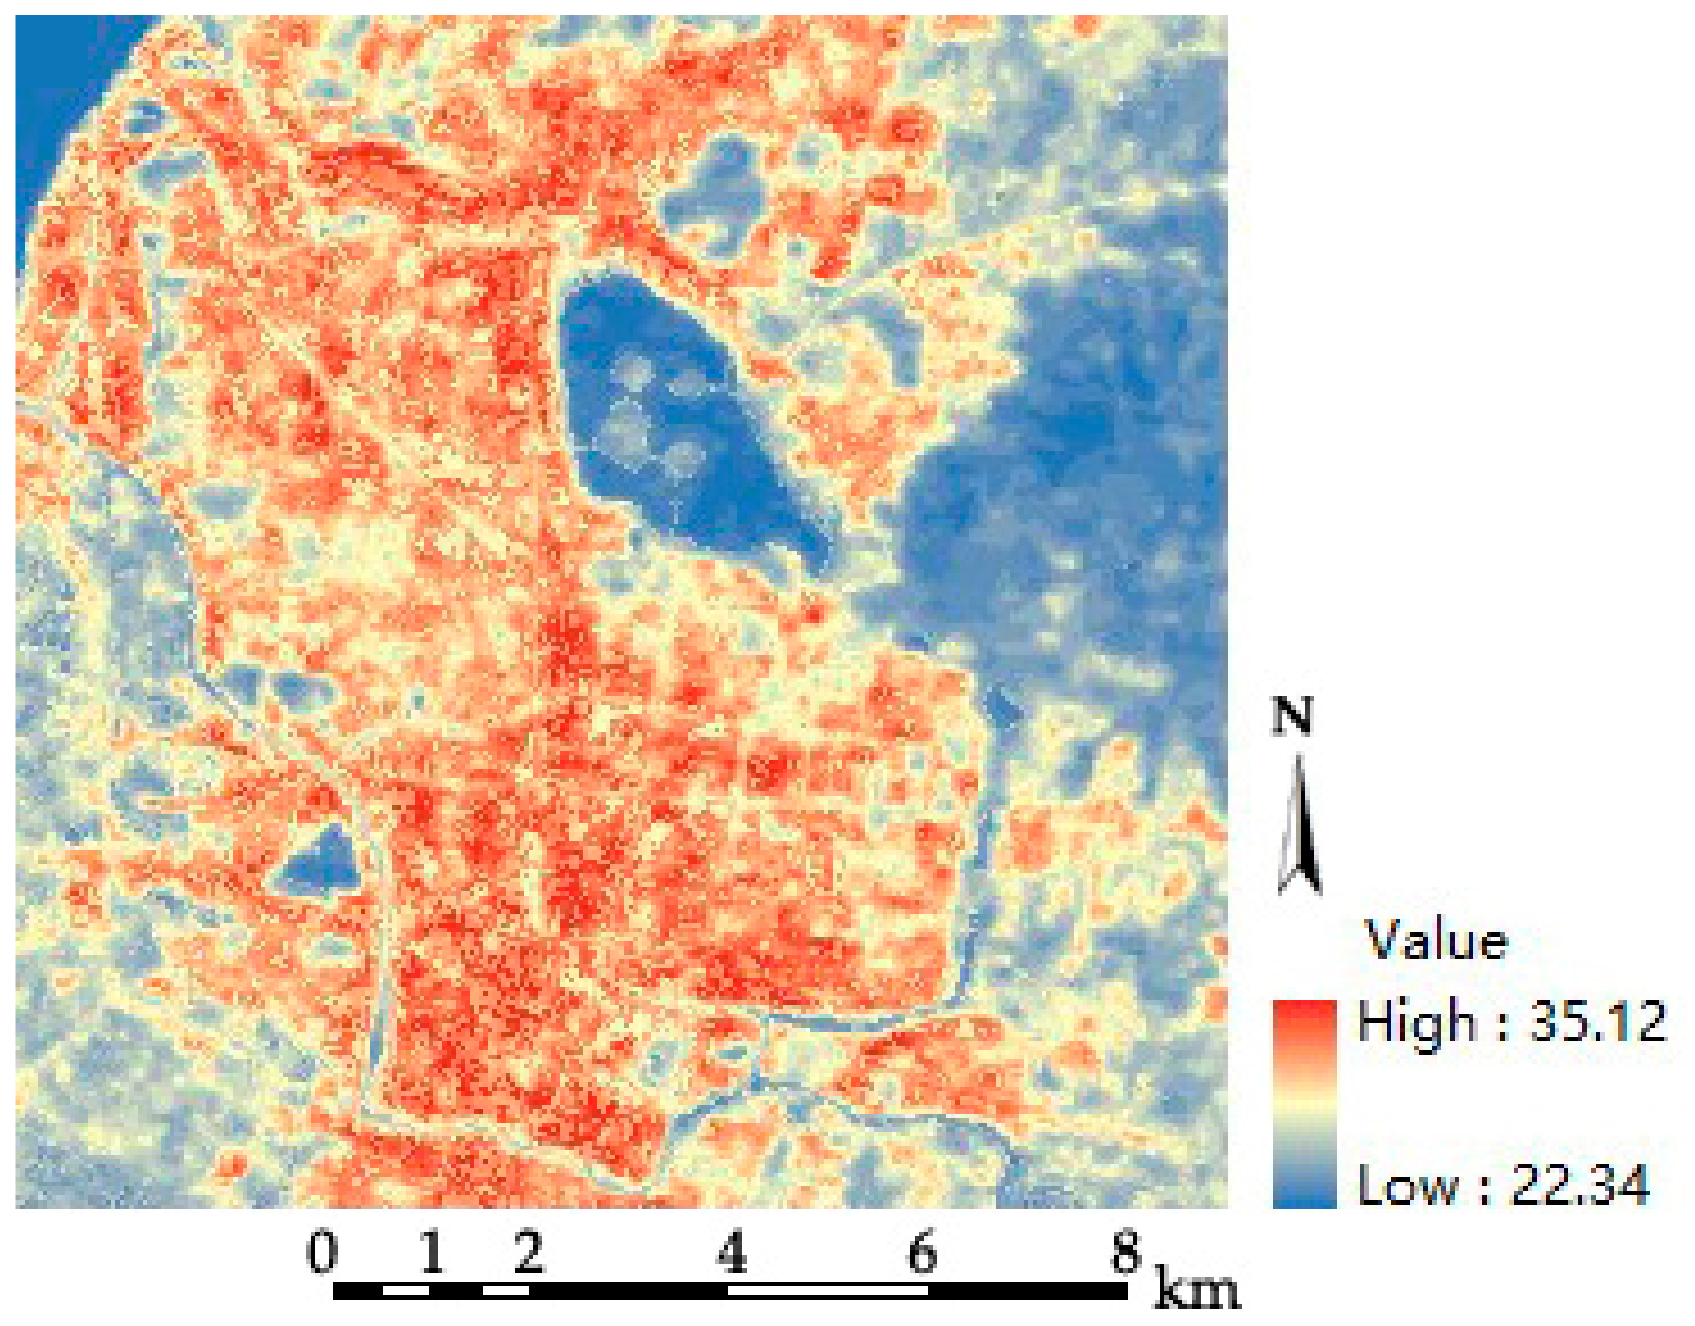
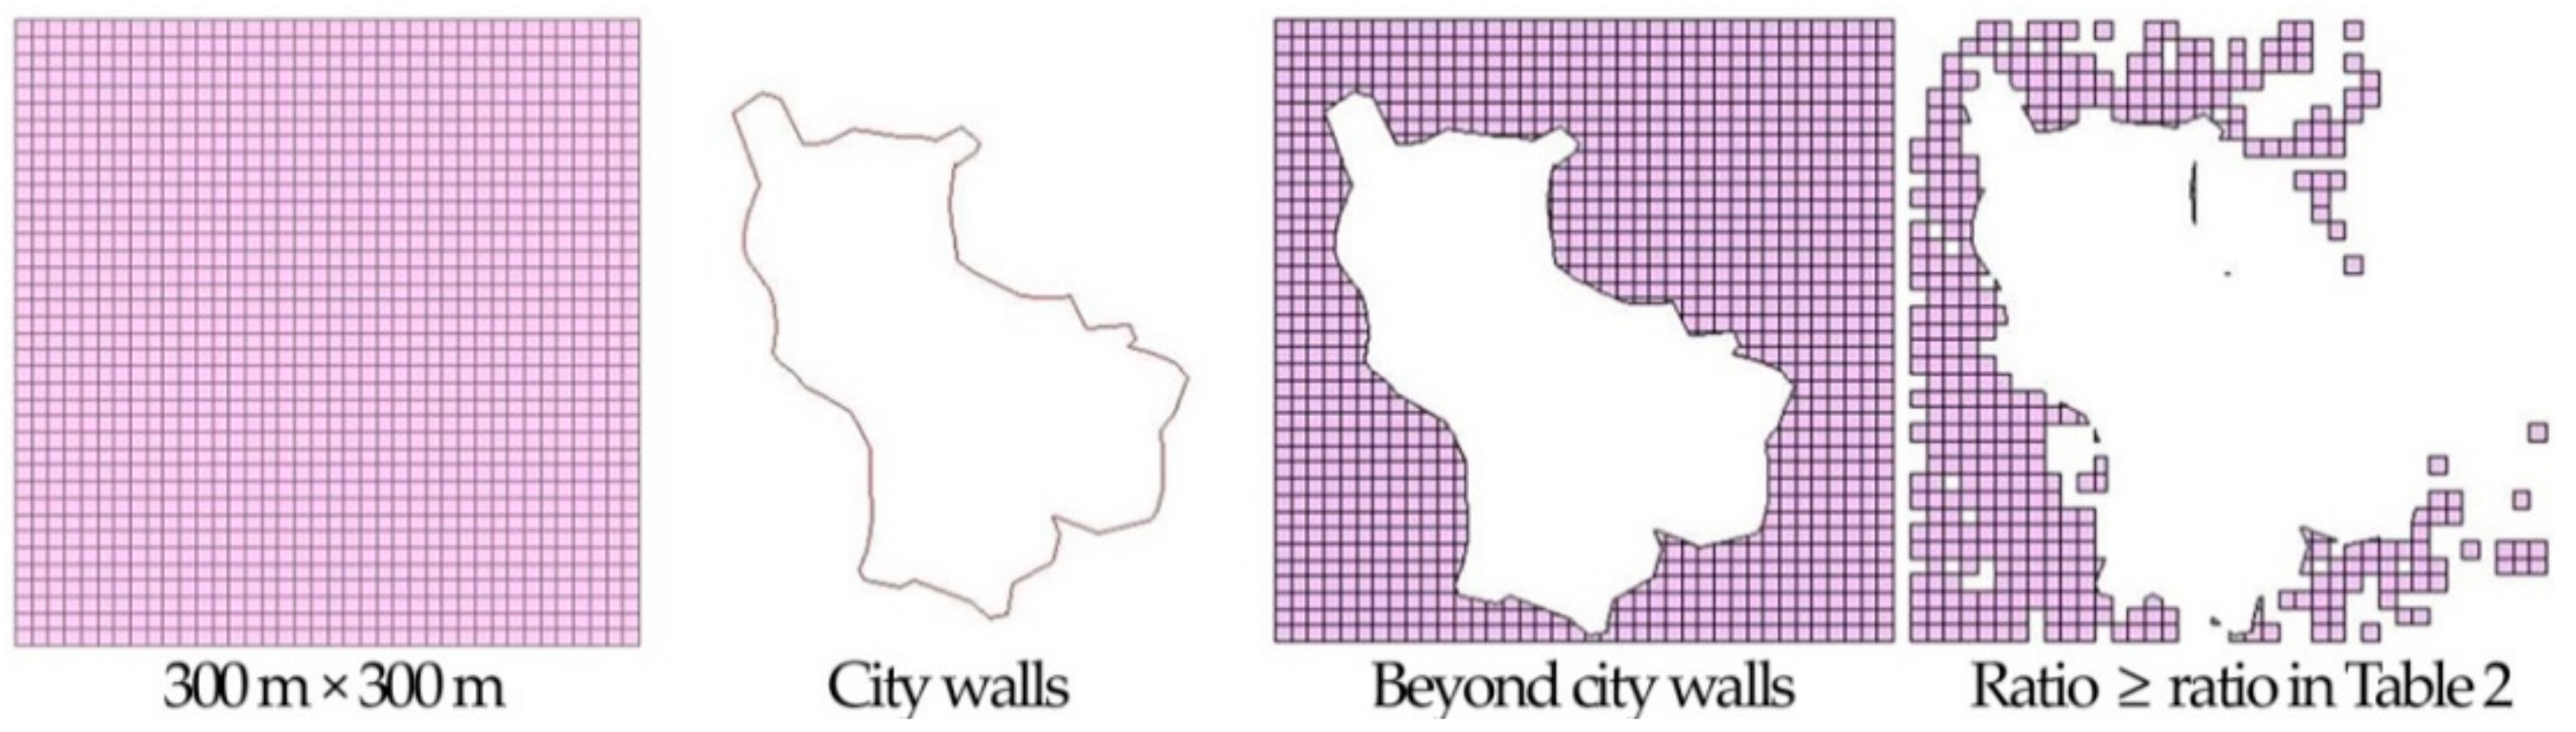
3.5. Determination of Urban and Rural Areas
3.6. Urban Heat Island Effect Calculation
4. Results, Analysis, and Discussion
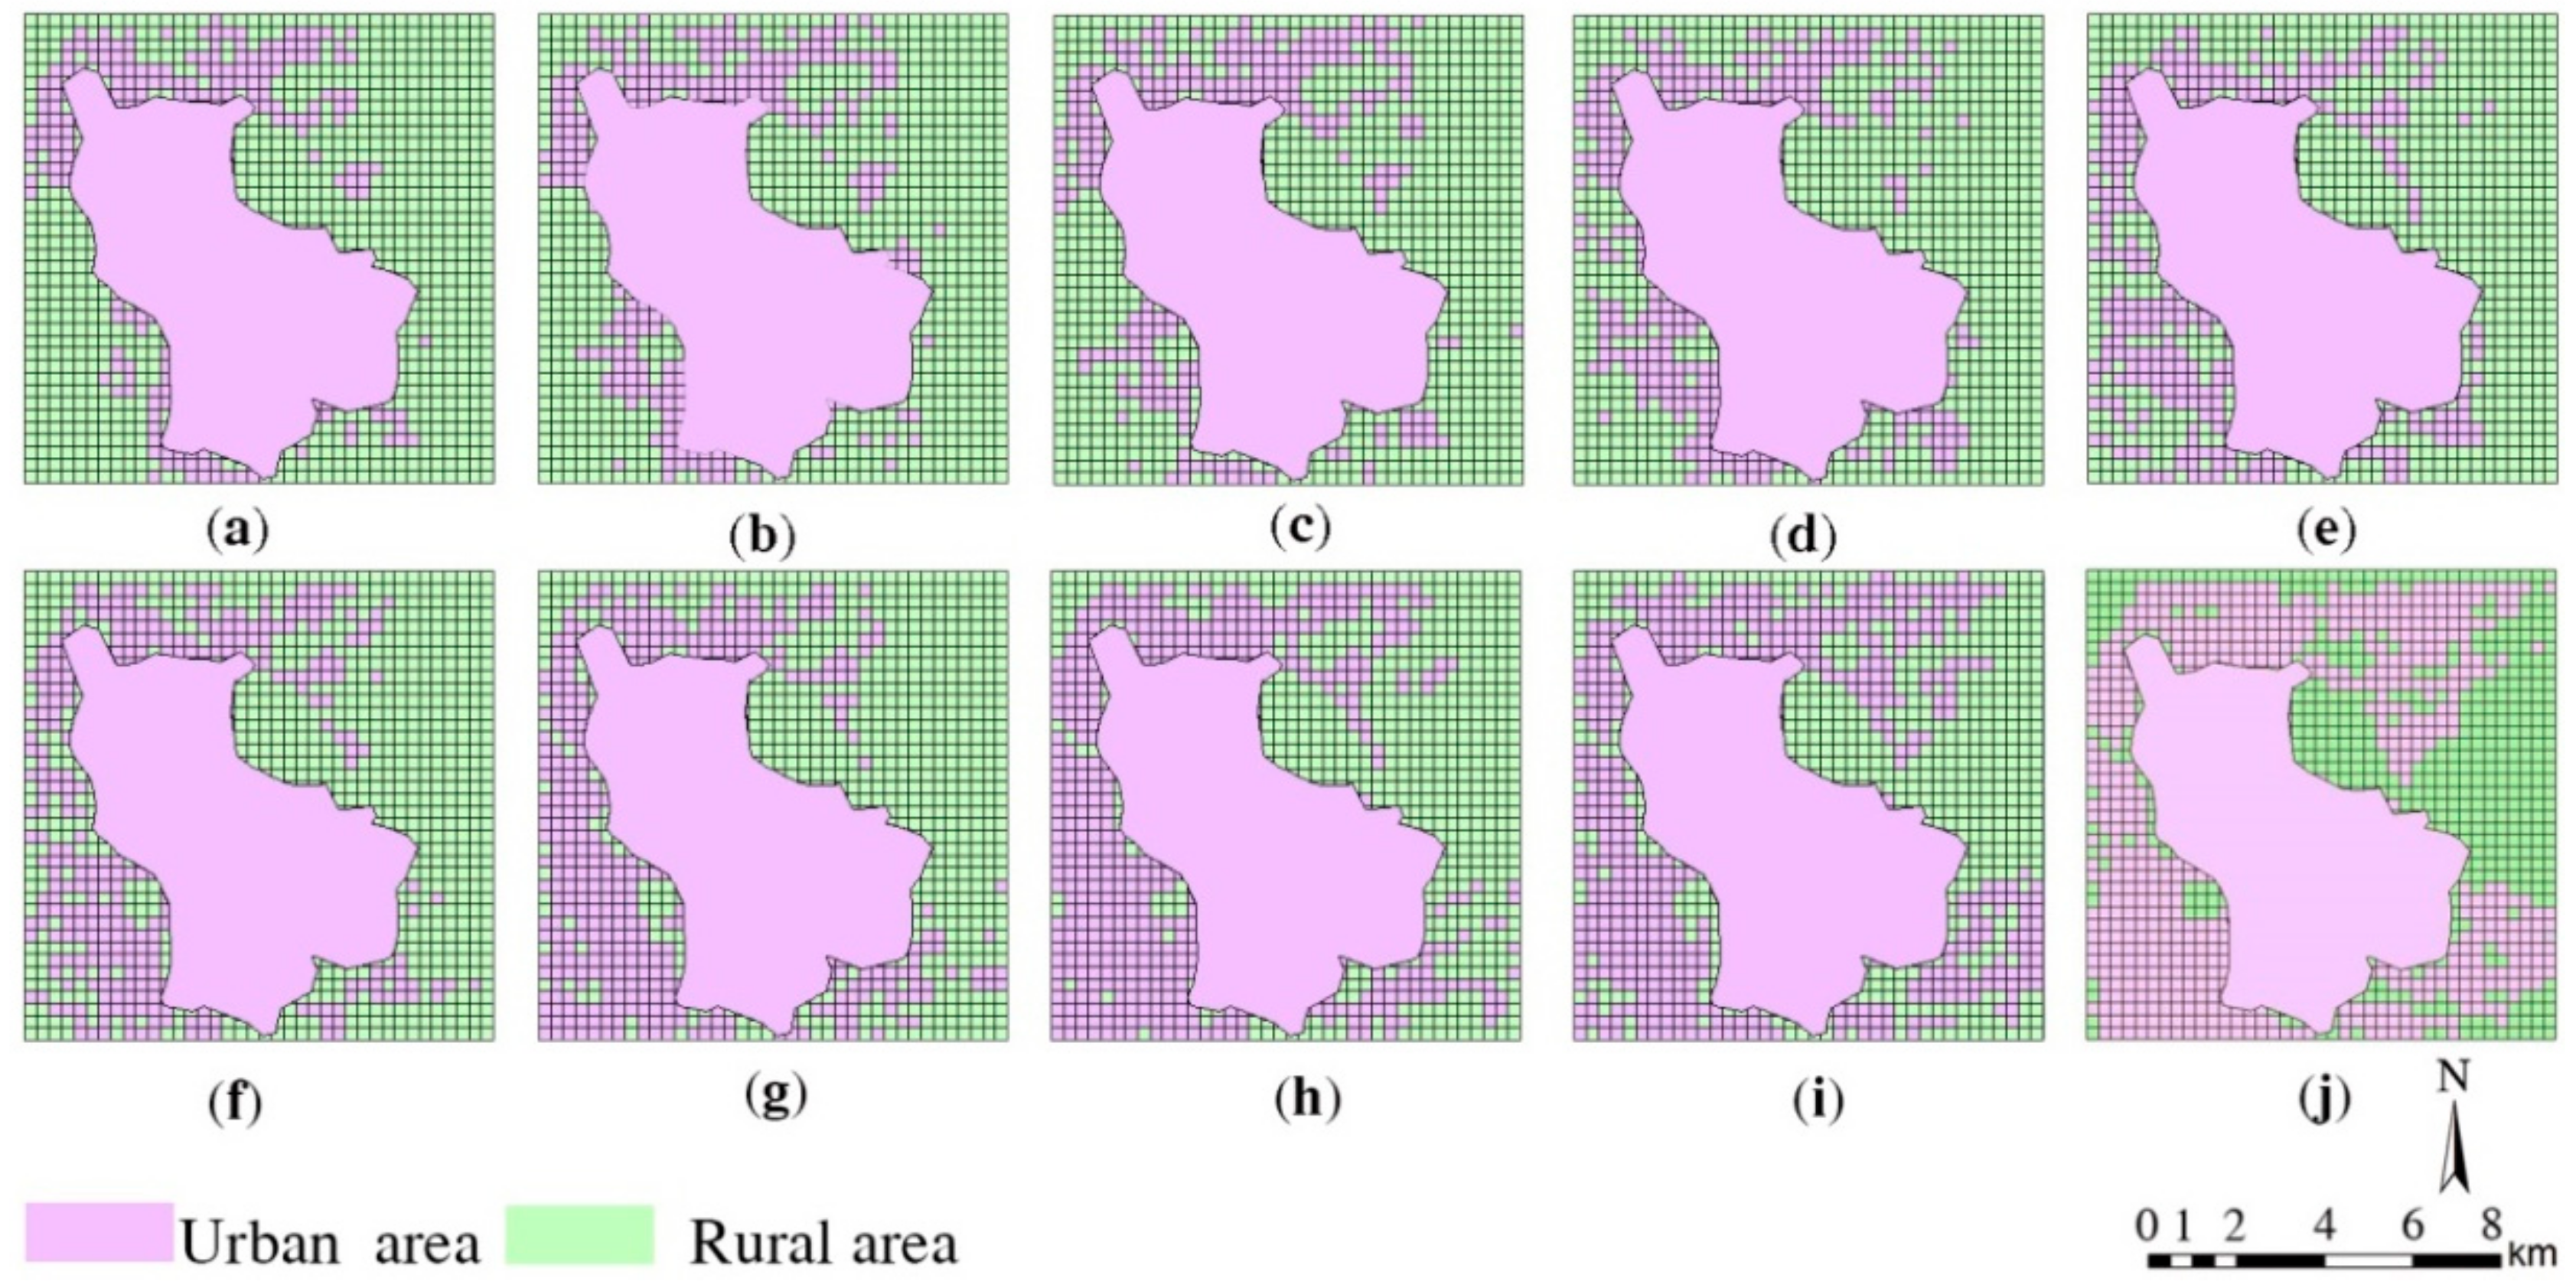
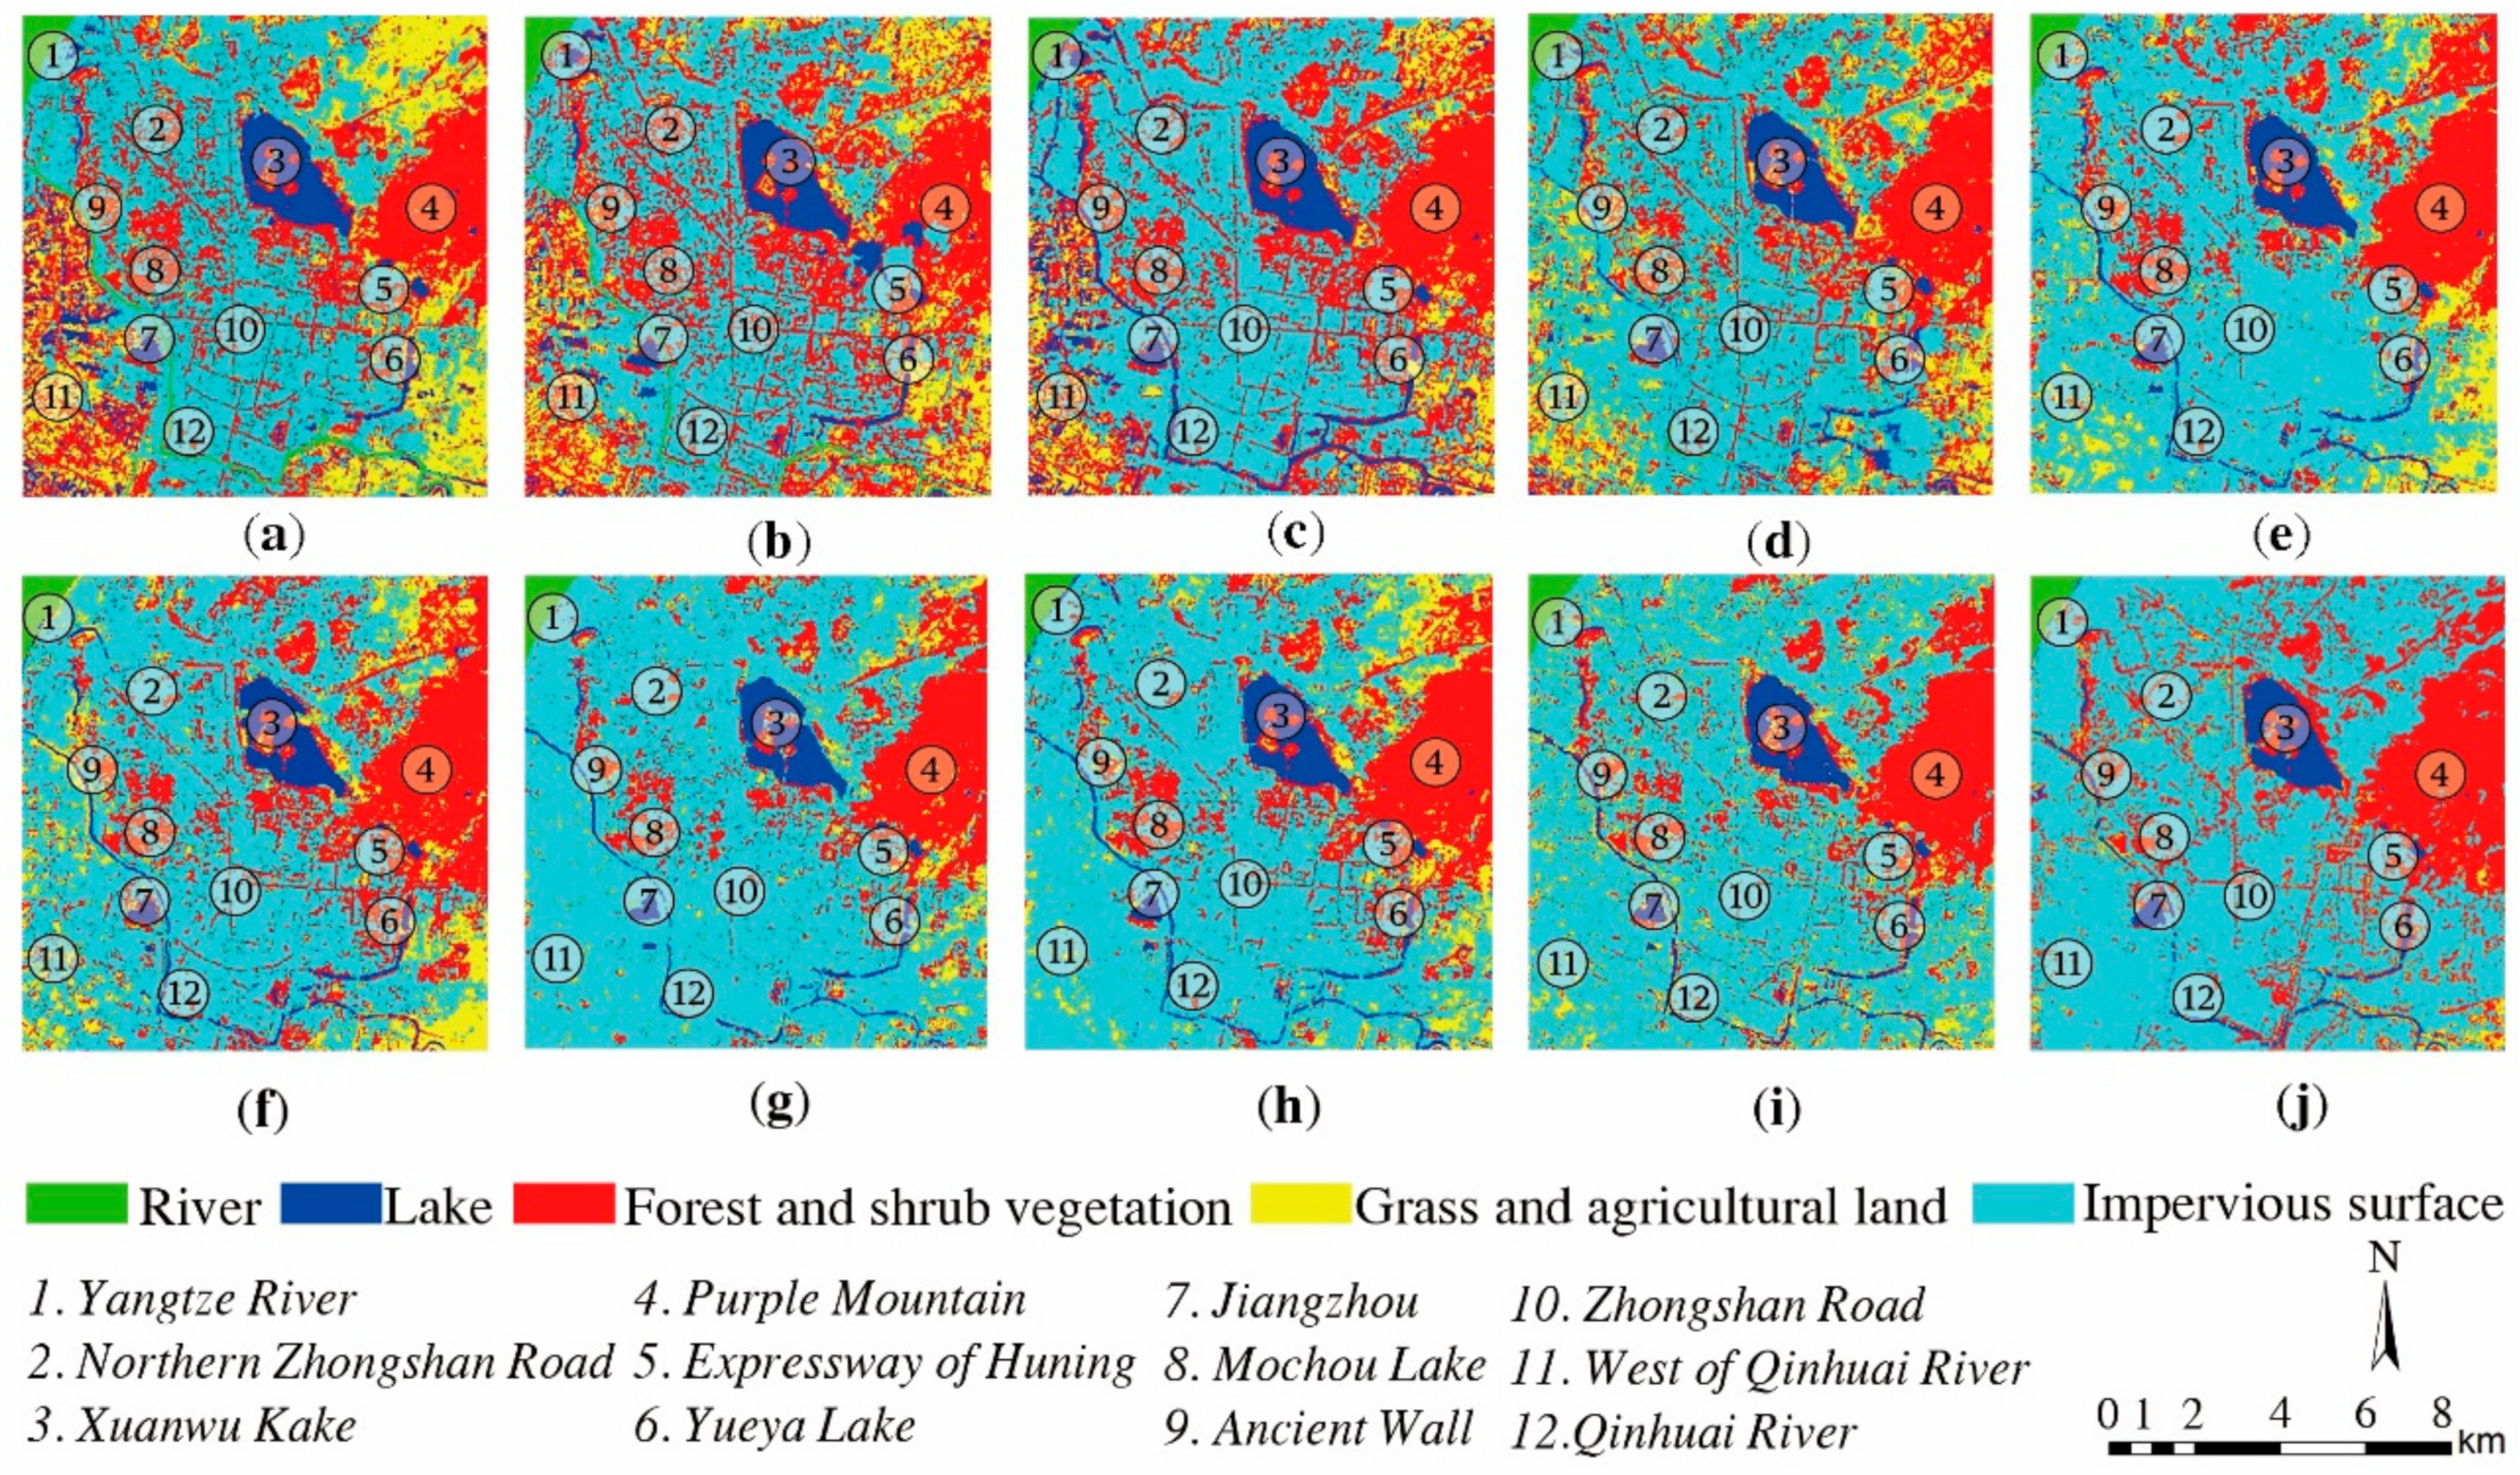
4.1. The General Pattern of Historical Changes of Nanjing’s Urban Underlying Surface in the Last 30 Years
- (1)
- From 1984 to 1990, the extension of Nanjing’s impervious surface was mainly concentrated within the ancient city walls, with the characteristic lapping development and “filling the blanks in turn” [6], and the spatial growth mostly extended eastward along the Zhongshan Road and northward along the North Zhongshan Road, as shown in Figure 5a–c. The area of trees and shrubs reduced dramatically in the Purple Mountain region.
- (2)
- From 1990 to 2001, the urban areas of Nanjing began to extend towards the outskirts of the ancient city. The urban canopy veins formed by roadside trees along South Zhongshan Road, Zhongshan Road and North Zhongshan Road within the old city became increasingly clear, as shown in Figure 5d–f. In the southwest direction, namely, the region to the west of Qinhuai River, large-scale construction was focused on areas from Jiangdong Gate to Jiangzhou. The region to the west of the Qinhuai River was one of the primary new areas of Nanjing’s urban construction. From 1984 to 2001, the green and farmland area in west-river region dropped dramatically and was replaced by impervious surfaces in a large scale.
- (3)
- From 2001 to 2013, there were still patches of trees and shrubs in the southern region of Xuanwu Lake and the western region of Yue-ya Lake in 2001. In the following 13 years, the area of green surfaces reduced, while the area of impervious surfaces increased, as shown in Figure 5g–j. The urban areas of Nanjing were continuously under eastward development along the Shanghai–Nanjing Highway.
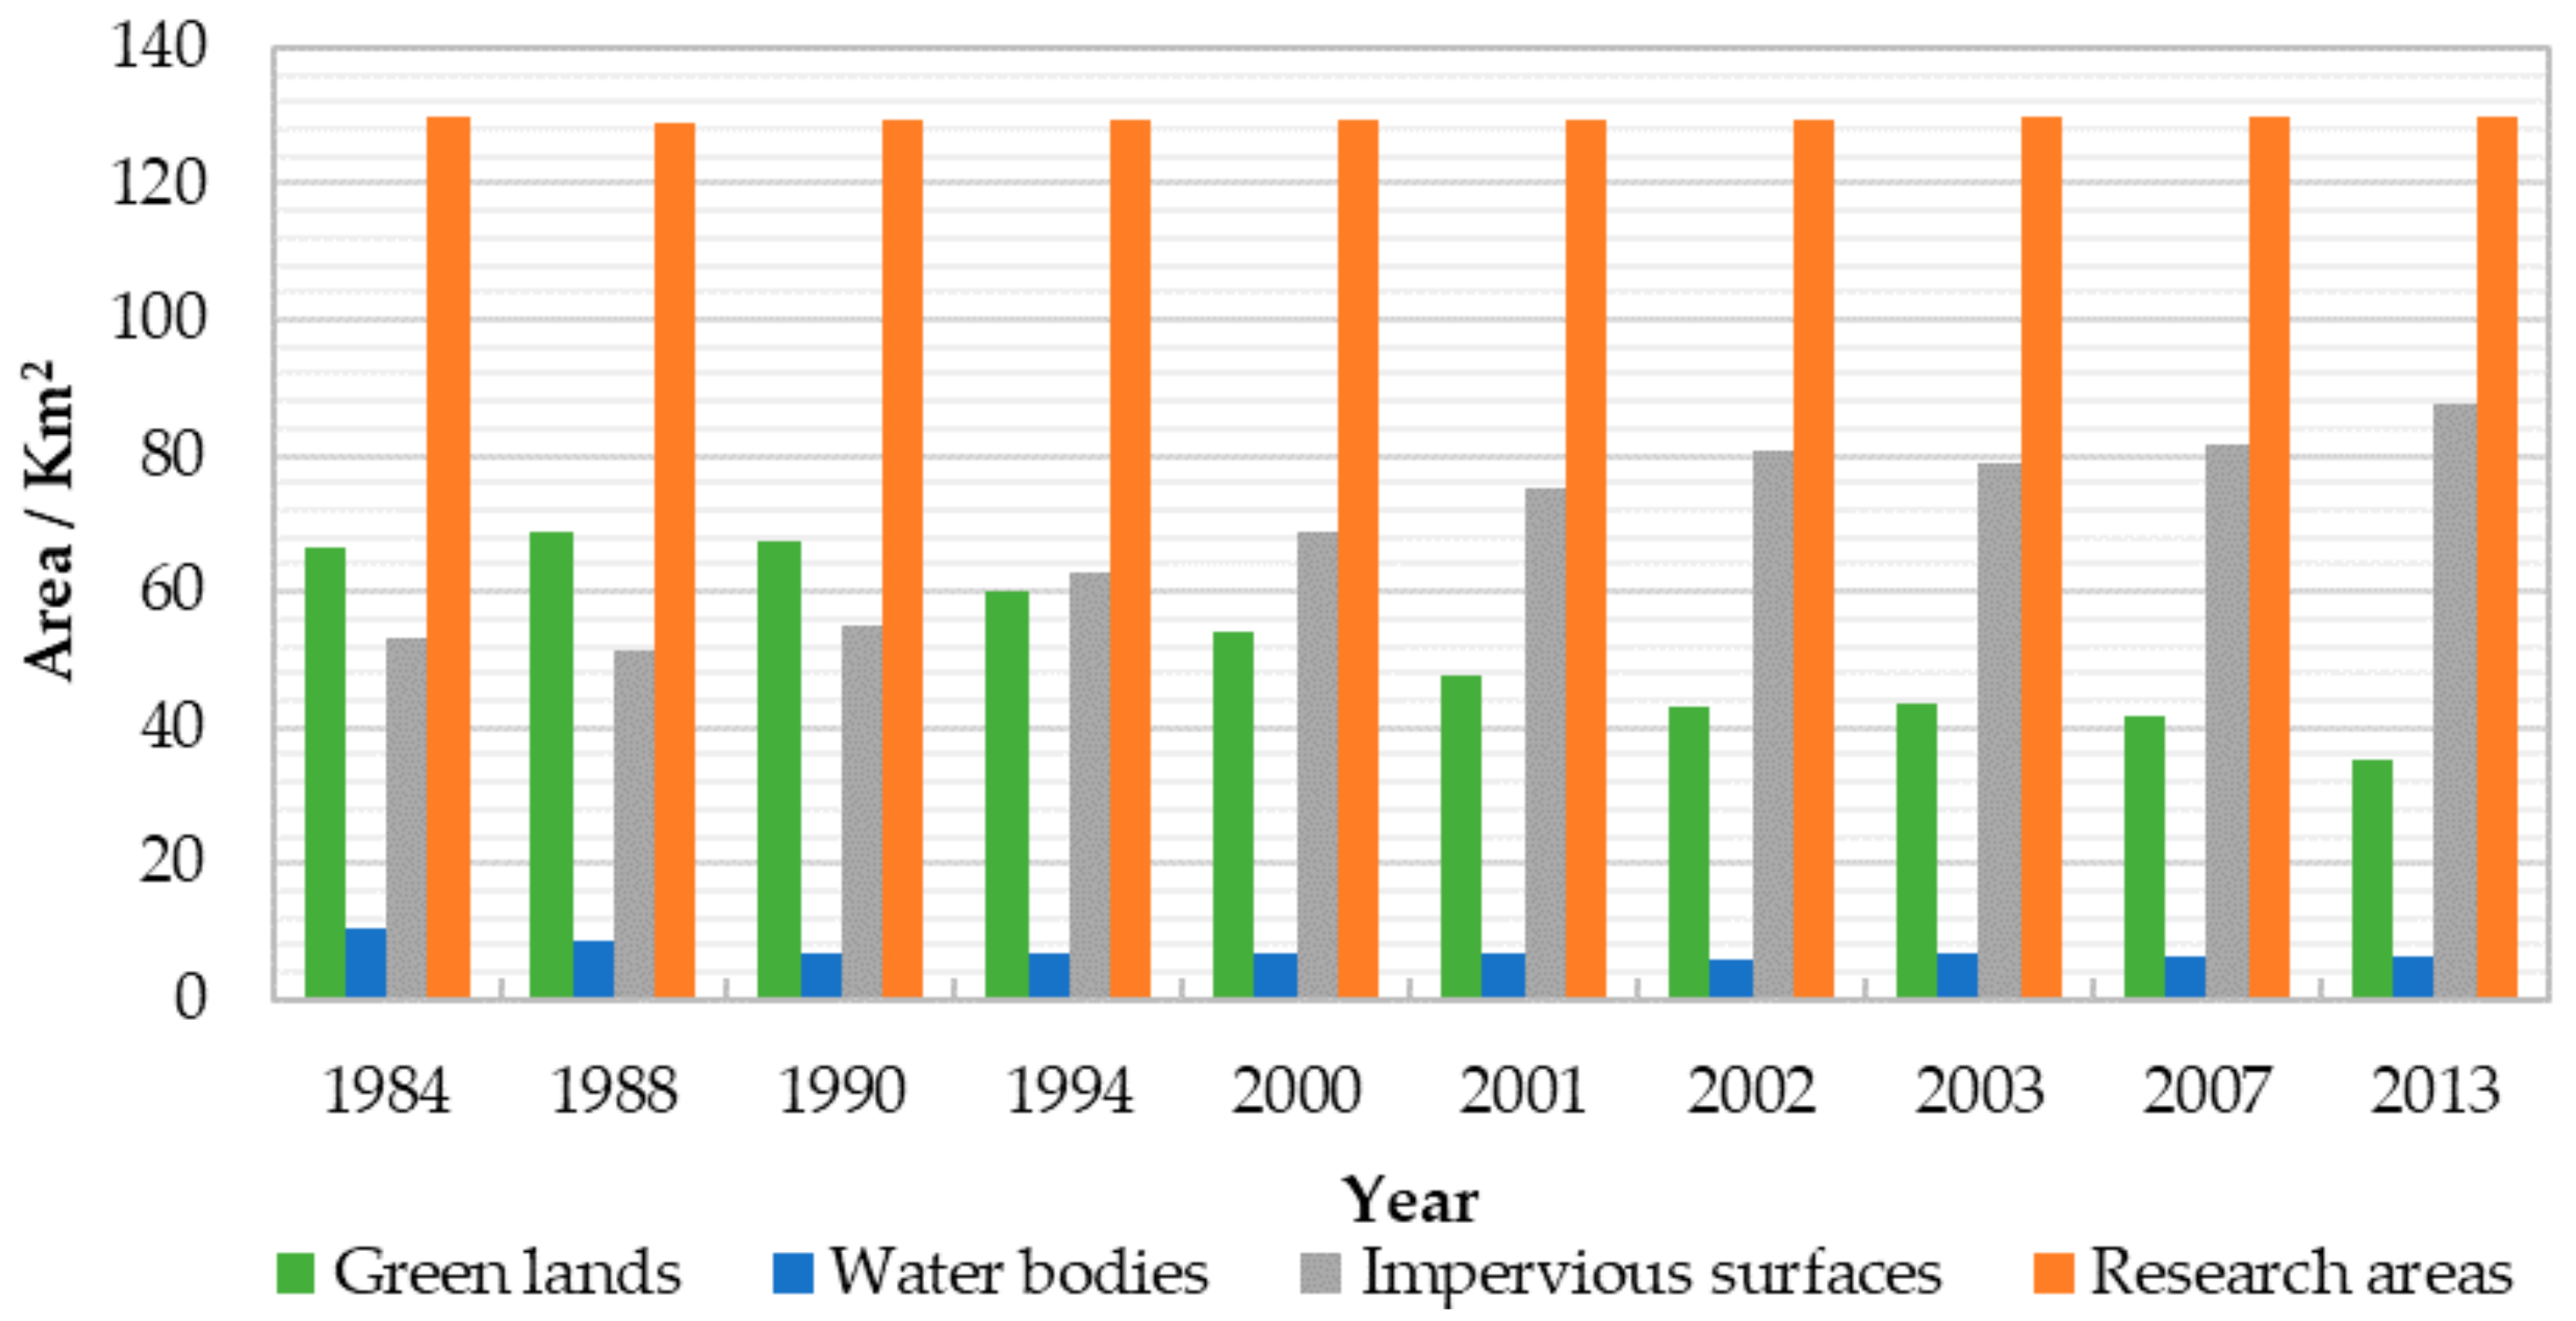
4.2. Quantitative Analysis on the Change Pattern of Different Underlying Surface Types
- (1)
- Quantitative analysis on green surface changes. From 1984 to 2013, due to the expansion of urban areas, the area of green surfaces in Nanjing reduced year by year gradually and dropped from what was 66.4 km2 in 1984 to 35.5 km2 in 2013. The ratio of green surfaces decreased by 23.83%.
- (2)
- Quantitative analysis on water surfaces. From 1984 to 1990, the area of water surfaces in Nanjing experienced a 3.4 km2 decline. Between 1990 and 2001, a 0.1 km2 increase was seen. Between 2001 and 2007 a 0.5 km2 decline was seen. From this data, it can be found that the change range of water surfaces area in Nanjing was no larger than 4.2 km2 at any point in time between 1984 and 2013. After analyzing the area of water surface in Nanjing from 1984 to 2013, it can be concluded that the area of water surface in the analysis region basically remained unchanged.
- (3)
- Quantitative analysis on impervious surfaces. From 1984 to 2013, the area of impervious surfaces in Nanjing witnessed a year-by-year growth, with a 2.1 km2 increase from 1984 to 1990, a 20.0 km2 increase from 1990 to 2001 and a 12.6 km2 increase from 2001 to 2013. In the almost 30 years between 1984 and 2013, the area of impervious surfaces increased by 34.7 km2, and the ratio of impervious surfaces increased by 26.76%.
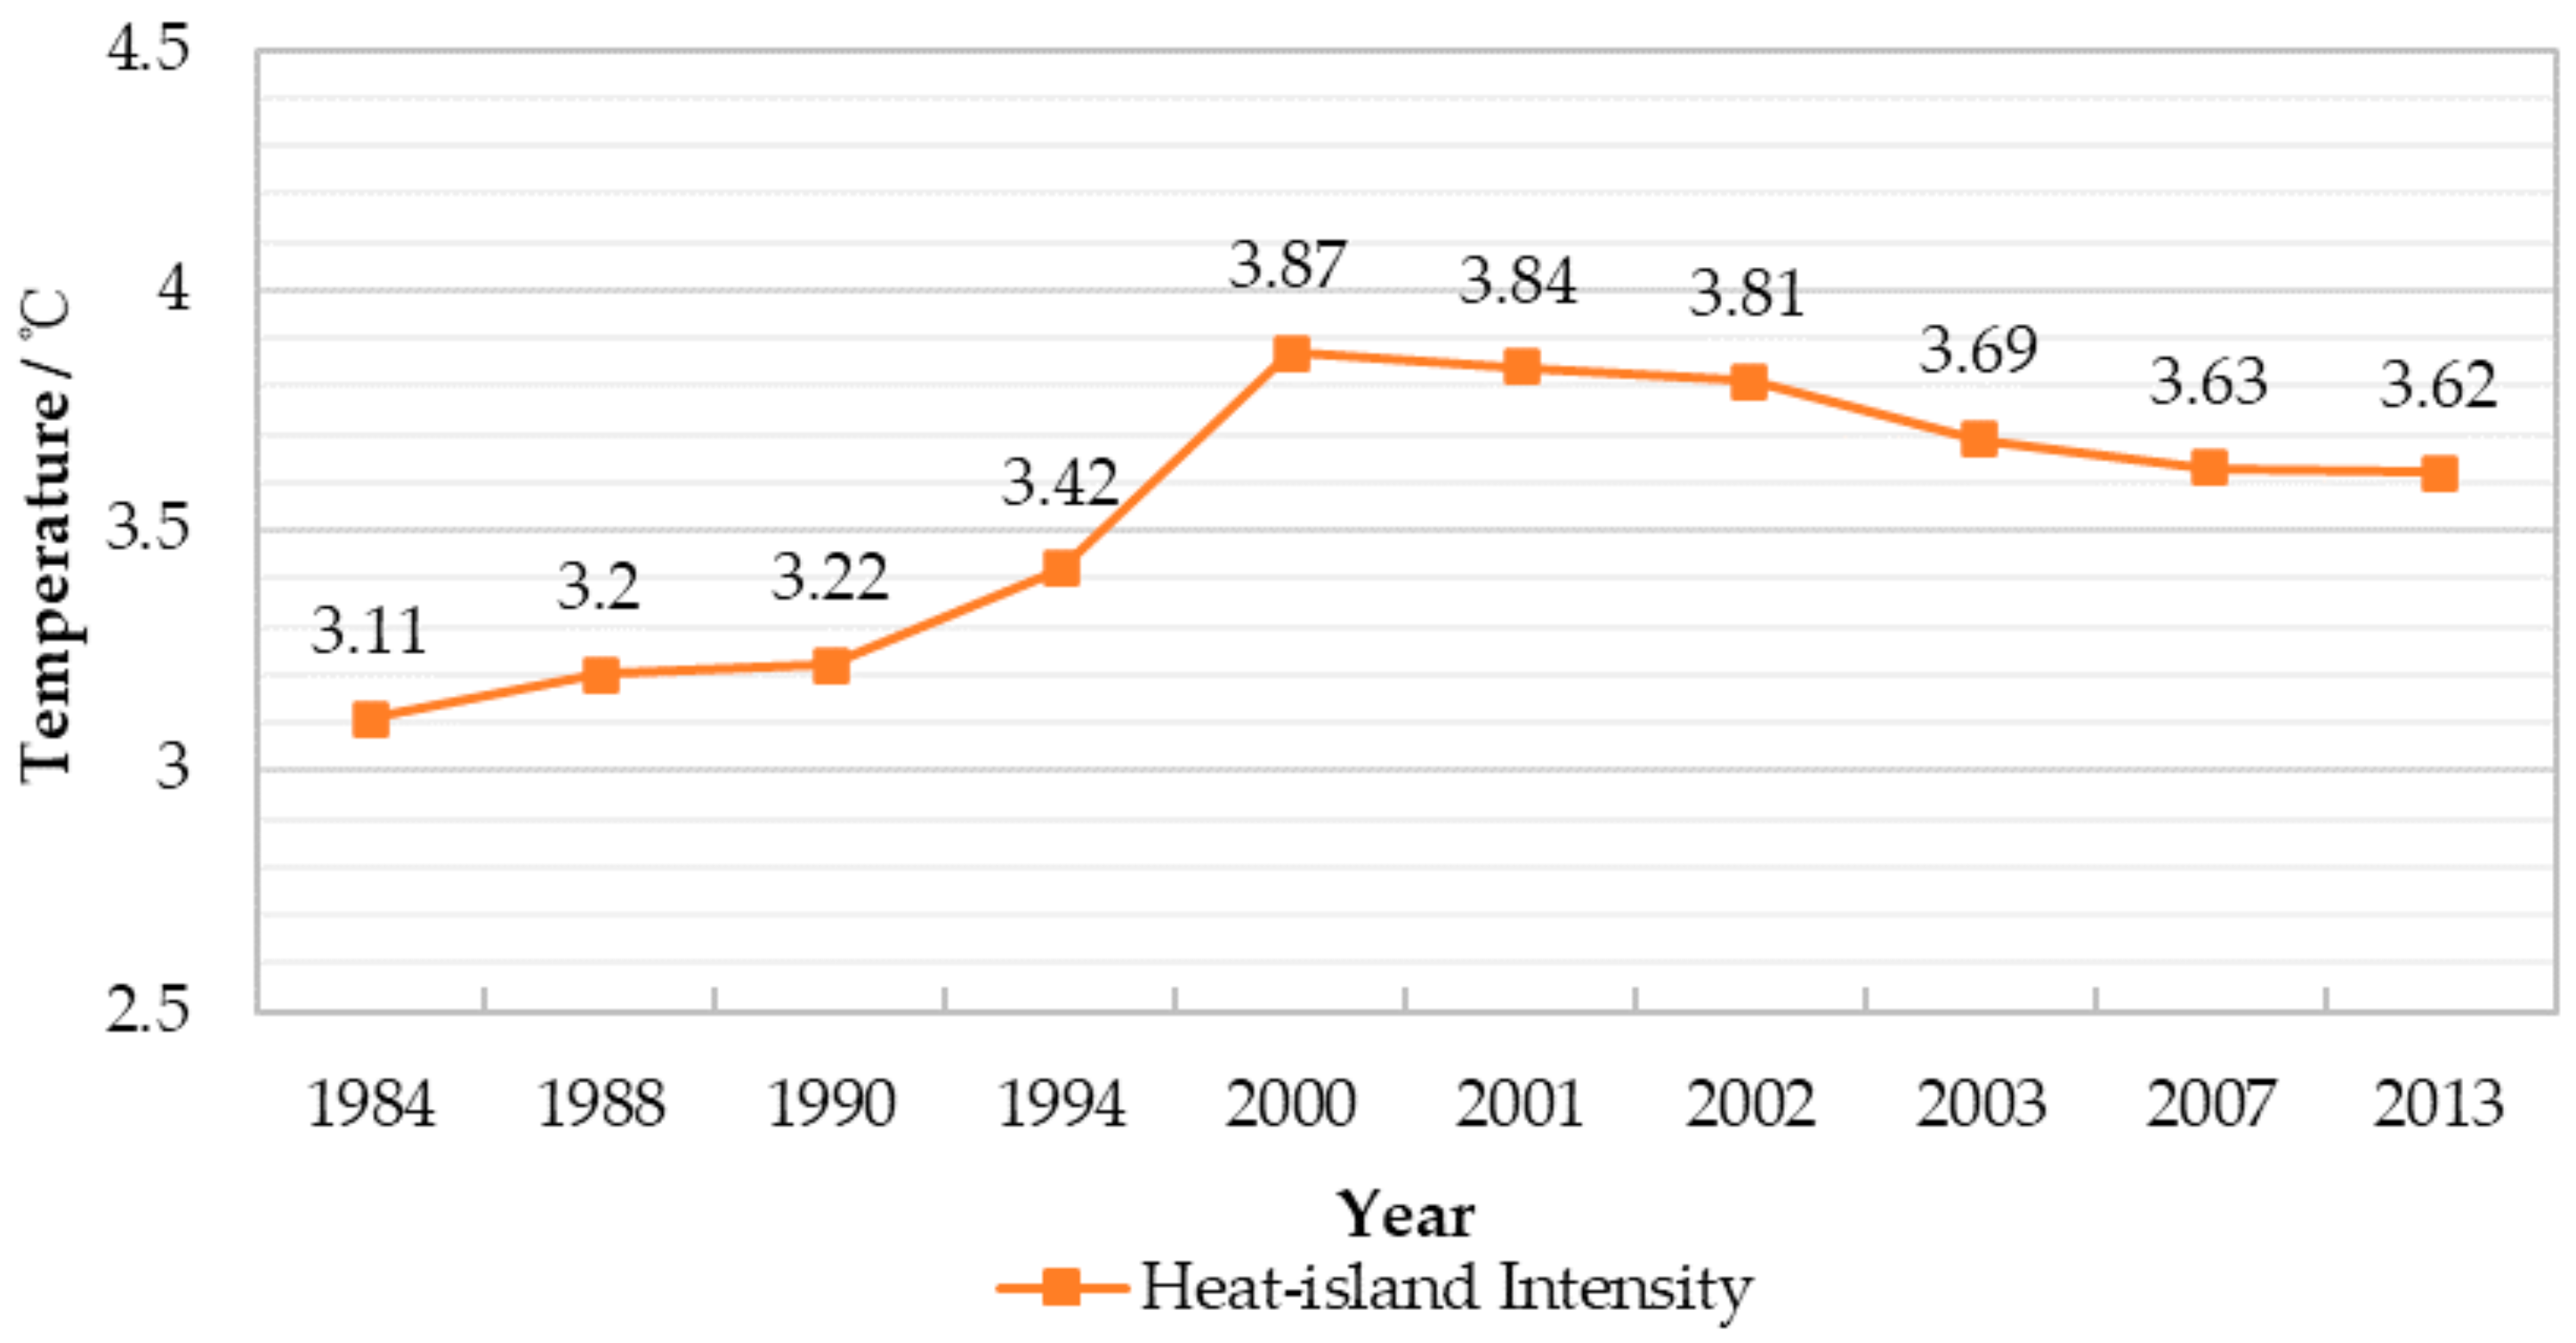
4.3. The Pattern of Historical Changes of Nanjing’s Urban Heat Island Effect in the Last 30 Years
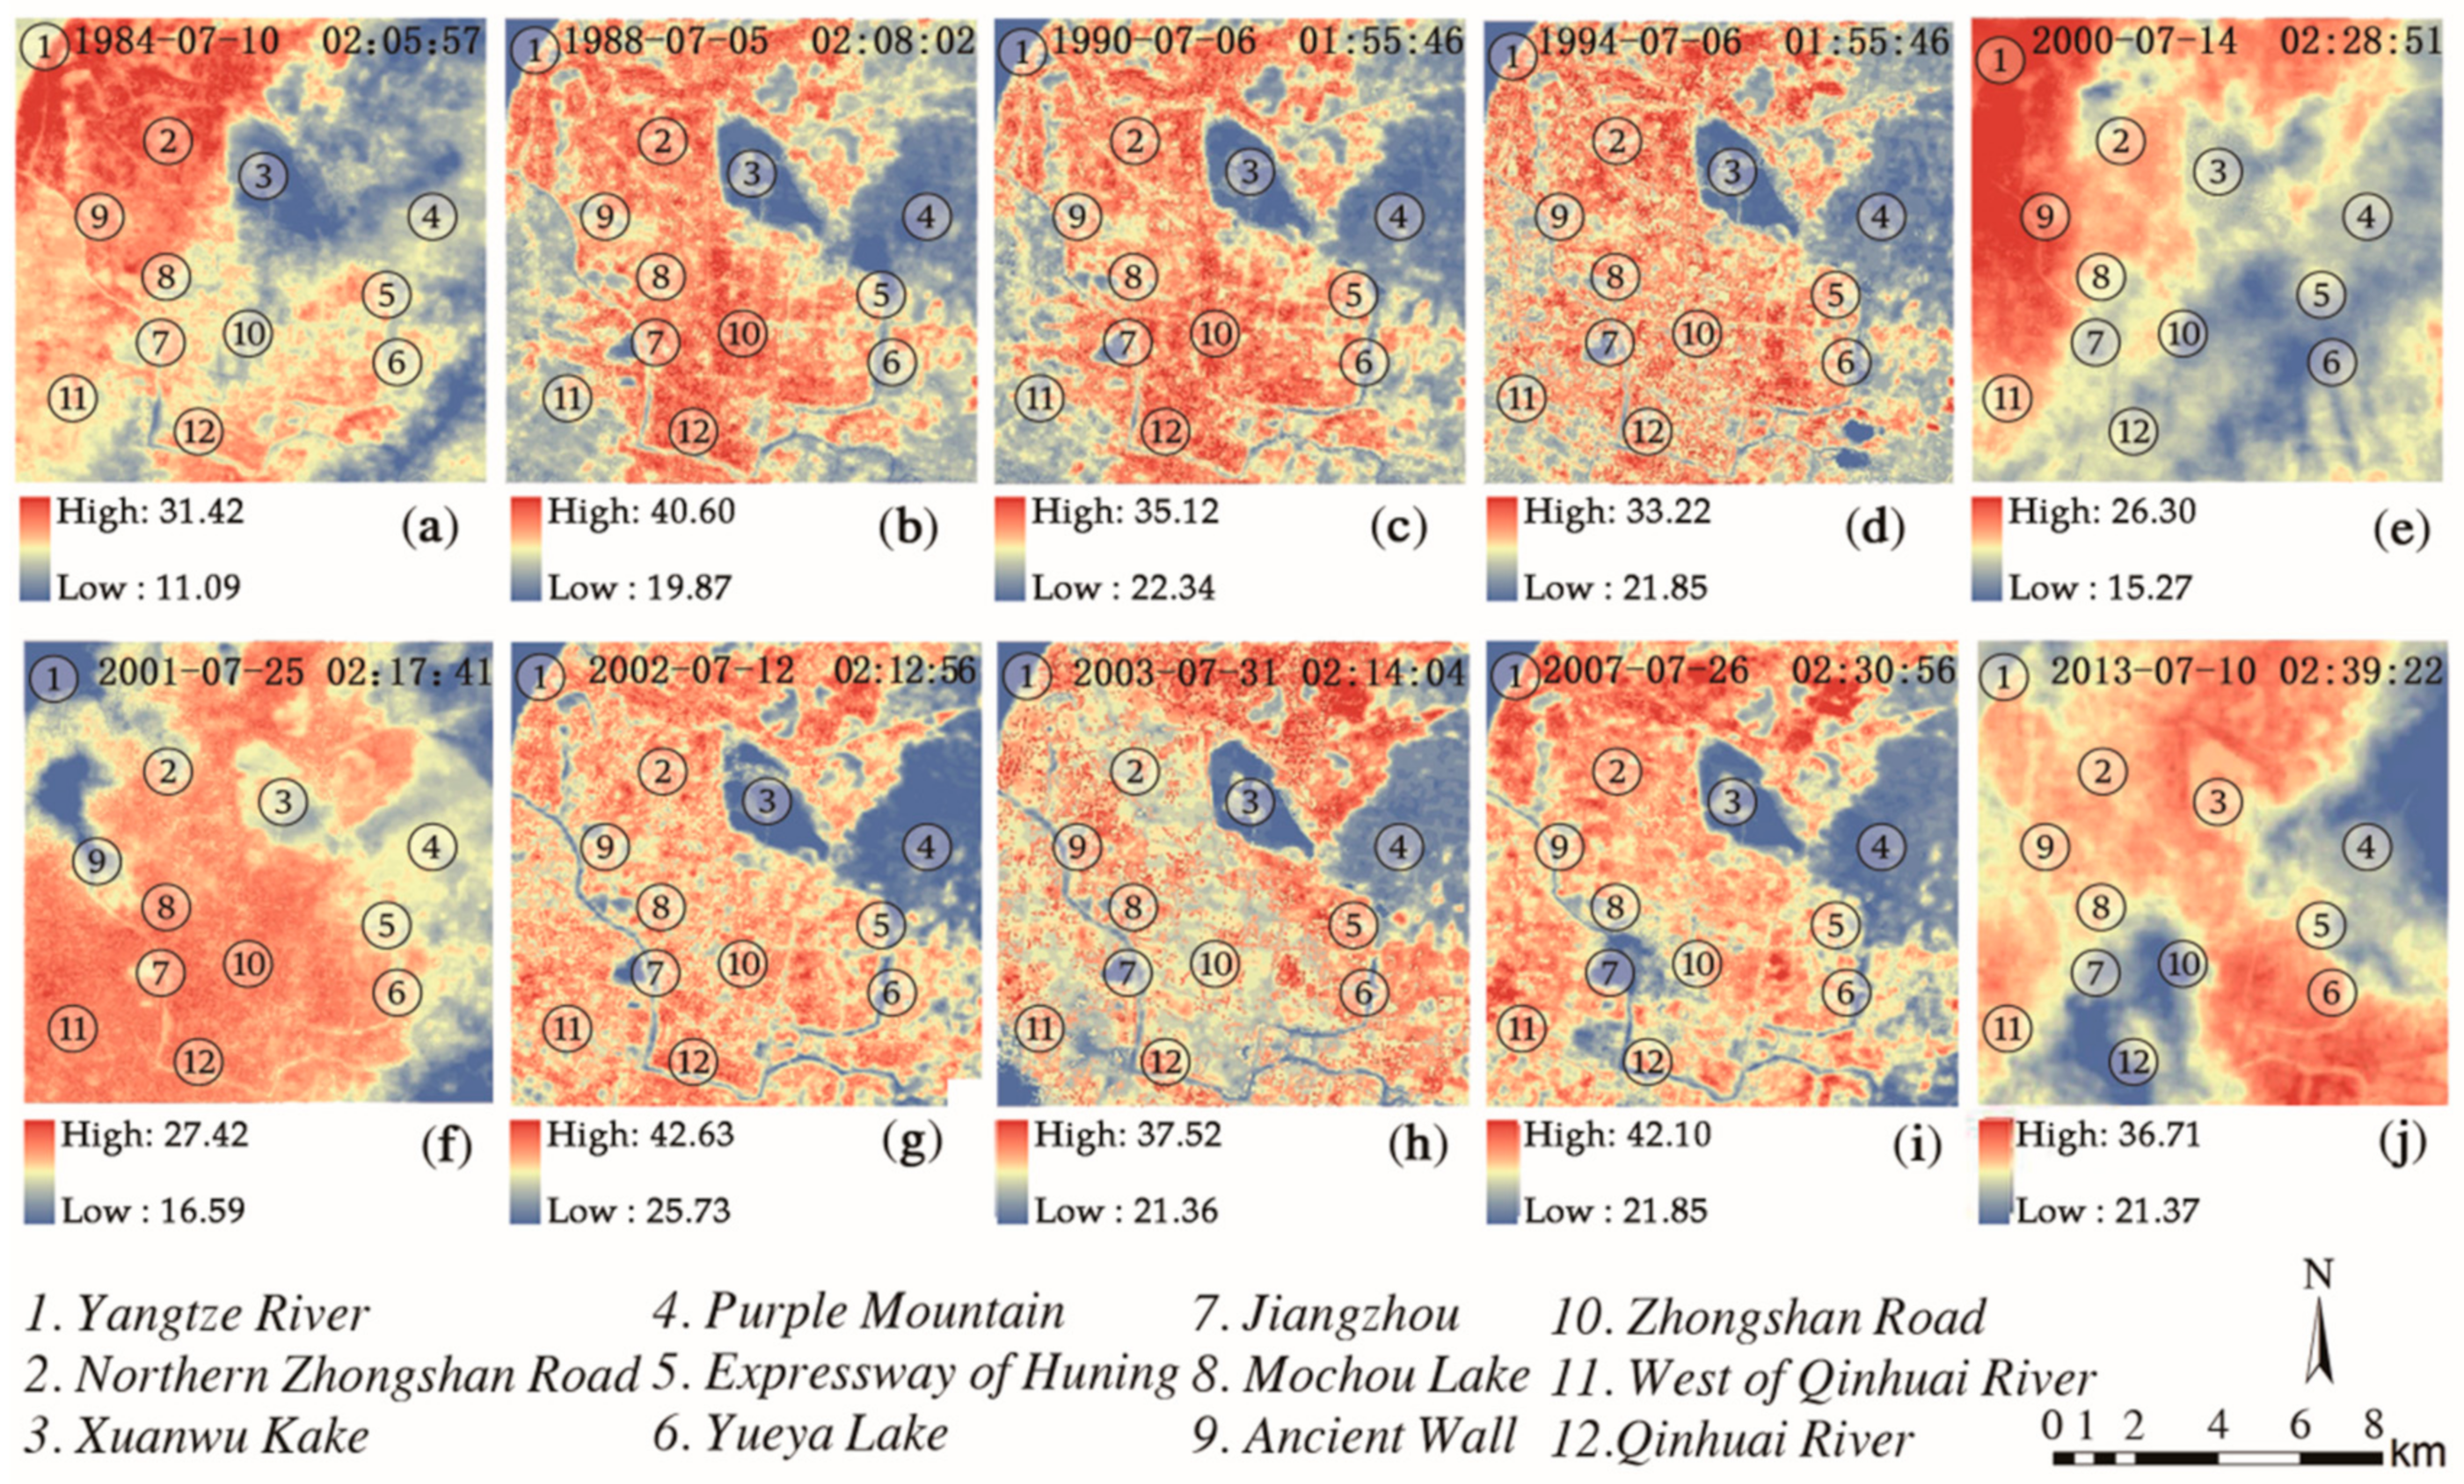
4.3.1. The General Pattern of Historical Changes of Nanjing’s Urban Heat Island Effect in the Last 30 Years
- (a)
- From 1984 to 1990, the areas of low temperature reduced, while the high-temperature areas expanded. In 1984, the high-temperature areas in Nanjing were mainly concentrated in the northwest part of the analysis region. The temperature in the west-river region and region to the south of the city wall concentrated between 15 °C and 20 °C, which belongs to a medium-temperature area, as shown in Figure 7a–c. The perimeter areas of Xuanwu Lake, Purple Mountain, and Yue-ya Lake belong to low-temperature areas. From 1984 to 1990, the region to the south of the city wall witnessed a change from a medium-temperature area to a high-temperature area, and the high-temperature areas outside the city wall gradually expanded along the perimeter of Mochou Lake.
- (b)
- From 1990 to 2001, the whole west-river region witnessed a change from a low-temperature area to a high-temperature area, while the high-temperature areas around Beigu Mountain expanded and the low-temperature areas around Purple Mountain witnessed a corresponding decline. The low-temperature areas around Yue-ya Lake and the Shanghai-Nanjing Highway gradually reduced, as can be seen in Figure 7d–f.
- (c)
- From 2001 to 2013, the pattern of low-temperature areas and high-temperature areas in the analysis region in Nanjing were generally stable and witnessed no obvious change, as shown in Figure 7g–j.
4.3.2. Quantitative Analysis on the Pattern of Historical Changes of Nanjing’s Urban Heat Island Effects in the Last 30 Years
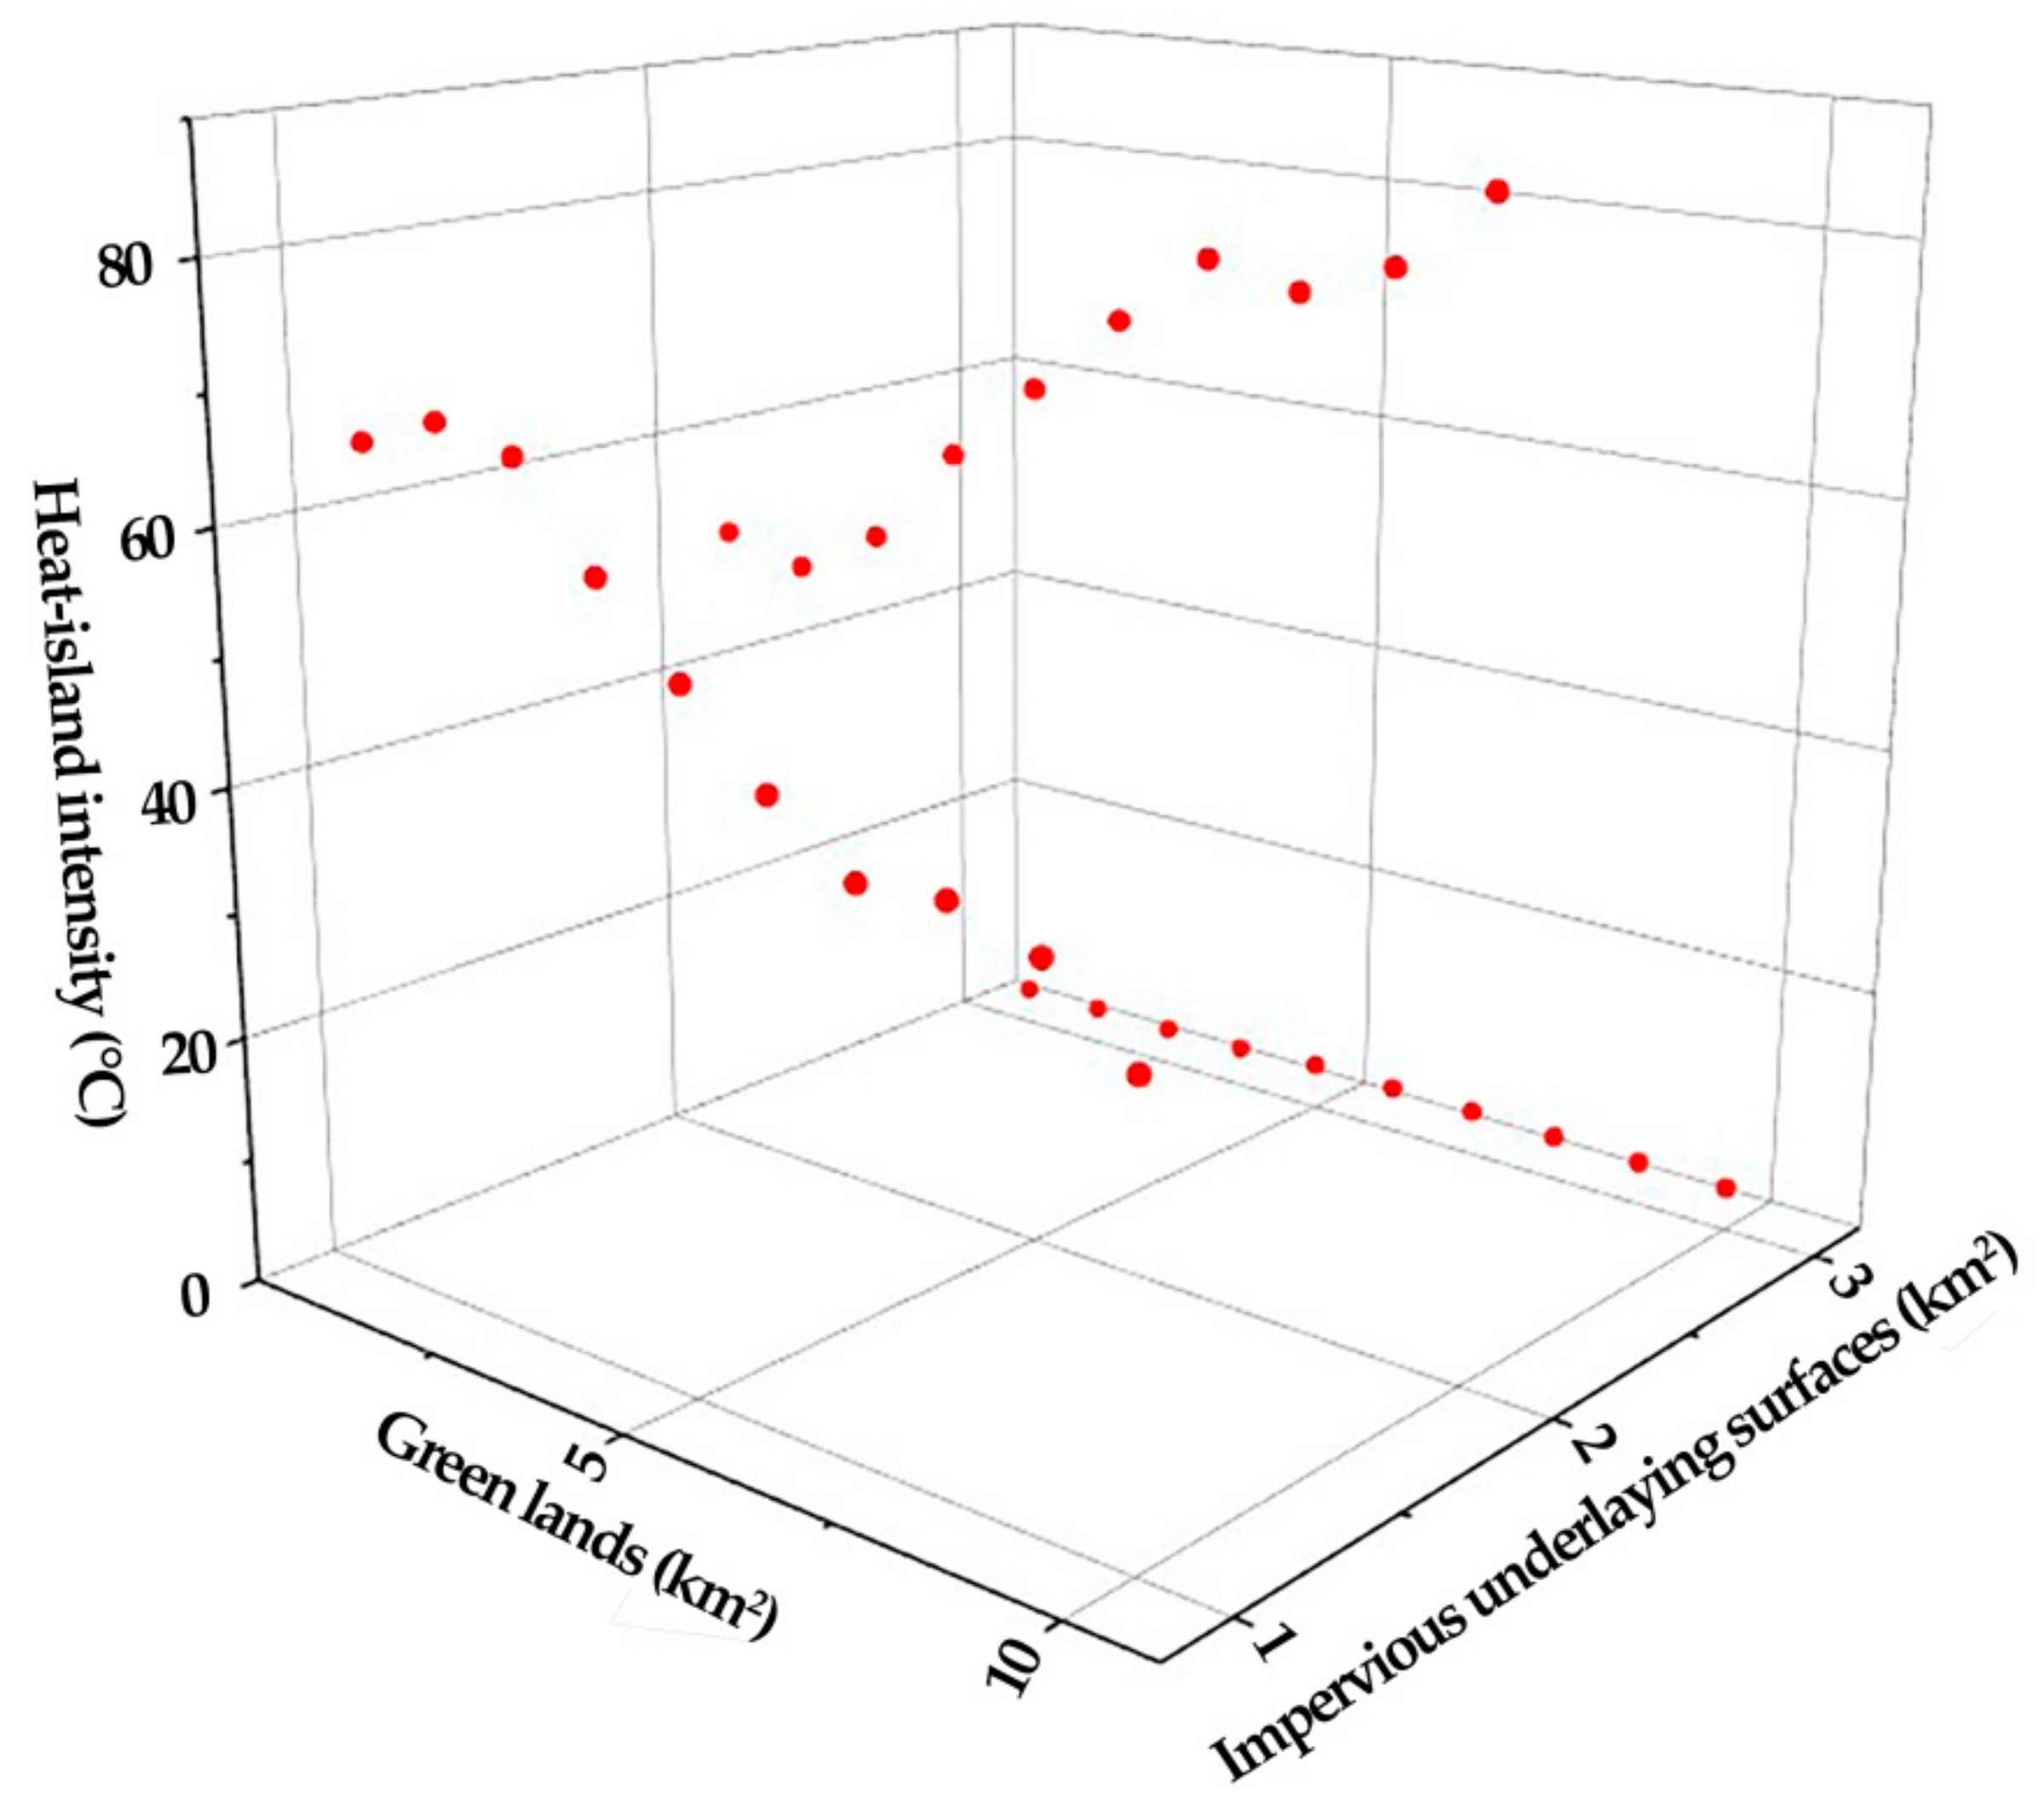
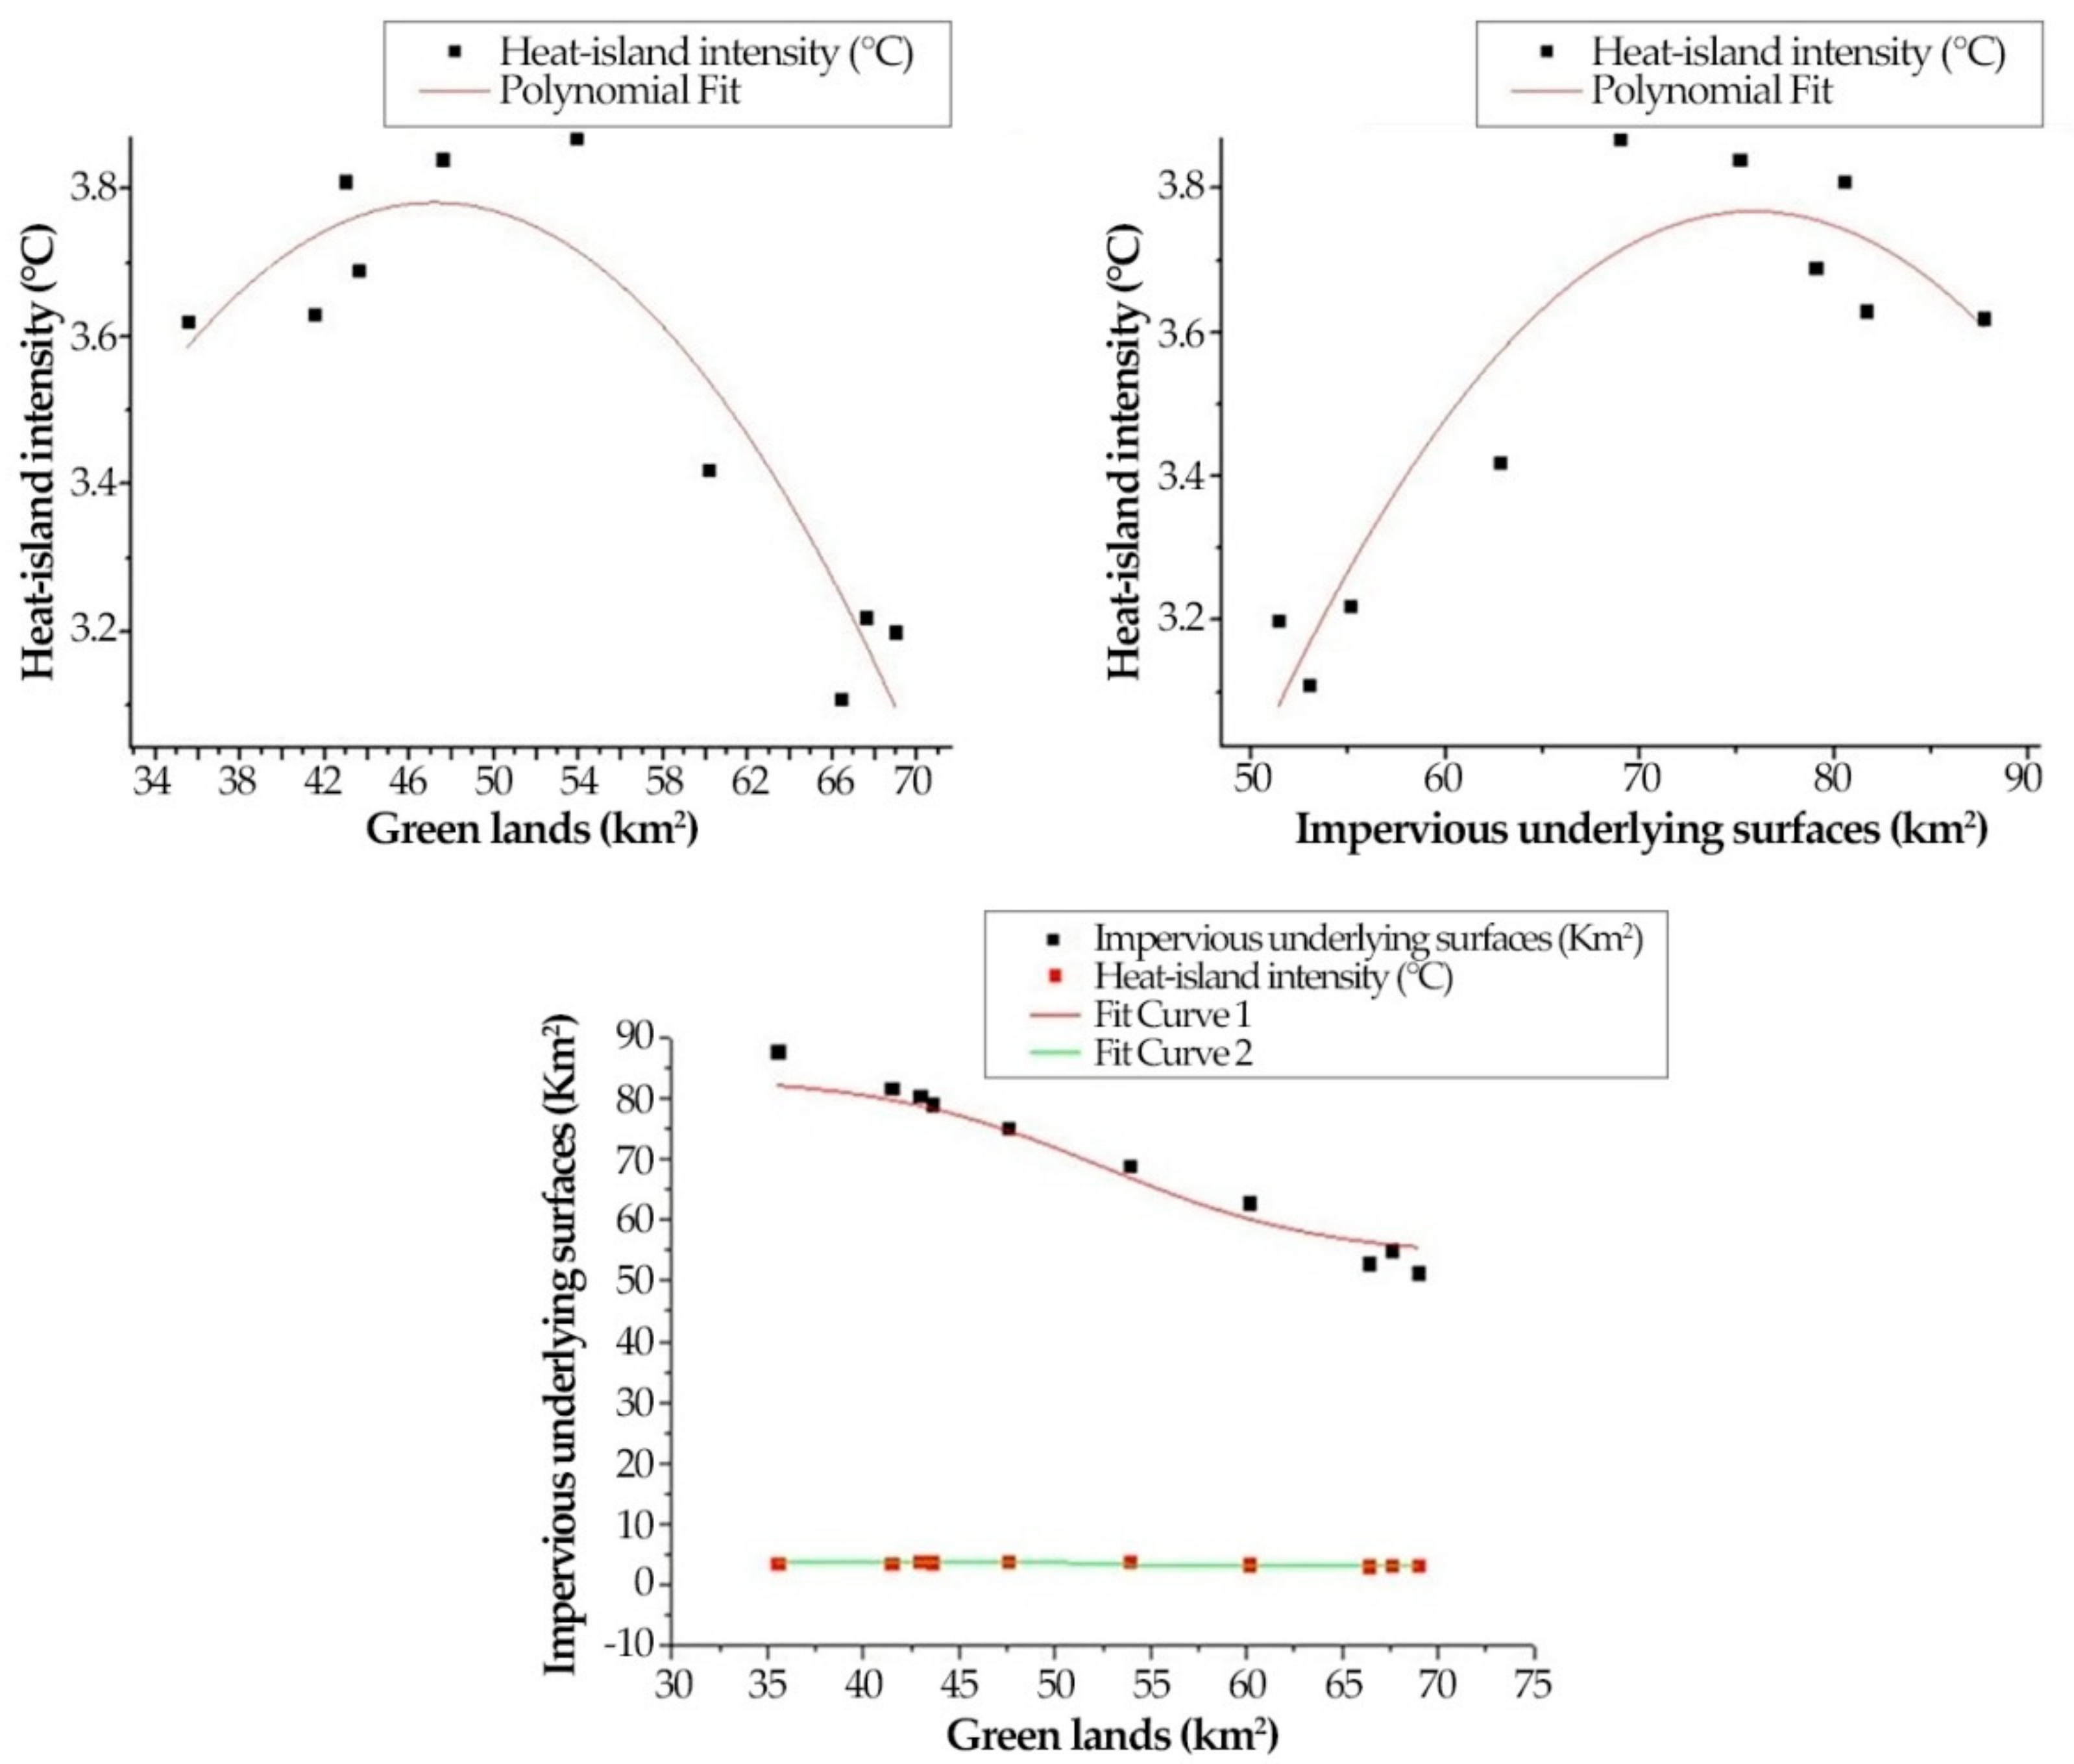
4.4. The Correlation between the Urban Underlying Surface and Nanjing’s Urban Heat Island Effect in the Last 30 Years
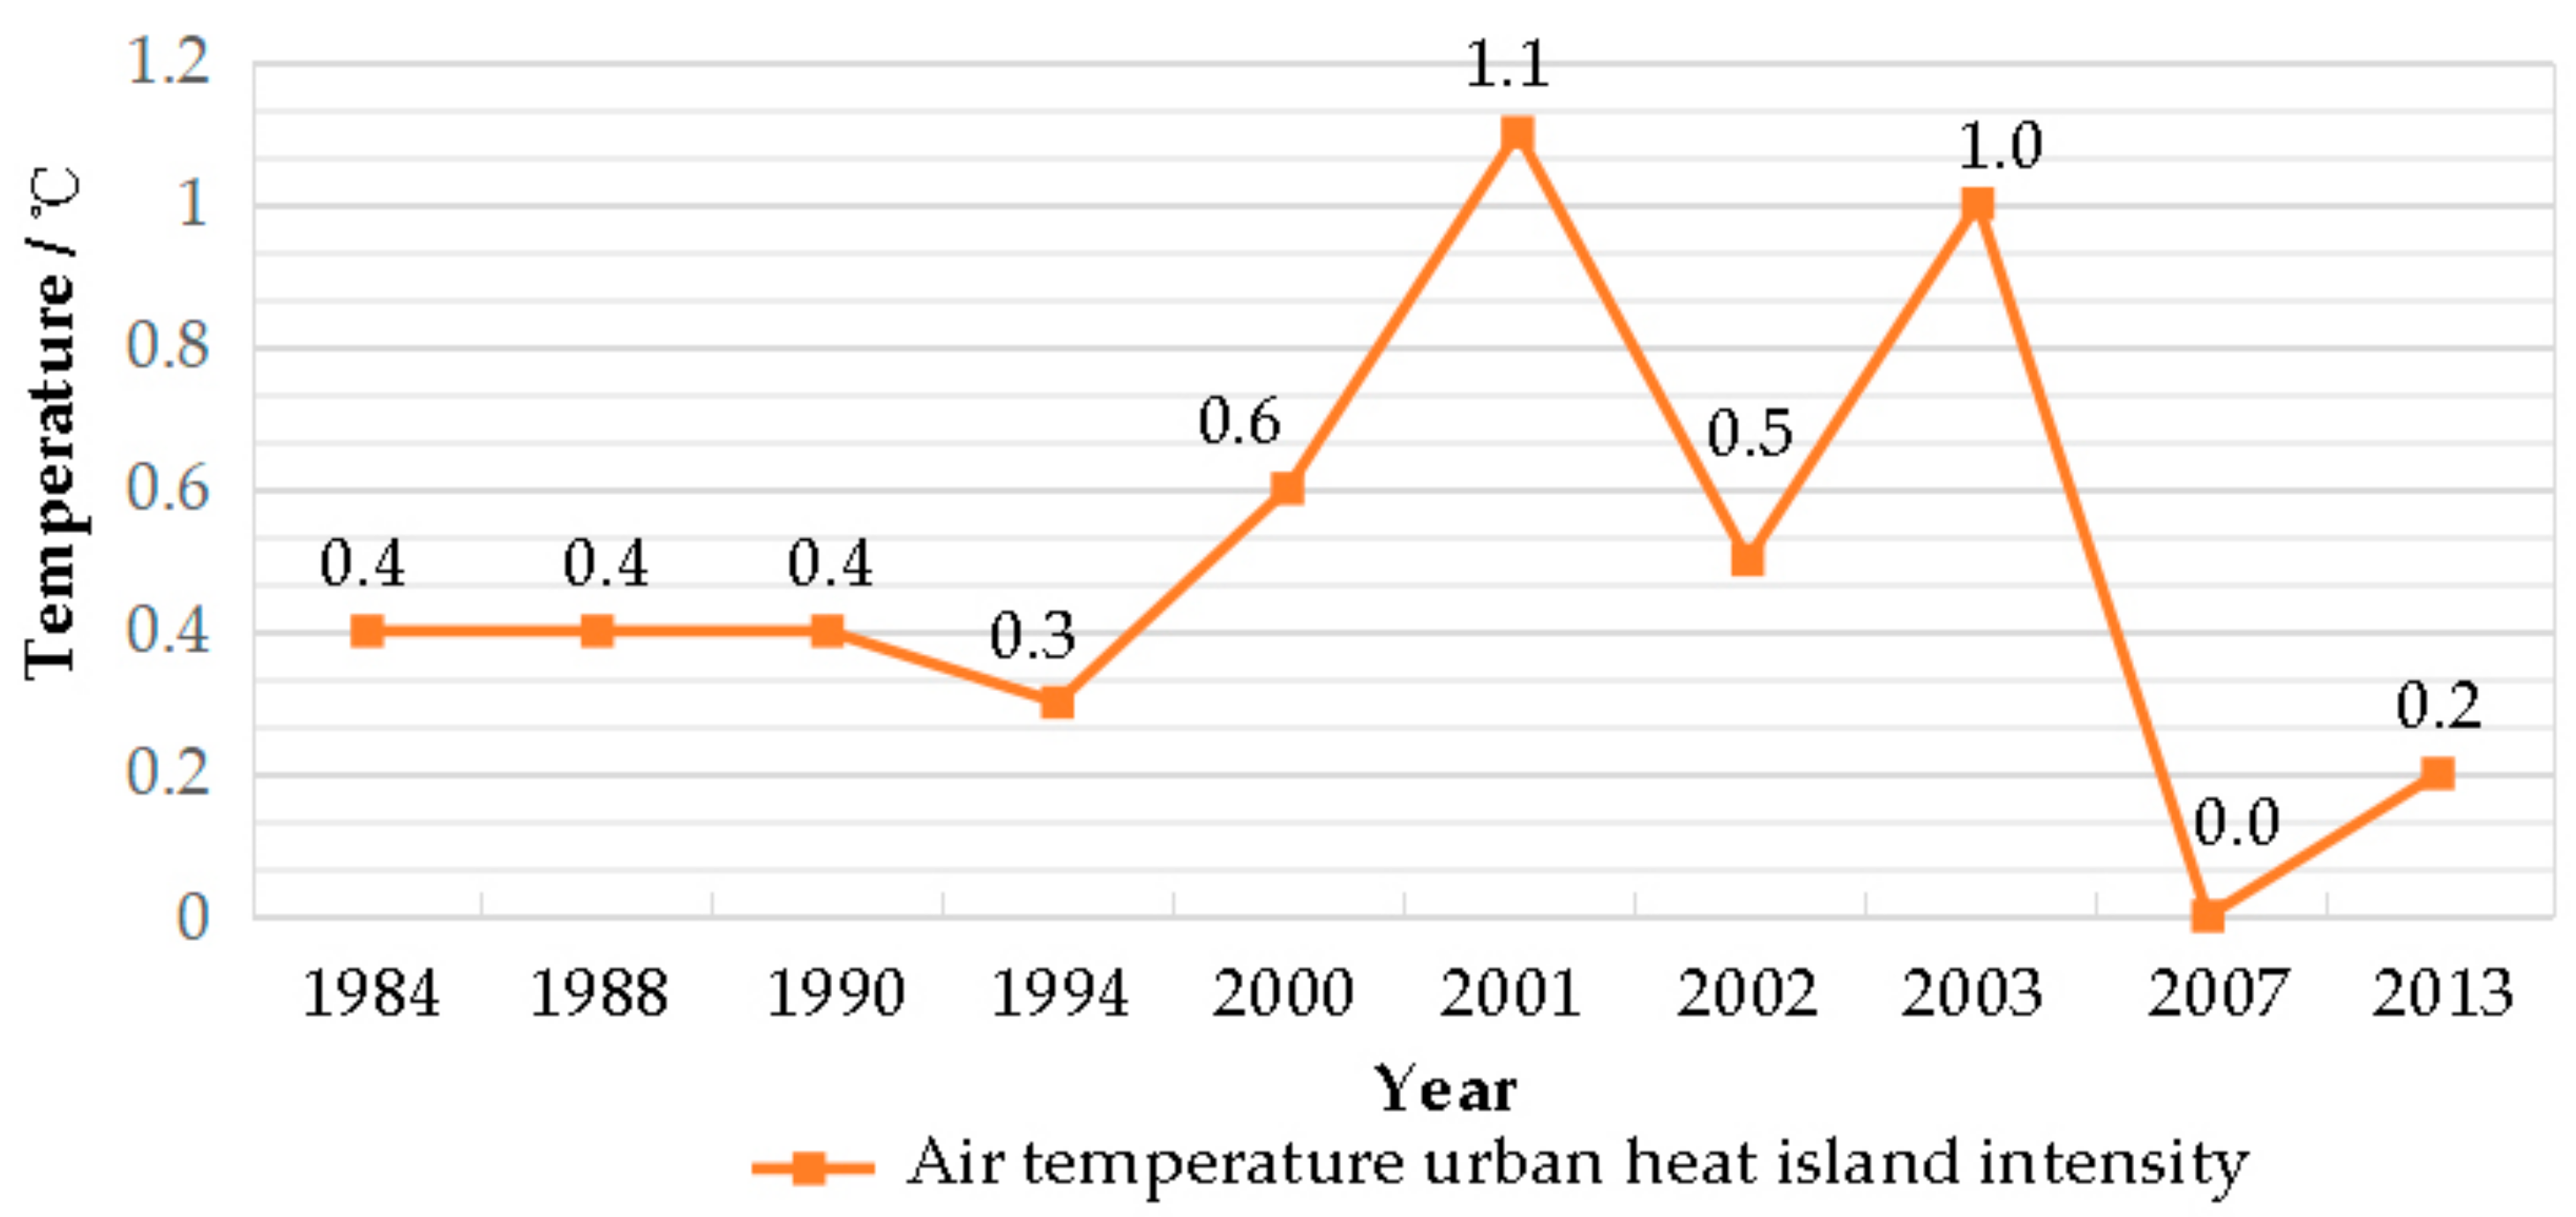
4.5. Air Temperature Urban Heat Island
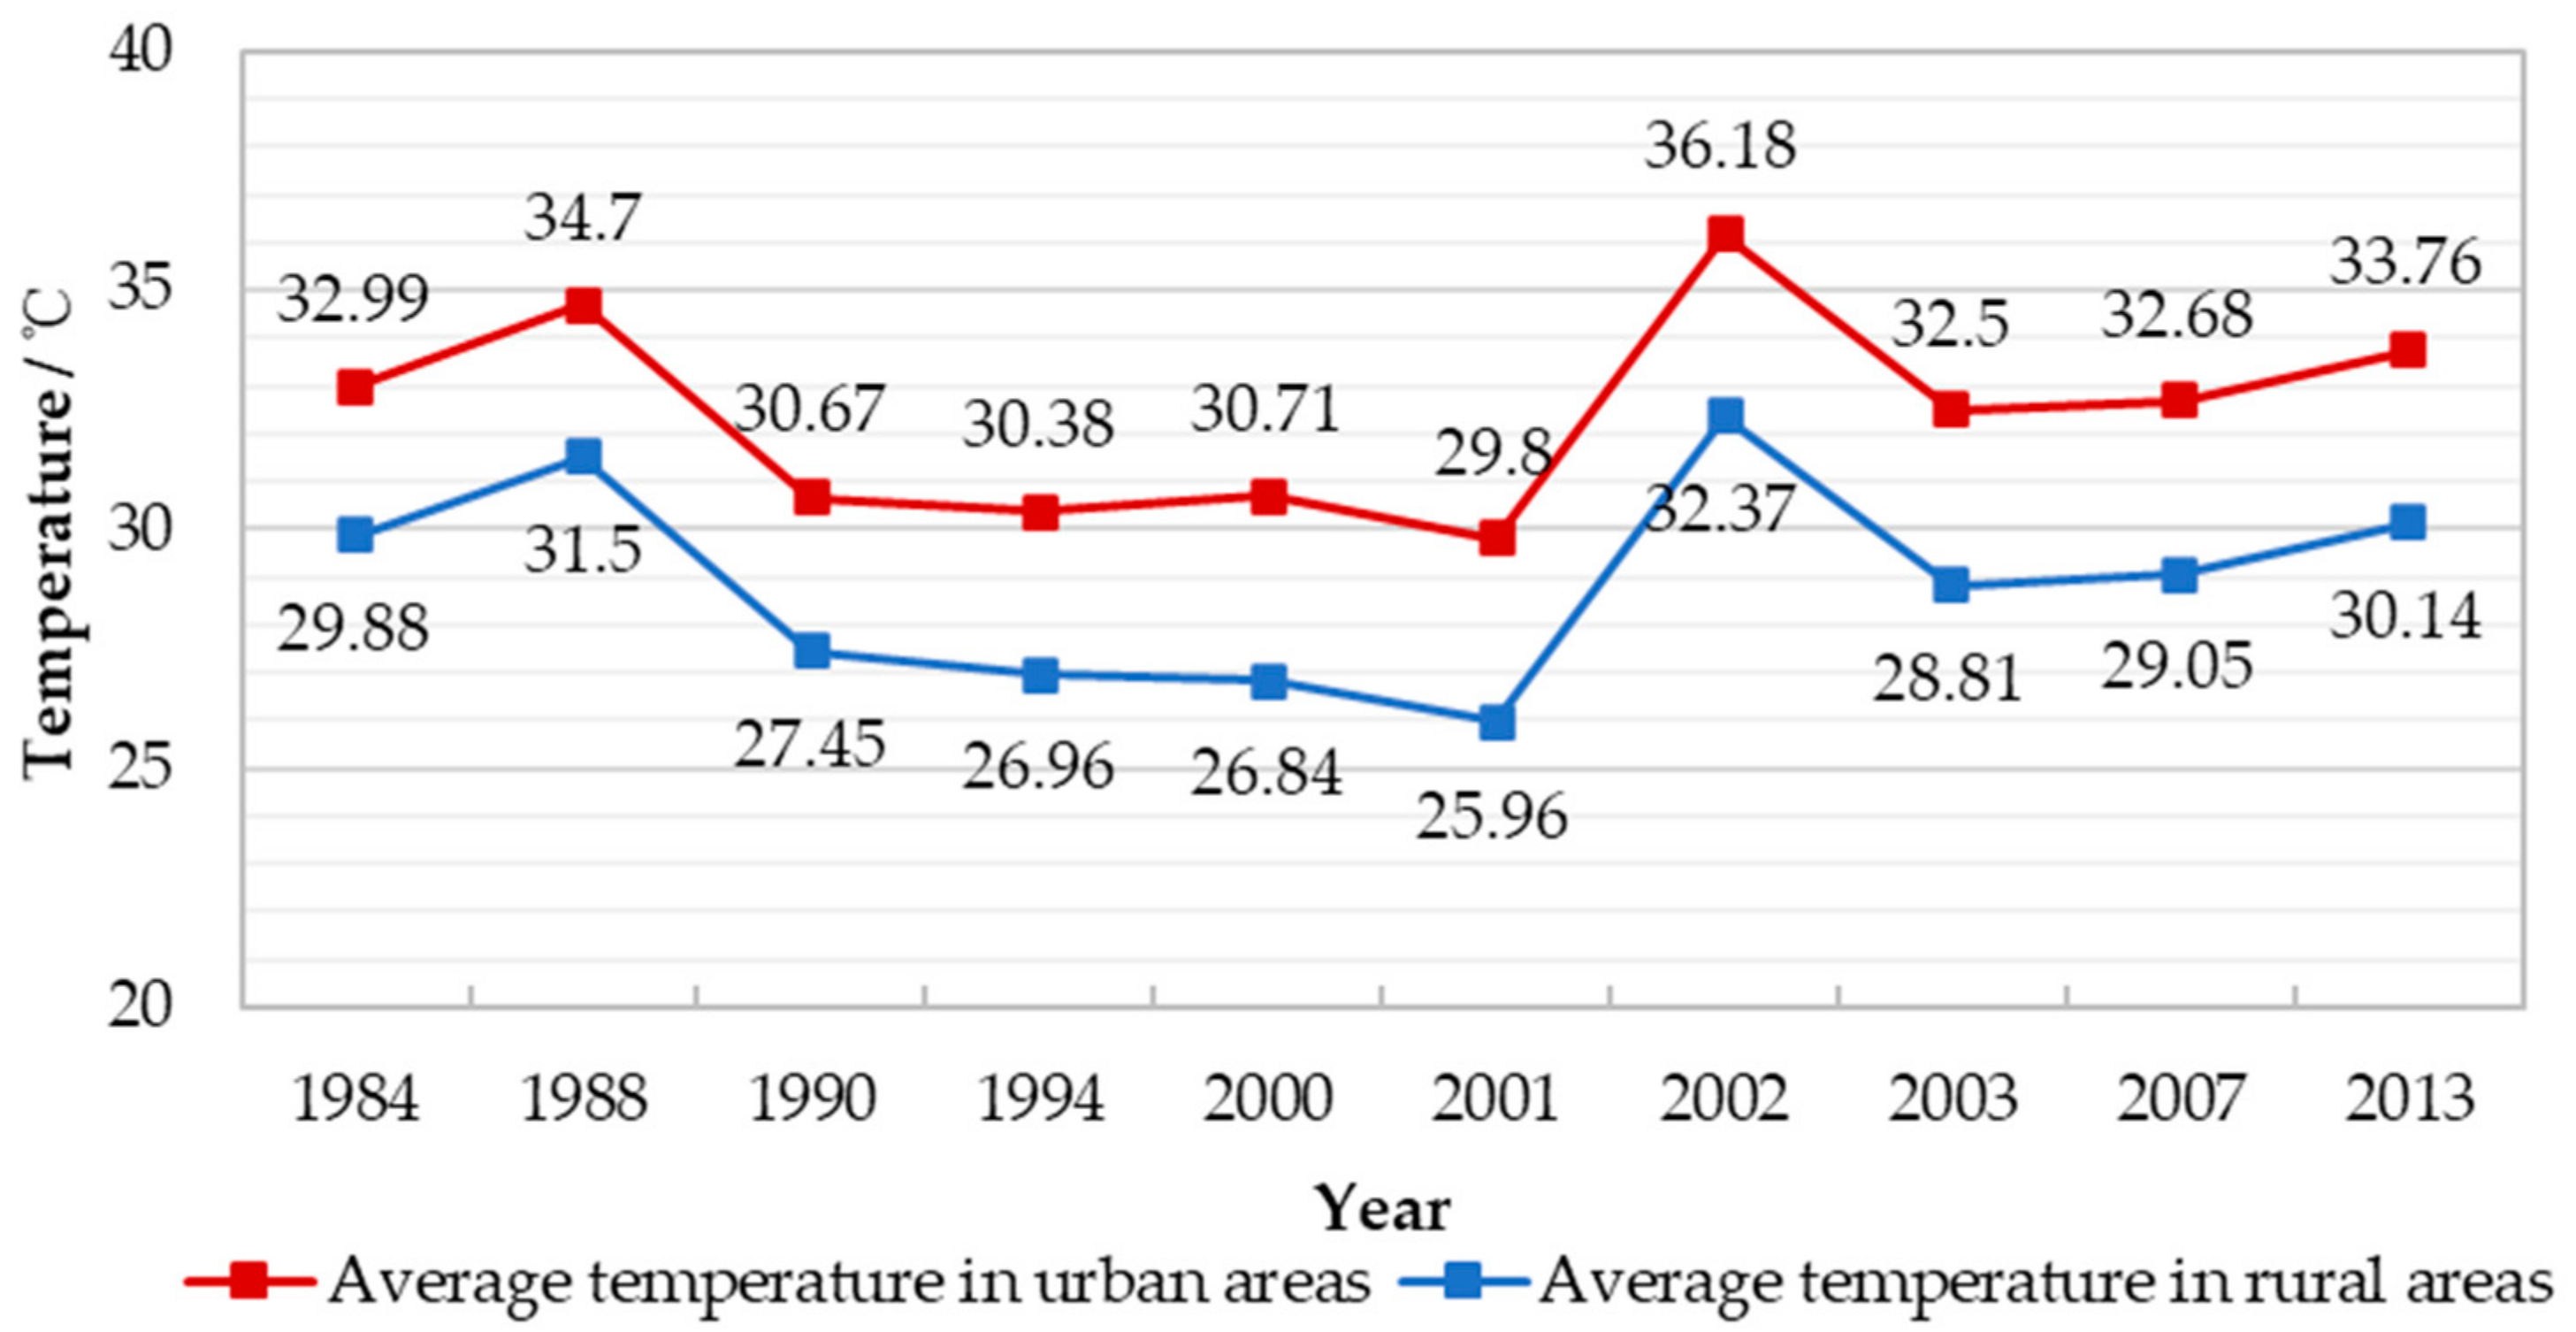
- (1)
- The measured data of the air temperature proves that the urban heat island effect in Nanjing is obvious. However, the surface temperature UHI intensity is generally stronger than the air temperature UHI intensity.
- (2)
- The historical trend of the air temperature UHI intensity is similar to that of the surface temperature UHI intensity, i.e., they both show a pattern of increasing between 1984 and 2000 and decreasing after 2000. In the case of the air temperature UHI, the inversion occurred in 2001, slightly different from 2000.
5. Conclusions
- (1)
- From 1984 to 1990, the extension of impervious surfaces in Nanjing mainly concentrated within the ancient city walls. The spatial growth of impervious surfaces mostly extended eastward along the Zhongshan Road and northward along the North Zhongshan Road. The area of trees and shrubs reduced dramatically in the Purple Mountain region, with the area of green surfaces rising from 66.4 km2 in 1984 to 67.6 km2 in 1990 and the area of impervious surfaces increasing from 53.0 km2 to 55.1 km2. In the same period, the medium-temperature zone in the southern part within the city wall was replaced with a high-temperature zone. The high-temperature zone beyond the city wall extended along the perimeter of Mochou Lake. The average temperature of urban areas increased from 22.99 °C to 30.67 °C.
- (2)
- From 1990 to 2001, the urban areas of Nanjing extended beyond the city wall rapidly. The urban canopy veins formed by the trees along the South Zhongshan Road, the Zhongshan Road, and the North Zhongshan Road became increasingly clear. From 1984 to 2002, the green and farmland areas in the west of Qinhuai river region dropped dramatically. The area of impervious surfaces increased from 67.6 km2 to 75.1 km2. In addition, the whole west-river region witnessed a change from low temperature to high temperature, while the high-temperature areas around Beigu Mountain expanded, and the low-temperature areas around Purple Mountain witnessed a corresponding decrease. The low-temperature areas around Yue-ya Lake and the Shanghai-Nanjing Highway gradually reduced. The UHI increased from 3.22 °C to 3.81 °C.
- (3)
- From 2001 to 2013, the whole surface west of Qinghuai River and east along Shanghai–Nanjing Highway became an impervious surface after nearly 10 years. In 2002, there were still patches of trees and shrubs in the southern region of Xuanwu Lake and western region of Yue-ya Lake. In the years that followed until 2007, the area of green surfaces decreased 1.5 km2, while the area of impervious surfaces increased 1.2 km2. The urban areas of Nanjing were continuously growing eastward along the Shanghai-Nanjing Highway. In 2013, the overall urban spatial pattern remained stable. The pattern of low-temperature areas and high-temperature areas was also stable in general, and the intensity of the UHI changed from 3.81 °C to 3.62 °C.
Author Contributions
Funding
Conflicts of Interest
References
- Un-Habitat. State of the World’s Cities 2008/2009 Harmonious Cities, 1st ed.; Routledge: London, UK, 2008; pp. 222–224. [Google Scholar] [CrossRef]
- Kuang, W.H.; Chi, W.F.; Lu, D.S.; Dou, Y.Y. A comparative analysis of megacity expansions in China and the U.S.: Patterns, rates and driving forces. Landsc. Urban Plan. 2014, 132, 121–135. [Google Scholar] [CrossRef]
- Kwak, Y.; Park, C.; Deal, B. Discerning the success of sustainable planning: A comparative analysis of urban heat island dynamics in Korean new towns. Sustain. Cities Soc. 2020, 61, 102341. [Google Scholar] [CrossRef]
- Cai, Y.Y.; Mou, S.G.; Xiao, B.; Wang, Y.; Liu, P.X. Analysis on coordination degree between land use and urbanization level of Nanjing city. J. Shandong Agric. Univ. 2011, 42, 145–149. [Google Scholar]
- Zhang, M.M.; Wang, Y.H.; Chai, M.T.; Li, D.L. Study on Relationship between Population Urbanization and Land Urbanization. J. Anhui Agric. Sci. 2011, 39, 17450–17452. [Google Scholar] [CrossRef]
- Shi, X. Study on the Urban Using Land Expansion in Period of High-Speed Urbanization-A Case of Nanjing. Master’s Thesis, Nanjing Agricultural University, Nanjing, China, 2004. [Google Scholar]
- Wang, L.J. The Intensive Utilization of Urban Land During a Rapid Urbanization. Master’s Thesis, Nanjing Agricultural University, Nanjing, China, 2006. [Google Scholar]
- Tu, L.; Qin, Z.; Li, W.; Geng, J.; Yang, L.; Zhao, S.; Wang, F. Surface urban heat island effect and its relationship with urban expansion in Nanjing, China. J. Appl. Remote. Sens. 2016, 10, 26–37. [Google Scholar] [CrossRef]
- Kolokotroni, M.; Giannitsaris, I.; Watkins, R. The effect of the London urban heat island on building summer cooling demand and night ventilation strategies. Sol. Energy 2006, 80, 383–392. [Google Scholar] [CrossRef]
- Wang, Q.; Zhang, C.; Ren, C.; Hang, J.; Li, Y. Urban heat island circulations over the Beijing-Tianjin region under calm and fair conditions. Build. Environ. 2020, 180, 107063. [Google Scholar] [CrossRef]
- Streutker, D.R. Satellite-measured growth of the urban heat island of Houston, Texas. Remote Sens. Environ. 2003, 85, 282–289. [Google Scholar] [CrossRef]
- Hung, T.; Uchihama, D.; Ochi, S.; Yasuoka, Y. Assessment with satellite data of the urban heat island effects in Asian mega cities. Int. J. Appl. Earth Obs. Geoinf. 2006, 8, 34–48. [Google Scholar] [CrossRef]
- Oke, T.R. The energetic basis of the urban heat island. Q. J. R. Meteorol. Soc. 1982, 108, 1–24. [Google Scholar] [CrossRef]
- Arnfield, A.J. Two decades of urban climate research: A review of turbulence, exchanges of energy and water, and the urban heat island. Int. J. Climatol. 2003, 23, 1–26. [Google Scholar] [CrossRef]
- Mirzaei, P.A.; Haghighat, F. Approaches to study Urban Heat Island: Abilities and limitations. Build. Environ. 2010, 45, 2192–2201. [Google Scholar] [CrossRef]
- Shi, B.; Tang, C.; Gao, L.; Liu, C.; Wang, B. Observation and analysis of the urban heat island effect on soil in Nanjing, China. Environ. Earth Sci. 2012, 67, 215–229. [Google Scholar] [CrossRef]
- Yang, X.; Peng, L.L.; Jiang, Z.; Chen, Y.; Yao, L.; He, Y.; Xu, T. Impact of urban heat island on energy demand in buildings: Local climate zones in Nanjing. Appl. Energy 2020, 260, 114–279. [Google Scholar] [CrossRef]
- Yao, L.; Yang, X.; Zhu, C.; Jin, T.; Peng, L.; Ye, Y. Evaluation of a Diagnostic Equation for the Daily Maximum Urban Heat Island Effect. Procedia Eng. 2017, 205, 2863–2870. [Google Scholar] [CrossRef]
- Du, L.; Zhou, T.; Li, M.; Gong, D. Urban heat island effects derived from dense Landsat thermal observations in Nanjing, China. IOP Conference Series. Earth Environ. Sci. 2014, 17. [Google Scholar] [CrossRef]
- Qiao, Z.; Tian, G.J.; Zhang, L.X.; Xu, X.L. Influences of urban expansion on urban heat island in Beijing during 1989–2010. Adv. Meteorol. 2014, 2014, 1–11. [Google Scholar] [CrossRef]
- Zhao, H.J.; Jing, Y.S. The Effect of Urbanization on Air Temperature Increase in Nanjing City. J. Anhui Agric. Sci. 2008, 28. [Google Scholar] [CrossRef]
- Kong, F.H.; Yin, H.W.; James, P.; Hutyra, L.R.; Hong, S.H. Effects of spatial pattern of greenspace on urban cooling in a large metropolitan area of eastern China. Landsc. Urban Plan. 2014, 128, 35–47. [Google Scholar] [CrossRef]
- Peng, J.; Liu, Q.; Xu, Z.; Lyu, D.; Du, Y.; Qiao, R.; Wu, J. How to effectively mitigate urban heat island effect? A perspective of waterbody patch size threshold. Landsc. Urban Plan. 2020, 202, 103873. [Google Scholar] [CrossRef]
- Yang, X.S.; Zhao, L.H.; Bruse, M.; Meng, Q.L. Evaluation of a microclimate model for predicting the thermal behavior of different ground surfaces. Build. Environ. 2013, 60, 93–104. [Google Scholar] [CrossRef]
- Su, W.; Gu, C.; Yang, G. Assessing the Impact of Land Use/Land Cover on Urban Heat Island Pattern in Nanjing City, China. J. Urban Plan. Dev. 2010, 136, 365–372. [Google Scholar] [CrossRef]
- Min, M.; Lin, C.; Duan, X.; Jin, Z.; Zhang, L. Spatial distribution and driving force analysis of urban heat island effect based on raster data: A case study of the Nanjing metropolitan area, China. Sustain. Cities Soc. 2019, 50, 101–637. [Google Scholar] [CrossRef]
- Yang, X.; Jin, T.; Yao, L.; Zhu, C.; Peng, L. Assessing the Impact of Urban Heat Island Effect on Building Cooling Load based on the Local Climate Zone Scheme. Procedia Eng. 2017, 205, 2839–2846. [Google Scholar] [CrossRef]
- Lu, D.S.; Weng, Q.H. Use of impervious surface in urban land-use classification. Remote Sens. Environ. 2006, 102, 146–160. [Google Scholar] [CrossRef]
- Wickham, J.D.; Stehman, S.V.; Gass, L.; Dewitz, J.; Fry, J.A.; Wade, T.G. Accuracy assessment of NLCD 2006 land cover and impervious surface. Remote Sens. Environ. 2013, 130, 294–304. [Google Scholar] [CrossRef]
- Xian, G.; Homer, C. Updating the 2001 national land cover database impervious surface products to 2006 using Landsat imagery change detection methods. Remote Sens. Environ. 2010, 114, 1676–1686. [Google Scholar] [CrossRef]
- Taubenböck, H.; Esch, T.; Felbier, A.; Wiesner, M.; Roth, A.; Dech, S. Monitoring urbanization in mega cities from space. Remote Sens. Environ. 2012, 117, 162–176. [Google Scholar] [CrossRef]
- Xie, J.F.; Liu, T.T.; Guo, J. Application of single-window algorithm to urban planning of urban heat island effect in Beijing. Gard. Sci. Technol. J. 2011, 122, 7–11. [Google Scholar]
- Zhou, H.M.; Zhou, C.H.; Ge, W.Q.; Ding, J.C. The Surveying on Thermal Distribution in Urban Based on GIS and Remote Sensing. Acta Geogr. Sin. 2001, 68, 189–197. [Google Scholar] [CrossRef]
- Qin, Z.H.; Li, W.J.; Xu, B.; Chen, Z.X.; Liu, J. The estimation of land surface emissivity for Landsat TM6. Remote Sens. Land Resour. 2004, 16, 28–32. [Google Scholar] [CrossRef]
- Xu, D.Q.; Tang, X.J.; He, Z. Information conversion between the remote sensing image software ENVI and GIS software. J. Water Resour. Water Eng. 2005, 16, 67–70. [Google Scholar]
- Yan, S.; Zhang, J.; Zhang, B.; Lu, Q.; Wang, Y.; Yu, H.; Zhang, Z. Evolution of urban heat island effect in 2008 and its influence on resident life in Nanjing, Jiangsu province. J. Meteorol. Environ. 2011, 27, 14–20. [Google Scholar]
- Oke, T.R. Initial Guidance to Obtain Representative Meterorological Observations at Urban Sites; University of British Columbia: Vancouver, BC, Canada, 2004. [Google Scholar]
- Yang, C.; Yan, F.; Zhang, S. Comparison of land surface and air temperatures for quantifying summer and winter urban heat island in snow climate city. J. Environ. Manag. 2020, 265, 110–563. [Google Scholar] [CrossRef] [PubMed]


| Year | Analyzed (Y)/Not Analyzed (N) | Months of Clear Images | Spatial Resolution (m) | Bands | Scene Information |
|---|---|---|---|---|---|
| 1984 | Y | 7 | 80 | 4 | The image of July is clear. |
| 1985 | N | 11 | 80 | 4 | There are clouds in the image of July. |
| 1986 | N | 2 | 80 | 4 | Only the image of February is clear. |
| 1987 | N | 9, 12 | 80 | 4 | There are clouds in the image of June. |
| 1988 | Y | 7 | 80 | 4 | The image of July is clear. |
| 1989 | N | 3, 11, 12 | 80 | 4 | The image of July cannot be obtained. |
| 1990 | Y | 7 | 80 | 4 | The image of July is clear. |
| 1991 | N | 6, 8 | 80 | 4 | There are clouds in the image of July. |
| 1992 | N | 3, 10 | 80 | 4 | The image of March and October is clear. |
| 1993 | N | 2, 3, 11 | 30 | 7 | The image of July cannot be obtained. |
| 1994 | Y | 5, 6, 7 | 30 | 7 | The image of July is clear. |
| 1995 | N | 1, 3, 10 | 30 | 7 | There are clouds in the image of July. |
| 1996 | N | 2, 4, 12 | 30 | 7 | The image of July cannot be obtained. |
| 1997 | N | 10, 11 | 30 | 7 | The image of October and November is clear. |
| 1998 | N | 1, 2, 4, 5, 11, 12 | 30 | 7 | The image of July cannot be obtained. |
| 1999 | N | 5, 6, 12 | 30 | 7 | The image of July cannot be obtained. |
| 2000 | Y | 2, 4, 5, 7, 10 | 30 | 7 | There are clouds in the image of July. |
| 2001 | Y | 1, 2, 7, 10 | 30 | 7 | There are clouds in the image of July. |
| 2002 | Y | 3, 7 | 30 | 7 | The image of July is clear. |
| 2003 | Y | 1, 2, 3, 7, 10, 11 | 30 | 8 | The image of July is clear. |
| 2004 | N | 2, 7, 10, 11, 12 | 30 | 8 | The image of July is ETM+ data, which has bands. |
| 2005 | N | 10 | 30 | 8 | Only the image of October is clear. |
| 2006 | N | 4, 5, 7 | 30 | 8 | The image of July is ETM+ data, which has bands. |
| 2007 | Y | 1, 3, 5, 6, 7, 9 | 30 | 8 | The image of July is clear. |
| 2008 | N | 7, 9 | 30 | 8 | The image of July is ETM+ data, which has bands. |
| 2009 | N | 6, 10 | 30 | 8 | The image of June and October is clear. |
| 2010 | N | 8 | 30 | 8 | The image of August is clear. |
| 2011 | N | 7 | 30 | 8 | The image of July is ETM+ data, which has bands. |
| 2012 | N | 7 | 30 | 8 | The image of July is ETM+ data, which has bands. |
| 2013 | Y | 7 | 15 | 11 | The image of July is Landsat8 data. |
| 2014 | N | 10 | 15 | 11 | The image of July is ETM+ data, which has bands. |
| 2015 | N | 4, 6, 10, 11, 12 | 30 | 8 | There are clouds in the image of July. |
| 2016 | N | 1, 2, 3, 4, 12 | 15 | 11 | There are clouds in the image of July. |
| 2017 | N | 1, 2, 3, 11, 12 | 15 | 11 | There are clouds in the image of July. |
| 2018 | N | 2, 4, 6 | 15 | 11 | There are clouds in the image of July. |
| Year | 1984 | 1988 | 1990 | 1994 | 2000 | 2001 | 2002 | 2003 | 2007 | 2013 |
| Ratio (%) | 64 | 58 | 65 | 67 | 78 | 70 | 81 | 76 | 74 | 78 |
| Year | Ratio of Green Surfaces (%) | Ratio of Water Surfaces (%) | Ratio of Impervious Surfaces (%) |
|---|---|---|---|
| 1984 | 51.20 | 7.94 | 40.86 |
| 1988 | 53.74 | 6.63 | 39.63 |
| 1990 | 52.12 | 5.32 | 42.56 |
| 1994 | 46.41 | 5.17 | 48.42 |
| 2000 | 41.56 | 5.17 | 53.27 |
| 2001 | 36.63 | 5.47 | 57.90 |
| 2002 | 33.23 | 4.70 | 62.07 |
| 2003 | 33.61 | 5.40 | 60.99 |
| 2007 | 32.00 | 5.01 | 62.99 |
| 2013 | 27.37 | 5.01 | 67.62 |
| Multiple Correlation Coefficient R | R Square | Adjusted R Square (R2) | Significance F |
|---|---|---|---|
| 0.9612 | 0.9238 | 0.8286 | 0.023471 |
| Coefficient | Value | T Value | P Value |
|---|---|---|---|
| Intercept | −1125.98 | −1.4 | 0.22 |
| X Variable 1 | 19.40 | 1.5 | 0.22 |
| X Variable 2 | 17.67 | 1.4 | 0.23 |
| X Variable 3 | −0.15 | −1.4 | 0.22 |
| X Variable 4 | −0.08 | −1.5 | 0.21 |
| X Variable 5 | −0.07 | −1.4 | 0.23 |
© 2020 by the authors. Licensee MDPI, Basel, Switzerland. This article is an open access article distributed under the terms and conditions of the Creative Commons Attribution (CC BY) license (http://creativecommons.org/licenses/by/4.0/).
Share and Cite
Li, Y.; Zhang, X.; Zhu, S.; Wang, X.; Lu, Y.; Du, S.; Shi, X. Transformation of Urban Surfaces and Heat Islands in Nanjing during 1984–2018. Sustainability 2020, 12, 6521. https://doi.org/10.3390/su12166521
Li Y, Zhang X, Zhu S, Wang X, Lu Y, Du S, Shi X. Transformation of Urban Surfaces and Heat Islands in Nanjing during 1984–2018. Sustainability. 2020; 12(16):6521. https://doi.org/10.3390/su12166521
Chicago/Turabian StyleLi, Yanxia, Xinkai Zhang, Sijie Zhu, Xiaoyu Wang, Yongdong Lu, Sihong Du, and Xing Shi. 2020. "Transformation of Urban Surfaces and Heat Islands in Nanjing during 1984–2018" Sustainability 12, no. 16: 6521. https://doi.org/10.3390/su12166521
APA StyleLi, Y., Zhang, X., Zhu, S., Wang, X., Lu, Y., Du, S., & Shi, X. (2020). Transformation of Urban Surfaces and Heat Islands in Nanjing during 1984–2018. Sustainability, 12(16), 6521. https://doi.org/10.3390/su12166521