Article

Conventional Sewer Systems Are Too Time-Consuming, Costly and Inflexible to Meet the Challenges of the 21st Century

1
Institute for Resources, Environment and Sustainability, University of British Columbia, Vancouver, BC V6T 1Z4, Canada
2
Department of Physics, Chemistry and Biology (IFM), Linkoping University, 581-83 Linköping, Sweden
3
Resources for the Future, Washington, DC 20036, USA
*
Author to whom correspondence should be addressed.
Sustainability 2020, 12(16), 6518; https://doi.org/10.3390/su12166518
Submission received: 19 May 2020 / Revised: 20 July 2020 / Accepted: 3 August 2020 / Published: 12 August 2020
(This article belongs to the Section Economic and Business Aspects of Sustainability)

Abstract

:
There is an urgent need for innovation in the sanitation sector because the conventional model (toilet-to-sewer-to-treatment) is too time-consuming and costly, and alternatives are lacking. We estimate the challenge ahead by developing scenarios for 60 of the fastest-growing urban conglomerates in the World. We find that the majority would need to build out their sewer systems at a rate that is ten to 50 times higher than the highest rate for any project in the World Bank’s database, which is unrealistic. We also carry out a case study of Lagos, Nigeria, which suggests that, in any given year, 14–37% of Lagos State’s budget would need to be invested to provide sanitation to the presently underserviced population while keeping up with population growth, which also is unrealistic. Our study provides clear evidence that the conventional model for sanitation is unworkable for rapidly growing urban areas. We conclude there is an urgent need to encourage and fund projects that promote innovations that can tackle the three core challenges: can be built sufficiently quickly, are flexible, and affordable. This is not likely to happen unless the future generation is systematically trained and educated to creatively support innovation in sustainable sanitation.

Graphical Abstract

1. Introduction

There is an urgent need for innovation in the sanitation sector [1,2,3,4,5]: while the conventional sewer system—i.e., water toilets connected to sewers discharging from a central treatment plant—is too resource-demanding and inflexible, none of the alternative solutions can realistically meet the challenges of the 21st century. The need for innovation adapted to the conditions of rapidly growing urban settlements cannot be understated as the urban poor are grossly overrepresented in under-serviced areas. About a billion people live in such areas, and an increasing portion of urban population growth is taking place in informal settlements [6,7]. It is estimated that access to safe water and sanitation has the potential to alleviate close to 10% of global health issues [8,9,10].
‘Safe sanitation’ is commonly equated with the provision of water toilets and centralized sewers, drawing on experiences from the late 19th century in Europe and North America [11,12]. Developing a conventional sanitation system does, however, require long-term planning and stable financing as well as political competency and will. Underserviced areas today are often in locations where it is very challenging to install sewers because of the risk of inundations, land-slides or other biophysical realities [13]. To further complicate planning and development, urban growth is often haphazard and takes place within unfavourable socio-economic structures, such as tenant–landlord relationships [14].
For those who are directly engaged in research on sanitation in rapidly growing urban areas, this is old news [5,15,16]. Even so, the majority of sanitation projects funded by governments in developing countries and international organizations such as the World Bank and the United Nations (UN) rely heavily on the conventional approach. For example, the amount of funding directed to the provision of conventional sanitation solutions in India was 20 times higher than the funding directed to other solutions [17]. In this paper, we provide clear evidence that the conventional model for sanitation is unworkable in rapidly growing urban areas, drawing on officially available data from the World Bank and the UN. We discuss possible reasons for the observed lock-in to the conventional model and identify potential ways to move towards workable solutions.

2. Materials and Methods

2.1. Estimating Urban Growth Rates and Sanitation Coverage

Estimating the population of informal settlement is a difficult task. To increase the reliability of our estimates, we selected the World Bank database because it has a clear definition of illegal settlements (slums) and a clear methodology for assessing the population in such areas. We estimate population growth rates (for details, see Table S1), and collate data on sanitation coverage and the proportion of people living in informal settlements for the 20 fastest growing urban areas between (a) 300,000 and 5 million, (b) 5 million and 10 million, and (c) over 10 million. We used World Bank data for the percentage of the urban population living in informal settlements (population living in slums as per World Bank terminology) and the percentage of the national urban population not using improved sanitation facilities [18,19]. It should be mentioned that the World Bank’s definition of people living in informal settlements includes a lack of access to improved sanitation, and as such, these two variables cannot be considered entirely independent.

2.2. Estimating the Time It Takes to Provide Conventional Sewerage

To estimate the time it takes to provide conventional sewerage, we used data from projects that were recorded in the World Bank’s Projects and Operations Database (http://projects.worldbank.org/). This database is the only centralized source of quantitative information that we could find that provides information about the time it has taken to build actual sanitation projects. This database also provides data on build-out times for projects of varying sizes that have taken place in a variety of developing countries. We analyzed data for all projects that were implemented in urban areas and for which the number of people provided with access to improved sanitation facilities under the project was recorded. For each project reported in the World Bank data base that met our criteria we collected, when available, information on:
  • The baseline, i.e., the number of people with access to improved sanitation facilities at the start of the project;
  • The number of people with access to improved sanitation facilities at the end of the project;
  • The target, i.e., the number of people who were expected to be provided with access to improved sanitation facilities under the project; and
  • The date on which each of the baseline values is measured and the end date of each project.
To estimate the time it would take to sewer the 60 cities in our study, we first created two population growth scenarios. Estimating population growth in illegal settlements is challenging. Assuming that the rate is equal to the average growth rate in a city is likely to lead to an underestimate as the growth rate in illegal settlements commonly is higher than in other areas. Assuming that all growth in a city will take place in illegal settlements is likely to lead to an underestimate as it is some growth is likely to take place outside illegal settlements. Based on this reasoning, we created two scenarios for each city:
Scenario A: All population growth takes place in underserviced areas and no growth occurs in serviced areas. In this scenario, the number of people living in underserviced areas in 2030 is calculated as follows:
Urban population in 2015 × [Proportion of urban population in informal settlements + (1 + Annual growth rate)15 − 1]
As mentioned above, this scenario is likely to overestimate the number of people living in underserviced areas in 2030, as it is reasonable to assume that some growth takes place in areas that presently have access to proper sanitation.
Scenario B: Population growth is equal across each urban conglomerate, both in serviced and underserviced areas. In this scenario, the number of people living in underserviced areas in 2030 is calculated as follows:
Urban population in 2015 × Proportion of urban population in informal settlements × (1 + Annual growth rate)15
As also mentioned above, this scenario is likely to underestimate the number of people living in underserviced areas in 2030 as population growth in informal settlements and other underserviced areas generally is higher than in other areas [20].
For each of these two scenarios, we created two build-out scenarios to illustrate what percentage of the population would live in underserviced areas in 2030, assuming that (1) No new infrastructure is built, or (2) infrastructure is provided at the maximum rate reported by the World Bank. While the former most likely is an underestimate, as most locations are developing their infrastructure, the latter is likely to be an overestimate, as it seems as if most projects are proceeding at a slower rate than the maximum rate reported by the World Bank.

2.3. Estimating the Cost of Providing Conventional Sewerage

To explore how much it would cost to provide sewerage to fast-growing urban conglomerates, we use a case-study approach because the data needed to carry out the calculations needed for each of the 60 conglomerates are not readily available. In addition, there is no single cost framework that can be used to estimate build-out costs for a large number of dissimilar urban conglomerates. The uncertainties involved would consequently render a comparison of build-out costs across all 60 conglomerates meaningless. Our intent is to develop hypothetical scenarios, and use these to present the order of magnitude of the build-out cost for our case.

2.3.1. Case-Study: Lagos, Nigeria

We selected Lagos, Nigeria as our case study as there is comparably good access to demographic data, its estimated growth rate of 4.2% per year (Figure 1) is representative of rapid urban growth, and it is currently lagging in the provision of safe access to sanitation infrastructure, in particular in their large informal settlements [21]. At the national scale, 67% of urban residents do not have access to improved sanitation [19], and access is very inequitable within Lagos. For example, although 53% of household solid waste was collected, collection between areas varied between 4 and 73% in 2006 [22]. The majority of Lagos residents are not connected to central water, and wastewater is often managed through pit latrines or open drains, with severe effects on health [23]. Electricity and transportation infrastructure are also in a bad state, making improvements in sanitation difficult.
More than half of the population lives in informal settlements, with estimates varying from 50.2% [18] to 70% [24], and there is broad agreement that the relative portion of the population living in informal settlements will most likely increase. In the early 2000s, there were between 100 [24] and 200 informal settlements [23]. From 1984 to 2000, the area covered by informal settlements increased by 41% and is projected to go up to over 550 hectares by 2020, a 116% increase from 2000 [25]. Many of these communities, if not the majority, are located in coastal/lagoon areas where flooding is frequent and is projected to increase [24,26]. Although intense rainstorms have become less frequent between 1971 and 2005, events have become more intense, and Lagos is one of the top 50 cities considered most vulnerable to climate change and sea-level rise [24]. Residents of many informal settlements in Lagos are acutely vulnerable given their status as tenants (as opposed to owners) and the nature of building materials used for housing [24].

2.3.2. Estimating the Cost of Providing Conventional Sewerage Coverage for Lagos

Few studies provide cost estimates for sanitation infrastructure, and there is, to our knowledge, none for Lagos. It is thus not possible to provide a detailed cost account based on local data. We identified three studies that provide the type of data needed to estimate build-out costs in urban areas: the first from a peri-urban settlement outside Lima, Peru [27]; the second from the Guwahati Kamrup Metropolitan District (GKMDP) in India and the third from Darkhan Wastewater Management Project (DWMP) in Mongolia. We complemented these three costing approaches, which are based on simplistic costing estimates, with a fourth approach where we apply a highly detailed costing template to Lagos. We used the three case-based costing approaches and the costing-template approach to identify a probable range for the cost of building out sewer networks and treatment plants for the underserviced population in Lagos. For each approach, we carried out two estimates: one for the 2015 population and one for the projected 2030 population. The resulting build-out cost-estimates are admittedly rough, as they do not account for local pricing or the legal, political, and social context that would impact such pricing. For detailed values and calculations of population data and density estimates, see Tables S2 and S3.
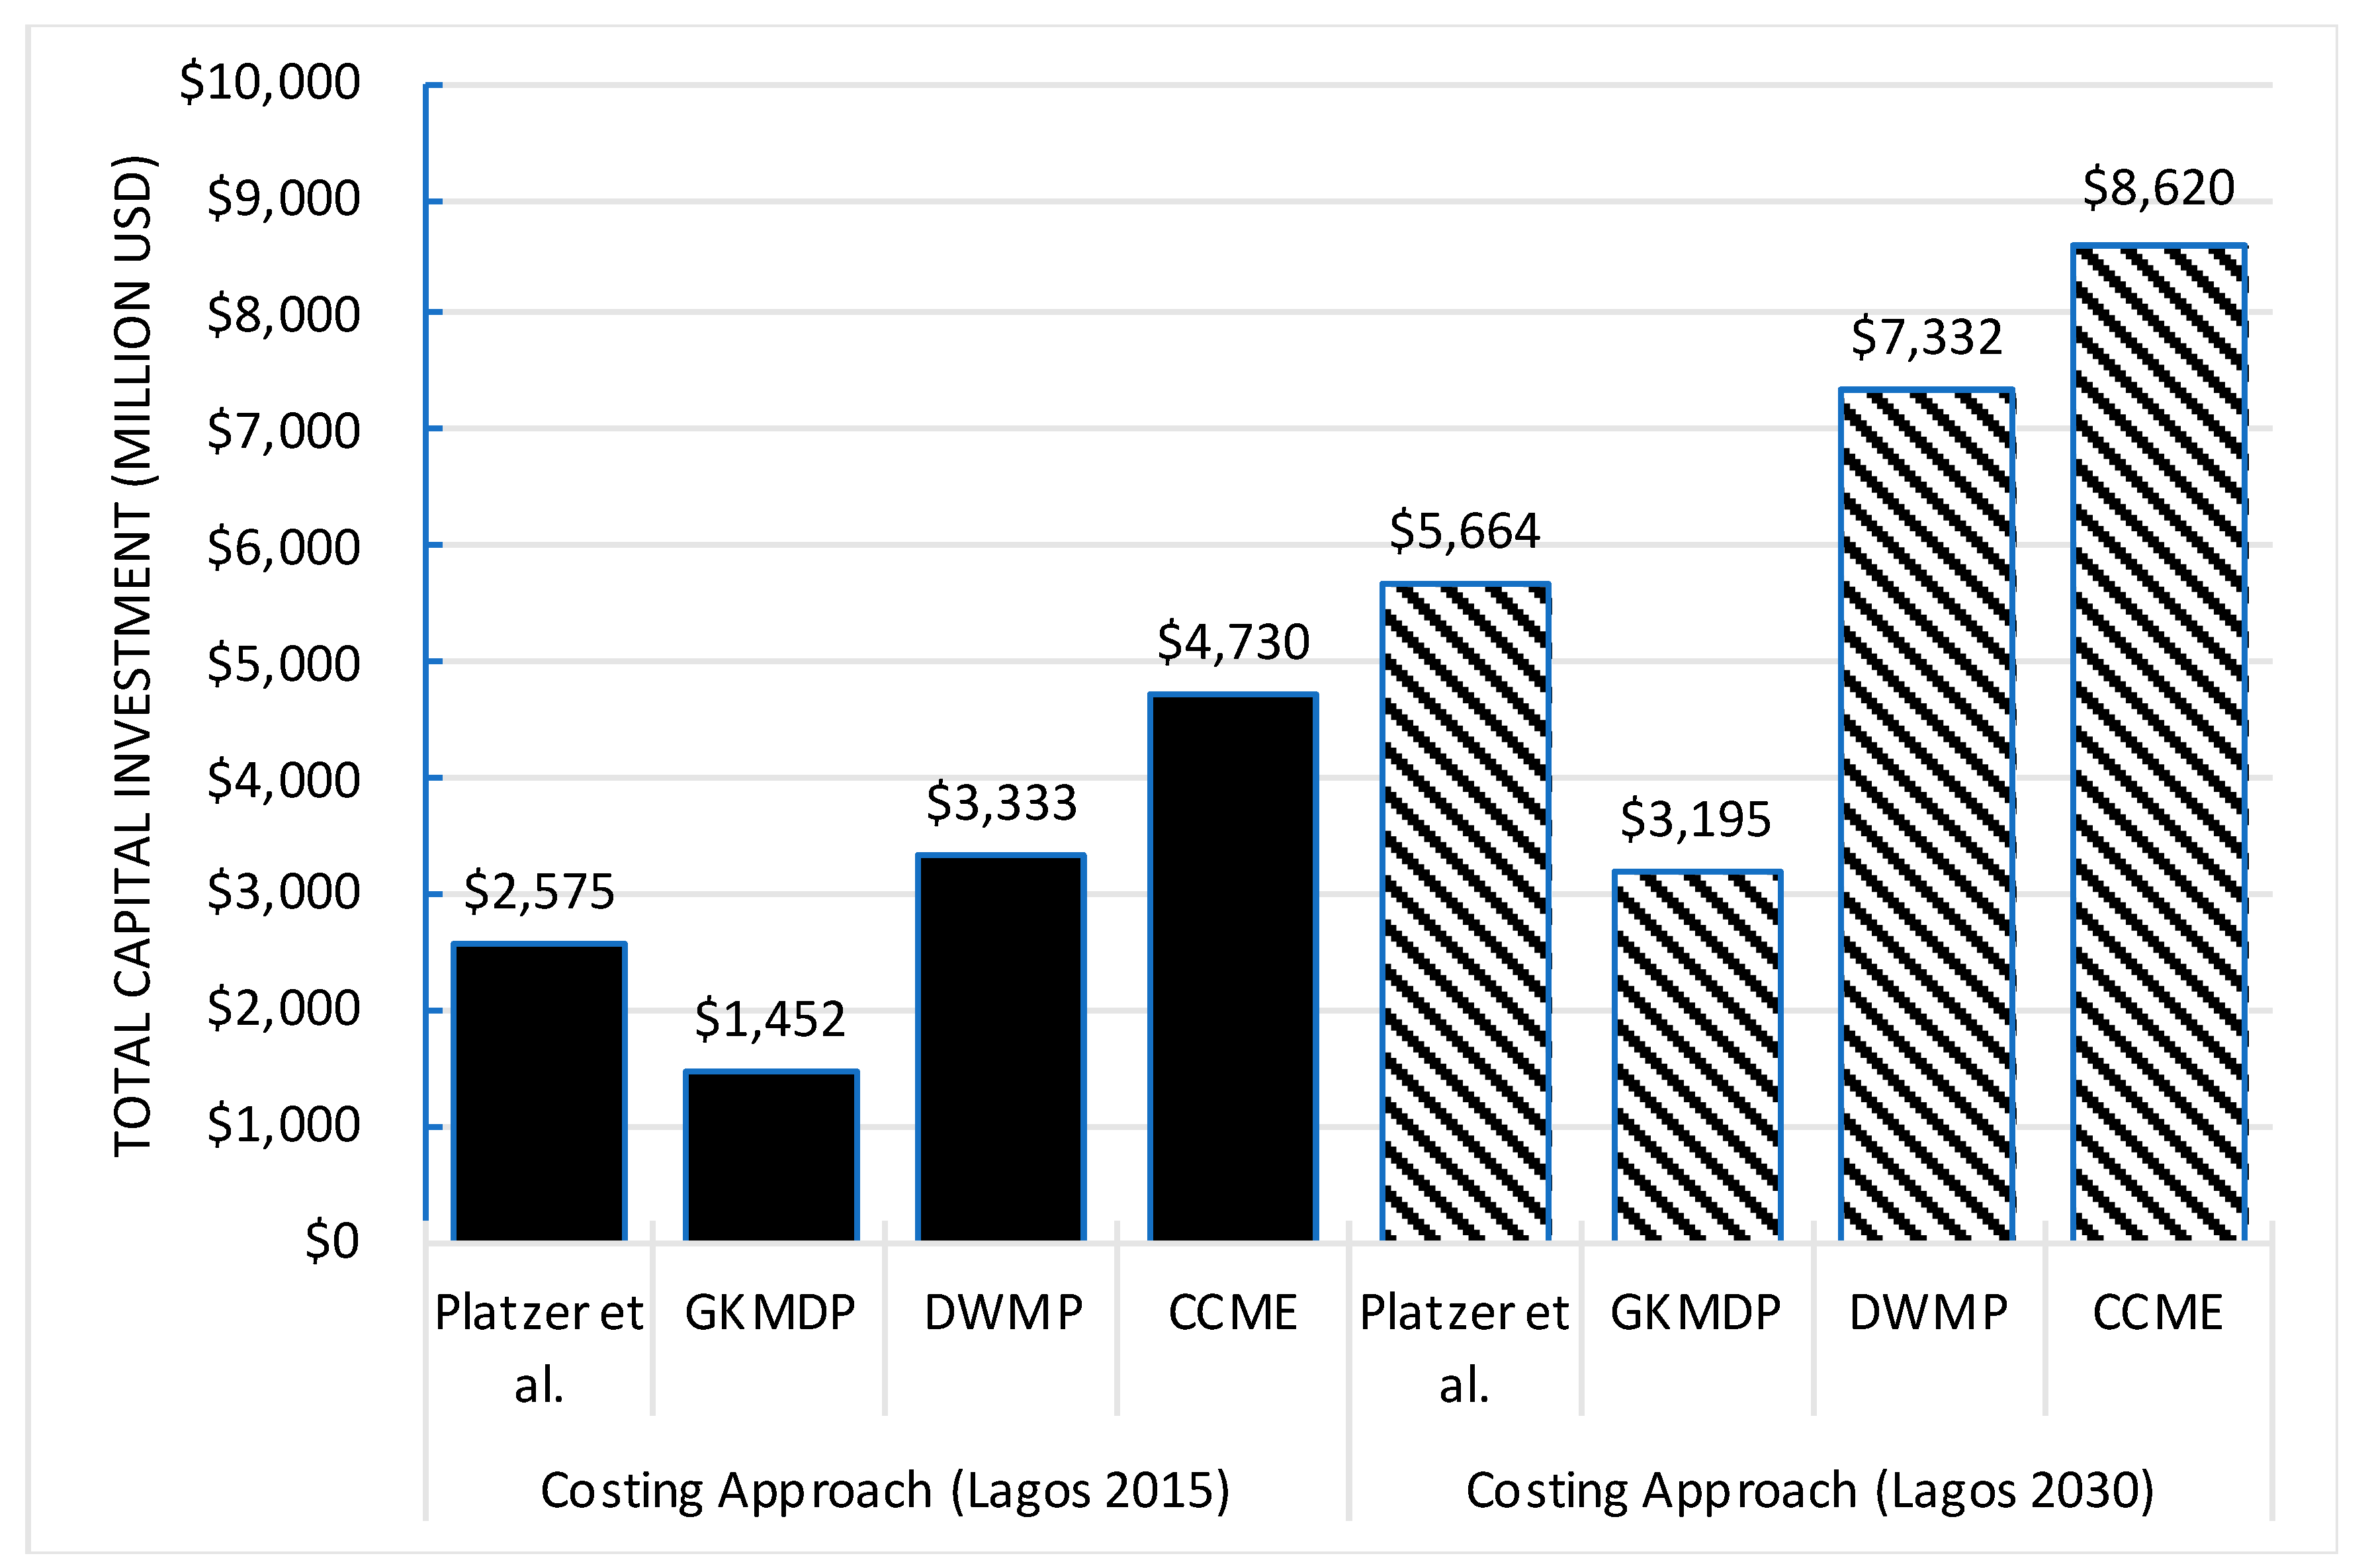
  • Costing approach #1 utilizes the estimated build-out costs for providing water-borne sanitation to approximately 40,000 inhabitants living in 10,000 households in a peri-urban settlement outside Lima, Peru [27]. The assumptions are carefully laid out and described in detail in the original paper; for example, the system considered by the authors uses lagoons for treatment. The costs estimated in this study vary from 1038 USD to 1227 USD per household, and include water provisioning. We scaled these costs to Lagos, using the higher cost estimate to account for uncertainty in constructing similar projects in Lagos, assuming five persons per household [28] and that there were 8.8 million people that needed new connections in 2015 and 19.4 million people in 2030. Population estimates were based on the World Bank estimates of the population in underserviced areas in 2015 and 2030, respectively. As noted by an anonymous reviewer, there are limitations in viewing cost as a relationship to population size, so all population-based costing, including those provided by Platzer et al. [27], should be viewed as rough estimates and subject to localized marginal costing.
  • Costing approaches #2 and 3 draw on the cost estimates for two conventional sewage projects: The GKMDP in India [29], reporting the construction of a wastewater treatment facility (with unknown treatment details) and sewerage network for South and East Guwahati. This project cost is estimated at 165 Million USD, providing services for 10.10 lakhs (1 million) people by 2020. The third, DWMP in Mongolia [30], is an ongoing Asian Development Bank supported project providing new treatment services and sewer network expansion for 50,000 residents at a total project cost of 18.9 million USD. For both of these costing approaches, we estimated the per capita cost and scaled these costs to Lagos’ 2015 and 2030 underserviced populations.
  • Costing approach #4 is included as a point of comparison for the case-based cost-approaches. This estimate is based on costing templates developed for the provision of sewers and treatment plants in Canada [31], and are thus based on the admittedly unrealistic assumption that it is possible to build sewers and treatment plants in Lagos at the same cost as in Canada. These cost estimates include the construction of a new treatment plant meeting primary treatment levels required to remove suspended solid waste and biochemical oxygen demand by 35%. Needed piping requirements for estimating collection system requirements for Lagos were derived using known pipe segments for the City of Calgary (personal communication the City of Calgary), proportioning the distribution of pipes from Calgary to Lagos (for details underlying the calculations, see Table S4).
These four cost estimates, although they do not account for savings at economies of scale, are conservative in that they do not account for full lifecycle costs and potentially more stringent future discharge regulations.

3. Results

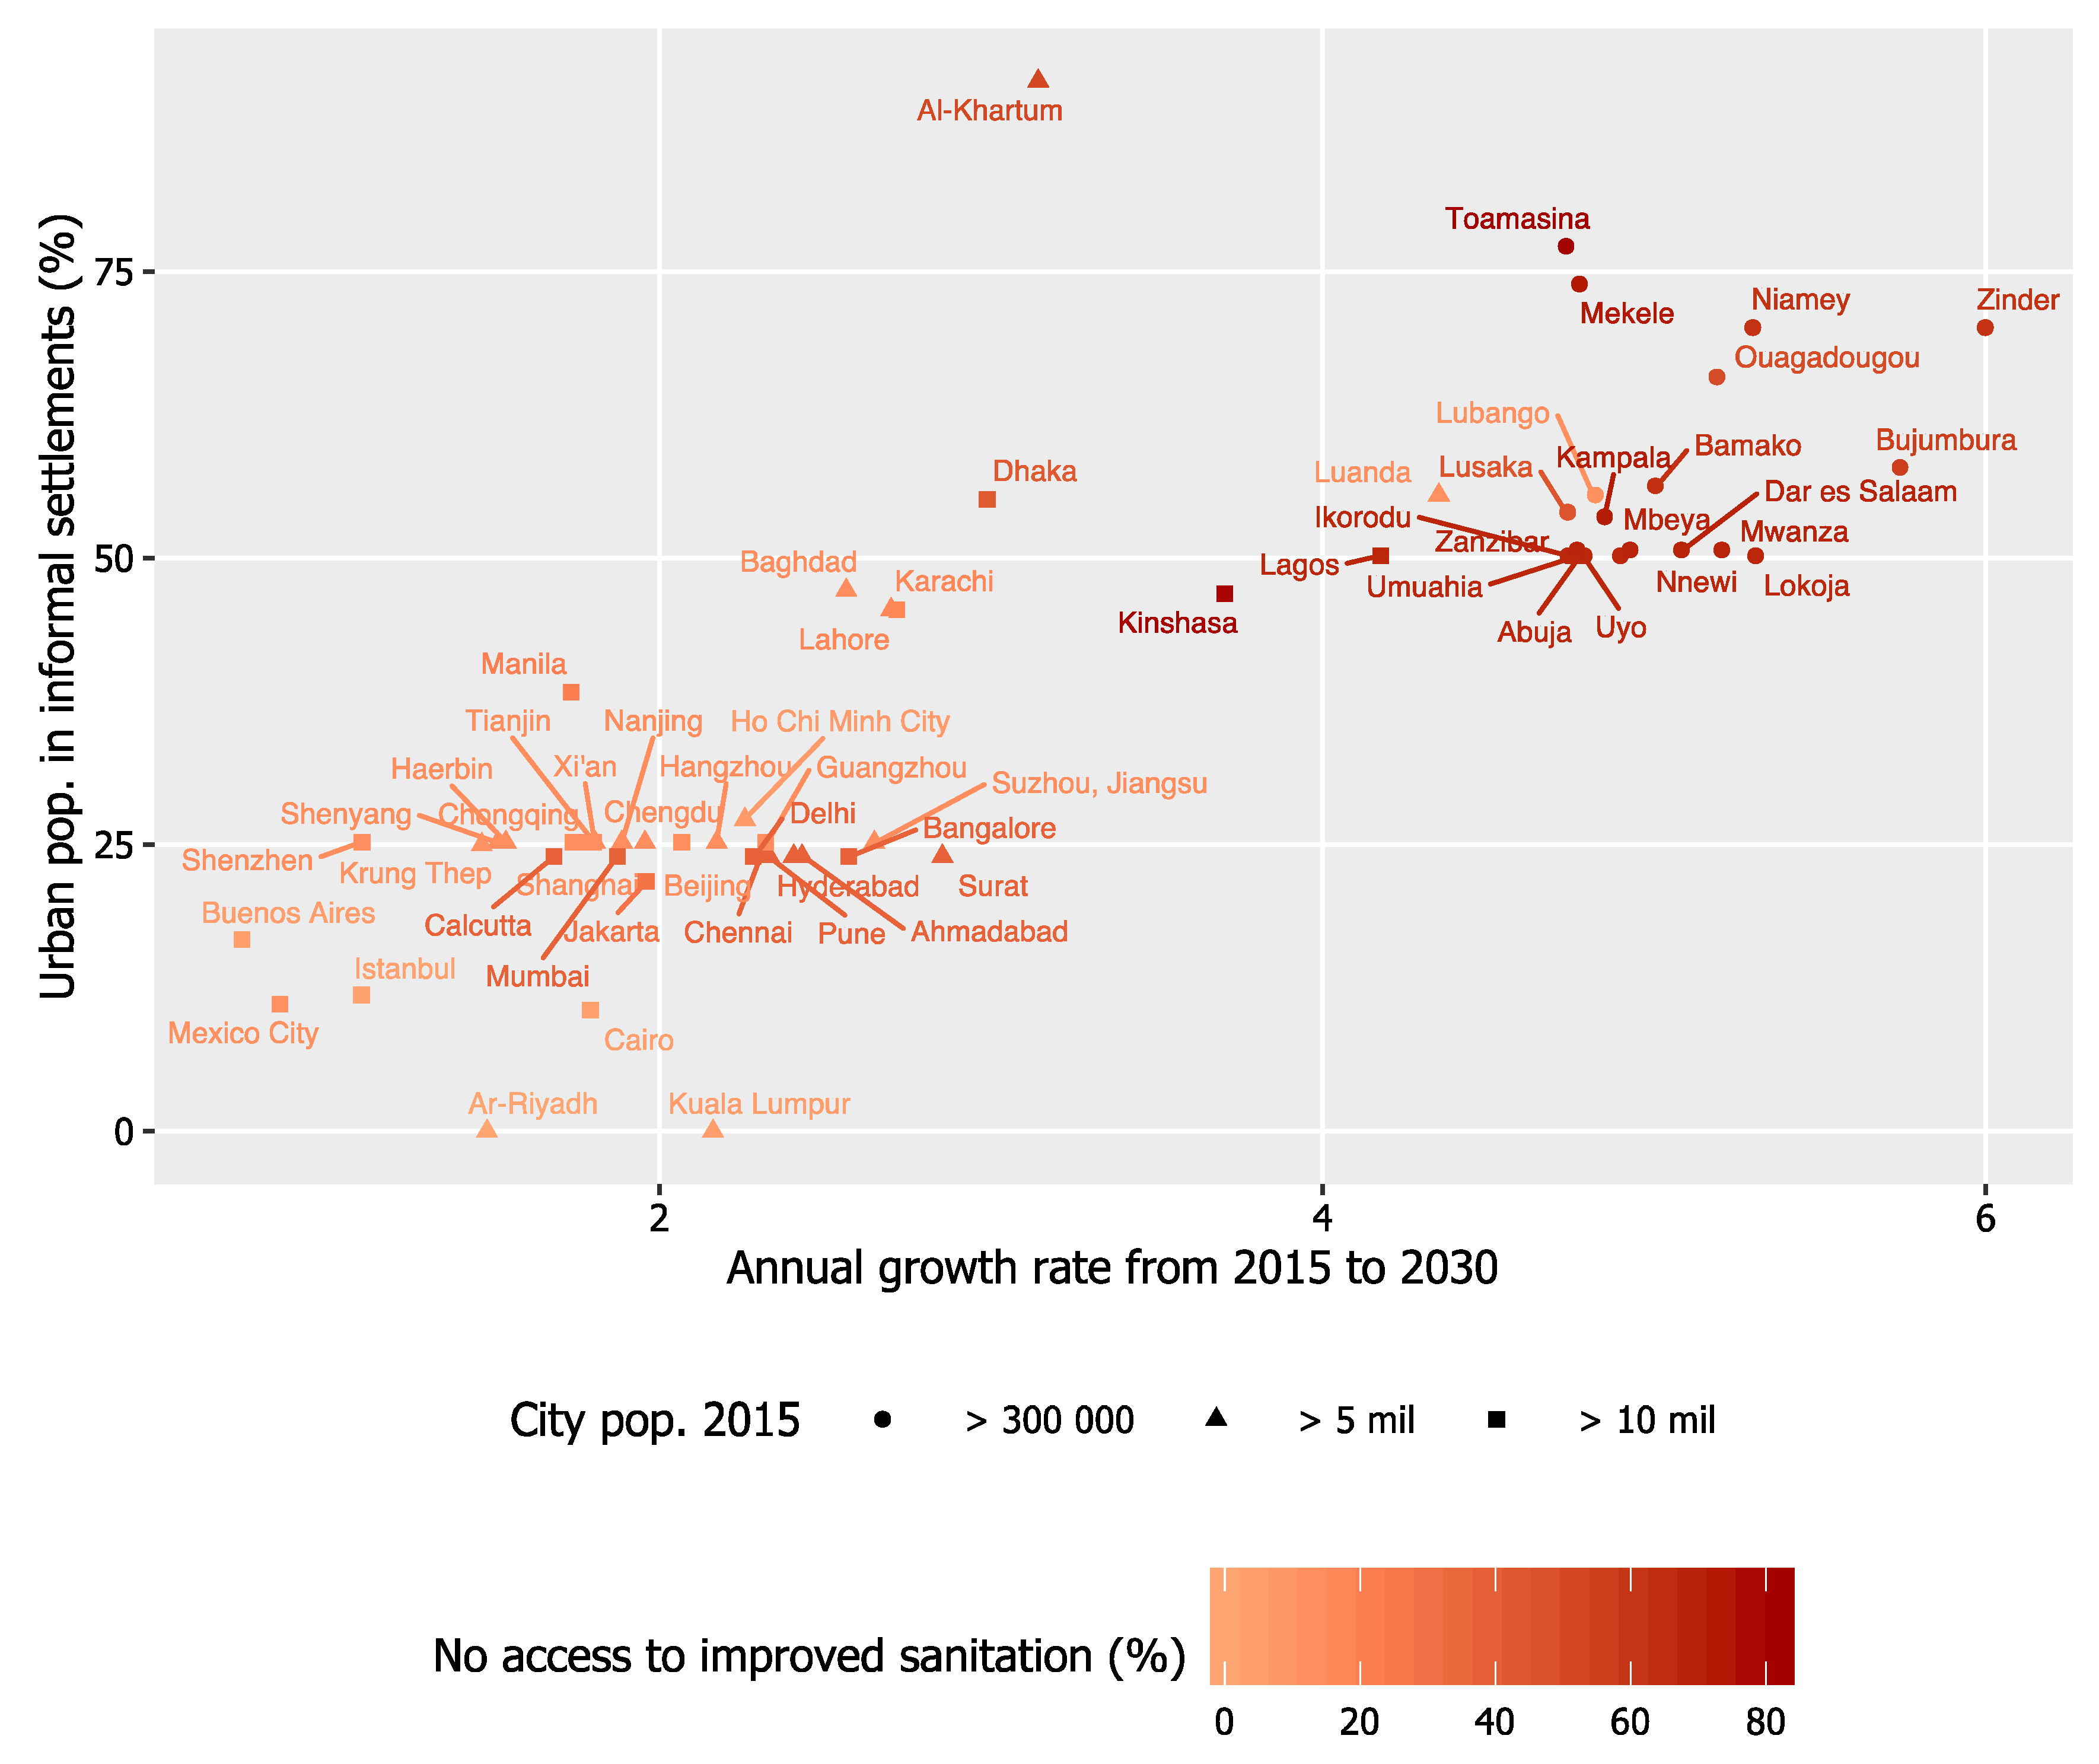
3.1. Urban Growth Rates and Sanitation Coverage

Population growth rates (Table S1), sanitation coverage and the proportion of people living in informal settlements for these conglomerates are shown in Figure 1. As illustrated in the figure, the proportion of people that live in informal settlements generally increases with the urban area’s population growth rate: While most cities with a growth rate below 1% provide improved sanitation to 100% of their inhabitants (light brown in Figure 1), those with a growth rate over 4% only manage to provide improved sanitation to half of their population, or less (dark brown in Figure 1).
The percentage of the urban population in informal settlements in our data is reported at the national level. The cluster seen around 25% of the population in informal settlements is due to that many of the fast-growing cities are located in India and China, where the reported national figures for informal settlements are 25.2% and 24%, respectively. Similarly, the clustering around 50% is linked to several large and fast-growing cities being located in Nigeria and Tanzania.
The cluster of cities with high growth rates in the upper right-hand corner of Figure 1 is dominated by cities with less than 300,000 inhabitants that are located in countries that have over 50% of their urban populations in informal settlements. The majority of the cities in this cluster are located in sub-Saharan Africa. The scenario suggests that the majority of the population in these cities will shortly be living in informal settlements, assuming that these growth-rates remain the same for the time being.

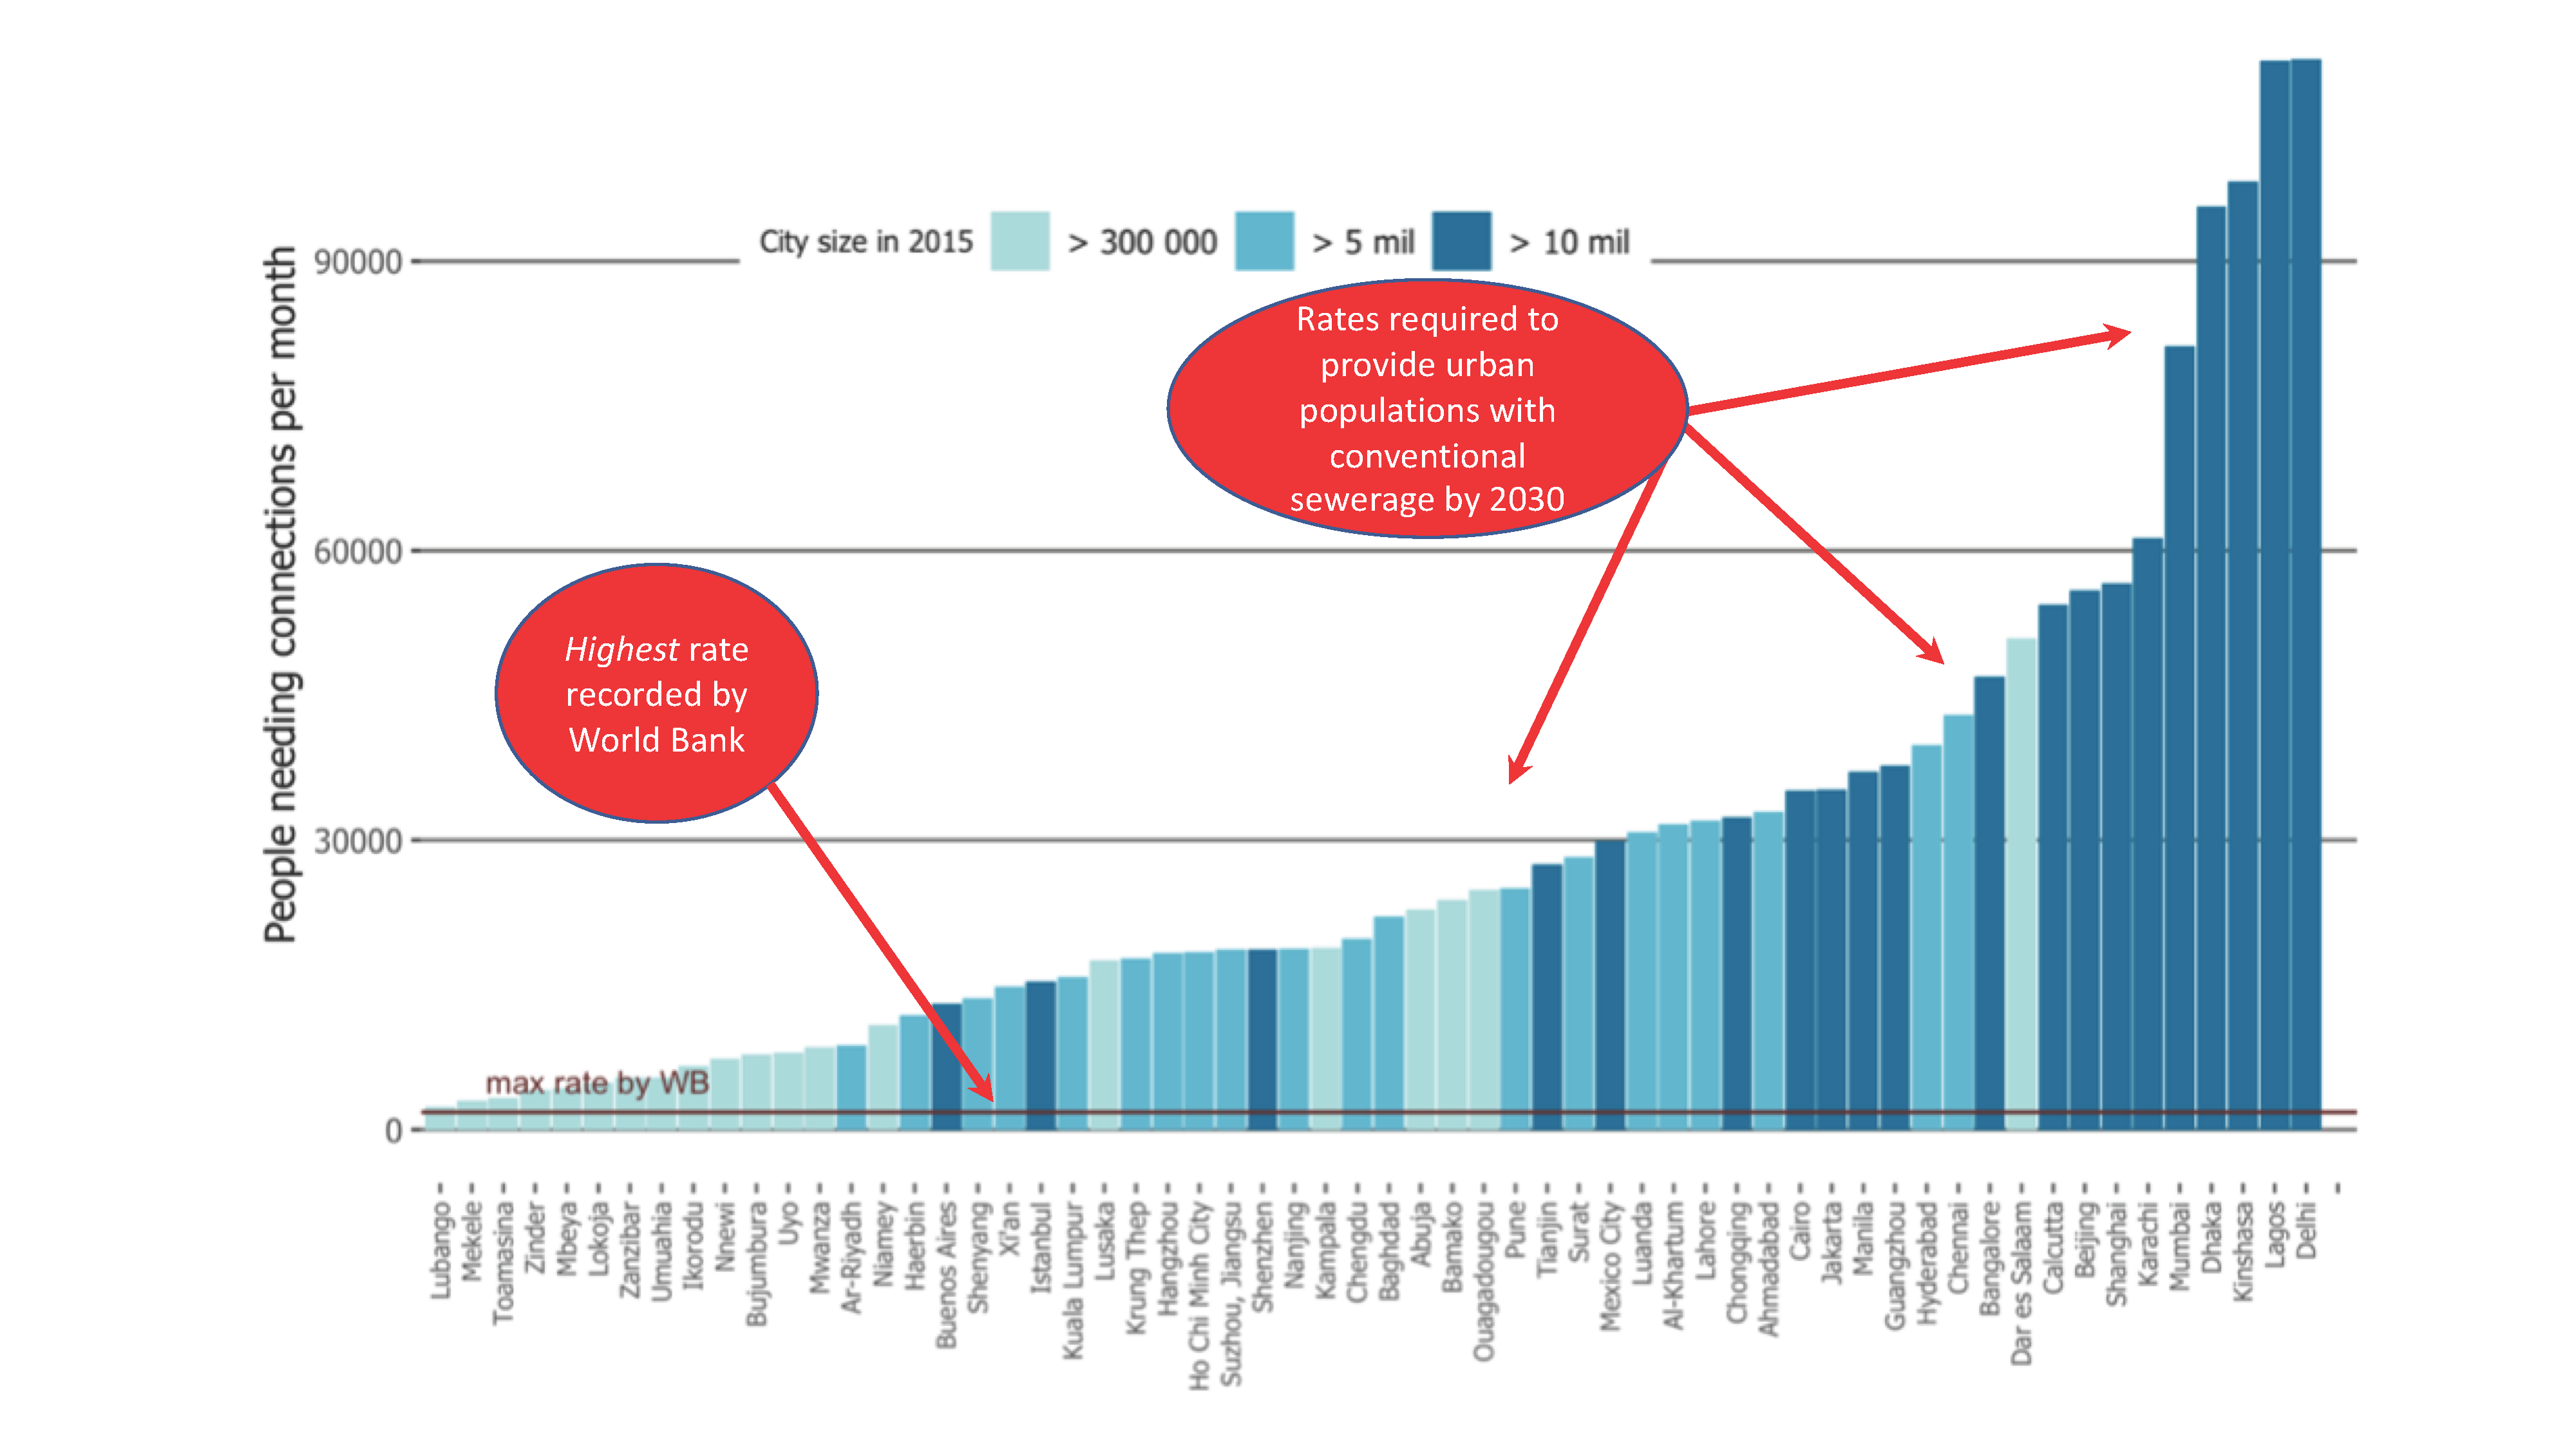
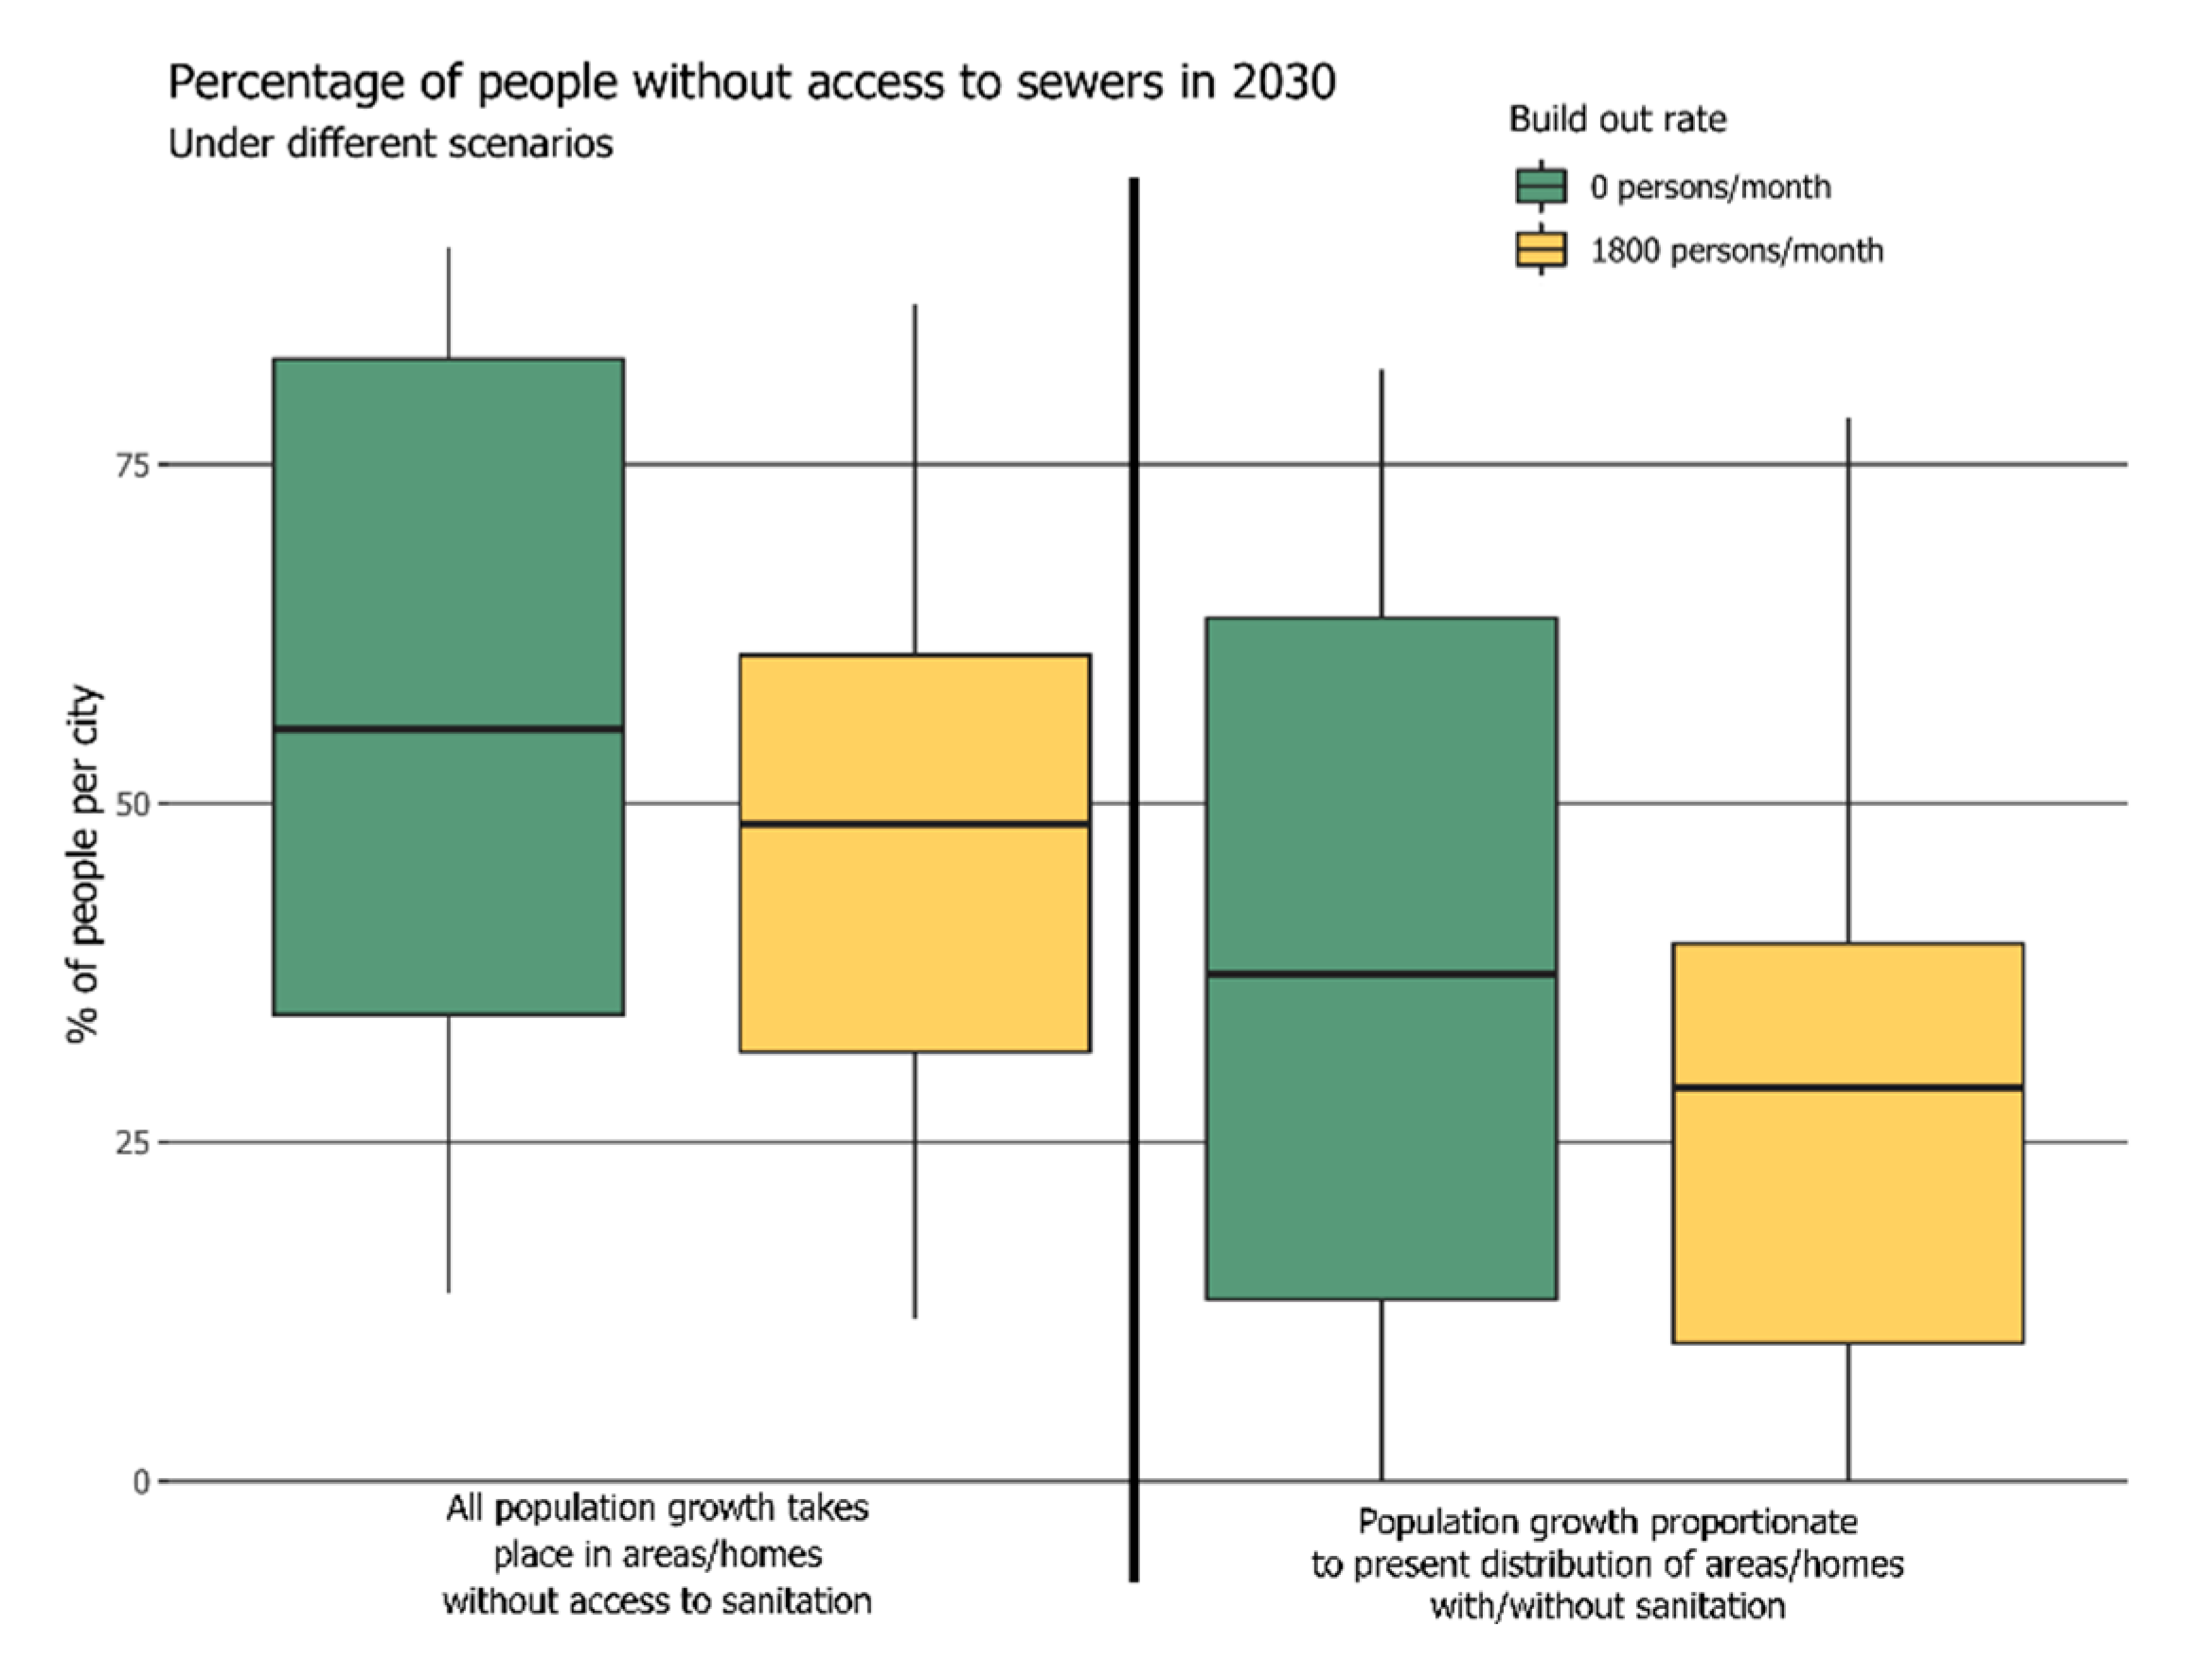
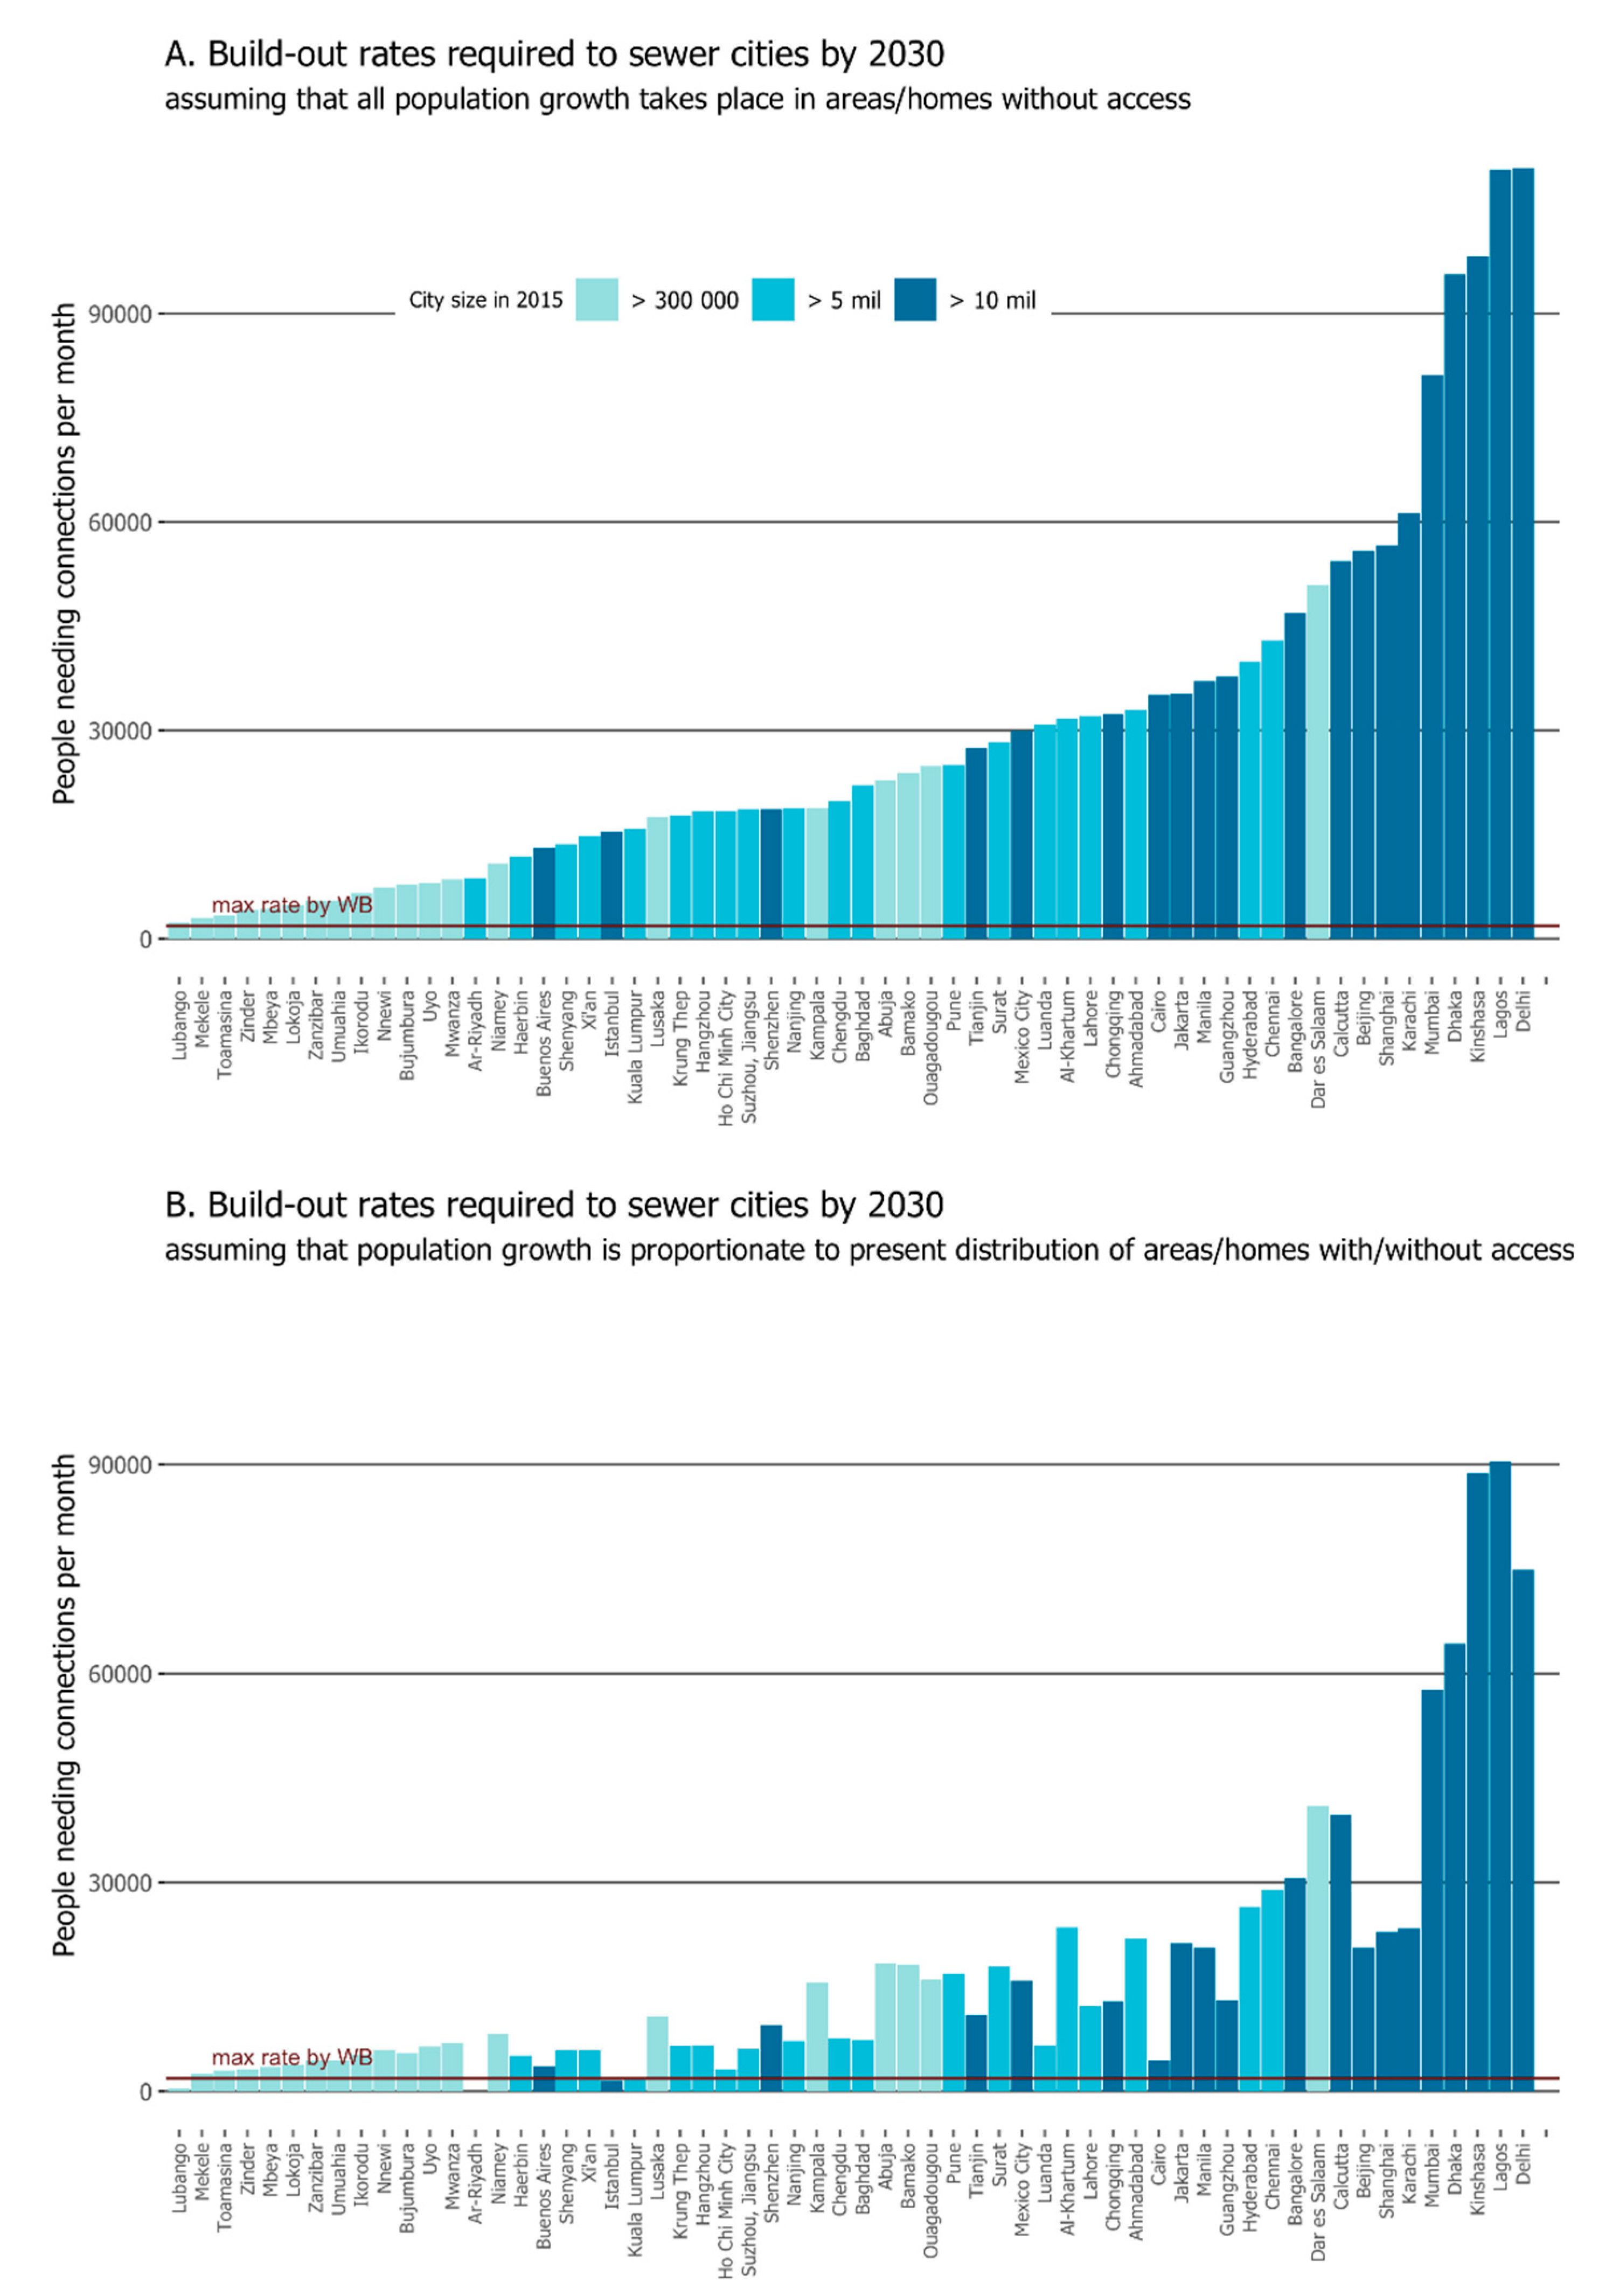
3.2. Characterizing the Build-Out Times for Providing Conventional Sewer Systems to the Entire Population of Selected Cities by 2030

The data compiled from the World Bank on sanitation projects (Table 1) suggest that it takes on average 1.4 months to provide 1000 people with access to improved sanitation facilities, assuming that World Bank-financed projects are typical. The highest build-out rate reported in the World Bank database is 1800 inhabitants per month. As seen in the table, projects generally take longer time than projected (the realized build-out rates in Table 1 are generally lower than the target build-out rates). This suggests that existing methods to predict the length of sanitation infrastructure projects tend to underestimate the time it actually takes to build this infrastructure.
Pessimistic and optimistic 2030 scenarios for the 60 urban conglomerates are shown in Figure 2. For the most pessimistic scenario, we assumed no development in sanitation infrastructure and that all population growth would take place in underserviced areas (Green box-plot, right-hand side of Figure 2). In this scenario, over half of the 60 conglomerates have more than half of their population living in underserviced areas by 2030, and the upper quartile would have over 75% of their population living in such areas.
For the most optimistic scenario, we assumed that it is possible to provide new people with access to improved sanitation at the maximum rate observed in the World Bank database, i.e., 1800 inhabitants per month, and that population growth would take place equally in all areas (yellow box-plot in the right-hand side of Figure 2). In this scenario, half of the cities would still have approximately 30% of their population living in underserviced areas.
The build-out rates that would be required if these 60 conglomerates are to provide their 2030 populations with access to conventional sewer service are shown in Figure 3. Under scenario A (all growth takes place in underserviced areas as per the upper panel of Figure 3), only Lubango, Angola would be able to provide their population with sanitation services, assuming that they would be able to maintain the build-out rate of 1800 inhabitants per month. If we assume that some type of development (technological, socio-economic) would allow a tripling of the rate at which new people are provided access to improved sanitation, or that the rate is increased by running two to three projects in parallel in each city, another seven locations might be able to provide their population with sanitation services. For the majority, however, the rate needed is ten to 50 times higher than the highest rate observed in the World Bank database, which clearly is unrealistic. The potential of increasing the rate by ramping up the number of projects run in parallel is limited as cities have a finite capacity for the number of sanitation projects at any given time, considering the number of ways a city can be divided up for centralized sewer systems. There would also be significant cost implications to ramping up the number of projects per city. It is also possible that the World Bank rates are misleadingly low, but we have failed to find data that suggest that this is the case. Even China, which often is hailed for its effectiveness in completing infrastructure projects, is struggling to close the sanitation gap [32].
Under the more optimistic scenario B, which assumes that the proportion of people in underserviced areas is constant over time (lower panel in Figure 3), two cities would be able to build out their sewer network and provide access for their entire population by 2030 at a build-out rate far below the World Bank rate—Lubango, Angola and Al-Riyadh, Saudi Arabia. Another six cities are close to being able to provide access to their entire population, and another 16 would be able to provide conventional sanitation to their population if they were able to triple the build-out rate. However, even under this optimistic scenario, the majority of cities would still require a build-out rate that is more than three times higher than the maximum rate reported by the World Bank. Notably, five of the fastest-growing megacities would require a build-out rate that higher than 50,000 persons per month (Delhi, India; Lagos, Nigeria; Kinshasa, Congo; Dhaka, Bangladesh, and Mumbai, India).

3.3. Characterizing the Cost for Providing Conventional Sewer Systems to the Entire Population in Lagos by 2030

Our admittedly rough cost estimates for Lagos are shown in Figure 4. These estimates suggest that between 1.5 and 4.7 billion USD would be needed to provide centralized sanitation services to meet current needs in Lagos. Keeping up with population growth would require an additional 1.7 to 4.0 billion USD to be invested (in 2019 figures). If we assume that this investment can be spread evenly over the years between 2019 and 2030, the annual cost for building, operating and maintaining the added sanitation system corresponds to 290 to 784 million USD per year. We hold these estimates to be representative of potential, but conservative, build-out costs. The estimates assume well-known and stable environmental conditions, and consequently, do not include additional complicating factors such as costs caused by land-slides or inundations. In addition, we assume a stable economic and socio-political context and the impact of unexpected socio-political events (e.g., strikes, lock-outs, demonstrations, social unrest) are not factored in. Because all of our assumptions for build-out costs err on the side of being conservative, actual costs are likely to be significantly higher.
To put the Lagos estimates in context, the total revenues in the 2017 budget of the Lagos State government was 2.1 billion USD [33]. This means that between 14% to 37% of Lagos State’s budget would need to be invested in any given year to provide conventional sanitation to the presently underserviced population while keeping up with population growth. It should be noted that this cost approaches the amount spent in 2016 by the Nigerian government on water, sanitation, and hygiene in the entire country [34]. To put the estimated costs for Lagos into further perspective: According to the US EPA, “the total capital wastewater and stormwater treatment and collection needs for the [United States] are $271 billion as of 1 January 2012.” [35]. Many communities in the US and elsewhere find it challenging to keep up the maintenance of their sanitation systems; even the costs correspond to less than 2% of US 2012 GDP [36]. Comparably, Metro Vancouver, B.C. Canada is a well-organized and wealthy urban region with a 2016 population of 2.45 million, an annual average population growth rate of 2% (1970 to 2011) that is fully sewered, but struggling to meet the goal of replacing 1% of its combined sewers per year (initiated in the 1970s) [37]. Likewise, according to the Asian Development Bank, Asia needs to invest $53 billion on water and sanitation and $1.7 trillion per year (2015 USD) on infrastructure overall to maintain growth, a challenging proposition when only 5% of GDP was spent on infrastructure across the 25 Asian Development Bank developing member countries between 2010 and 2014 [38].

4. Discussion

Rapid urbanization is a global phenomenon that undoubtedly has a significant impact on the ability to meet any and all Sustainable Development Goals [4,39,40]. Planning and maintenance are commonly outpaced, resulting in haphazard growth in illegal or semi-illegal settlements, making implementation a catch-up game. For one, an inherent feature of rapid growth is that it is difficult to predict [41]. A core reason why it is challenging to keep up with population growth is because at least a decade, or more, lapses between when a large infrastructure building-decision is made, and the infrastructure project is implemented, even in countries with well-functioning administration and governance. Our review of build-out rates reported by the World Bank illustrates that projects are commonly delayed (Table 1). This is a well-known phenomenon for large infrastructures in general, and potential sources of delay are commonly associated with administrative processes [42]. For example, building of sewer infrastructure often involves extensive budgetary processes, bidding and procurement stages, engineering analyses, and environmental impact assessments that may further increase the time between project conception and completion. Some jurisdictions may require public approval of projects in the form of referenda, which may add further delays. Sanitation projects happen in the context of many other resource and infrastructure priorities such as housing, drinking water, electricity, and transport, which further complicate matters. In some cases, there may be synergies; putting in a road or drinking water piping may be a good time to put in a sewage pipe; however, these issues are often managed by separate departments. Drinking water access and road access remain far more common in underserviced areas than centralized sewage systems, which demonstrates that sanitation is still managed as a separate issue. We also acknowledge that within one city, or even one neighborhood, different solutions may be needed.
Our review of data from the World Bank suggests that sanitation projects commonly have a completion rate as low as some hundred persons per month (Table 1). Even if projects managed to keep the maximum rate reported by the World Bank of 1800 persons per month, it would be far from sufficient, as clearly illustrated in Figure 2 and Figure 3. There is a staggering difference between the rates reported by the World Bank and those required to sewer rapidly growing urban areas: Our estimates do, for example, suggest that sewering Lagos’ population by 2030 would require that a whopping 111,000 inhabitants are given access on a monthly basis, on average. This means that the sewer system needs to be built-out at a rate that 60 times higher than the highest rates reported for World Bank projects, assuming that funding can be obtained to cover the cost of development, operation and maintenance. To claim that this appears unrealistic is an understatement. Our study focuses on conventional sewer systems. It would undeniably be valuable to have research showing the effectiveness of alternative solutions to centralized sewer systems. However, given that these alternative solutions are rarely implemented on a larger scale, and many of the applications are in non-urban settings, we are not aware of any datasets that allow for an analysis of build-out rates or costs. As such, an analysis of build-out rates and costs for distributed/local/alternative sanitation solutions is beyond the scope of our paper.
Our study demonstrates that the oft-drawn parallel between today’s urbanization and the urbanization that took place in late 19th century Europe and North America is profoundly misguided. Putting forth large-scale infrastructure that builds on the linear end-of-pipe model (water toilet to sewer to treatment plant) as the be-all-end-all solution, is quixotic in the deepest sense of the word. The population growth rate in London at the end of the 19th century pales in comparison to the rates of the fastest-growing urban areas of today: nineteenth-century London was the largest city in the World at the time, with its 1 million inhabitants. During its most rapid growth phase (1851–1871), London’s population growth rate approached 3%, but for the rest of the time it was considerably lower, fluctuating around 1%. At that rate, it took London approximately 50 years to double its population from 1 to 2 million [43]. In stark contrast, several cities in the World of today are growing at a rate of over 4%, which means that they double their populations in less than 20 years. Furthermore, the urban population at the end of the 19th century was only a few percent of the total world population. In comparison, the urban population in 2014 accounted for 54% of the total global population, up from 34% in 1960. The proportion living in urban areas is expected to continue to grow, with an estimated 70–80 million people per year added to urban areas [44]. Even with the aggressive sewage expansion and treatment plant construction occurring in China, its largest cities are still completing sewerage transportation systems with lower build out rates than population growth [32].
As pointed out by others: planning and implementation of conventional sewer systems are simply too slow and too inflexible [4,5,39].
Further evidence lies in the many examples of major sanitation projects that have failed to deliver on time. A core reason why it is time-consuming and challenging to build conventional sewer systems is that rapid and uncontrolled urban growth, as a rule, leads to the occupation of areas that are sub-optimal for housing, such as old garbage dumps and brownfields (contaminated soil, corrosive environments), areas with high groundwater tables that are prone to inundations, and sloped areas that are prone to land-slides [45,46]. Construction of infrastructure on this type of land is more challenging as compared to areas that are not subject to environmental hazards. In addition, many informal settlements, if not the majority, are located in coastal/lagoon areas where flooding is frequent. For example, Lagos, Mumbai, Dhaka and Buenos Aires are all prone to flooding because of a combination of low-lying land along the coast, poor drainage and a changing coastline [23,47,48]. In situations of heavy rain, inadequate sanitation infrastructure thus becomes a substantial health risk. In all four cases, and many other coastal cities, the challenges related to inundations are likely to increase as a result of climate change in combination with increased urbanization [24,49]. The lag between planning and implementation is often seen not only for projects in the developing world such as Mumbai and Luanda [6], but also for projects in the developed world, such as in Metro Vancouver [50] and in the Capital Regional District [51], both in British Columbia Canada.
Taken together, there is clear evidence that the construction of conventional sewer systems is too time-consuming, too costly, and too inflexible to be a workable solution for the challenges of the 21st century. However, we hasten to note that alternatives to conventional sewer systems also have their short-comings. Arguably, conventional sewer systems were developed in response to the short-comings of onsite solutions [5,12,52,53]: pit-latrines and septic tanks are ineffective in densely populated areas because they require access to land, among other reasons. Many other applications of alternative sanitation solutions are in their relative infancy, with pilot projects and evaluations that are regionally limited [54]. Existing research also finds that the principles on which alternative sanitation solutions have been designed are not always observed in practice, leading to reduced performance and problems being experienced in the field [55]. Socio-economic and regulatory barriers also abound. Gaining understanding and acceptance of sustainable sanitation alternatives has proven to be a challenge [56,57], and analysis shows that significant barriers also include present law and regulations and lower priority for water and nutrients in the schemes of municipal responsibilities [58]. As a result, we are left with no easy solutions to the rapidly increasing sanitation gap in many developing countries, which is driven by urban growth.

5. Conclusions

If household-scale approaches are unworkable and large-scale centralized sewer systems are too slow, inflexible and costly, what then is the solution? As of yet, we do not know. What we do know is that future sanitation systems must be flexible enough to meet rapid and haphazard growth, build-out rates must be realistic in light of projected population growth, and costs need to be reasonable in relation to available funding, as demonstrated in this study and pointed out by many others [4,5,39,59,60]. Considerable development has taken place in the sanitation field since the toilet-sewer-discharge model was put in place [61,62,63]. Several studies have set out to tackle the sanitation crisis in rapidly growing urban areas [1,3,16,64,65,66,67,68,69,70,71,72,73,74]. Even so, solutions that meet all three criteria have not yet materialized. The question is, why? Or put differently, what is hindering innovation?
It is commonly held that carefully structured education efforts play a central role when the goal is to change perceptions that are commonly accepted and deeply held [75,76,77,78]. The sanitation sector is heavily dominated by and dependent on engineering, and the innovative potential is consequently heavily influenced by the way engineers are trained. Sanitary engineering was born in response to societal changes in the late 19th to early 20th century [79], and the curriculum has since successively been altered in response to changing societal concerns and expectations [80,81,82,83,84]. Several authors have stressed the need to include knowledge about economic, social, and cultural issues in engineering education [85,86], and a few argue that there is a need to include knowledge regarding the unsustainability of the conventional sewer/sanitation model [9,87].
Although the academic literature is grappling with the need for sustainable sanitation, a review of engineering curricula in some of the World’s highest-ranked engineering schools such as the Massachusetts Institute of Technology, University of California-Berkeley, Stanford University, and Nanyang Technological University (NTU) suggests that this interest in sustainable solutions has not yet translated to training. Most textbooks and curricula at introductory and lower-level courses related to sanitation take the conventional model for granted. Sanitation topics are generally presented as a sub-section of water-related problems, presumes the existence of water toilets, sewers and treatment plants and are commonly used as examples in introductory courses on hydraulics and water supply management. Very few course descriptions or textbooks spell out the size of the challenge involved in providing safe sanitation to rapidly growing areas, and even fewer point out that the sanitation gap is increasing or that the conventional system cannot meet the demands of the 21st century. All in all, this suggests that, rather than learning about the challenges involved in reducing the sanitation gap, students’ perception of the conventional model as the ‘gold standard’ is reinforced during the first years. In this light, it is perhaps not surprising that a large part of research, innovation and development presumes the existence of a conventional system and tends to address processes in treatment plants, i.e., at the ‘end of the pipe’ [88,89,90]. In order words, although innovative alternatives do exist and are piloted in both low- and high-income countries, these solutions have yet to be scaled up in education curricula and practice to create a ‘new normal’ for sustainable and universal sanitation provision. One of the core lessons learnt from alternative sanitation pilots is a need to look at sanitation provision not as a technological issue, but also a user experience and governance one: transforming how we teach, and plan and finance sanitation projects is necessary [2,91].
The work presented here is to our knowledge the first analysis to use data on sewer network build-out times and costs—as opposed to anecdotal information—to show that conventional sewer systems are an unrealistic solution for expanding sanitation coverage in rapidly growing cities with informal settlements. Our findings provide empirical evidence supporting what many analyses in the alternative and decentralized sanitation literature have put forward: centralized sewers are not the way of the future. There is an urgent need to further encourage and fund projects that promote innovation and answer to the three core challenges: deploying solutions that
(1)
can be built sufficiently quickly,
(2)
are flexible, and
(3)
affordable.
This is not likely to happen unless the future generation is trained and educated to creatively support innovation in sustainable sanitation.

Supplementary Materials

The following are available online at https://www.mdpi.com/2071-1050/12/16/6518/s1, Table S1: Growth rates in each of the three categories: current population (a) between 300,000 and 5 million; (b) between 5 million and 10 million; and over 10 million using 2015 and 2030 population estimates (UN 2014), Table S2: Demographic data for Lagos in 2015, sources and clarification of calculations made in the paper, Table S3: Estimated demographic data for Lagos in 2030, sources and clarification of calculations made in the paper. Table S4: Estimated build out costs using Canadian Council of Ministers of the Environment costing templates and other case study data, sources and clarification of calculations made in the paper.

Author Contributions

Conceptualization, G.Ö.; methodology, formal analysis and visualization: G.S.M. (Section 3.1 and Section 3.2); Y.K. (Section 3.2); S.A.C. (Section 3.3); writing—original draft preparation, G.Ö., G.S.M., Y.K., S.A.C.; writing—review and editing, G.Ö., G.S.M., Y.K., S.A.C.; visualization, G.S.M. (Section 3.1 and Section 3.2); S.A.C. (Section 3.3); project administration, G.Ö. All authors have read and agreed to the published version of the manuscript.

Funding

This work was supported by the National Socio- Environmental Synthesis Center (SESYNC) under funding received from the National Science Foundation DBI-1052875.

Conflicts of Interest

The authors declare no conflict of interest.

References

  1. Andersson, K.; Dickin, S.; Rosemarin, A. Towards “Sustainable” Sanitation: Challenges and Opportunities in Urban Areas. Sustainability 2016, 8, 1289. [Google Scholar] [CrossRef] [Green Version]
  2. Tilley, E.; Strande, L.; Lüthi, C.; Mosler, H.-J.; Udert, K.M.; Gebauer, H.; Hering, J.G. Looking beyond technology: An integrated approach to water, sanitation and hygiene in low income countries. Environ. Sci. Technol. 2014, 48, 9965–9970. [Google Scholar] [CrossRef] [PubMed]
  3. Katukiza, A.Y.; Ronteltap, M.; Niwagaba, C.B.; Foppen, J.W.A.; Kansiime, F.; Lens, P.N.L. Sustainable sanitation technology options for urban slums. Biotechnol. Adv. 2012, 30, 964–978. [Google Scholar] [CrossRef] [PubMed]
  4. Ormerod, K.J. Illuminating elimination: Public perception and the production of potable water reuse. Wiley Interdiscip. Rev. Water 2016. [Google Scholar] [CrossRef] [Green Version]
  5. Black, M.; Fawcett, B. The Last Taboo: Opening the Door on the Global Sanitation Crisis; Routledge: Boca Raton, FL, USA, 2010; p. 272. [Google Scholar]
  6. UN-Habitat. Planning Sustainable Cities: Global Report on Human Settlements 2009; Routledge: Boca Raton, FL, USA, 2016. [Google Scholar]
  7. Mahabir, R.; Crooks, A.; Croitoru, A.; Agouris, P. The study of slums as social and physical constructs: Challenges and emerging research opportunities. Reg. Stud. Reg. Sci. 2016, 3, 399–419. [Google Scholar] [CrossRef] [Green Version]
  8. Pruss-Ustun, A.; Bos, R.; Gore, F.; Bartram, J. Safer Water, Better Health: Costs, Benefits and Sustainability of Interventions to Protect and Promote Health; World Health Organization: Geneva, Switzerland, 2008. [Google Scholar]
  9. Andersson, K.; Otoo, M.; Nolasco, M. Innovative sanitation approaches to address multiple development challenges. Water Sci. Technol. 2017, 77, 855–858. [Google Scholar] [CrossRef]
  10. Cutler, D.; Miller, G. The role of public health improvements in health advances: The twentieth-century United States. Demography 2005, 42, 1–22. [Google Scholar] [CrossRef]
  11. Lofrano, G.; Brown, J. Wastewater management through the ages: A history of mankind. Sci. Total Evrion. 2010, 408, 5254–5264. [Google Scholar] [CrossRef]
  12. George, R. The Big Necessity: The Unmentionable World of Human Waste and Why It Matters; Picador: London, UK, 2014. [Google Scholar]
  13. Isunju, J.; Schwartz, K.; Schouten, M.; Johnson, W.; van Dijk, M.P. Socio-economic aspects of improved sanitation in slums: A review. Public Health 2011, 125, 368–376. [Google Scholar] [CrossRef]
  14. Smit, S.; Musango, J.K.; Kovacic, Z.; Brent, A.C. Conceptualising slum in an urban African context. Cities 2017, 62, 107–119. [Google Scholar] [CrossRef]
  15. Peal, A.; Evans, B.; Blackett, I.; Hawkins, P.; Heymans, C. Fecal sludge management (FSM): Analytical tools for assessing FSM in cities. J. Water Sanit. Hyg. Dev. 2014, 4, 371–383. [Google Scholar] [CrossRef] [Green Version]
  16. Larsen, T.A.; Hoffmann, S.; Lüthi, C.; Truffer, B.; Maurer, M. Emerging solutions to the water challenges of an urbanizing world. Science 2016, 352, 928–933. [Google Scholar] [CrossRef] [PubMed]
  17. Hutchings, P.; Johns, M.; Jornet, D.; Scott, C.; Van den Bossche, Z. A systematic assessment of the pro-poor reach of development bank investments in urban sanitation. J. WaterSanit. Hyg. Dev. 2018, 8, 402–414. [Google Scholar] [CrossRef] [Green Version]
  18. The World Bank. Population Living in Slums (% of Urban Population)|Data. Available online: http://data.worldbank.org/indicator/EN.POP.SLUM.UR.ZS?display=default252020&end=2014&start=1990&view=chart (accessed on 24 August 2019).
  19. The World Bank. Urban Development|Data. Available online: http://data.worldbank.org/topic/urban-development (accessed on 24 August 2019).
  20. UN-Habitat. State of the World’s Cities 2012/2013; United Nations Human Settlements Programme: Nairobi, Kenya, 2013.
  21. United Nations Department of Economic and Social Affairs. World Urbanization Prospects: The 2014 Revision, Highlights. Available online: https://esa.un.org/unpd/wup/publications/files/wup2014-highlights.Pdf (accessed on 9 June 2019).
  22. Kunnuji, M. Spatial variations in access to improved sanitation and water in Lagos state. J. Water Sanit. Hyg. Dev. 2014, 4, 612–619. [Google Scholar] [CrossRef]
  23. Gandy, M. Learning from Lagos. New Left Rev. 2005, 33, 37. [Google Scholar]
  24. Adelekan, I.O. Vulnerability of poor urban coastal communities to flooding in Lagos, Nigeria. Environ. Urban. 2010, 22, 433–450. [Google Scholar] [CrossRef] [Green Version]
  25. Barredo, J.I.; Demicheli, L.; Lavalle, C.; Kasanko, M.; McCormick, N. Modelling future urban scenarios in developing countries: An application case study in Lagos, Nigeria. Environ. Plan. B 2004, 31, 65–84. [Google Scholar] [CrossRef] [Green Version]
  26. Gandy, M. Planning, anti-planning, and the infrastructure crisis facing metropolitan Lagos. In Cities in Contemporary Africa; Springer: Berlin/Heidelberg, Germany, 2006; pp. 247–264. [Google Scholar]
  27. Platzer, C.; Hoffmann, H.; Ticona, E. Alternatives to Waterborne Sanitation–a Comparative Study–Limits and Potentials. In Proceedings of the IRC Symposium: Sanitation for the Urban Poor, Delft, The Neatherlands, 19–21 November 2008. [Google Scholar]
  28. Amao, J.; Oluwatayo, I.; Osuntope, F. Economics of fish demands in Lagos state, Nigeria. J. Hum. Ecol. 2006, 19, 25–30. [Google Scholar] [CrossRef] [Green Version]
  29. Government of Assam. JICA Assisted Guwahati Sewerage Project. Available online: https://gmdwsb.assam.gov.in/portlets/jica-assisted-guwahati-sewerage-project (accessed on 23 June 2019).
  30. Asian Development Bank. Mongolia: Darkhan Wastewater Management Project. Available online: https://www.adb.org/projects/37697-025/main#project-pds (accessed on 23 June 2019).
  31. Canadian Council of Ministers of the Environment. User Guidance for the Wastewater Treatment and Collection System Costing Templates. Available online: https://www.ccme.ca/files/Resources/municipal_wastewater_efflent/cost_template_user_guide_e.pdf (accessed on 27 April 2019).
  32. Wu, G.; Miao, Z.; Shao, S.; Jiang, K.; Geng, Y.; Li, D.; Liu, H. Evaluating the construction efficiencies of urban wastewater transportation and treatment capacity: Evidence from 70 megacities in China. Resour. Conserv. Recycl. 2018, 128, 373–381. [Google Scholar] [CrossRef]
  33. Lagos State Government. Ministry of Economic Planning and Budget. Available online: http://mepb.lagosstate.gov.ng/ (accessed on 27 April 2019).
  34. UN Water and WHO. Financing Universal Water, Sanitation, and Hygine Under the Sustainable Development Goals. In GLAAS 2017 Report; World Health Organization: Geneva, Switzerland, 2017. [Google Scholar]
  35. US EPA. Clean Watersheds Needs Survey (CWNS)—2012 Report and Data. Available online: https://www.epa.gov/cwns/clean-watersheds-needs-survey-cwns-2012-report-and-data (accessed on 27 April 2019).
  36. The World Bank. GDP (Current US$). Available online: https://data.worldbank.org/indicator/NY.GDP.MKTP.CD?locations=US (accessed on 27 April 2019).
  37. Metro Vancouver. Available online: http://www.metrovancouver.org/ (accessed on 27 April 2019).
  38. Asian Development Bank. Meeting Asia’s Infrastructure Needs. Available online: http://dx.doi.org/10.22617/FLS168388-2 (accessed on 23 June 2019).
  39. Biswas, A.K. Water Management for Major Urban Centres. Water Resour. Dev. 2006, 22, 183–197. [Google Scholar] [CrossRef]
  40. Varis, O.; Biswas, A.K.; Tortajada, C.; Lundqvist, J. Megacities and Water Management. Int. J. Water Resour. Dev. 2006, 22, 377–394. [Google Scholar] [CrossRef]
  41. Alberti, M. Grand Challenges in Urban Science. Front. Built Environ. 2017, 3. [Google Scholar] [CrossRef] [Green Version]
  42. Singh, R. Delays and cost overruns in infrastructure projects: Extent, causes and remedies. Econ. Political Wkly. 2010, 45, 43–54. [Google Scholar]
  43. Landers, J.; John, L. Death and the Metropolis: Studies in the Demographic History of London, 1670–1830; Cambridge University Press: Cambridge, UK, 1993; Volume 20. [Google Scholar]
  44. WHO. Urban Population Growth. Available online: http://www.who.int/gho/urban_health/situation_trends/urban_population_growth_text/en/ (accessed on 27 April 2019).
  45. Baker, J.L. Climate Change, Disaster Risk, and the Urban Poor: Cities Building Resilience for a Changing World; World Bank Publications: Washington, DC, USA, 2012. [Google Scholar]
  46. Ayuero, J.; Swinstun, D.A. Flammable: Environmental Suffering in an Argentine Shantytown; Oxford University Press: Oxford, UK, 2009. [Google Scholar]
  47. Cirelli, A.F.; Ojeda, C. Wastewater management in Greater Buenos Aires, Argentina. Desalination 2008, 218, 52–61. [Google Scholar] [CrossRef]
  48. Ordoqui Urcelay, M.B. Servicios de Agua Potable y Alcantarillado en la Ciudad de Buenos Aires, Argentina: Factores Determinantes de la Sustentabilidad y el Desempeño; CEPAL: Santiago, Chile, 2007. [Google Scholar]
  49. Vitousek, S.; Barnard, P.L.; Fletcher, C.H.; Frazer, N.; Erikson, L.; Storlazzi, C.D. Doubling of coastal flooding frequency within decades due to sea-level rise. Sci. Rep. 2017, 7, 1399. [Google Scholar] [CrossRef] [PubMed]
  50. Oberg, G.; del Carmen Morales, M. The Idea of Sewage as a Resource: An Introductory Study of Knowledge and Decision Making in Liquid Waste Management in Metro Vancouver, BC. Canada. In Program on Water Governance; University of British Columbia: Vancouver, BC, Canada, 2012; pp. 1–46. [Google Scholar]
  51. Stubblefield, W.; Servos, M.R.; Gersberg, R.M.; Riley, C.; Simpson, D.; Smith, D.; Wells, P. Scientific and Technical Review. Capital Regional District Core Area Liquid Waste Management Plan. 2006. Available online: https://www.crd.bc.ca/docs/default-source/seaterra-pdf/related-articles/scientificandtechnicalreview.pdf (accessed on 27 April 2019).
  52. Gandy, M. Rethinking urban metabolism: Water, space and the modern city. City 2004, 8, 363–379. [Google Scholar] [CrossRef]
  53. Brown, R.R.; Keath, N.; Wong, T.H.F. Urban water management in cities: Historical, current and future regimes. Water Sci. Technol. 2009, 59, 847–855. [Google Scholar] [CrossRef]
  54. Brands, E. Prospects and challenges for sustainable sanitation in developed nations: A critical review. Environ. Rev. 2014, 22, 346–363. [Google Scholar] [CrossRef]
  55. Bhagwan, J.; Still, D.; Buckley, C.; Foxon, K. Challenges with up-scaling dry sanitation technologies. Water Sci. Technol. 2008, 58, 21–27. [Google Scholar] [CrossRef] [Green Version]
  56. Rosenquist, L.E.D. A psychosocial analysis of the human-sanitation nexus. J. Environ. Psychol. 2005, 25, 335–346. [Google Scholar] [CrossRef]
  57. McGranahan, G.; Mitlin, D. Learning from Sustained Success: How Community-Driven Initiatives to Improve Urban Sanitation Can Meet the Challenges. World Dev. 2016, 87, 307–317. [Google Scholar] [CrossRef]
  58. Berndtsson, J.C.; Hyvönen, I. Are there sustainable alternatives to water-based sanitation system? Practical illustrations and policy issues. Water Policy 2002, 4, 515–530. [Google Scholar] [CrossRef]
  59. McFarlane, C. Sanitation in Mumbai’s informal settlements: State, ‘slum’, and infrastructure. Environ. Plan. A 2008, 40, 88–107. [Google Scholar] [CrossRef] [Green Version]
  60. Orner, K.D.; Mihelcic, J.R. A review of sanitation technologies to achieve multiple sustainable development goals that promote resource recovery. Environ. Sci. Water Res. Technol. 2018, 4, 16–32. [Google Scholar] [CrossRef]
  61. Pradel, M.; Aissani, L.; Villot, J.; Baudez, J.-C.; Laforest, V. From waste to added value product: Towards a paradigm shift in life cycle assessment applied to wastewater sludge—A review. J. Clean. Prod. 2016, 131, 60–75. [Google Scholar] [CrossRef]
  62. Galli, G.; Nothomb, C.; Beatings, E. Towards Systemic Change in Urban Sanitation; IRC: The Hague, The Netherlands, 2014; pp. 1–36. [Google Scholar]
  63. Guest, J.S.; Skerlos, S.J.; Barnard, J.L.; Beck, M.B.; Daigger, G.T.; Hilger, H.; Jackson, S.J.; Karvazy, K.; Kelly, L.; Macpherson, L.; et al. A New Planning and Design Paradigm to Achieve Sustainable Resource Recovery from Wastewater. Evrion. Sci. Technol. 2009, 43, 6126–6130. [Google Scholar] [CrossRef] [Green Version]
  64. Orth, H. Centralised versus decentralised wastewater systems? Water Sci. Technol. 2007, 56, 259–266. [Google Scholar] [CrossRef] [PubMed]
  65. Andersson, K. Sanitation, Wastewater Management and Sustainability: From Waste Disposal to Resource Recovery. In UN Environmental Programme Global Programme of Action for the protection of the Marine Environment from Land Based Activities; Stockholm Environment Institute (SEI): Stockholm, Sweden, 2016. [Google Scholar]
  66. Balkema, A.J.; Preisig, H.A.; Otterpohl, R.; Lambert, F.J. Indicators for the sustainability assessment of wastewater treatment systems. Urban. Water 2002, 4, 153–161. [Google Scholar] [CrossRef]
  67. Massoud, M.A.; Tarhini, A.; Nasr, J.A. Decentralized approaches to wastewater treatment and management: Applicability in developing countries. J. Evrion. Manag. 2009, 90, 652–659. [Google Scholar] [CrossRef]
  68. Schoen, M.E.; Xue, X.; Wood, A.; Hawkins, T.R.; Garland, J.; Ashbolt, N.J. Cost, energy, global warming, eutrophication and local human health impacts of community water and sanitation service options. Water Res. 2017, 109, 186–195. [Google Scholar] [CrossRef]
  69. Roefs, I.; Meulman, B.; Vreeburg, J.H.G.; Spiller, M. Centralised, decentralised or hybrid sanitation systems? Economic evaluation under urban development uncertainty and phased expansion. Water Res. 2017, 109, 274–286. [Google Scholar] [CrossRef]
  70. Schmitt, R.J.P.; Morgenroth, E.; Larsen, T.A. Robust planning of sanitation services in urban informal settlements: An analytical framework. Water Res. 2017, 110, 297–312. [Google Scholar] [CrossRef] [Green Version]
  71. Narayanan, N.; Ray, I.; Gopakumar, G.; Argade, P. Towards sustainable urban sanitation: A capacity-building approach to wastewater mapping for small towns in India. J. Water Sanit. Hyg. Dev. 2017, 8, 227–237. [Google Scholar] [CrossRef]
  72. Tsinda, A.; Abbott, P.; Pedley, S.; Charles, K.; Adogo, J.; Okurut, K.; Chenoweth, J. Challenges to Achieving Sustainable Sanitation in Informal Settlements of Kigali, Rwanda. Int. J. Environ. Res. Public Health 2013, 10, 6939. [Google Scholar] [CrossRef] [PubMed]
  73. Parkinson, J.; Tayler, K. Decentralized wastewater management in peri-urban areas in low-income countries. Wastewater Manag. 2003, 15, 75–89. [Google Scholar]
  74. Van Welie, M.J.; Romijn, H.A. NGOs fostering transitions towards sustainable urban sanitation in low-income countries: Insights from transition management and development studies. Environ. Sci. Policy 2017, 84, 250–260. [Google Scholar] [CrossRef]
  75. Apple, M.W. Can Education Change Society; Routledge: Boca Raton, FL, USA, 2012. [Google Scholar]
  76. Shor, I. Empowering Education: Critical Teaching for Social Change; University of Chicago Press: Chicago, IL, USA, 2012. [Google Scholar]
  77. Westheimer, J.; Kahne, J. What kind of citizen? The politics of educating for democracy. Am. Educ. Res. J. 2004, 41, 237–269. [Google Scholar] [CrossRef] [Green Version]
  78. Brookfield, S. The power of critical theory for adult learning and teaching. Adult Learn. 2005, 85, 440. [Google Scholar]
  79. Anderson, W.C. A history of environmental engineering in the United States. Environ. Water Resour. Hist. 2003. [Google Scholar] [CrossRef]
  80. Smith, D.W.; Biswas, N. Environmental engineering education in Canada. J. Evrion. Eng. Sci. 2002, 1, 1–7. [Google Scholar] [CrossRef]
  81. Malina, J.F.; Gloyna, E.F. History of Environmental Engineering at the University of Texas at Austin. In Environmental and Water Resources: Milestones in Engineering History; American Society of Civil Engineers: Reston, VA, USA, 2007; pp. 36–43. [Google Scholar]
  82. Leonard, K.M. Brief History of Environmental Engineering: “The World’s Second Oldest Profession”. In Proceedings of the International Engineering History and Heritage, Reston, VA, USA, 10–13 October 2001; pp. 389–393. [Google Scholar]
  83. Logsdon, G.S. The future of environmental engineering education. J. Environ. Eng. Sci. 2008, 7, 1–4. [Google Scholar]
  84. Hansen, D.; Kells, J.A. Environmental engineering education in Canada: Discussion. Can. J. Civ. Eng. 2002, 29, 185–187. [Google Scholar] [CrossRef]
  85. Mattson, C.A.; Wood, A.E. Nine Principles for Design for the Developing World as Derived From the Engineering Literature. J. Mech. Des. 2014, 136. [Google Scholar] [CrossRef] [Green Version]
  86. Iyer-Raniga, U.; Andamon, M. Sustainability education in the engineering and built environment curriculum: The case for Asia-Pacific. In Proceedings of the 5th International Conference of Conference of Education, Research and Innovation (iCERI), Madrid, Spain, 19–21 November 2012. [Google Scholar]
  87. Gaulke, L.; Borgford-Parnell, J.; Stensel, H. A decentralized and onsite wastewater management course: Bringing together global concerns and practical pedagogy. Water Sci. Technol. 2008, 58, 1397–1404. [Google Scholar] [CrossRef]
  88. Lofrano, G. Green Technologies for Wastewater Treatment; Springer Science & Business Media: Berlin/Heidelberg, Germany, 2012; p. 92. [Google Scholar] [CrossRef] [Green Version]
  89. Daigger, G.T. Evolving Urban Water and Residuals Management Paradigms: Water Reclamation and Reuse, Decentralization, and Resource Recovery. Water Evrion. Res. 2009, 81, 809–823. [Google Scholar] [CrossRef] [PubMed]
  90. Libralato, G.; Volpi Ghirardini, A.; Avezzù, F. To centralise or to decentralise: An overview of the most recent trends in wastewater treatment management. J. Evrion. Manag. 2012, 94, 61–68. [Google Scholar] [CrossRef] [PubMed]
  91. Hoffmann, S.; Feldmann, U.; Bach, P.M.; Binz, C.; Farrelly, M.; Frantzeskaki, N.; Hiessl, H.; Inauen, J.; Larsen, T.A.; Lienert, J. A Research Agenda for the Future of Urban Water Management: Exploring the Potential of Nongrid, Small-Grid, and Hybrid Solutions. Environ. Sci. Technol. 2020, 54, 5312–5322. [Google Scholar] [CrossRef]
Figure 1. The proportion of inhabitants living in informal settlements plotted as a function of the growth rate for the most rapidly growing urban conglomerates in the World [18]. Access to sanitation is superimposed: the darker the colour, the larger the number of inhabitants without access to proper sanitation [19]. Data are shown for three groups of urban conglomerates: populations between 300,000 and 5 million (circles); 5 million and 10 million (triangles); and over 10 million (squares) (United Nations, 2014). The figure allows zooming in for increased readability as needed. For list of cities and growth rates, see Table S1.
Sustainability 12 06518 g001
Figure 2. Pessimistic and optimistic scenarios for the proportion of the population in 60 fast-growing cities that would live in underserviced areas in 2030. The left-hand panel assumes that all population growth takes place in underserviced areas (clearly an overestimation). The right-hand panel assumes that population growth is equally fast in all areas (clearly an underestimation). The green boxes assume that no new infrastructure is provided (clearly an overestimation), and the yellow boxes assume that the build-out rate matches the maximum rate reported by the World Bank (1800 persons/month—clearly an underestimation).
Sustainability 12 06518 g002
Figure 3. The two scenarios illustrate the build-out rate required to provide the population in fast-growing cities with conventional sanitation. Scenario A assumes that all growth takes place in underserviced areas (overestimation), and scenario B assumes that growth is equally high in all areas [underestimation. Data from: 21]. The maximum build-out rate reported by the World Bank (1800 persons per month) is provided as a horizontal line at the bottom of both graphs.
Sustainability 12 06518 g003
Figure 4. Estimated build-out cost for providing sanitation to 100% of the population in Lagos, Nigeria, in 2015 and 2030 using four different costing approaches. The first three use data from empirical studies carried out in other locations: in a peri-urban area in Lima (Platzer et al.), the Guwahati Kamrup Metropolitan District in India (GKMDP) and the Darkhan Wastewater Management Project in Mongolia (DWMP). The fourth (CCME) utilizes a Canadian costing-template. Estimates are based on demographic data from the UN and the World Bank, and are reported in 2019 USD.
Sustainability 12 06518 g004
Table 1. People provided with access to improved sanitation for projects reported in the World Bank’s Projects and Operations database (http://projects.worldbank.org/).
CountryGeographic ScopeCost
($ M)
Start (Year)Rate (Persons/Month)
TargetActual
BrazilMetropolitan Sao Paulo233.502007461251
VietnamDistrict towns and large urban centers135.002005629366
VietnamLao Cai, Vinh, and Phu Ly285.00201126161236
VietnamUrban areas in project provinces236.2020118041809
MoroccoSelected towns in project provinces75.1020101548692
GhanaGreater Accra Metropolitan Area150.0020133676168
ArgentinaProvince and City of Buenos Aires1000.002015658378
KenyaNairobi City, Mombasa, Coastal, and Nzoia Region159.3120112378
EthiopiaAddis Ababa and four secondary cities. 119.00201222,3191568
VietnamCity of Quy Nhon26.682007449456

