Article

Neighbourhood Social Resilience (NSR): Definition, Conceptualisation, and Measurement Scale Development

by
Taimaz Larimian
1,*,
Arash Sadeghi
2,
Garyfalia Palaiologou
1 and
Robert Schmidt III
1
1
School of Architecture, Building and Civil Engineering, Loughborough University, Loughborough LE113UE, UK
2
Aston Business School, Aston University, Department of Economics, Finance and Entrepreneurship, Aston University, Birmingham B47ER, UK
*
Author to whom correspondence should be addressed.
Sustainability 2020, 12(16), 6363; https://doi.org/10.3390/su12166363
Submission received: 1 July 2020 / Revised: 29 July 2020 / Accepted: 31 July 2020 / Published: 7 August 2020

Abstract

:
The literature on social resilience lacks a precise definition of this concept and a clear guideline on how to measure it. Particularly, social resilience at the neighbourhood scale has received remarkably little scholarly attention. This study contributes toward filling these gaps in the literature by developing and empirically testing the neighbourhood social resilience (NSR) model as a robust and reliable measurement instrument that integrates various aspects of this complex concept into one coherent and fine-grained psychometric model. The reliability and validity of the NSR model are empirically tested using questionnaire data collected from 234 respondents in five neighbourhoods of Dunedin city, New Zealand. Furthermore, a more nuanced definition for neighbourhood social resilience is provided. Results indicate that social resilience is a second-order and multidimensional concept incorporating eight dimensions. Each of these dimensions captures a distinct piece in the jigsaw of social resilience; therefore, failure to incorporate all dimensions may provide an incomplete picture of this complex phenomenon. Our research bridges the gap between top-down approach of stakeholders and policymakers and bottom-up perceptions and expectations of residents about social resilience of their urban neighbourhood.

1. Introduction

Resilience, as an umbrella term, has been studied in different disciplines and contexts and has continued to spark the interest of academics and policymakers alike. More recently, the debates around resilience have moved beyond the dominant focus on environmental and economic resilience and involve areas such as social resilience [1]. A review of the literature suggests that, despite the theoretical and practical significance of social resilience, it has remained one of the least understood and most under-researched domains of resilience [2,3].
Research into social resilience is confined by several shortcomings. First, previous studies have not converged upon a common ground for defining social resilience, and it has remained an embryonic concept [4,5]. Current definitions of social resilience are rather fuzzy and confusing, mostly disaster-focused, and conceptually blurred with the concept of community resilience. Second, the literature is scattered and confined by lack of uniformly implemented and widely accepted approach for measuring social resilience concept [6]. The existing conceptualisations and operationalisations of social resilience lack consistency in dimensions and indicators and can lead to mixed and conflicting results [7], which potentially undermine their usefulness. Part of the difficulty is attributed to social resilience being a multi-dimensional concept [8]. There is currently little consensus on what characteristics to measure and, as in the case of disaster resilience [7], this can lead to uncoordinated measurement methods and conflicting assessments.
Third, with a few exceptions (e.g., [2]), prior studies have mainly focused on social resilience at the urban [3,9] and regional [10,11] scales or on the person or household level [12,13]. Notably, the intermediate local or neighbourhood scale has been largely understudied and some important questions about the spatial dimensions of social resilience remain unanswered [14]. There is a need for empirical evidence to explore the interdependencies between social resilience and built environment at the local level. Recent studies confirm the gap and potential contribution of geographically defined empirical assessments of locally based resilience [1,15].
Fourth, there is a disconnect between top-down scientific knowledge and bottom-up local knowledge [16]. Top-down assessment models largely neglect the role of residents’ judgments in defining and measuring social resilience. Despite the plethora of resilience measurement models and tools that are promoted and used by built environment disciplines, very few have emerged from participatory and integrative approaches [17]; an even smaller number of participatory measurement models refer specifically to social resilience at the neighbourhood scale.
Finally, with a few exceptions [18,19], there has been little effort to explore the potential contribution of a robust yet flexible quantitative participatory method, such as psychometric approach for measuring social resilience. Lack of attention to quantitative psychometric studies limits the potential for large-scale participation in policymaking for social resilience. Existing models that consider the views of residents in assessing social resilience are primarily qualitative [1] or rely on descriptive statistics [20]; thus, rigorous statistical reliability and validity tests have remained out of their scope. The development of a robust and uniformly accepted psychometric measurement model for social resilience can make a strong contribution to the literature in this area and address challenges in comparing and contrasting empirical findings. Quantitative assessment is not proposed here to replace in-depth qualitative input, which is typically delivered via the workshop dialogue method [16]. Instead, quantitative input can complement and expand stakeholder participation and inclusivity whilst utilising quantitative semantics, which remain the preferred language of policymaking [21]. This is particularly relevant in countries where technocratic risk management is the established approach over informal participation [22].
This study aims to address the aforementioned gaps and extend the evolving literature on social resilience in a number of ways. First, this study examines the conceptual domain of social resilience at the neighbourhood scale and contributes to a better understanding of the main constituent elements of this complex phenomenon. We argue that social resilience is a multifaceted gestalt-like construct comprising interdependent dimensions. Each dimension may have unique implications; therefore, social resilience cannot be fully captured using any single dimension or indicator. Thus, this study acknowledges the multidimensionality of social resilience and empirically unpacks this construct. Second, we advance the literature by developing a comprehensive and psychometrically sound measure of social resilience and empirically test its validity and reliability. Third, this study is among the first few to focus on social resilience at the neighbourhood scale (as opposed to urban or regional scale), and defines, conceptualises, and develops a measurement model with respect to the particular requirements and characteristics of neighbourhood scale. Fourth, this study contributes to the literature by proposing a beneficiary-centred approach for measuring social resilience at the neighbourhood scale. This study adopts a bottom-up approach grounded in the perceptions of local residents and explicitly incorporates residents’ views into conceptualisation and measurement. Finally, this study contributes to the literature by introducing a new dimension of social resilience at the neighbourhood scale that was not acknowledged in previous studies. This important new dimension that emerged from our study relates to the tolerance and acceptance of residents to diversity and their flexibility and adaptability to changes; accordingly, we labelled this dimension as “neighbourhood tolerance and adaptive capacity”.
The remainder of the article is organised as follows: we begin with a review of the literature on social resilience to identify attributes of significance at the neighbourhood scale. The literature review formulates the basis for a hypothesised model for social resilience at the neighbourhood scale. The next section articulates the research design and explains the steps undertaken to use the perceptions of neighbourhood residents to transform the initial generic model into a contextually refined model—a robust and reliable measurement instrument that is empirically tested and integrates aspects of this complex concept into one coherent and fine-grained psychometric model. We then discuss the results as a prelude to the potential of the NRS model to inform built environment researchers and practitioners about the nuances of perceived social resilience in different urban settings. Finally, further contributions and limitations of the findings are considered to identify recommendations for theory and practice, as well as potential avenues for future research.

2. Literature Review

2.1. Perceived Social Resilience at the Neighbourhood Scale

Amongst the literature, studies that explore the role of empirical context in shaping people’s resilience are centred primarily around the notions of community resilience (as a proxy for scale) and social resilience (as a dimension of community resilience). While theoretical debate has extensively dwelled—with no consensus—on interpretations and assessments of community resilience [23,24], social resilience has received little attention. Key definitions noted in the literature are generic and appear to have emerged in response to disaster-related risks (Table 1).
In addition, social resilience has been the focus of resilience assessments only indirectly—typically integrated in community resilience measurement models. However, to understand social resilience in relation to built environment characteristics, scale and spatiality play an important role. In this line of interrogation, the term community becomes problematic because it can represent both spatial and transpatial social systems and solidarities [31]. Moreover, the term is associated in planning discourse with difficulties in inclusive stakeholder representation, e.g., of those most vulnerable or marginalised [32]. Instead, to enable socio-spatial relevance, the physical setting of neighbourhood can be adopted.
Neighbourhoods maintain references to qualities and nuances of social groupings, as well as administrative convenience for governance and policymaking. Resilience of urban neighbourhoods play a critical role in the overall resilience of New Zealand cities, as the country is highly urbanised with 86.6% of the population living in cities [33]. A review of the literature shows that neighbourhood is an amorphous concept which has been applied to “entire suburbs, to walkable areas or, most often, to an undefined spatial area” [34], p. 59. Therefore, it is difficult to define neighbourhoods based on a set number of dwellings or spatial size, as boundary and size of neighbourhoods are context dependent and can differ from society to society. Furthermore, in some cases, neighbourhood boundaries are defined by local residents themselves [34]. Similarly, due to the dynamic nature of neighbourhoods, defining them based on pre-determined activities and functions is also problematic. Not only neighbourhood functions and activities may vary over time, but they also depend on unique contextually embedded socioeconomic, cultural, and geographical characteristics of each neighbourhood. For the purpose of this study, we follow the definition of neighbourhoods proposed by [35], p. 5: “[Neighbourhood is] the connecting spaces between individual dwellings, other structures and to the wider city system and are arenas of casual interaction as well as being a key site of the routines of everyday life”.
Although not tied to a spatial scale, research in community resilience has largely encouraged place-based considerations in the study of people’s responses to stresses and change [36,37]. Through in-depth examination of cultural and cognitive norms of communities, phenomenological concepts such as sense of place and place attachment have surfaced as contributing factors to community resilience [38]. Embedded in phenomenological and cultural studies is the consideration that alongside tangible or institutionalised realities exist subjective socio-cultural interpretations of perceived realities [39]. Physical aspects of the built environment such as spatial layout and materiality of urban form play an important role in not only reflecting cultural meaning but also shaping everyday life and social encounter in the past and present [40,41]. While there is increasing research interest in transdisciplinary understanding of “spatial cultures” and the spatiality of social life [42], current practice in production, regulation, and management of space remains largely engineering driven. By adopting approaches that focus solely on physical infrastructure, urban resilience policy and practice has largely neglected the relationship between built environment and the people and communities who inhabit it [43]. Instead, ethnographic insight can reveal the agency of space through affective, embodied, and symbolic mediation of cultural and social meaning [44]. As Brumann et al. put it, “The way we make space calls for scrutiny, then, and not just within the confines of a specialised discipline but in all kinds of social and cultural analysis.” [45], p. 2.
To bridge this gap, Kwok et al. provide a helpful generalised framework for the distinction between structural and cognitive indicators for social resilience of communities [1]. Structural indicators refer to discrete characteristics of social groups (e.g., demographic and income structure, access to resources) while cognitive indicators include cultural and perceptual attitudes, values, and beliefs of social groups and individuals. Both structural and cognitive social resilience can be assessed top-down from the outside (e.g., by researchers, institutions, etc.) or bottom-up from the inside (e.g., residents and other involved stakeholders). In addition, the built environment can also be understood as the product of top-down “authored” planning and decision-making and bottom-up “non-authored” craft and building practice [46]. Resilience-building efforts need to acknowledge the “spatial plurality” of social environments to understand longer-term urban development processes and the ways in which the built environment can support social resilience and sustainability [47].
Bottom up knowledge and practice can inform conceptualisation of how long-term multi-generational resilience and neighbourhood life can be enabled by physical space, linking resilience to social sustainability [48]. For example, Arkaraprasertkul’s study of lilong houses in Shanghai uncovers “neighbourhood sense” as the most fundamental concept of the resilient traditional urban housing typology [49]. Additionally, recent studies looking at the physical and social aspects of the built environment as perceived by residents confirm the effects of urban form on social sustainability [50,51]. Bottom-up narratives are equally relevant in resilience studies due to the subjective ways in which people respond to risk and adapt to shock or change [52]. Insights from people’s experiences and needs to manage risk and recovery from adverse effects have been found to challenge assumptions about resilience as process, outcome, or strategy [53]. There are growing calls for top-down resilience planning to consider more actively residents’ views on their strengths and needs to create stronger alliances between state and civil responsibility—however, integration remains a challenge [22]. In this respect, it is interesting to explore residents’ and stakeholders’ perceptions of social resilience in relation to different types of built environment settings, e.g., neighbourhoods having different built form characteristics and infrastructural provision.
The next section reviews assessment methods and indicators that have been adopted by research and practice and highlights how these are complemented by the methods developed in this paper.

2.2. Assessment Methods and Dimensions Associated with Social Resilience

In their evaluation of resilience measurements, Gaillard and Jigyasu discuss the epistemological origins, strengths, and shortcomings of three main methods—quantitative, qualitative, and participatory assessment [21]. Due to their modus operandi, quantitative assessments are associated with top-down evaluations of resilience outcomes, while qualitative and participatory assessments are considered bottom-up evaluations of resilience-building processes. Gaillard and Jigyasu point out that each approach operates in a silo and ultimately suggest that hybrid methods, such as QPM (also known as participatory numbers or participatory statistics) [54] can help to bridge epistemological barriers in research and operational barriers in practice.
Perceived resilience has largely been the inquiry of qualitative, in-depth research, with only modest contributions from quantitative or psychometric studies [20]. Nevertheless, research by Béné et al. is an excellent example of how rigorous quantitative interrogation of psychometric data (e.g., residents’ self-reporting via Likert scale) can reveal new insights about resilience as a social construct [18]. Their research examines perceptions at the household level across four countries. It reveals the usefulness of comparative study and overturns assumptions; for example, it confirms the role of wealth in the recovery process but questions the universality of social capital as a positive factor. Although classified as primarily quantitative, this type of work contributes in bridging the state–local knowledge gap; it can also be applied as a more rigorous tool for QPM, if conceptualised by or in collaboration with those working and living in the areas studied (see for example Hung et al., 2016). In this paper, the potential of quantitative psychometric studies is explored, focusing on dimensions of social resilience related to the built environment and using the neighbourhood as our scale of analysis.
Following an extensive review of the literature on social and community resilience (see Table A1), in this study social resilience is conceptualised with seven dimensions, namely sense of belonging and place attachment; participation and influence; social network, trust, and reciprocity; residential stability; local community support; social equity; and safety and security. Each dimension is associated with a set of indicators which relate to the neighbourhood built environment and the livelihood that it enables.
Sense of belonging and place attachment are concepts that reflect affective bonding that individuals or groups develop with a built, or generally biophysical, setting [44,55]. Affective bonds relate both to functional dependency as well as emotional connection and are key determinants of people’s sense of place [56] which eventually influences place-related behaviour [38] and emplacement processes which unite people and place [57]. Place attachment is also enhanced by sensory properties of the built environment which are mediated by materiality and experienced through movement. Kinaesthetic perception and visual experience are qualities of the built environment which are strongly related to physical character and urban heritage and support long-term social sustainability [58].
Participation and influence refers to people’s engagement, participation, and interaction in community activities and the degree to which residents feel that they can influence outcomes [59]. It has been acknowledged that participation and involvement can strengthen the social cohesion and social network within the community [60] and encourage collective action and adaptation to change [61]. Neighbourhood space can encourage participation in multifarious ways by supporting quotidian activities, embodying social memory, and enabling processional and mass participation activity in a shared material context [62].
Social network, trust, and reciprocity are fundamental elements for the formation of social capital that, in turn, has been found to support community resilience [63] and post-disaster recovery [64]. Social trust develops when social groups embrace norms of reciprocity, shared values, and participate in formal and informal networks [65]; and it is found to facilitate recovery [66]. The role of spatial cultures in supporting the formation of social networks is extensively researched from diverse disciplinary perspectives, e.g., in archaeology, anthropology, urban history, urban morphology, and space syntax [42]. Social network evolves from behavioural acts and is formed when residents “share common cognitive attributes, such as norms and trust that help them to organise and prioritise their relationships with others” [2], p. 21. At the neighbourhood scale, social network can be measured by indicators such as knowing neighbours, frequency of visiting them in their homes, trusting neighbours and exchanging favours with them, and mutual assistance and concern for neighbours [67,68,69]. Social network, trust and interaction among the residents is strongly linked to higher sense of belonging and residential satisfaction and lower crime and fear of crime in the neighbourhood [2,20]. Furthermore, review of the literature reveals that urban form factors of high density and land-use mix can strengthen people’s social networks in their neighbourhood due to various reasons such as providing opportunities for residents to interact and develop social bonds as a result of less dependence on cars and more pedestrian activities [67,70]. It is also believed that socio-demographic factors such as homeownership and length of residence in the neighbourhood can positively influence people’s social networks and interactions with each other [20,51].
Residential stability is an interesting dimension as it has been argued to have both positive and negative connotations for residents’ psychological well-being depending on the economic profile of neighbourhoods. For example, residential stability may enable social cohesion [71], but it can also lead to social isolation and a feeling of entrapment in disadvantaged neighbourhoods [72].
Local community support is a form of social support, and, as such, it generally refers to material, informational and psychological resources that an individual can receive from their local network that increases their ability to cope with stress [73]. It is an important factor associated with resilience, either received (enacted) or perceived (expected) [74] and can help individuals during the recovery process from a shock or disaster [75].
Social equity has been predominately interpreted as the equitable distribution of goods, amenities, infrastructure, and basic services [67]. Distributional equity is indirectly linked to social resilience because it facilitates social interaction and the creation of social ties [60]; as well as directly linked to resilience-building through provision or omission of resilience planning [76]. Nevertheless, equally important are recognitional (i.e., acknowledgement of injustice, diversity, and respect of different groups) and procedural (i.e., inclusivity in decision-making processes) dimensions of social equity which are found to be largely neglected by resilience strategies and policies [77].
Safety and security in the context of neighbourhoods relate to people’s perception that they can live and socialise safely in their immediate environment and are protected from threats to their security [78]. The argument for security is central to urban resilience narratives in relation to multifarious threats—to society, economy, and the environment [79]. Furthermore, lack of trust and feeling of fear are considered as the two main causes of insecure social relations among citizens [80]. Social trust is defined as a risk judgement based on cultural values, rather than on notions of competency [81].

3. Methodology: Scale Development

The objective of this research is to bridge the gap in the literature by developing a psychometrically valid measurement model for neighbourhood social resilience that captures the multidimensional and integrated nature of the construct. The data for this study were collected using a household survey that was designed to capture the opinion of residents regarding various factors related to their neighbourhood. To ensure the validity of the measures, a standard multiple-step protocol was followed as recommended in the scale development literature [82,83]. Details of the five phases of scale development are discussed below.

3.1. Phase 1—Domain Specification and Item Generation

In this first phase, an initial pool of potential indicators was developed from the literature and supplemented them with additional items that emerged from focus group discussions with residents. From these, the conceptual domain of each of the seven dimensions of neighbourhood social resilience was defined along with a large pool of indicators to assess the dimensions.

3.2. Phase 2—Pilot Test and Scale Purification

The second phase of the study aimed to assess the quality of indicators and to purify the initial scale. Based on the initially identified indicators, a draft of the questionnaire was developed with a 7-point Likert scale ranging from 7 (strongly agree) to 1 (strongly disagree). The questionnaire’s content and design were examined by six senior academics who were familiar with the subject area to assess the content and face validity. According to the received feedback, some overlapping and double-barrelling indicators were deleted, and the wording of some questions was modified to enhance their clarity and specificity.
Subsequently, after applying the suggested modifications, a pilot study was conducted using the revised draft of the survey with 20 participants from one of the case study neighbourhoods and asked the respondents to complete the survey and provide feedback on the design and wording. Based on the pilot study, some minor amendments were applied to improve the clarity and readability of questions, and the survey was finalised. Table 2 shows a detailed overview of the hypothesised seven-factor model that emerged from Phase 1 and 2 as well as the 46 indicators used for measuring these dimensions.

3.3. Phase 3—Sampling and Data Collection

In this phase, the revised questionnaire was used to collect data. For distribution of the questionnaire and collecting the data, the questionnaire was mailed along with a postage-paid reply envelope to 864 households located in five case study neighbourhoods in Dunedin, inviting them to participate in this study. Overall, 276 questionnaires were returned, resulting in a response rate of 31.9%. Of these, 234 questionnaires were used for further data analysis and formed the database for this study.
The five neighbourhoods selected as case studies in this research are Caversham, Opoho, Green Island, Concord, and Maori Hill. Detailed statistics about each neighbourhood, along with maps and pictures of neighbourhoods are presented in Table A2 and Table A3 in the Appendix A. The logic behind choosing these neighbourhoods is that they arguably represent the heterogeneity of urban forms in neighbourhoods in typical medium-sized cities in New Zealand. These neighbourhoods represent considerable variation in terms of urban form factors (such as housing types, residential density, occupancy types, quality of design, distance from the city centre, and land use mix) as well as socioeconomic factors (such as residents’ income, unemployment rate, and homeownership). For the purpose of this research, we applied the official pre-defined boundaries of the case study neighbourhoods as identified by Dunedin City Council (Table A3).

3.4. Phase 4—Dimensionality Assessment Using EFA

The analysis performed for this study is comprised of two main phases. The analysis began by conducting exploratory factor analysis (EFA) to assess the hypothesised seven-factor model proposed for measuring neighbourhood social resilience. EFA was performed on the 46-item questionnaire, using the sample of 234 completed questionnaires. EFA does not assume any priori factorial structure and identifies the underlying relationships between measured indicators. Furthermore, EFA enables the identification and removal of items with poor reliability and psychometric properties. EFA was conducted with principal components analysis and varimax rotation in IBM SPSS Statistics 25 package and extracted the factors with eigenvalues greater than 1. EFA prompted the removal of eight indicators (identified in Table 2 with RE) due to low factor loadings or double loading, which led to a more interpretable and parsimonious solution.
Interestingly, the solution obtained by the EFA analysis revealed eight dimensions (as opposed to the hypothesised seven-factor structure) with eigenvalues greater than 1. The factor that emerged during this analysis encompassed five indicators (i.e., SB3, SB7, SN2, SN6, and CS4) related to neighbourhood tolerance for ethnic and religious diversity as well as the residents’ ability to accept change and overcome a difficult situation together. Accordingly, the new dimension was labelled, “neighbourhood tolerance and adaptive capacity”. Following the recommendation of [84], the reliability and validity of constructs were assessed based on Cronbach’s alpha, eigenvalues, factor loadings, and the percentage of variances explained. Cronbach’s alpha is a measure used to assess the composite reliability and internal consistency of the NSR measurement model. As can be seen in Table 3, the Cronbach’s alpha coefficients of all eight dimensions are between 0.771 to 0.895, which exceed the 0.7 threshold value recommended by [85]. These results indicate a high degree of reliability of our composite measure and suggest good inter-item consistency. All indicators achieved a reasonably high factor loading ranging from 0.672 to 0.873 [84], and the eight-factor model explains 67.18% of the variance. Thus, the indicators measure their designated factors with an acceptable level of reliability.

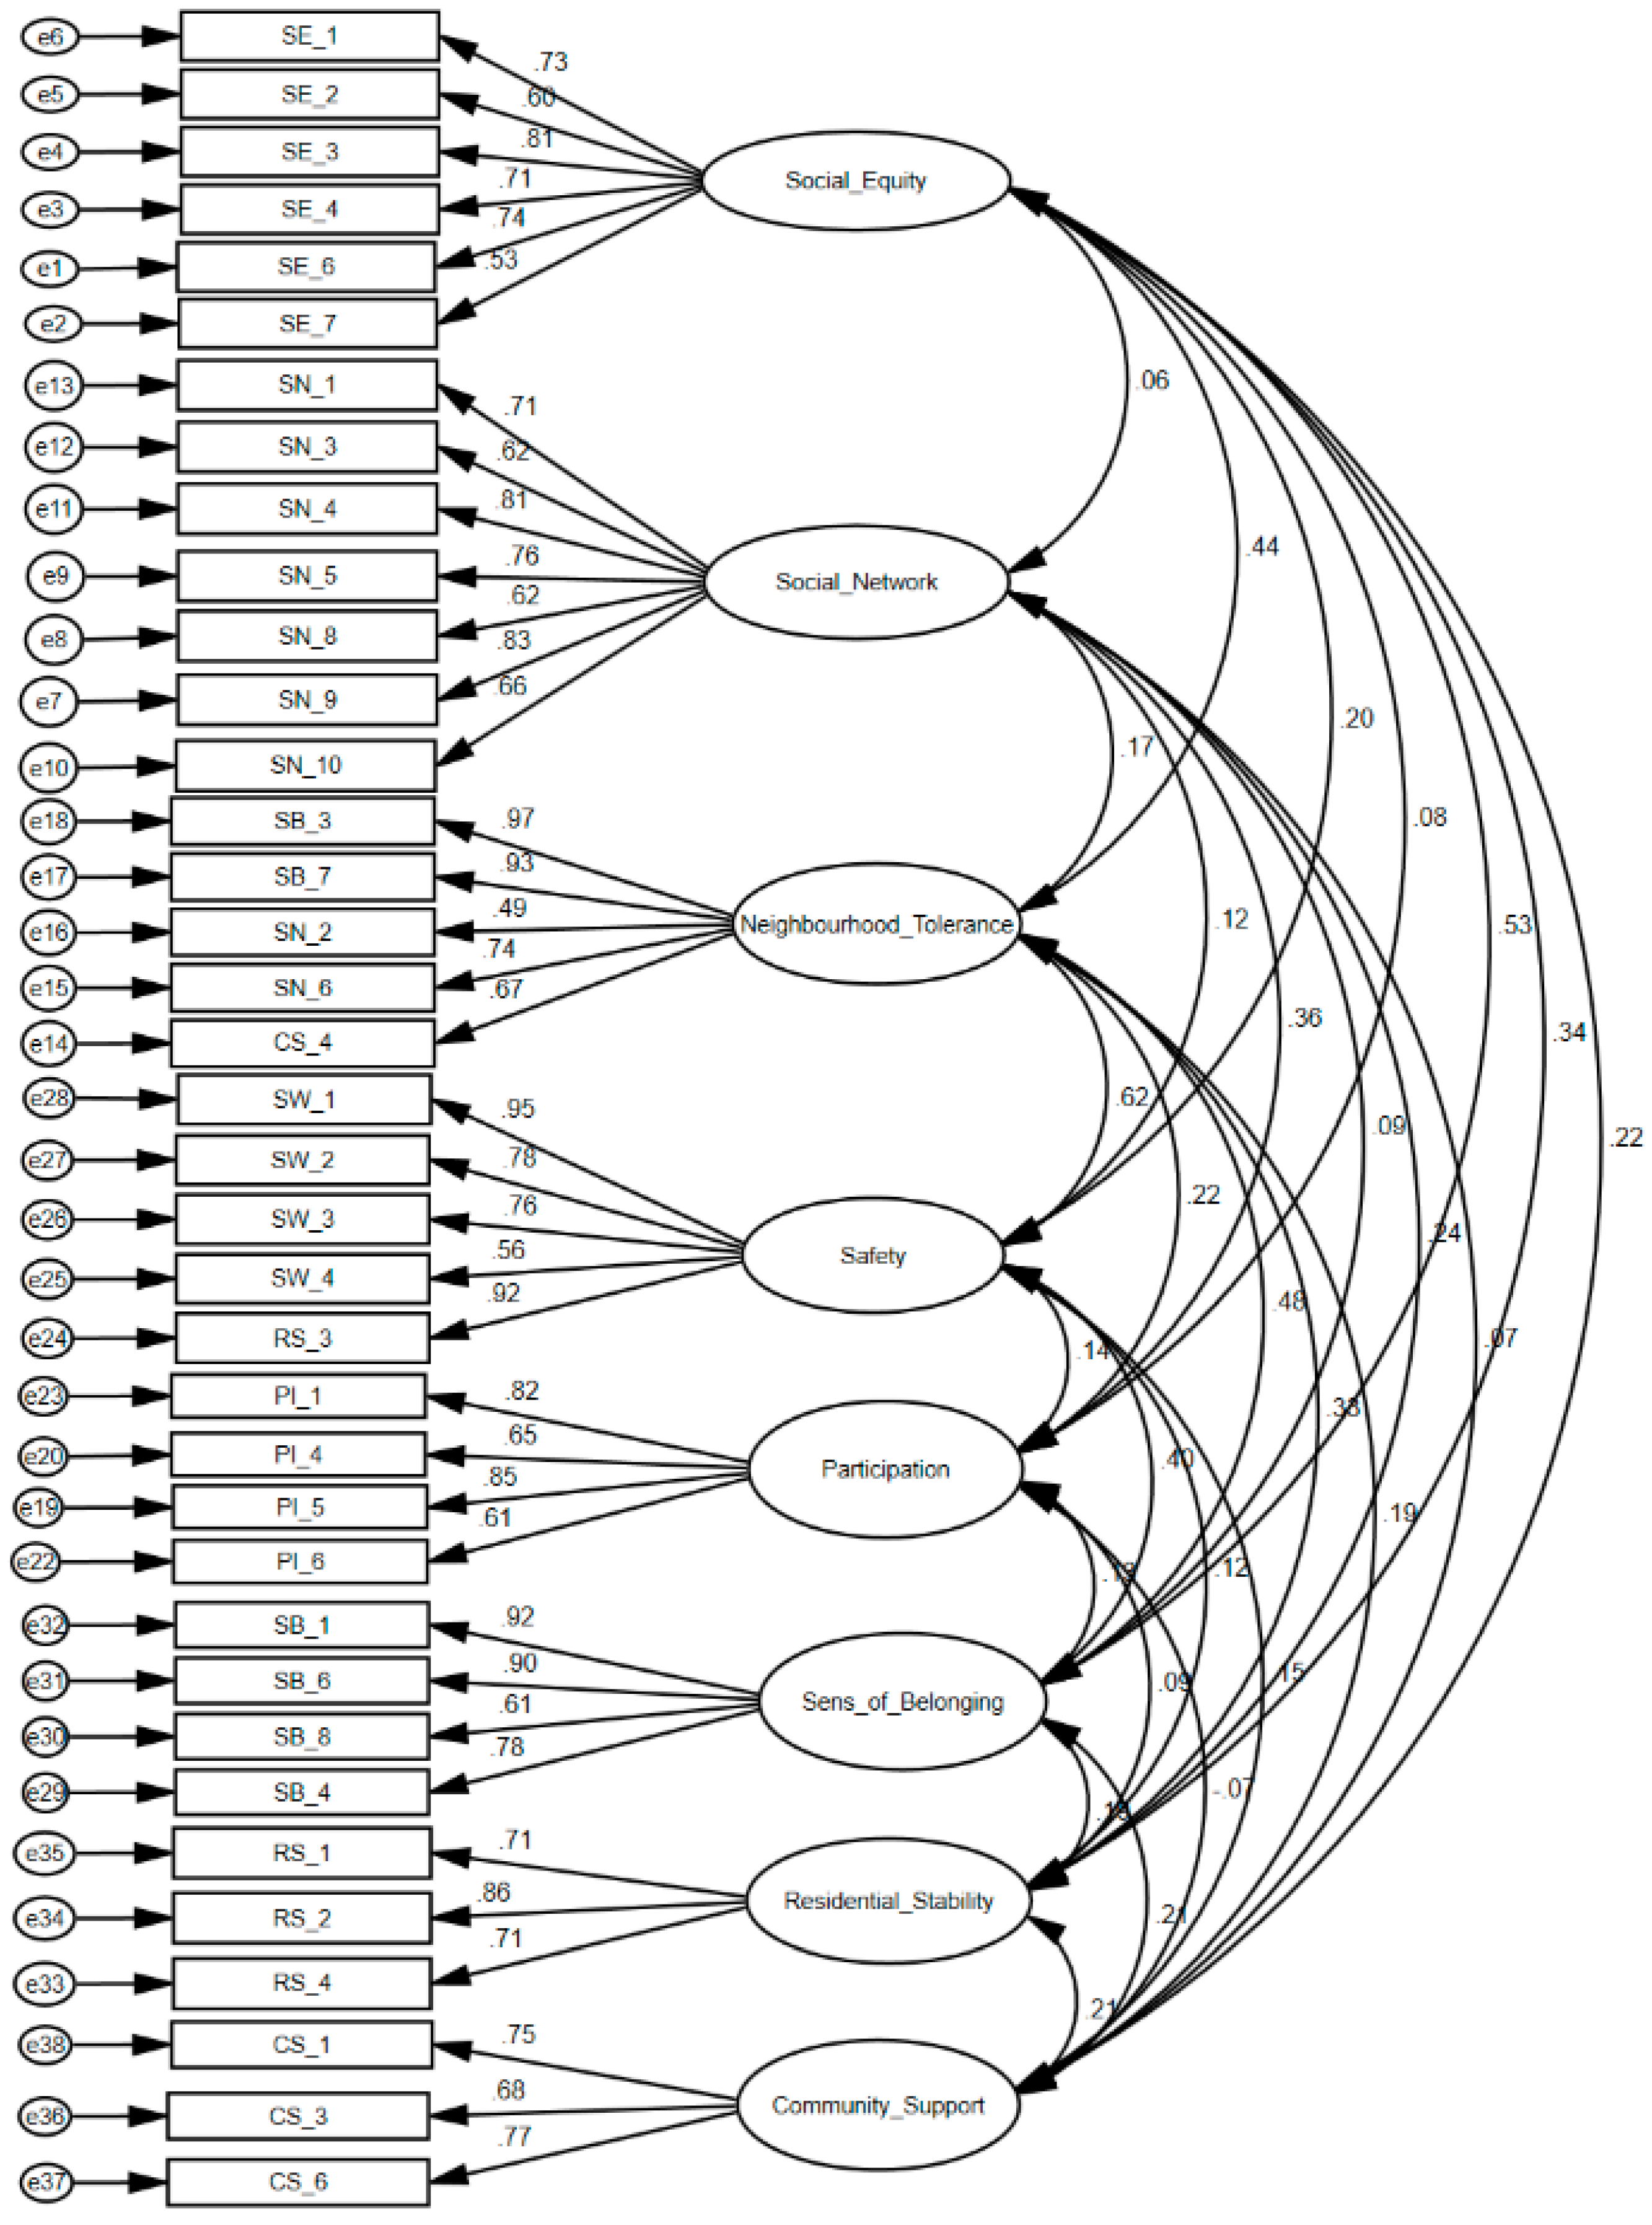
3.5. Phase 5—Construct Validity Assessment Using CFA

In the next step of scale development and validation procedure, confirmatory factor analysis (CFA) was performed to assess the goodness of fit of the eight-factor structure identified from EFA, as well as assess the convergent and discriminant validity. CFA analysis was conducted using the maximum likelihood estimation procedure in SPSS AMOS 25. One indicator (PI3) was excluded during CFA as it caused convergent validity issues (identified in Table 2 with RC). All the other indicators loaded significantly on the predicted dimensions. As can be seen in Table 4, the composite reliabilities (CR) range from 0.77 to 0.89, which further verify indicator reliability. A number of goodness-of-fit indices were used to assess the overall model adequacy: χ2 = 950.312, p = 0.000; χ2/df = 1.611, comparative fit index (CFI) = 0.0.924, PCLOSE = 0.365, root mean square error of approximation (RMSEA) = 0.051, Standardised Root Mean Square Residual (SRMR) = 0.060. Overall, these indices suggested that the eight-factor solution had a good fit with the data.
Average of Variance Explained (AVE) index was used for testing convergent validity. The AVE scores for all the dimensions exceeded the commonly suggested threshold value of 0.5, which indicates good convergent validity [85]. Furthermore, the large and significant standardised loading of indicators on their intended dimension (as can be seen in Figure 1 and Table 4), provide additional support for the convergent validity [86].
Furthermore, discriminant validity was checked, which reflects the extent to which a given dimension is distinct from other dimensions. The results, based on the test suggested by [86], support the discriminant validity of the measures because the square root of AVE for each dimension (in bold on the diagonal in Table 4) was greater than the correlation coefficient (in the off-diagonal) between it and any other dimensions (in the off-diagonal). The herterotrait–monotrait (HTMT) test was conducted which is more sensitive than the Fornell and Larcker’s criterion [87]. All HTMT values were below the threshold value of 0.85, which provided additional support for discriminant validity.
Common method bias was also checked using Harman’s one-factor test. The rationale for this test is that common method bias presents if a single dimension is the common denominator across all indicators and accounts for the majority of the covariance among the measures [88]. The variance extracted using Harman’s single-factor test is 20.905%, which is well below the 50% threshold.

4. Discussion of Findings

The study aims to develop a reliable, comprehensive, flexible, and fine-grained measurement model for social resilience at the neighbourhood scale referred to here as the NSR model. The results confirmed that the eight-factor model has a strong fit to the data and explain 67.18% of the total variance. All the identified dimensions are tightly linked to the literature on social resilience. The conceptualisation of social resilience places residents at the heart of conceptualisation and measurement and endeavours to grasp and reflect this concept as perceived and viewed by residents living in the neighbourhood.
The research initially hypothesised that social resilience can be identified as a second-order concept and measured by seven dimensions. However, in contrast to our preliminary hypothesis, our results illustrated that the eight-factor model has a considerably stronger fit to the data. During the process of conducting exploratory factor analysis, a new dimension emerged. Indicators SB3 and SB7 from “sense of belonging”, indicators SN2 and SN6 from “social network”, and indicator CS4 from “local community support” were grouped as an emergent dimension. The analytical, as well as theoretical considerations, allowed us to accept this new, unexpected dimension as a valid distinct factor. From the theoretical perspective, the indicators in this new dimension are related to each other and capture various aspects pertaining to the tolerance and acceptance of residents to diversity and their flexibility and adaptability to changes. Accordingly, the emergent dimension was labelled “neighbourhood tolerance and adaptive capacity”.
The ability of people to accept and respect differences in their local community and to be able to adjust to changes play a critical role in enhancing social resilience (i.e., tolerance). Acceptance and inclusivity are core attributes of the “recognitional” dimension of social equity, which is largely overlooked by urban resilience policy [77]. Studies show that communities that promote “care-oriented cultural values” and are welcoming and open to people from different ethnic and socio-demographic backgrounds tend to be more resilient and proactive in response to changes [2]. Adaptive capacity is defined as “the capability of a particular system to effectively cope with shocks” [89], p. 14. One of the critical characteristics of a resilient neighbourhood is the capacity of its residents to be flexible to changes and to respond to external shocks effectively. In the context of social resilience, adaptive capacity can be defined as the social strategies and skills that residents of a neighbourhood, either individually or collectively as a group, use to respond to external shocks and changes in their neighbourhood. The adaptive capacity of a neighbourhood varies based on social characteristics of the community, such as the strength of social capital, sense of belonging to the neighbourhood, and stability of social networks. Overall, neighbourhood tolerance and adaptive capacity dimension describes the ability of different people in the neighbourhood to live peacefully together, accept differences and diversities, and collaborate to overcome a difficult situation together. These characteristics reflect “pro-community behaviour” at the neighbourhood scale. Oishi et al. [90], p. 831 define pro-community behaviour as “a broad category of acts that are beneficial to the community at large as well as to other community residents.”
Another interesting result of the analysis was that one of the indicators of the residential stability (RS3) dimension loaded under the safety and security dimension. This indicator pertains to the extent to which living in the neighbourhood helps the mental and physical health of participants. This result suggests that people’s sense of well-being and their feeling of safety are closely related and are inextricable. This result can be theoretically explained by the literature, as some researchers have identified a perceived feeling of safety as one of the critical elements of well-being [78,91]. According to these studies, individuals who have less fears for safety, are generally happier and may perceive a higher sense of well-being and enjoyment of life in their neighbourhood [70,90]. In line with the literature, and in order to better portray the comprising indicators, this dimension was relabelled as “well-being and safety” to reflect both aspects of well-being and safety under a unified dimension.
Out of the eight dimensions of social resilience, “social network, trust, and reciprocity” is the dimension with the highest explanatory power in defining social resilience concept (with total variance explained of 11.08%). Not only is social network an important defining factor for social resilience, but it also has an important role in promoting other dimensions of social resilience. For instance, there is evidence that sense of belonging and community attachment can be developed through people’s interactions and connections with each other [92,93]. Social network and connection can also lead to more active participation and engagement in social activities within a networked group of residents [51]. Social network is a basis for developing sense of safety and trust which, subsequently, influence people’s decision to stay in the neighbourhood in the long term and develop sense of place attachment [70]. Similarly, in order for neighbourhood residents to recover from adversities and adapt to changes, they require pre-established social ties and robust networks to be able to overcome difficult situations together as a community [63,75]. Therefore, our findings reinforce the view of earlier studies demonstrating that social network and interaction is the key building block in the emergence of social resilience [68].
The second and third highest predictive power in defining social resilience pertain to “safety and well-being” and “social equity”, with 9.86% and 9.83% of the total variance explained respectively. These results reinforce the essential role of “safety and well-being” as a prerequisite for the positive social activities taking place in the neighbourhood [69]. There is evidence that sense of safety and well-being plays an important role in enhancing people’s resilience and quality of life [94]. People with low feeling of safety tend to participate in their local community less actively and may not be able to develop a strong sense of belonging to their neighbourhood [95]. Consequently, they may experience less satisfaction with their neighbourhood. Thus, the results concur with Shaftoe [96], p. 230, that crime and fear of crime are “two of the top deleterious ingredients of urban living”.
Social equity, as the third important dimension in defining social resilience, signifies the role of equitable access to facilities and services in improving people’s overall satisfaction with their neighbourhood and their perceived social resilience. Social equity here refers to “distributional” equity [77]. For example, access to socially-planned community facilities and public open spaces (such as sports fields and parks) facilitates both incidental and organised social interaction. Moreover, in case of emergency and when other usual facilities may be damaged, these open spaces can be used for setting up help centres and temporary settlements for residents [2].
This study contributes to the existing literature by developing and empirically testing a comprehensive quantitative psychometric measurement model for social resilience at the neighbourhood scale that captures the multi-dimensional nature of the concept. The proposed NSR model helps scholars, planners, and policymakers by providing a better understanding of the main constituent dimensions of social resilience. The results of this study reveal that social resilience is a second-order and multidimensional concept incorporating eight dimensions. Each of these dimensions capture a distinct piece in the jigsaw of social resilience; therefore, failure to incorporate all of these dimensions may provide an incomplete picture of this complex phenomenon. It should be mentioned that most of the dimensions and indicators in the NSR model have already existed in the literature on an individual basis, but they have not been unified in one comprehensive model. Kwok et al. [1] model is the most comprehensive but lacks the integration of a quantitative method. This study contributes to the existing knowledge by consolidating the fragmented findings in previous studies into one coherent and comprehensive measurement model.

5. Conclusions

Reliable and valid measurement is a cornerstone to scientific research and progress in any field of research [82]. In this way, the current study can be seen as an important stepping stone enabling future research and theorising in the evolving area of social resilience. This study makes several contributions to the social resilience literature. From the theoretical perspective, informed by the review of the literature and the results of our analysis, this study provides a more nuanced definition for social resilience at the neighbourhood scale. We define a socially resilient neighbourhood as the one where residents are confident in their ability to proactively develop their individual and collective social strengths and have the capacity to respond effectively to and bounce forward from actual and potential adversities. Residents of a socially resilient neighbourhood recognise and present strong social networks and sense of belonging, which enable them to work together and support each other towards shared objectives to collectively improve the safety and well-being of their neighbourhood.
This definition builds off the definitions presented in Table 1 and views neighbourhood social resilience as a context-specific phenomenon. Our two-part definition explicitly recognises and aligns with Kwok et al. [1] interrelated distinction between cognitive indicators—giving agency to the mindset of local residents (perceptions, priorities)—and structural indicators that enable a capacity (access to resources, income). This definition provides a bottom-up and beneficiary-centred approach for defining this phenomenon highlighting the three core dimensions of the NSR model and contains that social resilience is a dynamic concept that depends on the cognitive and structural resources of the neighbourhood.
Another important theoretical contribution of this research is introducing “neighbourhood tolerance and adaptive capacity” as the eighth dimension of social resilience in the NSR model. This dimension that has been largely neglected in previous studies emerged from our analysis and proved to be a critical factor in conceptualising and measuring social resilience. Adaptive capacity has been studied in relation to environmental resilience and people’s ability to cope with hazards and environmental disasters [42,65]. However, there is a lack of specific focus on adaptive capacity in the context of social resilience.
The practical contribution of this study relates to its attempt to bridge the gap between planners and residents and to clarify the mismatch between the top-down plans and strategies of policymakers for neighbourhoods and the bottom-up knowledge and expectations of residents about their built environment [16]. This study argues that social resilience at the neighbourhood scale cannot be understood truly in isolation from the perceptions and views of residents of that neighbourhood [15,20,97]. The NSR model and approach highlight the pivotal role of the “human” aspect in urban planning and design. Accordingly, the residents are placed at the centre of neighbourhood social resilience evaluation, and endeavour to reflect and capture social resilience from their perspective. The views of residents were incorporated in conceptualisation of the social resilience by accounting for the indicators that people deem important in their neighbourhood. Furthermore, the validation of the measurement model was based on analysing the data collected from the residents. This ensures that the proposed measurement model has the potential to truly reflect the collective perceptions of local residents.
The proposed NSR model in this study can assist urban planners, urban designers, and policymakers in their endeavour to formulate strategies for developing more sustainable and resilient neighbourhoods by taking into account multiple aspects simultaneously and identifying overlaps between sustainability and resilience [15,48,98]. Furthermore, the relative importance of the different dimensions can provide a tentative guideline in directing support policies and programmes to the areas that are more important in promoting social resilience. Identification of social network and connections as the most important dimension of social resilience suggests that future built environment developments should support and facilitate community bonds and interaction to promote social resilience [63,64]. Such strategies could involve design principles such as providing suitable infrastructure to encourage pedestrian activities, and appropriate design and strategic placement of public open spaces (e.g., civic centres and parks) to facilitate social interaction [5].

Limitations and Directions for Future Research

This study has some limitations that also represent fertile directions for future research. First, this study represents one of the first attempts towards a better understanding of social resilience at the neighbourhood scale and developing a measurement scale for it. Thus, further theoretical and empirical research is required. Although the study has made every attempt to develop a comprehensive model by incorporating a broad set of dimensions across different disciplines, we cannot claim that the NSR model incorporates a fully exhaustive collection of criteria. Accordingly, future studies may seek to modify or expand the NSR model in a way that reflects the unique contextually embedded social, cultural, socioeconomic, geographical, or planning requirements of the case studies.
Second, this study has utilised a static research design for neighbourhood social resilience, which may be against the dynamic nature of the phenomenon and limit us from accurately unveiling its inherent complexity. Therefore, a fruitful avenue for research would be to conduct a longitudinal study that portrays the trajectory of evolutions in NSR dimensions. Such a study can shed light on the antecedents and consequences of the development of social resilience strategies in neighbourhoods over time.
Third, caution should be expressed in generalising our findings to neighbourhoods in other cities or countries. For instance, the identification of social network and connections as the most important dimension of social resilience is based on residents’ perceptions in our case study neighbourhoods and may not necessarily be applicable to other contexts. Ultimately, the relative importance of NSR dimensions depends on the specific requirements of the country, city, or neighbourhood under investigation and the perceptions of the residents. Therefore, policymakers and urban planners should avoid “one policy fits all” approach and instead try to create socially resilient and sustainable urban spaces that meet people’s specific needs and expectations through engaged governance [5].
An important piece of future research that goes beyond the scope of this study lies in the comparison of neighbourhoods in terms of social resilience. Future research could employ in-depth, qualitative methodologies, along with the proposed NSR model to provide more insight into the underlying reasons of why, how, and under which circumstances people in certain neighbourhoods perceive higher levels of social resilience. Such knowledge would assist urban planners to create resilient neighbourhoods that people would want to live in now and in the future.
Finally, an important direction of future research lies in examining the determinants and outcomes of social resilience at the neighbourhood scale. Future studies can adopt the NSR model to examine the relationship between social resilience and other important constructs of interest. Some of the interesting determinants of social resilience that are worth examining include urban form factors (such as land-use mix, density, transport infrastructure, quality of design), socio-demographic factors (such as residents’ income, homeownership, age), social capital, and neighbourhood satisfaction. One particularly interesting context would be related to COVID-19 outbreak that is ravaging the world at the time of publishing this research.

Author Contributions

Conceptualization, all the authors; methodology, T.L., and A.S.; software, T.L., and A.S.; validation, T.L., and A.S.; formal analysis, T.L., and A.S.; Literature review: T.L., G.P., R.S.-III; investigation, all the authors; resources and data curation, T.L.; writing—original draft preparation, all the authors; writing—review and editing, all the authors; visualization, T.L.; All authors have read and agreed to the published version of the manuscript.

Funding

This research received no external funding.

Conflicts of Interest

The authors declared no potential conflicts of interest with respect to the research, authorship, and/or publication of this article.

Appendix A

Table A1. Dimensions of social resilience mentioned in key studies of social and community resilience.
AuthorDimensions of Social Resilience
Norris (2008) [23]Social support;
Social participation;
Community bonds.
McAslan (2010) [99]Social networks;
Communications;
Social support;
Inclusion and sense of belonging;
Leadership.
Magis (2010) [48]Community resources;
Development of Community Resources;
Engagement of Community Resources;
Active Agents;
Collective Action;
Strategic Action;
Equity;
Impact.
Zautra, Hall and Murray (2010) [100]Neighbours that trust one another;
Neighbours that interact on a regular basis;
Residents who own their own houses and stay for a while (residential stability);
Residents with a sense of community;
Social cohesion;
Residents who work together for the common good and are involved in community events;
Formal and informal places for civic gathering.
Ross et al. (2010) [29]People-place connections;
Knowledge, skills and learning;
Community networks;
Engaged governance;
Diverse and innovative economy; and
Community infrastructure.
Berkes and Ross (2013) [101]People–place connections;
Values and beliefs;
Knowledge, skills and learning;
Social networks;
Engaged governance;
Diverse and innovative economy;
Community infrastructure;
Leadership;
Positive outlook, including readiness to accept change.
Maclean, Cuthill and Ross (2014) [5]Knowledge, skills and learning;
Community networks;
People-place connections;
Community infrastructure;
Diverse and innovative economy;
Engaged governance.
Kwok, Doyle, Becker, Johnston and Paton (2016) [1]Cognitive dimensionStructural dimension
Cognitive Adaptability;Access to economic resources;
Collective efficacy; Community (and individual) preparedness;
Community inclusiveness;Democratic and collaborative decision-making and problem-solving policies and processes;
Connectedness between networks;Disaster management planning;
Leadership;Diversity of skills and trained personnel;
Sense of community and attachment;Knowledge of community assets and beliefs;
Shared community beliefs and values;Knowledge of risks and hazard consequences;
Social support;Robust community spaces and amenities;
Trust.Social networks.
Baldwin and King (2017) [2]Residents with a sense of, attachment to, pride in the place/community;
Neighbours that interact on a regular basis;
Safety, security and monitoring;
Residential stability;
Community participation;
Social cohesion;
Social solidarity/community spirit;
Well-being;
Voice and influence;
100 Resilient Cities [9]Local community support;
Cohesive community;
Strong city-wide identity and culture;
Actively engaged citizens;
Effective systems to deter crime.
Cui and Li (2019) [102]Community cohesion;
Sense of belonging;
Interpersonal relationship;
Collective efficacy;
Informal social control;
Trust and reciprocity.
Table A2. Socio-economic and demographic information about each case study neighbourhood.
Data SourceNeighbourhoodOpohoCavershamGreen IslandMaori HillConcord
Statistics New ZealandLocation within the cityInner areaMiddle areaOuter areaInner areaOuter area
Population12182265231924481512
Socioeconomic deprivation38626
Number of occupied dwellings counted4831032948933564
Unemployment rate in total population aged 15 years and over4.8%5.1%3.8%3.3%4.0%
Median income of total population aged 15 years and over (per person)$34,400$23,400$32,300$37,700$29,300
Household questionnaire surveyNumber of respondents4649474448
Median age of respondents38.331.643.850.237.3
Homeownership rate67.9%54.7%73.7%84.3%76.5%
Source: 2018 New Zealand census (Statistics New Zealand) and household questionnaire survey.
Table A3. Map and pictures of case study neighbourhoods.
NeighbourhoodMap of Neighbourhood BoundaryPictures Taken from Different Parts of Neighbourhood
Caversham Sustainability 12 06363 i001 Sustainability 12 06363 i002
Green Island Sustainability 12 06363 i003 Sustainability 12 06363 i004
Concord Sustainability 12 06363 i005 Sustainability 12 06363 i006
Opoho Sustainability 12 06363 i007 Sustainability 12 06363 i008
Maori Hill Sustainability 12 06363 i009 Sustainability 12 06363 i010

References

  1. Kwok, A.H.; Doyle, E.E.H.; Becker, J.; Johnston, D.; Paton, D. What is ‘social resilience’? Perspectives of disaster researchers, emergency management practitioners, and policymakers in New Zealand. Int. J. Disaster Risk Reduct. 2016, 19, 197–211. [Google Scholar] [CrossRef]
  2. Baldwin, C.; King, R. What about the People? The Socially Sustainable, Resilient Community and Urban Development; Oxford Brookes University: Oxford, UK, 2017. [Google Scholar]
  3. Meerow, S.; Newell, J.P.; Stults, M. Defining urban resilience: A review. Landsc. Urban Plan. 2016, 147, 38–49. [Google Scholar] [CrossRef]
  4. Buckle, P. Assessing Social Resilience. In Disaster Resilience: An Integrated Approach; Paton, D., Johnston, D., Eds.; Charles C Thomas Publisher: Springfield, IL, USA, 2006; pp. 88–103. [Google Scholar]
  5. MacLean, K.; Cuthill, M.; Ross, H. Six attributes of social resilience. J. Environ. Plan. Manag. 2013, 57, 144–156. [Google Scholar] [CrossRef]
  6. Keck, M.; Sakdapolrak, P. What is social resilience? Lessons learned and ways forward. Erdkunde 2013, 67, 5–19. [Google Scholar] [CrossRef]
  7. Cutter, S.L.; Derakhshan, S. Implementing Disaster Policy: Exploring Scale and Measurement Schemes for Disaster Resilience. J. Homel. Secur. Emerg. Manag. 2019, 16, 20180029. [Google Scholar] [CrossRef]
  8. Obrist, B.; Pfeiffer, C.; Henley, R. Multi-layered social resilience: A new approach in mitigation research. Prog. Dev. Stud. 2010, 10, 283–293. [Google Scholar] [CrossRef]
  9. Arup. City Resilience Framework; The Rockefeller Foundation: London, UK, 2014. [Google Scholar]
  10. Boschma, R. Towards an Evolutionary Perspective on Regional Resilience. Reg. Stud. 2014, 49, 733–751. [Google Scholar] [CrossRef] [Green Version]
  11. Bristow, G.; Healy, A. Regional Resilience: An Agency Perspective. Reg. Stud. 2013, 48, 923–935. [Google Scholar] [CrossRef]
  12. Zimmerman, F.J.; Carter, M. Asset smoothing, consumption smoothing and the reproduction of inequality under risk and subsistence constraints. J. Dev. Econ. 2003, 71, 233–260. [Google Scholar] [CrossRef]
  13. Jones, L.; Tanner, T. Subjective resilience: Using perceptions to quantify household resilience to climate extremes and disasters. Reg. Environ. Chang. 2016, 17, 229–243. [Google Scholar] [CrossRef] [Green Version]
  14. Mehmood, A. Of resilient places: Planning for urban resilience. Eur. Plan. Stud. 2015, 24, 407–419. [Google Scholar] [CrossRef] [Green Version]
  15. Bec, A.; Moyle, B.; Moyle, C. Resilient and Sustainable Communities. Sustainability 2018, 10, 4810. [Google Scholar] [CrossRef] [Green Version]
  16. Gaillard, J.C.; Mercer, J. From knowledge to action: Bridging gaps in disaster risk reduction. Prog. Hum. Geogr. 2012, 37, 93–114. [Google Scholar] [CrossRef]
  17. Sharifi, A. A critical review of selected tools for assessing community resilience. Ecol. Indic. 2016, 69, 629–647. [Google Scholar] [CrossRef] [Green Version]
  18. Béné, C.; Al-Hassan, R.M.; Amarasinghe, O.; Fong, P.; Ocran, J.; Onumah, E.; Ratuniata, R.; Van Tuyen, T.; McGregor, J.A.; Mills, D.J. Is resilience socially constructed? Empirical evidence from Fiji, Ghana, Sri Lanka, and Vietnam. Glob. Environ. Chang. 2016, 38, 153–170. [Google Scholar] [CrossRef] [Green Version]
  19. Hung, H.-C.; Yang, C.-Y.; Chien, C.-Y.; Liu, Y.-C. Building resilience: Mainstreaming community participation into integrated assessment of resilience to climatic hazards in metropolitan land use management. Land Use Policy 2016, 50, 48–58. [Google Scholar] [CrossRef]
  20. Smith, J.W.; Anderson, D.H.; Moore, R.L. Social Capital, Place Meanings, and Perceived Resilience to Climate Change. Rural Sociol. 2012, 77, 380–407. [Google Scholar] [CrossRef]
  21. Gaillard, J.; Jigyasu, R. Measurement and Evidence: Whose Resilience for Whom? Available online: https://www.preventionweb.net/files/50932_50932wpnov2016gaillardjigyasu.pdf (accessed on 5 August 2020).
  22. Scolobig, A.; Prior, T.; Schröter, D.; Jörin, J.; Patt, A. Towards people-centred approaches for effective disaster risk management: Balancing rhetoric with reality. Int. J. Disaster Risk Reduct. 2015, 12, 202–212. [Google Scholar] [CrossRef]
  23. Norris, F.H.; Stevens, S.P.; Pfefferbaum, B.; Wyche, K.F.; Pfefferbaum, R.L. Community Resilience as a Metaphor, Theory, Set of Capacities, and Strategy for Disaster Readiness. Am. J. Community Psychol. 2008, 41, 127–150. [Google Scholar] [CrossRef]
  24. CARRI. Definitions of Community Resilience: An Analysis; Community & Regional Resilience Institute (CARRI): Dillon, CO, USA, 2013. [Google Scholar]
  25. Adger, W.N. Social and ecological resilience: Are they related? Prog. Hum. Geogr. 2000, 24, 347–364. [Google Scholar] [CrossRef]
  26. Bruneau, M.; Chang, S.E.; Eguchi, R.T.; Lee, G.C.; O’Rourke, T.D.; Reinhorn, A.M.; Shinozuka, M.; Tierney, K.; Wallace, W.A.; von Winterfeldt, D. A Framework to Quantitatively Assess and Enhance the Seismic Resilience of Communities. Earthq. Spectra 2003, 19, 733–752. [Google Scholar] [CrossRef] [Green Version]
  27. Maguire, B.; Hagan, P. Disasters and communities: Understanding social resilience. Aust. J. Emerg. Manag. 2007, 22, 16–20. [Google Scholar]
  28. Marshall, N.; Marshall, P.; Abdulla, A. Using social resilience and resource dependency to increase the effectiveness of marine conservation initiatives in Salum, Egypt. J. Environ. Plan. Manag. 2009, 52, 901–918. [Google Scholar] [CrossRef]
  29. Ross, H.; Cuthill, M.; Maclean, K.; Jansen, D.; Witt, B. Understanding, Enhancing and Managing for Social Resilience at the Regional Scale: Opportunities in North Queensland; Reef and Rainforest Research Centre Limited: Cairns, Australia, 2010. [Google Scholar]
  30. Lyon, C. Place Systems and Social Resilience: A Framework for Understanding Place in Social Adaptation, Resilience, and Transformation. Soc. Nat. Resour. 2014, 27, 1009–1023. [Google Scholar] [CrossRef]
  31. Hillier, B.; Hanson, J. The Social Logic of Space; Cambridge University Press: Cambridge, UK, 1984; ISBN 9780521367844. [Google Scholar]
  32. Marsh, G. Community: The concept of community in the risk and emergency management context. Aust. J. Emerg. Manag. 2001, 16, 5–7. [Google Scholar]
  33. Statista New Zealand Urbanization from 2009 to 2019. 2020. Available online: https://www.statista.com/statistics/455899/urbanization-in-new-zealand/ (accessed on 5 August 2020).
  34. Allen, N. Concepts of Neighbourhood: A Review of the Literature; National Science Challenge 11: Auckland, New Zealand, 2018; Volume 18. [Google Scholar]
  35. Bijoux, D.; Lietz, K.; Saville-Smith, K. Measuring Neighbourhood Sustainability in New Zealand. In Proceedings of the UPE7: World Class Cities—Environmental Impacts and Planning Opportunities; Beacon Pathway Ltd.: Bangkok, Thailand, 2007. [Google Scholar]
  36. Cox, R.S.; Perry, K.-M.E. Like a Fish Out of Water: Reconsidering Disaster Recovery and the Role of Place and Social Capital in Community Disaster Resilience. Am. J. Community Psychol. 2011, 48, 395–411. [Google Scholar] [CrossRef]
  37. Della Bosca, H.; Schlosberg, D.; Craven, L. Shock and place: Reorienting resilience thinking. Local Environ. 2020, 25, 228–242. [Google Scholar] [CrossRef]
  38. Masterson, V.A.; Stedman, R.C.; Enqvist, J.; Tengo, M.; Giusti, M.; Wahl, D.; Svedin, U. The contribution of sense of place to social-ecological systems research: A review and research agenda. Ecol. Soc. 2017, 22. [Google Scholar] [CrossRef] [Green Version]
  39. Buys, L.; Miller, E.; van Megen, K. Conceptualising climate change in rural Australia: Community perceptions, attitudes and (in)actions. Reg. Environ. Chang. 2012, 12, 237–248. [Google Scholar] [CrossRef] [Green Version]
  40. Hillier, B. Space is the Machine: A Configurational Theory of Architecture; Cambridge University Press: Cambridge, UK, 1996. [Google Scholar]
  41. Reichmann, W.; Müller, A.-L. The Secrets of Architecture’s Actions Architecture, Materiality and Society. In Architecture, Materiality and Society; Müller, A.-L., Reichmann, W., Eds.; Palgrave Macmillan: London, UK, 2015; pp. 2–23. [Google Scholar]
  42. Griffiths, S.; von Lünen, A. Spatial Cultures: Towards a New Social Morphology of Cities Past and Present; Routledge: Abingdon, UK, 2016. [Google Scholar]
  43. White, I.; O’Hare, P. From Rhetoric to Reality: Which Resilience, Why Resilience, and Whose Resilience in Spatial Planning? Environ. Plan. C Gov. Policy 2014, 32, 934–950. [Google Scholar] [CrossRef]
  44. Low, S. Spatializing Culture: The Ethnography of Space and Place; Routledge: Abingdon, UK, 2017. [Google Scholar]
  45. Brumann, C.; Dimmer, C.; Schulz, E. Introduction. In Urban Spaces in Japan: Cultural and Social Perspectives; Christoph Brumann, E.S., Ed.; Routledge: Abingdon, UK, 2012. [Google Scholar]
  46. Psarra, S. The Venice Variations: Tracing the Architectural Imagination; UCL Press: London, UK, 2018. [Google Scholar]
  47. Baumanova, M.; Smejda, L.; Rüther, H. Pre-Colonial Origins of Urban Spaces in the West African Sahel: Street Networks, Trade, and Spatial Plurality. J. Urban Hist. 2017, 45, 500–516. [Google Scholar] [CrossRef]
  48. Magis, K. Community Resilience: An Indicator of Social Sustainability. Soc. Nat. Resour. 2010, 23, 401–416. [Google Scholar] [CrossRef]
  49. Arkaraprasertkul, N. Towards modern urban housing: Redefining Shanghai’s lilong. J. Urban. Int. Res. Placemaking Urban Sustain. 2009, 2, 11–29. [Google Scholar] [CrossRef] [Green Version]
  50. Ali, H.H.; Al-Betawi, Y.N.; Al-Qudah, H.S. Effects of urban form on social sustainability—A case study of Irbid, Jordan. Int. J. Urban Sustain. Dev. 2019, 11, 203–222. [Google Scholar] [CrossRef]
  51. Larimian, T.; Sadeghi, A. Measuring urban social sustainability: Scale development and validation. Environ. Plan. B Urban Anal. City Sci. 2019, 2399808319882950. [Google Scholar] [CrossRef] [Green Version]
  52. Adger, W.N.; Dessai, S.; Goulden, M.; Hulme, M.; Lorenzoni, I.; Nelson, D.R.; Naess, L.O.; Wolf, J.; Wreford, A. Are there social limits to adaptation to climate change? Clim. Chang. 2009, 93, 335–354. [Google Scholar] [CrossRef]
  53. Vallance, S. Disaster recovery as participation: Lessons from the Shaky Isles. Nat. Hazards 2015, 75, 1287–1301. [Google Scholar] [CrossRef]
  54. Gaillard, J.C.; Cadag, J.R.; Gampell, A.; Hore, K.; Le Dé, L.; McSherry, A. Participatory numbers for integrating knowledge and actions in development. Dev. Pract. 2016, 26, 998–1012. [Google Scholar] [CrossRef]
  55. Altman, I.; Low, S.M. Place Attachment; Springer: Boston, MA, USA, 1992. [Google Scholar]
  56. Tuan, Y.-F. Space and Place: The Perspective of Experience; University of Minnesota Press: Minneapolis, MN, USA, 1977. [Google Scholar]
  57. Barron, E.S.; Hartman, L.; Hagemann, F. From place to emplacement: The scalar politics of sustainability. Local Environ. 2020, 25, 447–462. [Google Scholar] [CrossRef]
  58. Baumanova, M. Urban kinaesthetic heritage and production of social sustainability. J. Archaeol. Sci. Reports 2020, 32, 102445. [Google Scholar] [CrossRef]
  59. Arnstein, S.R. A Ladder Of Citizen Participation. J. Am. Inst. Plan. 1969, 35, 216–224. [Google Scholar] [CrossRef] [Green Version]
  60. Bramley, G.; Power, S. Urban Form and Social Sustainability: The Role of Density and Housing Type. Environ. Plan. B Plan. Des. 2009, 36, 30–48. [Google Scholar] [CrossRef]
  61. Adger, W.N. Social Capital, Collective Action, and Adaptation to Climate Change. Econ. Geogr. 2003, 79, 387–404. [Google Scholar] [CrossRef]
  62. Griffiths, S. Spatial culture, processional culture and the materialities of social memory in nineteenth-century Sheffield. Distinktion J. Soc. Theory 2016, 17, 254–275. [Google Scholar] [CrossRef]
  63. Aldrich, D.P.; Meyer, M.A. Social Capital and Community Resilience. Am. Behav. Sci. 2014, 59, 254–269. [Google Scholar] [CrossRef]
  64. Jovita, H.D.; Nashir, H.; Mutiarin, D.; Moner, Y.; Nurmandi, A. Social capital and disasters: How does social capital shape post-disaster conditions in the Philippines? J. Hum. Behav. Soc. Environ. 2019, 29, 519–534. [Google Scholar] [CrossRef]
  65. Paraskevopoulos, C.J. Social Capital: Summing up the Debate on a Conceptual Tool of Comparative Politics and Public Policy. Comp. Politics 2010, 42, 475–494. [Google Scholar] [CrossRef]
  66. Shimada, G. The role of social capital after disasters: An empirical study of Japan based on Time-Series-Cross-Section (TSCS) data from 1981 to 2012. Int. J. Disaster Risk Reduct. 2015, 14, 388–394. [Google Scholar] [CrossRef]
  67. Dempsey, N.; Brown, C.; Bramley, G. The key to sustainable urban development in UK cities? The influence of density on social sustainability. Prog. Plan. 2012, 77, 89–141. [Google Scholar] [CrossRef]
  68. Shirazi, M.R.; Keivani, R. The triad of social sustainability: Defining and measuring social sustainability of urban neighbourhoods. Urban Res. Pract. 2019, 12, 448–471. [Google Scholar] [CrossRef]
  69. Eizenberg, E.; Jabareen, Y. Social Sustainability: A New Conceptual Framework. Sustainability 2017, 9, 68. [Google Scholar] [CrossRef] [Green Version]
  70. Dempsey, N.; Bramley, G.; Power, S.; Brown, C. The social dimension of sustainable development: Defining urban social sustainability. Sustain. Dev. 2011, 19, 289–300. [Google Scholar] [CrossRef]
  71. Fonseca, X.; Lukosch, S.; Brazier, F. Social cohesion revisited: A new definition and how to characterize it. Innov. Eur. J. Soc. Sci. Res. 2019, 32, 231–253. [Google Scholar] [CrossRef]
  72. Ross, C.E.; Reynolds, J.R.; Geis, K.J. The Contingent Meaning of Neighborhood Stability for Residents’ Psychological Well-Being. Am. Sociol. Rev. 2000, 65, 581–597. [Google Scholar] [CrossRef]
  73. Sippel, L.M.; Pietrzak, R.H.; Charney, D.S.; Mayes, L.C.; Southwick, S.M. How does social support enhance resilience in the trauma-exposed individual? Ecol. Soc. 2015, 20, 10. [Google Scholar] [CrossRef]
  74. Kaniasty, K.; Norris, F.H. Social support in the aftermath of disasters, catastrophes, and acts of terrorism: Altruistic, overwhelmed, uncertain, antagonistic, and patriotic communities. Bioterrorism Psychol. Public Health Interv. 2004, 3, 200–229. [Google Scholar]
  75. Vallance, S. Community, Resilience and Recovery: Building or Burning Bridges. Lincoln Plan. Rev. 2011, 3, 4–8. [Google Scholar]
  76. Anguelovski, I.; Shi, L.; Chu, E.; Gallagher, D.; Goh, K.; Lamb, Z.; Reeve, K.; Teicher, H. Equity Impacts of Urban Land Use Planning for Climate Adaptation: Critical Perspectives from the Global North and South. J. Plan. Educ. Res. 2016, 36, 333–348. [Google Scholar] [CrossRef]
  77. Meerow, S.; Pajouhesh, P.; Miller, T.R. Social equity in urban resilience planning. Local Environ. 2019, 24, 793–808. [Google Scholar] [CrossRef] [Green Version]
  78. Larimian, T.; Zarabadi, Z.S.S.; Sadeghi, A. Developing a fuzzy AHP model to evaluate environmental sustainability from the perspective of Secured by Design scheme—A case study. Sustain. Cities Soc. 2013, 7, 25–36. [Google Scholar] [CrossRef]
  79. Vale, L.J. The politics of resilient cities: Whose resilience and whose city? Build. Res. Inf. 2014, 42, 191–201. [Google Scholar] [CrossRef]
  80. Luhmann, N. Law as a social system. Northwestern Univ. Law Rev. 1988, 83, 136–150. [Google Scholar]
  81. Earle, T.C.; Cvetkovich, G. Risk Communication: The Social Construction of Meaning and Trust. In Future Risks and Risk Management; Springer: Dordrecht, The Netherlands, 1994; pp. 141–181. [Google Scholar]
  82. DeVellis, R.F. Scale Development: Theory and Applications, 4th ed.; SAGE Publications: Thousand Oaks, CA, USA, 2016; Volume 26. [Google Scholar]
  83. Netemeyer, R.G.; Bearden, W.O.; Sharma, S. Scaling Procedures: Issues and Applications; SAGE Publications: Thousand Oaks, CA, USA, 2003. [Google Scholar]
  84. Hair, J.F.; Black, W.C.; Babin, B.J.; Anderson, R.E. Multivariate Data Analysis, 7th ed.; Pearson Higher Education: Upper Saddle River, NJ, USA, 2010. [Google Scholar]
  85. Bagozzi, R.P.; Yi, Y. On the evaluation of structural equation models. J. Acad. Mark. Sci. 1988, 16, 74–94. [Google Scholar] [CrossRef]
  86. Fornell, C.; Larcker, D.F. Structural Equation Models with Unobservable Variables and Measurement Error: Algebra and Statistics. J. Mark. Res. 1981, 18, 382–388. [Google Scholar] [CrossRef]
  87. Henseler, J.; Ringle, C.M.; Sarstedt, M. A new criterion for assessing discriminant validity in variance-based structural equation modeling. J. Acad. Mark. Sci. 2015, 43, 115–135. [Google Scholar] [CrossRef] [Green Version]
  88. Podsakoff, P.M.; MacKenzie, S.B.; Lee, J.-Y.; Podsakoff, N.P. Common method biases in behavioral research: A critical review of the literature and recommended remedies. J. Appl. Psychol. 2003, 88, 879–903. [Google Scholar] [CrossRef]
  89. Martin-Breen, P.; Anderies, J.M. Resilience: A Literature Review; IDC Publishing: McLean, VA, USA, 2011. [Google Scholar]
  90. Oishi, S.; Rothman, A.J.; Snyder, M.; Su, J.; Zehm, K.; Hertel, A.W.; Gonzales, M.H.; Sherman, G.D. The socioecological model of procommunity action: The benefits of residential stability. J. Pers. Soc. Psychol. 2007, 93, 831–844. [Google Scholar] [CrossRef]
  91. Armitage, R.; Ekblom, P. Rebuilding Crime Prevention Through Environmental Design: Strengthening the Links with Crime Science; Routledge: Abingdon, UK, 2019. [Google Scholar]
  92. Lee, M.R.; Blanchard, T.C. Community Attachment and Negative Affective States in the Context of the BP Deepwater Horizon Disaster. Am. Behav. Sci. 2011, 56, 24–47. [Google Scholar] [CrossRef]
  93. Trentelman, C.K. Place Attachment and Community Attachment: A Primer Grounded in the Lived Experience of a Community Sociologist. Soc. Nat. Resour. 2009, 22, 191–210. [Google Scholar] [CrossRef]
  94. Cozens, P.; Love, T. A Review and Current Status of Crime Prevention through Environmental Design (CPTED). J. Plan. Lit. 2015, 30, 393–412. [Google Scholar] [CrossRef]
  95. Larimian, T. Social Sustainability: Towards some Explanation. In Dialogues of Sustainable Urbanisation: Social Science Research and Transitions to Urban Contexts; Condie, J., Cooper, A.M., Eds.; University of Western Sydney: Penrith, NSW, Australia, 2015. [Google Scholar]
  96. Shaftoe, H. Community Safety and actual Neighbourhoods. In Sustainable Communities: The Potential for Eco-Neighbourhoods; Barton, H., Ed.; Earthscan Publications Ltd.: London, UK, 2000; pp. 230–243. [Google Scholar]
  97. Van Zandt, S.; Peacock, W.G.; Henry, D.W.; Grover, H.; Highfield, W.E.; Brody, S.D. Mapping social vulnerability to enhance housing and neighborhood resilience. Hous. Policy Debate 2012, 22, 29–55. [Google Scholar] [CrossRef]
  98. Lizarralde, G.; Chmutina, K.; Bosher, L.; Dainty, A. Sustainability and resilience in the built environment: The challenges of establishing a turquoise agenda in the UK. Sustain. Cities Soc. 2015, 15, 96–104. [Google Scholar] [CrossRef]
  99. McAslan, A. Community Resilience: Understanding the Concept and Its Application. Available online: https://sustainablecommunitiessa.files.wordpress.com/2011/06/community-resilience-from-torrens-institute.pdf (accessed on 5 August 2020).
  100. Zautra, A.J.; Hall, J.S.; Murray, K.E. Resilience: A New Definition of Health for People and Communities. In Handbook of Adult Resilience.; The Guilford Press: New York, NY, US, 2010; pp. 3–29. ISBN 978-1-60623-488-4. [Google Scholar]
  101. Berkes, F.; Ross, H. Community Resilience: Toward an Integrated Approach. Soc. Nat. Resour. 2013, 26, 5–20. [Google Scholar] [CrossRef]
  102. Cui, P.; Li, D. A SNA-based methodology for measuring the community resilience from the perspective of social capitals: Take Nanjing, China as an example. Sustain. Cities Soc. 2020, 53, 101880. [Google Scholar] [CrossRef]
Figure 1. CFA Model: Standardised regression weights of the eight-factor model.
Sustainability 12 06363 g001
Table 1. Definitions of social resilience in key literature.
AuthorDefinition of Social Resilience
Adger (2000, p. 347) [25]“the ability of groups or communities to cope with external stresses and disturbances as a result of social, political and environmental change”.
Bruneau (2003, p. 735) [26] “the ability of social units (e.g., organizations, communities) to mitigate hazards, contain the effects of disasters when they occur, and carry out recovery activities in ways that minimize social disruption and mitigate the effects of future earthquakes”.
Kofinas (2003) (CARRI, 2013, p. 6) [24]“Two types of social resilience: (1) a social system’s capacity to facilitate human efforts to deduce the trends of change, reduce vulnerabilities, and facilitate adaptation; and (2) the capacity of a [social-ecological system] to sustain preferred modes of economic activity”.
Maguire and Hagan (2007, p. 16) [27]“Social resilience is the capacity of social groups and communities to recover from, or respond positively to, crises”.
Cuthill et al. (2008, 146); Maclean et al. (2014, p. 146) [5]“the way in which individuals, communities and societies adapt, transform, and potentially become stronger when faced with environmental, social, economic or political challenges”.
Marshall et al. (2009, p. 904) [28]“comprises four key characteristics: (1) the perception of risk associated with change; (2) the ability to plan, learn and reorganise; (3) the proximity to the thresholds of coping; and (4) the level of interest in change”.
Obrist et al. (2010, p. 289) [8]“the capacity of actors to access capitals in order to—not only cope with and adjust to adverse conditions (that is, reactive capacity)—but also search for and create options (that is, proactive capacity), and thus develop increased competence (that is, positive outcomes) in dealing with a threat”.
Ross et al. (2010, p. 1) [29]“how individuals, communities and societies adapt, transform, and potentially become stronger when faced with environmental, social, economic or political challenges”.
Lyon (2014, p. 1010); Keck and Sakdapolrak (2013, p. 14) [6,30]“the persistence of a social system, whereby the system is able to resist stresses (e.g, the loss of an industry or resource base) without altering its basic functioning or its development path”.
Kwok, Doyle, Becker, Johnston and Paton (2016, p. 198) [1]“The resilience of the social environment—social resilience—refers to a social unit or a group to collectively cope with or respond to external stresses and disturbances resulting from social, political, and environmental changes [Adger, 2000]. By adapting Cutter’s [Cutter, 2016] framework on resilience, social resilience can be conceptualised as a process of capacity building (e.g., disaster planning), as a post-disaster outcome (e.g., rate of population retention after an earthquake), or as both a process and an outcome”.
The table excludes definitions of community resilience.
Table 2. Hypothesised Model for Neighbourhood Social Resilience.
Dimensions and Indicators
Dimension 1—Sense of Belonging and Place Attachment (SB)
SB1. I miss this neighbourhood when I’m away from it for too long
SB2. I feel like I belong to this neighbourhood RE
SB3. I feel comfortable living with people from different ethnic backgrounds in this neighbourhood
SB4. Living in this neighbourhood gives me a sense of community
SB5. I like to think of myself as similar to the people who live in this neighbourhood RE
SB6. People should be happy to say they live in this neighbourhood
SB7. I feel comfortable living with people with different religious backgrounds in this neighbourhood
SC8. Our neighbourhood has distinctive character that differentiates it from other neighbourhoods in this city
Dimension 2—Participation and Influence (PI)
PI1. I am willing to work together with others on something to improve my neighbourhood
PI2. I would like to be more involved in decisions that affect my local area RE
PI3. I have done some volunteer work in my neighbourhood within the last 12 months RC
PI4. I want to be a part of things going on in my neighbourhood
PI5. My voice and influence can play a role in shaping local decisions
PI6. I participate in social group activities in my neighbourhood (e.g., golf, church, etc.)
Dimension 3—Social Network, Trust, and Reciprocity (SN)
SN1. I know the first names of my next-door neighbours
SN2. I believe in the ability of the people in my neighbourhood to overcome a difficult situation together
SN3. I am satisfied with the level of contact I have with my neighbours
SN4. I visit my neighbours in their homes
SN5. I believe my neighbours would help me in an emergency
SN6. There is mutual assistance and concern for others in my neighbourhood
SN7. I believe this neighbourhood is a place where people from different backgrounds get on well togetherRE
SN8. I regularly stop and talk with people in my neighbourhood
SN9. The friendships and associations I have with my neighbours mean a lot to me
SN10. I borrow things and exchange favours with my neighbours
Dimension 4—Residential Stability (RS)
RS1. I am willing to remain a resident of this neighbourhood for a number of years
RS2. This neighbourhood is a good place for children to grow up in
RS3. Living in this neighbourhood is good for my mental and physical health
RS4. I think the future of this neighbourhood is promising
Dimension 5—Local Community Support (CS)
CS1. We have a strong and active community in our neighbourhood
CS2. I am interested in being involved in activities led by my local community group RE
CS3. My local community functions well and I have faith in their decision making
CS4. I am willing to accept changes in my neighbourhood that are likely to lead to an improvement in the quality of life (despite the risk of failure of such changes)
CS5. I am treated with dignity and respect in the community RE
CS6. When people in this neighbourhood get involved in the local community, they really can change the way that their neighbourhood is run
Dimension 6—Social Equity (SE)
SE1. Access to essential facilities (Supermarket, sundry shop/convenience store, post office, healthcare centre/doctor, bank/money machine, religious centre)
SE2. Access to recreational facilities (Sports field, park/public garden, indoor community facility, playground)
SE3. Access to educational facilities (early childhood education, primary school, secondary school)
SE4. Access to transportation facilities (public transport)
SE5. Access to socio-cultural facilities (e.g., community centre, Māori/Pacific centre kids centre, youth centre, old age centre) RE
SE6. In my neighbourhood, appropriate attention is given to people with special needs (e.g., elderly and people with disability)
SE7. Housing in my neighbourhood is affordable
Dimension 7—Safety and Security (S)
S1. I feel safe when out and about in the neighbourhood during the day
S2. I feel safe to walk alone in the neighbourhood after dark
S3. I don’t worry about crime in my neighbourhood
S4. I am not aware of crimes committed in the neighbourhood within the last 12 months
S5. I sometimes feel worried, afraid, or anxious in my daily life in this neighbourhood RE
RE: Removed during EFA. RC: Removed during CFA.
Table 3. Results of exploratory factor analysis (N = 234).
Factor Loading RangeEigenvalues% Variance ExplainedCronbach’s Alpha
1—Social EquityItems: SE1, SE2, SE3, SE4, SE6, SE7)0.672–0.7643.3209.8330.840
2—Social Network(Items: SN1, SN3, SN4, SN5, SN8, SN9, SN10)0.705–0.8357.94411.0780.881
3—Neighbourhood Tolerance and adaptive capacity(Items: SB3, SB7, SN6, CS4, SN2)0.706–0.7862.4889.2310.873
4—Participation and influence(Items: PI1, PI3, PI4, PI5, PI6)0.694–0.8222.1077.9780.828
5—Safety and Well-being(Items: S1, S2, S3, S4, RS3)0.727–0.8734.6759.8600.895
6—Sense of Belonging(Items: SB1, SB4, SB6, SB8)0.740–0.8412.0077.5270.874
7—Residential Stability(Items: RS1, RS2, RS4)0.782–0.8581.6545.8860.792
8—Community Support(Items: CS1, CS3, CS6)0.775–0.8351.3365.7890.771
Extraction method: principal component analysis; Rotation method: Varimax with Kaiser normalisation. KMO = 0.830; Bartlett spherical test = 5224.007; significance = 0.000.
Table 4. Discriminant validity: Latent variables correlations and square root of the average variances extracted.
CRAVESocial EquitySocial NetworkNeighbourhood ToleranceParticipationSafetySense of BelongingResidential StabilityCommunity Support
Social Equity0.8420.5190.721
Social Network0.8760.5040.0400.710
Neighbourhood Tolerance0.8780.6030.449 ***0.157 *0.777
Participation0.8120.5280.0820.347 ***0.223 **0.727
Safety0.8930.6330.187 *0.1130.627 ***0.140†0.796
Sense of Belonging0.8780.6480.539 ***0.0850.481 ***0.131†0.396 ***0.805
Residential Stability0.8040.5810.361 ***0.218 **0.334 ***0.1030.1230.198 **0.762
Community Support0.7750.5350.2150.0390.1910.0750.1590.2130.2150.731
Diagonal values in bold are the square root of the variance shared between the reflective constructs and their measures. To ensure discriminant validity, the value of diagonal elements (in bold) must be larger than off-diagonal values. † p < 0.10; * p < 0.05; ** p < 0.01; *** p < 0.001.

