Modeling the Evolutionary Mechanism of China’s Domestic Air Transport Network


Abstract
1. Introduction
2. Literature Review
2.1. Airport Hierarchy in the CATN
2.2. The Impact of Low-Cost Carriers on CATN
2.3. The Impact of High-Speed Rail on CATN
2.4. Methodology Modeling Network Dynamics
3. Data Considerations and Exploratory Analysis
3.1. Data
3.2. Exploratory Analysis
3.2.1. The Changes in the CATN Based on Airport Hierarchy
3.2.2. The Changes of CATN Based on Distance
3.2.3. The Impact of LCCs and HSR
4. Model Specification and SABMs
4.1. Structural Covariates
- Density effect
- Transitivity closure effect
- Betweenness effect
- Number of distances-two effect
4.2. Dyadic Covariates
- Distance effect
- LCC effect
- HSR effect
4.3. Actor Covariates
- Airport hierarchy effect
- Growing airports effect
- Emerging integrated traffic center effect
5. Results
5.1. Model Tests
5.2. Parameter Interpretation
6. Conclusions
Author Contributions
Funding
Acknowledgments
Conflicts of Interest
References
- Civil Aviation Administration of China. Statistical outlook of China Civil Aviation in 2019. 1-216. Available online: http://www.caac.gov.cn/XXGK/XXGK/TJSJ/202006/P020200605630677965649.pdf (accessed on 4 August 2020).
- Lin, J. Network analysis of China’s aviation system, statistical and spatial structure. J. Transp. Geogr. 2012, 22, 109–117. [Google Scholar] [CrossRef]
- Wang, J.; Mo, H.; Wang, F. Evolution of air transport network of China 1930–2012. J. Transp. Geograph. 2014, 40, 145–158. [Google Scholar] [CrossRef]
- Zhang, J.; Cao, X.-B.; Du, W.-B.; Cai, K.-Q. Evolution of Chinese airport network. Phys. A Stat. Mech. Its Appl. 2010, 389, 3922–3931. [Google Scholar] [CrossRef]
- Alderighi, M.; Cento, A.; Nijkamp, P.; Rietveld, P. Network competition—the coexistence of hub-and-spoke and point-to-point systems. J. Air Transp. Manag. 2005, 11, 328–334. [Google Scholar] [CrossRef]
- Gegov, E.; Postorino, M.N.; Atherton, M.; Gobet, F. Community structure detection in the evolution of the united states airport network. Adv. Complex Syst. 2013, 16, 1350003. [Google Scholar] [CrossRef]
- Zhang, S.; Derudder, B.; Witlox, F. Dynamics in the European Air Transport Network, 2003–9: An Explanatory Framework Drawing on Stochastic Actor-Based Modeling. Networks Spat. Econ. 2015, 16, 643–663. [Google Scholar] [CrossRef]
- Huang, J.; Wang, J. A comparison of indirect connectivity in Chinese airport hubs: 2010 vs. 2015. J. Air Transp. Manag. 2017, 65, 29–39. [Google Scholar] [CrossRef]
- Wang, J.; Mo, H.; Wang, F.; Jin, F. Exploring the network structure and nodal centrality of China’s air transport network: A complex network approach. J. Transp. Geogr. 2011, 19, 712–721. [Google Scholar] [CrossRef]
- Mo, H.; Jin, F.; Liu, Y.; Wang, J.E. Network analysis on centrality of airport system. Sci. Geogr. Sin. 2010, 30, 204–212. [Google Scholar]
- O’Connor, K.; Fuellhart, K.; Zhang, S. Change in the role of cities in China’s air transport 2005–2015. Asian Geographer 2018, 35, 1–14. [Google Scholar] [CrossRef]
- Zhang, Y.; Zhang, A.; Zhu, Z.; Wang, K. Connectivity at Chinese airports: The evolution and drivers. Transp. Res. Part A Policy Pr. 2017, 103, 490–508. [Google Scholar] [CrossRef]
- Jinxue, D.; Fengjun, J.; Chengjin, W. Evaluation, optimization and simulation of the spatial layout of transport hubs in China. Acta Geogr. Sin. 2011, 66, 504–514. [Google Scholar]
- Chen, Z. Impacts of high-speed rail on domestic air transportation in China. J. Transp. Geogr. 2017, 62, 184–196. [Google Scholar] [CrossRef]
- Ding, J.; Jin, F.; Wang, J.; Liu, D. Competition game of high-speed rail and civil aviation and its spatial effect—a case study of Beijing—Shanghai high-speed rail. Econ. Geogr. 2013, 33, 104–110. [Google Scholar]
- Wang, J.e.; Jing, Y.; Yang, H. Impacts of high-speed rail on China’s domestic air transportation. J. Nat. Res. 2019, 34, 1933–1944. [Google Scholar]
- Xia, W.; Zhang, A. Air and high-speed rail transport integration on profits and welfare: Effects of air-rail connecting time. J. Air Transp. Manag. 2017, 65, 181–190. [Google Scholar] [CrossRef]
- Jin, F.; Wang, F.; Liu, Y. Geographic patterns of air passenger transport in China 1980-1998: Imprints of economic growth, regional inequality, and network development. Prof. Geogr. 2004, 56, 471–487. [Google Scholar]
- Brueckner, J.K.; Lee, D.; Singer, E.S. Airline competition and domestic US airfares: A comprehensive reappraisal. Econ. Transp. 2013, 2, 1–17. [Google Scholar] [CrossRef]
- De Wit, J.; Zuidberg, J. Route churn: An analysis of low-cost carrier route continuity in Europe. J. Transp. Geogr. 2016, 50, 57–67. [Google Scholar] [CrossRef]
- Gross, S.; Lück, M. The Low Cost Carrier Worldwide; Ashgate Publishing, Limited: Farnham, UK, 2013. [Google Scholar]
- Chen, R. Competitive responses of an established airline to the entry of a low-cost carrier into its hub airports. J. Air Transp. Manag. 2017, 64, 113–120. [Google Scholar] [CrossRef]
- Fu, X.; Lei, Z.; Wang, K.; Yan, J. Low cost carrier competition and route entry in an emerging but regulated aviation market—The case of China. Transp. Res. Part Pol. Prac. 2015, 79, 3–16. [Google Scholar] [CrossRef]
- Zhang, Q.; Yang, H.; Wang, Q.; Zhang, A. Market power and its determinants in the Chinese airline industry. Transp. Res. Part A Policy Pr. 2014, 64, 1–13. [Google Scholar] [CrossRef]
- Wang, J.; Bonilla, D.; Banister, D. Air deregulation in China and its impact on airline competition 1994–2012. J. Transp. Geogr. 2016, 50, 12–23. [Google Scholar] [CrossRef]
- Wang, K.; Xia, W.; Zhang, A. Should China further expand its high-speed rail network? Consider the low-cost carrier factor. Transp. Res. Part A Policy Pr. 2017, 100, 105–120. [Google Scholar] [CrossRef]
- Zhang, Q.; Yang, H.; Wang, Q. Impact of high-speed rail on China’s Big Three airlines. Transp. Res. Part A Policy Pr. 2017, 98, 77–85. [Google Scholar] [CrossRef]
- Zhang, X.; Luan, W.; Zhao, B. Competition between Wuhan-Guangzhou High-speed Railway and Civil Aviation Based on Disaggregate Model. J. Transp. Syst. Eng. Inf. Technol. 2012, 12, 17–21. [Google Scholar] [CrossRef]
- Dai, L.; Derudder, B.; Liu, X. Generative network models for simulating urban networks, the case of inter-city transport network in Southeast Asia. Cybergeo 2016. [Google Scholar] [CrossRef]
- Snijders, T.A.B.; Pattison, P.; Robins, G.; Handcock, M.S. New Specifications for Exponential Random Graph Models. Sociol. Methodol. 2006, 36, 99–153. [Google Scholar] [CrossRef]
- Snijders, T.A.B.; Van De Bunt, G.G.; Steglich, C. Introduction to stochastic actor-based models for network dynamics. Soc. Netw. 2010, 32, 44–60. [Google Scholar] [CrossRef]
- Liu, X.; Derudder, B.; García, C.G. Exploring the co-evolution of the geographies of air transport aviation and corporate networks. J. Transp. Geogr. 2013, 30, 26–36. [Google Scholar] [CrossRef]
- O’Connor, K.; Fuellhart, K. Change in air services at second rank cities. J. Air Transp. Manag. 2013, 28, 26–30. [Google Scholar] [CrossRef]
- Van de Bunt, G.G.; Groenewegen, P. An actor-oriented dynamic network approach the case of interorganizational network evolution. Org. Res. Meth. 2007, 10, 463–482. [Google Scholar] [CrossRef]
- Snijders, T.A. Actor-Based Models for Dynamics of Two-Sided Relations. 2011. Available online: http://www.stats.ox.ac.uk/~snijders/siena/OneSidedNetDyn.pdf (accessed on 4 August 2020).
- Zhang, S.; Fuellhart, K.; Wang, Y.; Wu, W.; Zhu, J.; Witlox, F. Congestion spillover effects of Chinese hub airports on international connecting traffic. Transp. A Transp. Sci. 2019, 15, 1339–1359. [Google Scholar] [CrossRef]


| Author Name | Indicators | # Clusters | # Airports | Airport IATA Code | ||||
|---|---|---|---|---|---|---|---|---|
| First Tier | Second Tier | Third Tier | Fourth Tier | Fifth Tier | ||||
| Mo et al. [10] | Network centrality | 3 | 146 | 4 *: PEK, PVG, SHA, CAN | 5: SZX, KMG, CTU, XIY, CKG | 137: Others | ||
| Ding et al. [13] | Integrated transport hubbing | 4 | 42 | 4: PEK, PVG, SHA, CAN | 7: KMG, CTU, XIY, WUH, CKG, SHE, URC | 15: TSN, CGO, NKG, HGH, HRB, and another 10 airports | 17: SJW, TYN, FOC, HFE, HAK, and another 12 airports | |
| Zhang et al. [12] | Connectivity | 3 | 69 | 3: PEK, PVG, CAN | 5: SZX, KMG, CTU, XIY, SHA | 40: CGO, HGH, URC, XMN, HRB, and another 35 airports | 21: JJN, NAY, BAV, XUZ, and another 17 airports | |
| O’Connor et al. [11] | Airline supply and competition | 3 | 37 | 3: PEK, PVG, SHA, CAN | 5: SZX, KMG, CTU, XIY, CKG | 18: HGH, WUH, CSX, TAO, and another 14 airports | 15: CGQ, KHN, LHW, HET, HFE, and another 10 airports | |
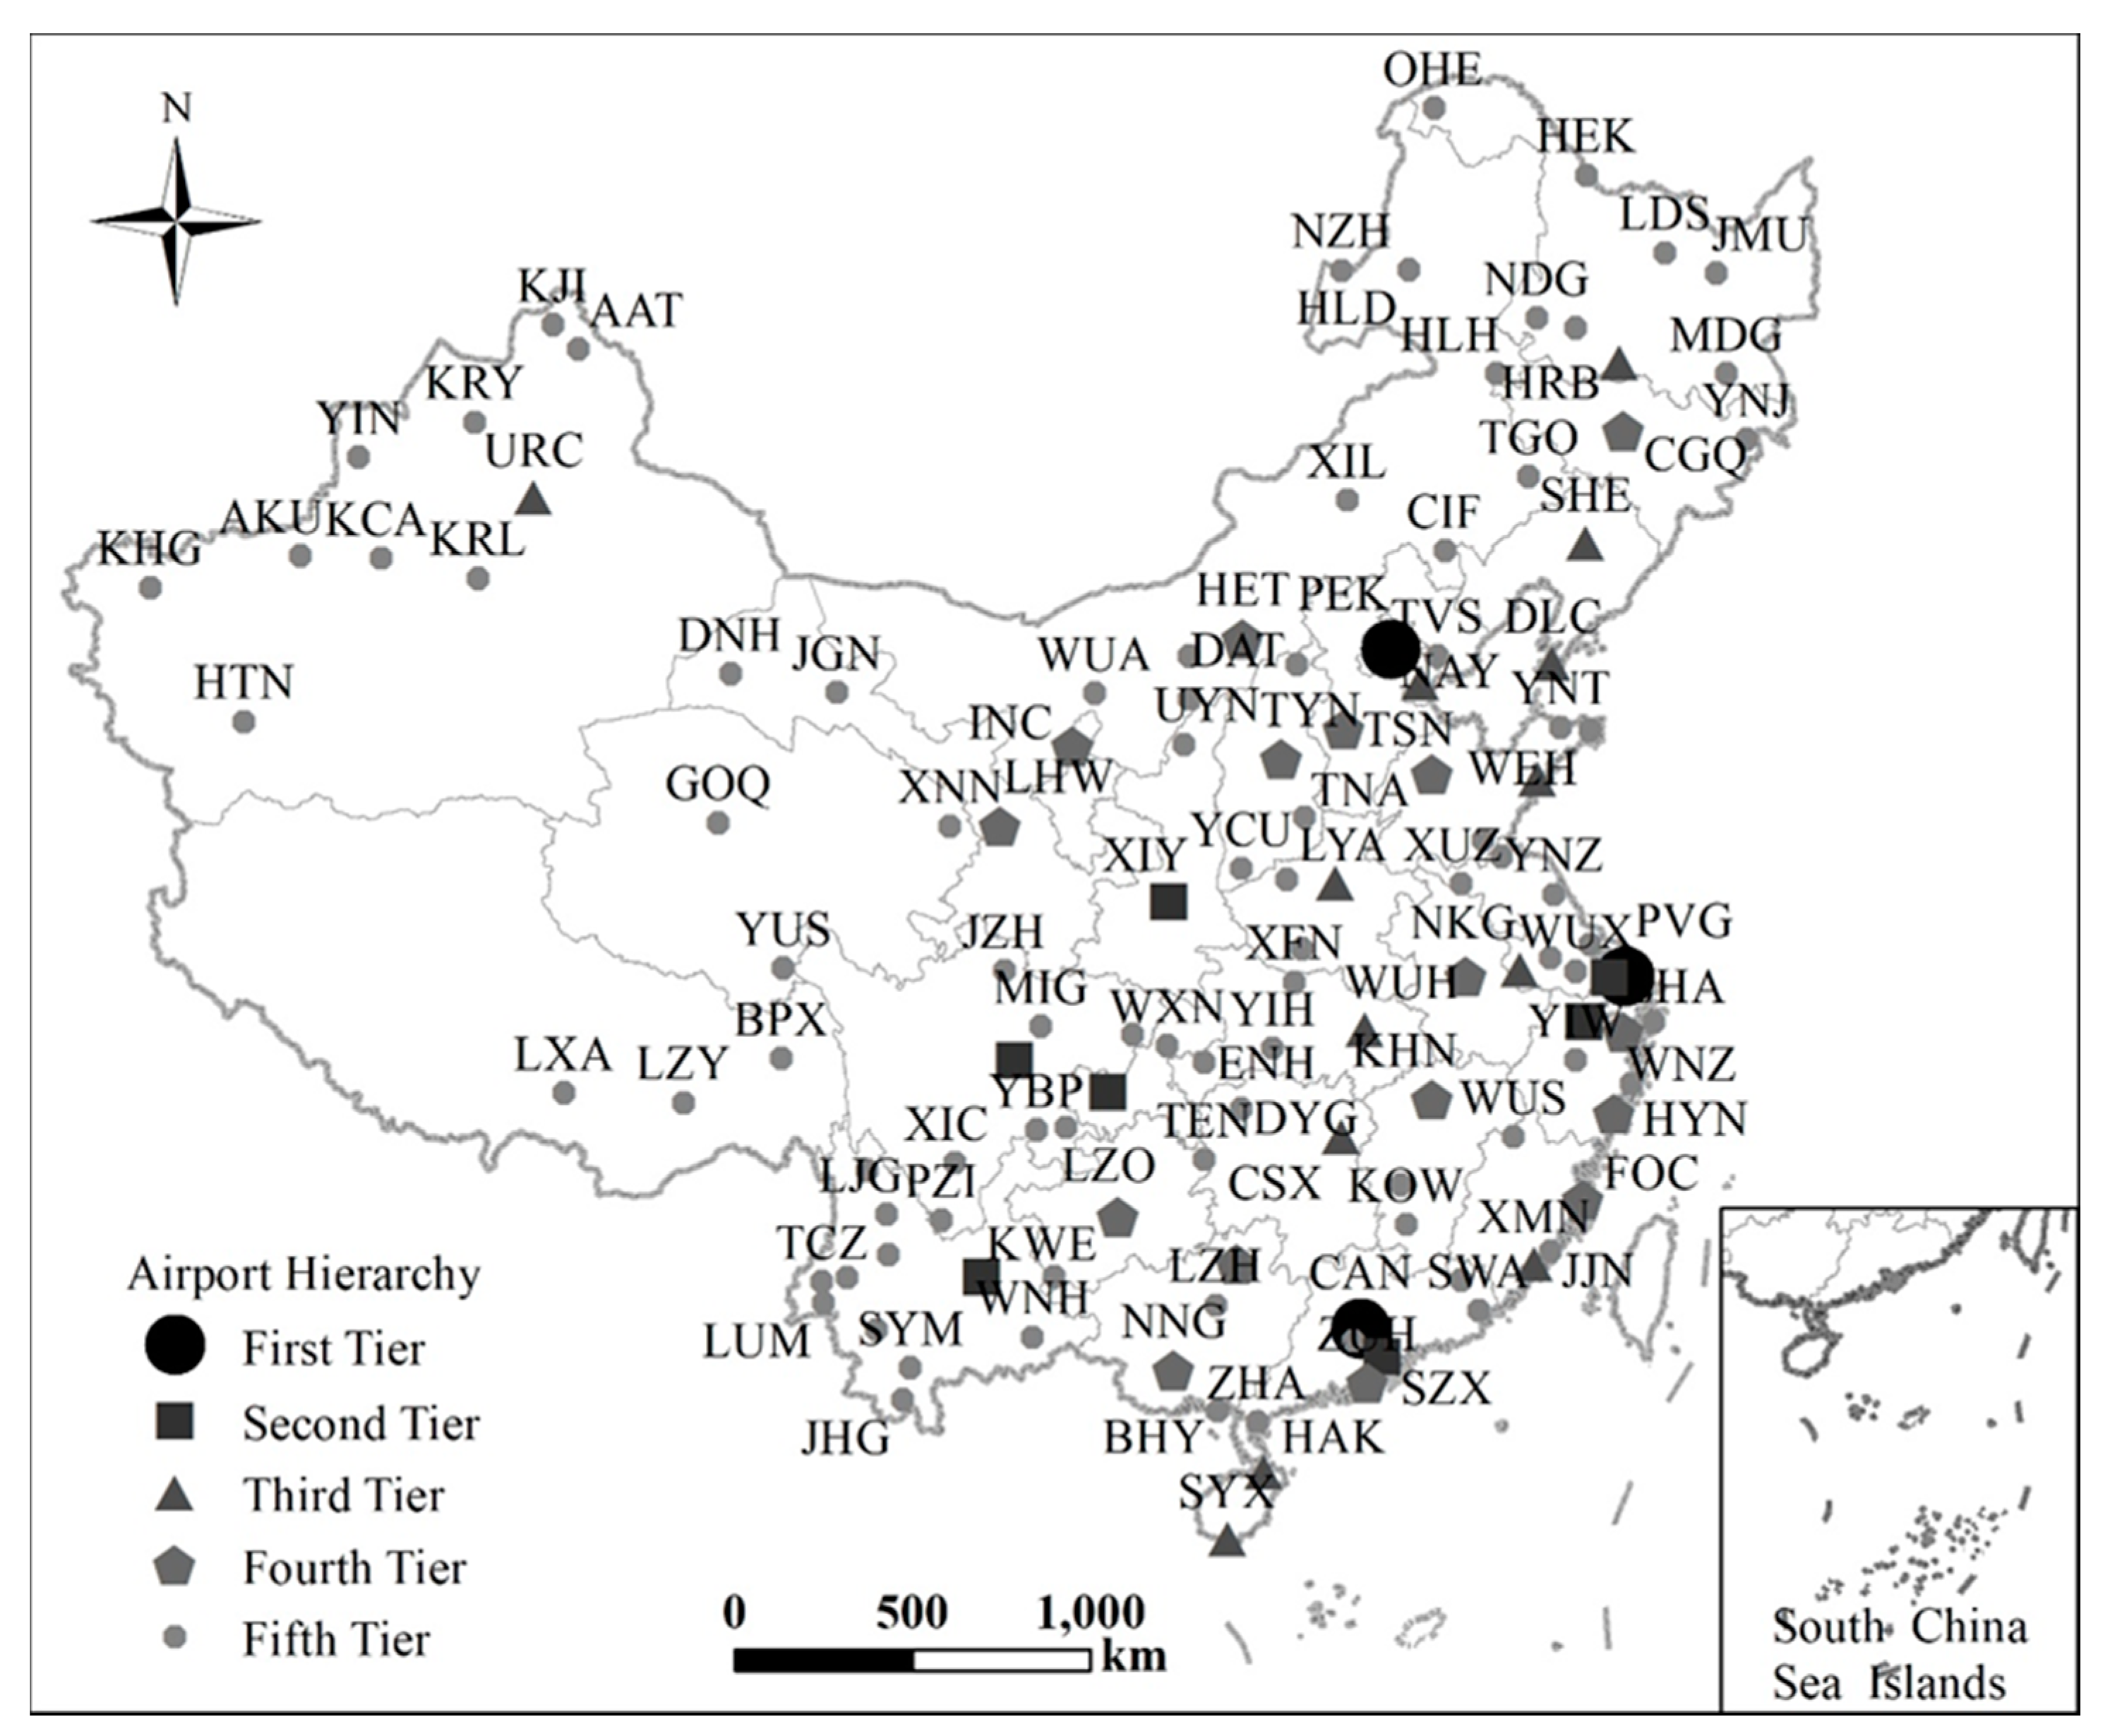
| This paper | Changes in population and enplanements | 5 | 127 | 3: PEK, PVG, CAN | 7: SZX, KMG, CTU, XIY, CKG, HGH, SHA | 13: NKG, WUH, TSN, XMN, CGO, and another 8 airports | 16: KWE, TNA, NNG, LHW, FOC, and another 11 airports | 88: WUX, YNT, XNN, JJN, SWA, and another 83 airports |
| Statistic | 2011 | 2017 |
|---|---|---|
| Number of airports | 127 | 127 |
| Density | 0.048 | 0.069 |
| Average degree | 6.079 | 8.701 |
| Existing ties | 772 | 1105 |
| Changes | ||
| Jaccard index | 0.439 | |
| No tie: 0 → 0 | 14698 | |
| New tie: 0 → 1 | 532 | |
| Broken tie: 1 → 0 | 199 | |
| Maintained tie: 1 → 1 | 573 | |
| Airport Hierarchy | Airport Number | Number of Routes Per Airport | Share of Number of Routes Per Airport | ||||
|---|---|---|---|---|---|---|---|
| 2011 | 2017 | Change (%) | 2011 | 2017 | Change (%) | ||
| First Tier | 3 | 63 | 66 | 4.8 | 40.2 | 34.1 | −15.2 |
| Second Tier | 7 | 42 | 54 | 28.6 | 27.0 | 28.1 | 4.1 |
| Third Tier | 13 | 27 | 38 | 40.7 | 17.5 | 20.0 | 14.3 |
| Fourth Tier | 16 | 21 | 29 | 38.1 | 13.6 | 15.0 | 10.3 |
| Fifth Tier | 88 | 3 | 5 | 66.7 | 1.7 | 2.8 | 64.7 |
| Total | 127 | 156 | 193 | 23.7 | 100.0 | 100.0 | 0.0 |
| Distance Type (km) | Number of Routes | Share of Number of Routes | ||||
|---|---|---|---|---|---|---|
| 2011 | 2017 | Change (%) | 2011 | 2017 | Change (%) | |
| <=1000 | 330 | 408 | 23.6 | 42.7 | 36.9 | −13.6 |
| 1001–2000 | 363 | 551 | 51.8 | 47.0 | 49.9 | 6.0 |
| >2000 | 79 | 146 | 84.8 | 10.2 | 13.2 | 29.1 |
| Total | 772 | 1105 | 43.1 | 100.0 | 100.0 | 0.0 |
| Route Type | Number of Routes | Share of Number of Routes | ||||
|---|---|---|---|---|---|---|
| 2011 | 2017 | Change (%) | 2011 | 2017 | Change (%) | |
| Routes served only by LCC | 2 | 0 | −100.0 | 0.3 | 0.0 | −100.0 |
| Routes served only by HSR | 310 | 764 | 146.5 | 40.2 | 69.1 | 72.2 |
| Routes served by both LCC and HSR | 36 | 107 | 197.2 | 4.7 | 9.7 | 107.7 |
| Others | 426 | 234 | −45.1 | 55.2 | 21.2 | −61.6 |
| Total | 772 | 1105 | 43.1 | 100.0 | 100.0 | 0.0 |
| Parameters | Mode1 | Mode2 | Mode3 | Mode4 | Mode5 | Model6 | Mode7 |
|---|---|---|---|---|---|---|---|
| Rate parameter | 10.374 *** (0.547) | 10.095 *** (0.532) | 10.039 *** (0.511) | 9.242 *** (0.470) | 9.257 *** (0.474) | 11.589 *** (0.595) | 11.684 *** (0.604) |
| Outdegree (density) | −0.967 *** (0.233) | −0.961 *** (0.156) | −0.955 *** (0.216) | −0.885 *** (0.255) | −0.890 *** (0.258) | 0.407 (0.332) | 0.358 (0.349) |
| Transitive triplets | 0.204 *** (0.065) | 0.209 *** (0.039) | 0.212 *** (0.068) | 0.255 *** (0.081) | 0.255 *** (0.062) | 0.054 *** (0.019) | 0.054 *** (0.020) |
| Betweenness | −0.102 (0.11) | −0.092 (0.056) | −0.086 (0.097) | −0.096 (0.122) | −0.096 (0.154) | −0.272 *** (0.049) | −0.269 *** (0.053) |
| NbrDist2 | −0.129 * (0.075) | −0.139 *** (0.036) | −0.151 ** (0.074) | −0.160 ** (0.080) | −0.159 (0.108) | −0.091 *** (0.022) | −0.092 *** (0.021) |
| DistanceMedium | −0.554 * (0.332) | −0.443 (0.305) | −0.502 (0.349) | −0.391 (0.371) | −0.765 * (0.450) | −0.754 * (0.419) | |
| DistanceLong | −0.142 (0.497) | −0.167 (0.635) | −0.606 (0.696) | −0.552 (0.587) | −1.604 ** (0.740) | −1.605 ** (0.695) | |
| LCC | −1.550 *** (0.438) | −1.522 *** (0.568) | −2.395 *** (0.857) | −3.523 *** (0.818) | −3.388 *** (0.947) | ||
| HSRBothEnds | −1.362 *** (0.349) | −1.512 ** (0.641) | −3.457 *** (1.032) | −3.165 *** (0.739) | |||
| LCC*HSRBothEnds | 1.388 (0.855) | 2.169 * (1.117) | 2.139 ** (0.975) | ||||
| FirstTier ego | 5.226 *** (1.297) | 5.190 *** (1.226) | |||||
| SecondTier ego | 6.968 *** (1.505) | 6.797 *** (1.616) | |||||
| ThirdTier ego | 5.154 *** (0.984) | 5.050 *** (1.061) | |||||
| FourthTier ego | 3.871 *** (0.769) | 3.720 *** (0.708) | |||||
| GrowingAirports ego | 0.508 * (0.269) | ||||||
| EmergingIntegratedNodes ego | 0.158 (0.167) | ||||||
| Score-type tests | 4.600 * df = 2 | 15.797 *** df = 1 | 12.490 *** df = 1 | 1.303 df = 1 | 4076.540 *** df = 4 | 5.059 * df = 2 | |
| Wald-type tests | 4.011 df = 2 | 8.055 *** df = 1 | 13.413 *** df = 1 | 1.726 df = 1 | 31.737 *** df = 4 | 5.000 * df = 2 | |
| Overall maximum convergence ratio | 0.126 | 0.105 | 0.071 | 0.115 | 0.150 | 0.170 |
| Airport Code | 2011 | 2017 | Difference |
|---|---|---|---|
| SJW | 7 | 25 | 18 |
| PVG | 7 | 19 | 12 |
| LHW | 0 | 9 | 9 |
| CGQ | 0 | 9 | 9 |
| SHE | 6 | 14 | 8 |
| NGB | 0 | 6 | 6 |
| SHA | 16 | 21 | 5 |
| BHY | 0 | 4 | 4 |
| Total | 38 | 107 | 69 |
© 2020 by the authors. Licensee MDPI, Basel, Switzerland. This article is an open access article distributed under the terms and conditions of the Creative Commons Attribution (CC BY) license (http://creativecommons.org/licenses/by/4.0/).
Share and Cite
Zhang, S.; Hu, Y.; Tang, X.; Fuellhart, K.; Dai, L.; Witlox, F. Modeling the Evolutionary Mechanism of China’s Domestic Air Transport Network. Sustainability 2020, 12, 6295. https://doi.org/10.3390/su12166295
Zhang S, Hu Y, Tang X, Fuellhart K, Dai L, Witlox F. Modeling the Evolutionary Mechanism of China’s Domestic Air Transport Network. Sustainability. 2020; 12(16):6295. https://doi.org/10.3390/su12166295
Chicago/Turabian StyleZhang, Shengrun, Yue Hu, Xiaowei Tang, Kurt Fuellhart, Liang Dai, and Frank Witlox. 2020. "Modeling the Evolutionary Mechanism of China’s Domestic Air Transport Network" Sustainability 12, no. 16: 6295. https://doi.org/10.3390/su12166295
APA StyleZhang, S., Hu, Y., Tang, X., Fuellhart, K., Dai, L., & Witlox, F. (2020). Modeling the Evolutionary Mechanism of China’s Domestic Air Transport Network. Sustainability, 12(16), 6295. https://doi.org/10.3390/su12166295