3. Research Design and Methods
3.1. Collecting the Big Data of GDELT Global News Knowledge Graph
Based on the self-developed software module 1, we collected all of the GDELT GKG records from 2017 to 2019 related to ten GaWC Alpha+ global cities (i.e., London, New York, Paris, Tokyo, Hong Kong, Shanghai, Singapore, Dubai, Sydney, and Beijing). We determined that a GKG record is related to a global city if the record contains the name of that city.
Each GKG record contains cognitive and affective information of the corresponding global news article. In this study, we kept the theme list (the V1THEMES field in the GKG record), the positive emotion accumulation (the Positive Score of V1.5TONE field in the GKG record), and the negative emotion accumulation (the Negative Score of V1.5TONE field in the GKG record) information of every global news article. The theme list corresponds to the cognitive information of the article, while the positive emotion accumulation and the negative emotion accumulation correspond to the affective information of the article.
The theme list contains all of the themes in the article and has already been translated into English by GDELT. Both the positive emotion accumulation (Positive Score) and the negative emotion accumulation (Negative Score) are in the range of [0, 100]. The value of the score represents the percentage of all words in the article that were found by GDELT to have a corresponding positive/negative emotional connotation. The higher the score, the more corresponding emotion the article contains.
We utilized the technology of unsupervised machine learning to mine the collected big data of the GDELT Global Knowledge Graph in order to assess global city brands. Specifically, this study adapted research methods of word-embedding semantic mining and clustering analysis, which are all based on the technology of unsupervised machine learning.
3.2. Constructing the Concepts of City Brand Attention, Positivity, and Influence Based on Word-Embedding Semantic Mining
Based on the combination of cognitive and affective theoretical perspectives on the Anholt’s global city brand dimension system, we conceptualized city brand attention, city brand positivity, and city brand influence, along with their corresponding dimensions of global cities, and we operationalized these concepts by constructing a word-embedding semantic mining research method on the big data of GDELT GKG records. By doing this, the values of city brand attention, positivity, and influence, along with their corresponding dimensions of global cities, can be empirically assessed. These values can then be utilized in order to capture the strengths and weaknesses, dimensional structures, and cluster characteristics of global city brands.
3.2.1. City Brand Attention
The conceptualization of city brand attention takes the cognitive theoretical perspective of city brands. The city brand attention measures the attention of global news media put on a global city brand and its dimensions. It captures the city brand awareness of every global city.
The construction of the dimensions of city brand attention takes the theoretical framework of Anholt’s global city brand dimension system. In other words, the global city brand attention contains six dimensions, including (1) presence attention, (2) place attention, (3) prerequisites attention, (4) people attention, (5) pulse attention, and (6) potential attention.
In this study, city brand attention of global cities is operationalized as the sum of projection from all of the related themes to each dimension in the high-dimensional word-embedding semantic space. The higher the value of city brand attention, the higher the awareness is of a global city brand.
3.2.2. City Brand Positivity
The conceptualization of city brand positivity takes the affective theoretical perspective of city brands. The city brand positivity measures the attitude of global news media toward a global city brand and its dimensions. It captures the city brand reputation of every global city.
The construction of the dimensions of city brand positivity also takes the theoretical framework of Anholt’s global city brand dimension system. In other words, the city brand positivity contains six dimensions, including (1) presence positivity, (2) place positivity, (3) prerequisites positivity, (4) people positivity, (5) pulse positivity, and (6) potential positivity.
In this study, the city brand positivity of global cities is operationalized as the ratio of the sum of projection from positive emotion accumulations brought by all of the related themes to each dimension, to the sum of projection from negative emotion accumulations brought by all of the related themes to each dimension in the high-dimensional semantic space of word vectors. The higher the value of city brand positivity, the more positive the reputation of the city brand. If the value of city brand positivity is larger than 1, then it means that the positive emotion accumulations are larger than the negative emotion accumulations, and vice versa.
3.2.3. City Brand Influence
The conceptualization of city brand influence takes the theoretical perspective of combining the cognitive and affective components of city brands. The city brand influence measures the product of city brand attention and city brand positivity. It captures city brand influence as constructed by the global news media. It represents the media image strength of city brands as well. It also reveals the competitiveness of a city brand’s media image.
The construction of city brand influence dimensions again takes the theoretical framework of Anholt’s global city brand dimension system. In other words, the city brand influence contains six dimensions, including (1) presence influence, (2) place influence, (3) prerequisites influence, (4) people influence, (5) pulse influence, and (6) potential influence.
In this study, the city brand influence of global cities is operationalized as the product of corresponding city brand attention and city brand positivity. The higher the value of city brand influence, the more influential the global city brand.
3.2.4. Word-Embedding Semantic Mining on GDELT Global News Knowledge Graph
Based on the self-developed software module 2, we calculated the city brand attention, positivity, and influence, along with their corresponding six dimensions from 2017 to 2019 for each of ten GaWC Alpha+ global cities. The calculations were based on the above conceptualizations and operationalizations and they were implemented by applying the word-embedding semantic mining to the collected big data of GDELT GKG records. The entire semantic mining procedure is described, as follows:
- (1)
Calculate the average word vectors for all of the GKG themes and city brand dimensions
The names of GKG themes and the descriptions of city brand dimensions contain corresponding keywords. We first retrieved the corresponding 300-dimensional word vectors for keywords of each GKG theme and each city brand dimension from the “GoogleNews-vectors-negative300” word2vec model, which was pre-trained by Google [
45]. Afterwards, we calculated the algorithmic mean of these word vectors for these keywords to obtain the average word vector that represents the semantic meaning of the corresponding GKG theme and city brand dimension.
- (2)
Assign related GKG themes to their corresponding city brand dimensions
We first obtained the semantic similarity between each pair of GKG theme and city brand dimension by calculating the cosine similarity of their corresponding average word vectors. Geometrically speaking, this cosine similarity represents the unit projection from the theme average word vector to the dimension average word vector in the 300-dimensional semantic space. We assigned a GKG theme to a particular city brand dimension only if the corresponding cosine similarity was greater than zero and was the largest among all six city brand dimensions. The reliability and validity of assessing the similarity of the semantic meaning of concepts based on the cosine similarity of their the average word vectors of corresponding keywords has already been proven by Garten et al. [
49].
- (3)
Calculate the city brand attention, positivity, and influence of global cities iteratively
For each GKG record covering a global city, we iterated through its theme list. For each GKG theme, we added the value 1, the Positive Score of this record, and the Negative Score of this record to the attention value, the positive emotion accumulation, and the negative emotion accumulation of a city brand dimension, respectively, if the theme could be assigned to that dimension. By iterating through all of the GKG records of global news articles, we obtained the sum of city brand attention, positive emotion accumulations, and negative emotion accumulations for each dimension of every global city.
The overall city brand attention for each global city was obtained by adding the values of all six dimensions of city brand attention. All of the values of the overall and the six dimensions of city brand attention for every global city were divided by the maximum dimensional value of city brand attention among all of the global cities. By doing this, all of the dimensional values of city brand attention were mapped to the range of [0, 1]. This does not affect the final results of city brand influence for comparison among global cities, but makes the values of both the city brand attention and the city brand influence more friendly to interpretation.
The values of all six dimensions of city brand positivity for each global city were obtained by dividing the corresponding dimensional positive emotion accumulations with the negative emotion accumulations. The overall city brand positivity for each global city was obtained by dividing the sum of positive emotion accumulations in all six dimensions with the sum of negative emotion accumulations in all six dimensions.
The values of all six dimensions of city brand influence for each global city were obtained by multiplying the corresponding dimensional value of city brand attention with city brand positivity. Additionally, the overall city brand influence for each global city was obtained by multiplying the corresponding value of overall city brand attention with overall city brand influence.
3.3. Clustering Analysis of the Global City Brands Based on Unsupervised Machine Learning
Based on the classic K-Means unsupervised machine learning algorithm, we performed clustering analysis on the six-dimensional structures (i.e., presence, place, prerequisites, people, and pulse) of global cities in three aspects of city brands (i.e., city brand attention, city brand positivity, and city brand influence). In each aspect, global cities were automatically clustered by the K-Means algorithm. Global cities with similar six-dimensional structures were placed in the same cluster, while global cities with very different six-dimensional structures were placed in different clusters. We then performed comparisons of structural characteristics among clusters of global cities.
Specifically, for each aspect of city brands (i.e., city brand attention, positivity, and influence), we first normalized the six-dimensional vector of each global city (i.e., the vector consisting of the city brand dimensional values of presence, place, prerequisites, people, and pulse) based on the l2 norm. By doing this, all six-dimensional vectors of global cities were scaled to the same length of 1 (i.e., the sum of squares of normalized dimensional values is 1). Additionally, the resulting unit vectors of global cities can be used to compare the structural characteristics of city brands on the same scale. We utilized the K-Means algorithm to cluster global cities based on their unit vectors, and then assessed the structural characteristics of different clusters of global cities based on their corresponding unit vectors of cluster centers. In order to find the optimal clustering results, we chose the K-Means++ [
50] algorithm in order to select initial cluster centers for the K-Means clustering algorithm.
4. Results
4.1. Numbers of Global News Articles Covering Global Cities
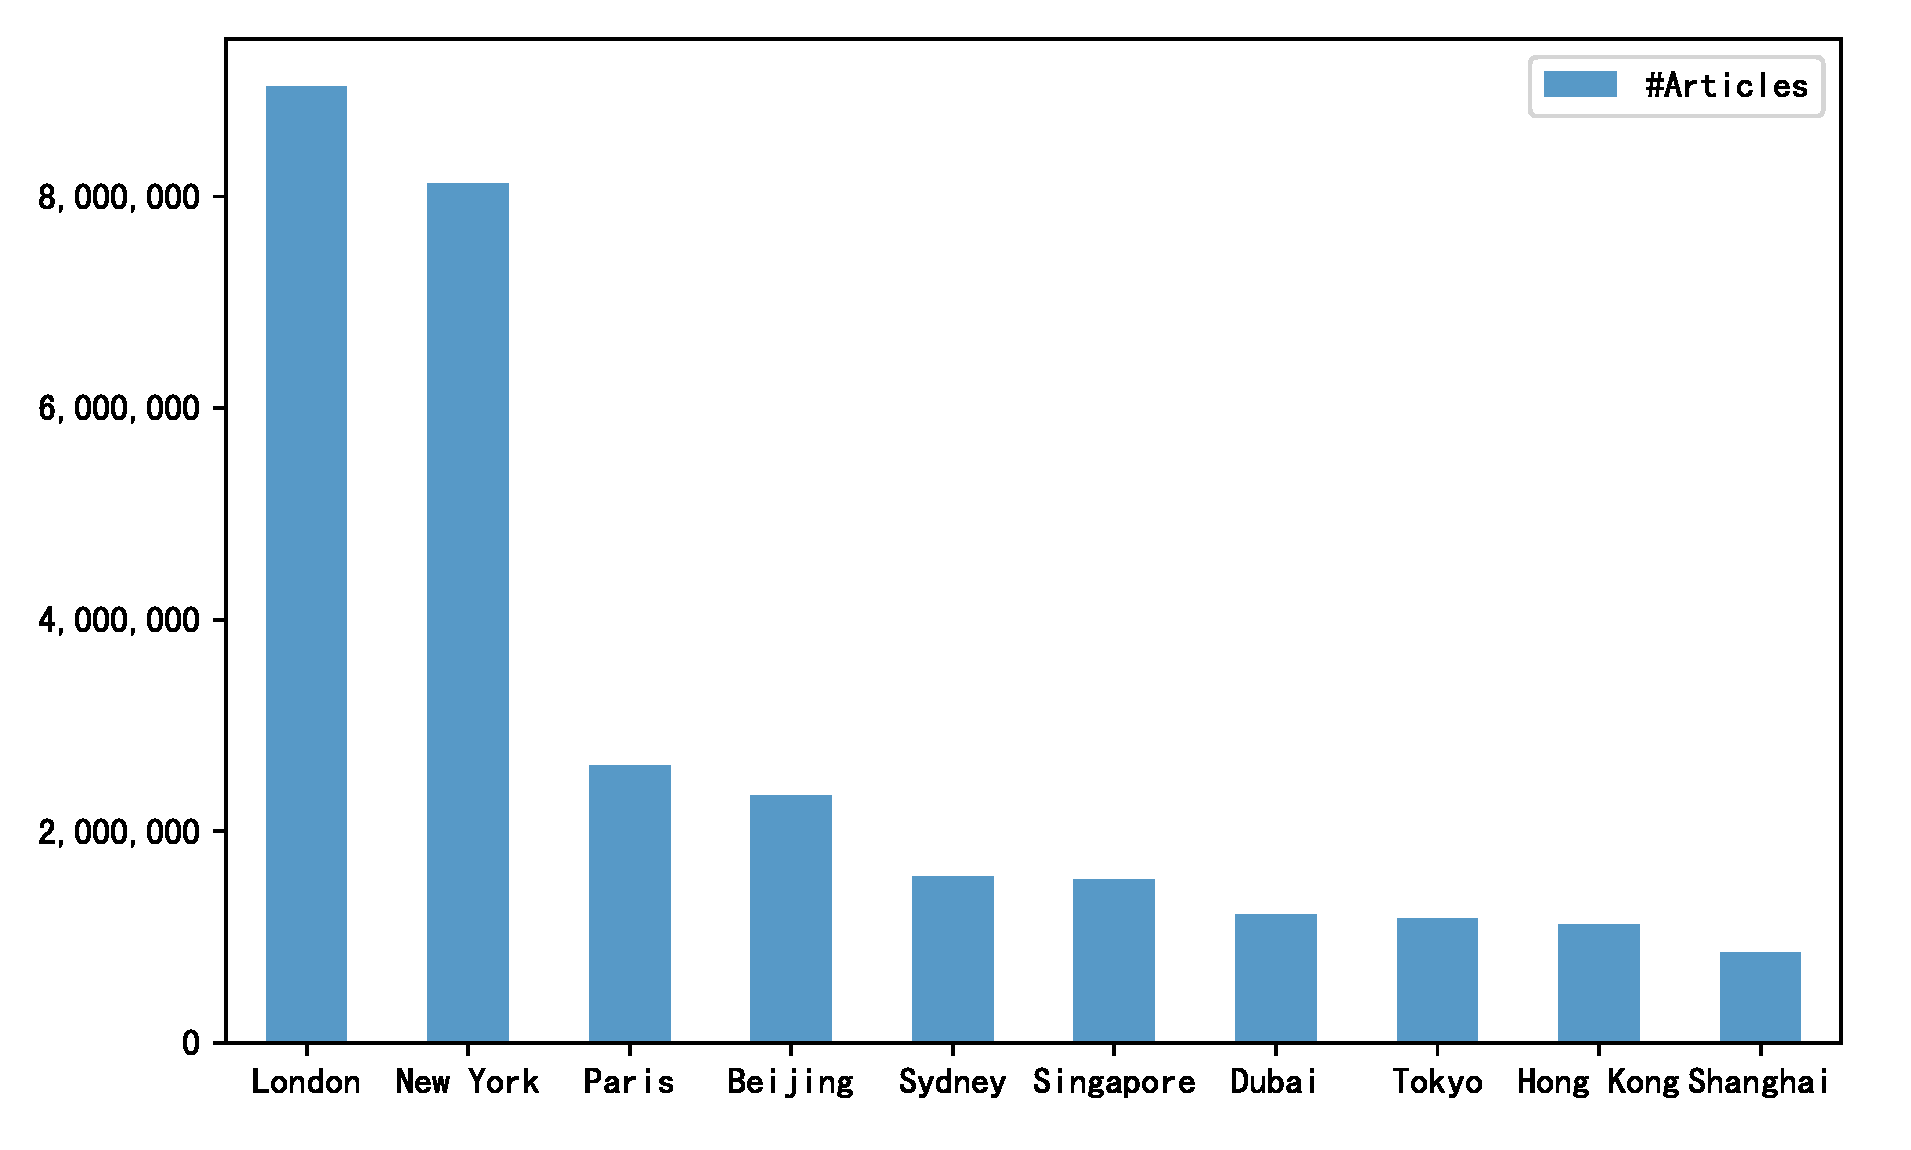
This study collected all of the GDELT GKG records of global news articles covering ten GaWC Alpha+ global cities (i.e., London, New York, Paris, Singapore, Tokyo, Hong Kong, Shanghai, Dubai, Beijing, and Sydney) from 2017 to 2019. The total size of the corresponding GKG records is 28.639 GB, which describe 29,608,153 global news articles. We performed word-embedding semantic mining and clustering analysis based on the technology of unsupervised machine learning on this collected full-sample dataset in order to assess and compare the city brand attention, positivity, and influence of these global cities.
Based on the number of related global news articles, ten global cities are ranked in a descending order as follows: London (9,035,815 articles), New York (8,119,397 articles), Paris (2,626,556 articles), Beijing (2,341,324 articles), Sydney (1,574,101 articles), Singapore (1,549,763 articles), Dubai (1,213,053 articles), Tokyo (1,175,845 articles), Hong Kong (1,119,537 articles), and Shanghai(852,762 articles). The numbers of related global news articles show a skewed distribution (Shapiro–Wilk test p < 0.001).
There is a huge gap in terms of numbers of related global news articles among global cities, as shown in
Figure 1. The difference between London, which has the highest number, and Shanghai, which has the lowest, is about 8.18 million. This value exceeds the number of global news articles covering any global city except London.
4.2. City Brand Attention of Global Cities
As shown in
Table 2, the differences among values of global city brand attention from 2017 to 2019 not only reflect the cognitive preferences of global news media over city brands of global cities, but also demonstrate the different city brand awareness of global cities.
Based on the overall values of global city brand attention, ten GaWC Alpha+ global cities are ranked in descending order, as follows: New York, London, Paris, Beijing, Singapore, Hong Kong, Tokyo, Sydney, Dubai, and Shanghai.
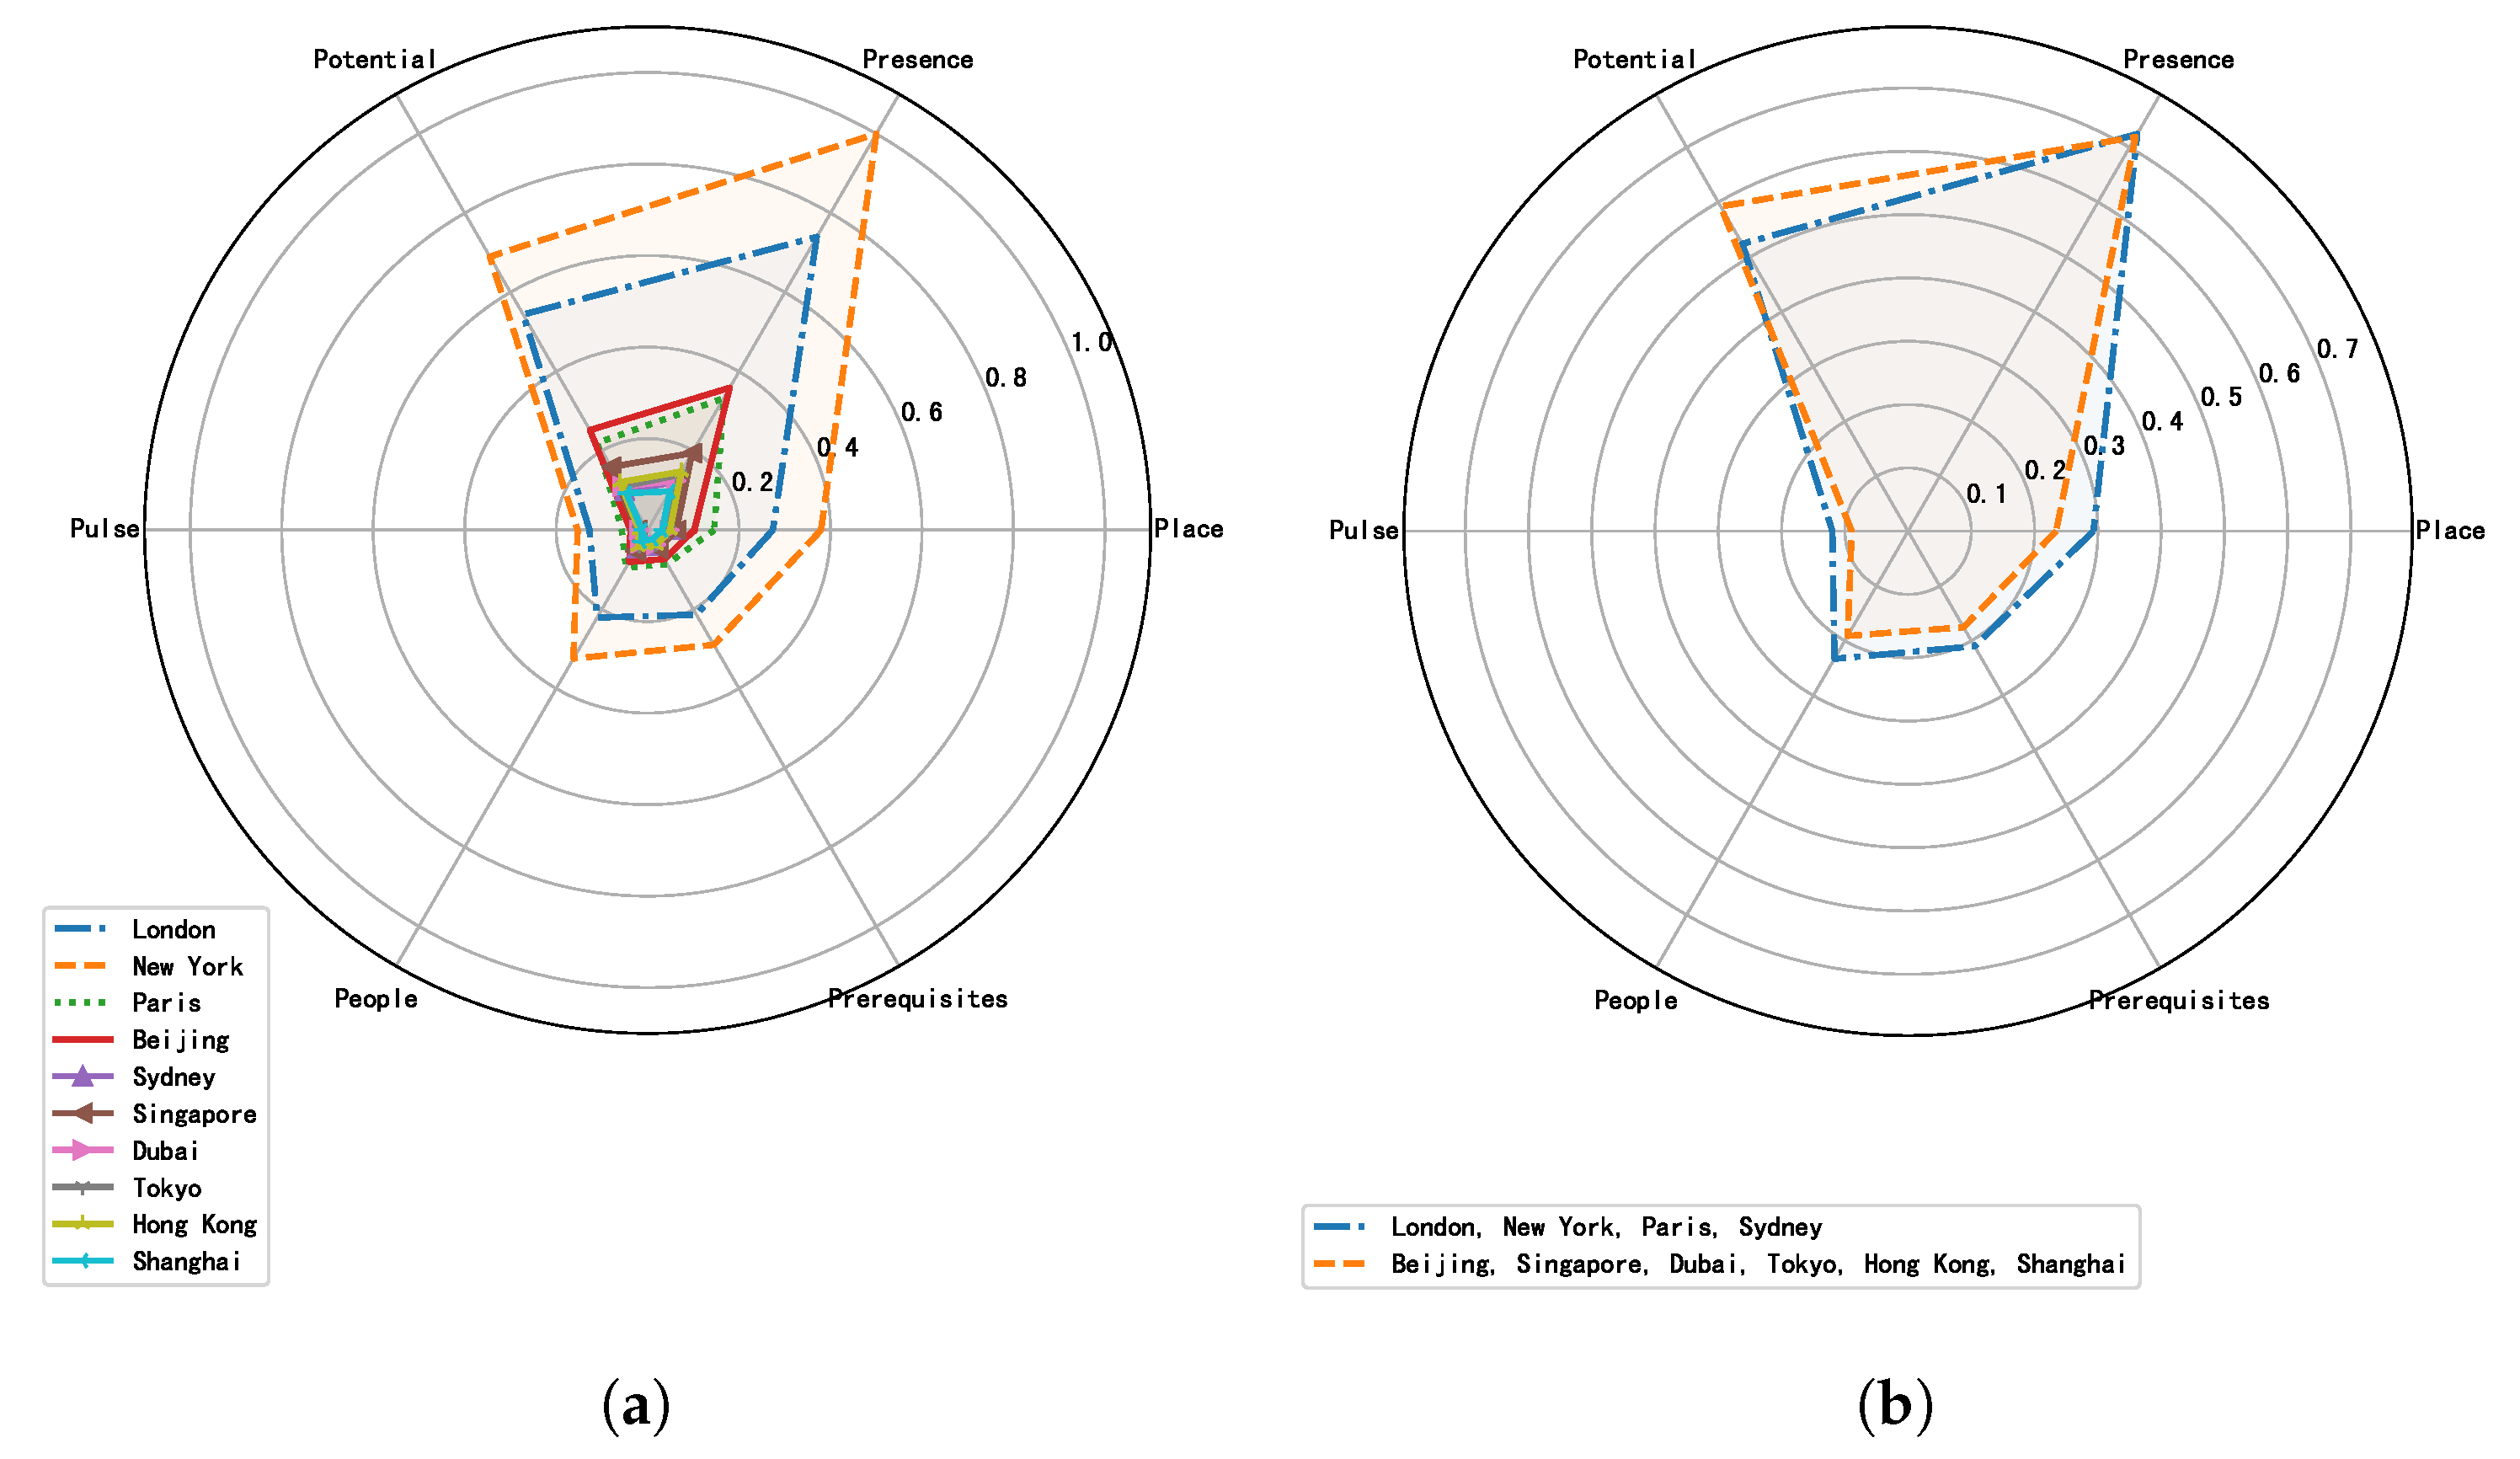
Judging from the six-dimensional values of global city brand attention (
Figure 2a), all of the six-dimensional structures of global cities share a common characteristic: there are significant differences among different dimensions of global city brand attention (one-way ANOVA F(5, 54) = 3.988,
p < 0.005, as shown in
Table 3). Specifically, (1) the dimension of presence is the most prominent, followed by the dimension of potential; (2) the dimensions of place, people, and prerequisites are medium; and, (3) the dimension of pulse is relatively low.
After performing the l2-norm-based normalization on the six-dimensional vectors of city brand attention for each global city and applying the K-Means algorithm to the corresponding normalized unit vectors, the ten global cities were automatically divided into two clusters that were based on their structural characteristics captured by the unit vectors. The best K (the number of clusters) is 2, and the sum of squared distances to the closest cluster center (inertia) is 0.024. Cluster 1 contains London, New York, Paris, and Sydney, while cluster 2 contains Beijing, Singapore, Dubai, Tokyo, Hong Kong, and Shanghai.
The structural characteristics of city brand attention clusters are captured by the unit vectors of cluster centers (
Figure 2b): (1) the global cities in cluster 1 have relatively higher normalized values in the city brand attention dimensions of place, people, prerequisites, and pulse; (2) the global cities in cluster 2 have relatively higher normalized values in the city brand attention dimension of potential; while, (3) both cluster centers have similar normalized value in the city brand attention dimension of presence.
4.3. City Brand Positivity of Global Cities
As shown in
Table 4, the differences among values of global city brand positivity from 2017 to 2019 not only reflect the affective preferences of global news media over city brands of global cities, but also demonstrate the different city brand reputation of global cities.
Based on the overall values of global city brand positivity, ten GaWC Alpha+ global cities are ranked in descending order, as follows: Singapore, Dubai, Shanghai, Sydney, London, Tokyo, New York, Hong Kong, Paris, and Beijing. The differences among overall city brand positivity values of global cities are small. In addition, as a common characteristic, their values are all below 1, which means that the sum of the negative emotion accumulations is higher than the sum of the positive emotion accumulations of global cities.
Based on the overall values of global city brand positivity, ten GaWC Alpha+ global cities are ranked in descending order, as follows: Singapore, Dubai, Shanghai, Sydney, London, Tokyo, New York, Hong Kong, Paris, and Beijing. The differences among overall city brand positivity values of global cities are small. In addition, as a common characteristic, their values are all below 1, which means that the sum of the negative emotion accumulations is higher than the sum of the positive emotion accumulations of global cities.
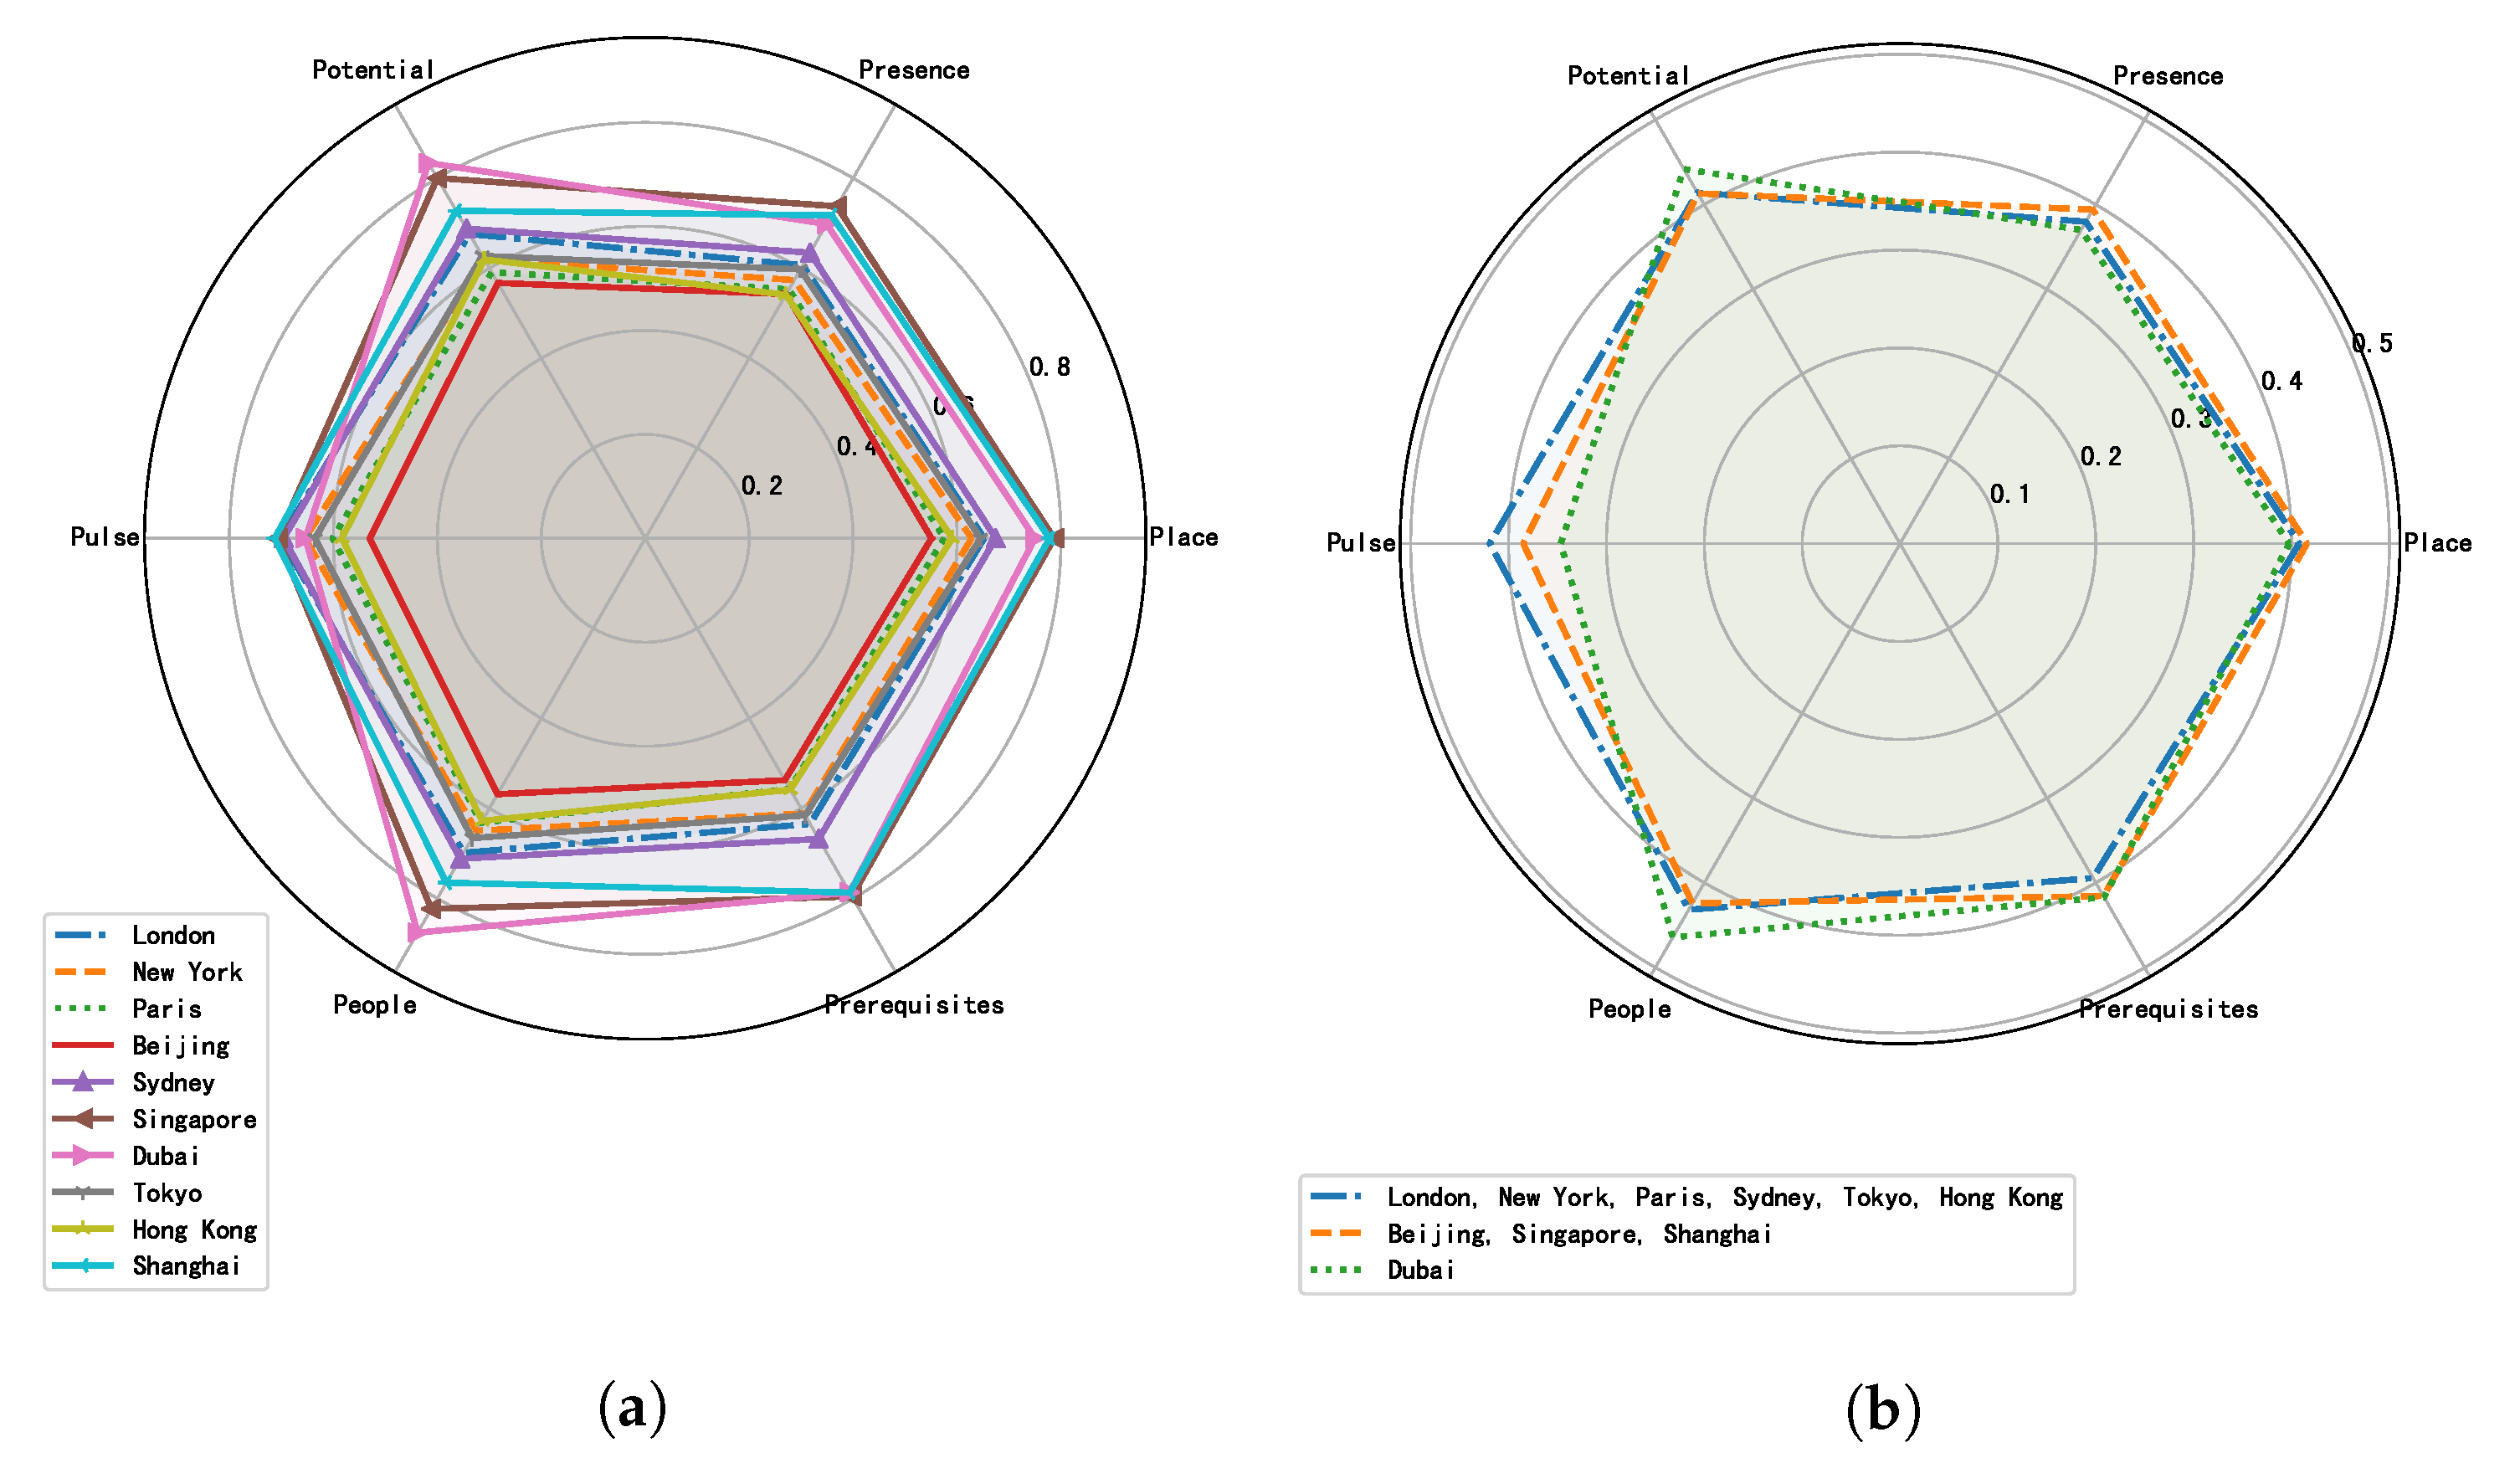
Judging from the six-dimensional values of global city brand positivity (
Figure 3a), all of the six-dimensional structures of global cities have a common characteristic: differences among different dimensions are not significant (one-way ANOVA F(5, 54) = 1.037,
p > 0.05, as shown in
Table 5). The global city brand positivity is relatively balanced across six dimensions.
After performing the l2-norm-based normalization on the six-dimensional vectors of city brand positivity for each global city and applying the K-Means algorithm to the corresponding normalized unit vectors, ten global cities are automatically divided into three clusters that are based on their structural characteristics captured by the unit vectors. The best K (the number of clusters) is 3 and the sum of squared distances to the closest cluster center (inertia) is 0.003. Cluster 1 contains London, New York, Paris, Sydney, Tokyo, and Hong Kong; cluster 2 contains Beijing, Singapore, and Shanghai; and, cluster 3 contains Dubai.
The structural characteristics of city brand positivity clusters are captured by the unit vectors of cluster centers (
Figure 3b): (1) there is little difference among all of the three clusters in terms of the city brand positivity dimensions of presence, place, and prerequisites; (2) cluster 3 has relatively higher normalized values in the city brand positivity dimensions of potential and people; and, (3) in the dimension of pulse, the normalized values of cluster 1, cluster 2, and cluster 3 are in descending order.
4.4. City Brand Influence of Global Cities
The differences among values of global city brand influence from 2017 to 2019 not only reflect the global city brands constructed by global news media based on the fusion of its cognitive and affective preferences, but also demonstrate the comprehensive influence of global city brands based on both their attention and positivity, as shown in
Table 6.
Based on the overall values of global city brand influence, ten GaWC Alpha+ global cities are ranked in descending order, as follows: New York, London, Paris, Beijing, Singapore, Dubai, Sydney, Hong Kong, Tokyo, and Shanghai. There are huge gaps between different global cities in terms of their overall city brand influence. Specifically, ten global cities form three levels: New York and London in the first level; Paris, Beijing, and Singapore in the second level; and, Dubai, Sydney, Hong Kong, Tokyo, and Shanghai in the third level.
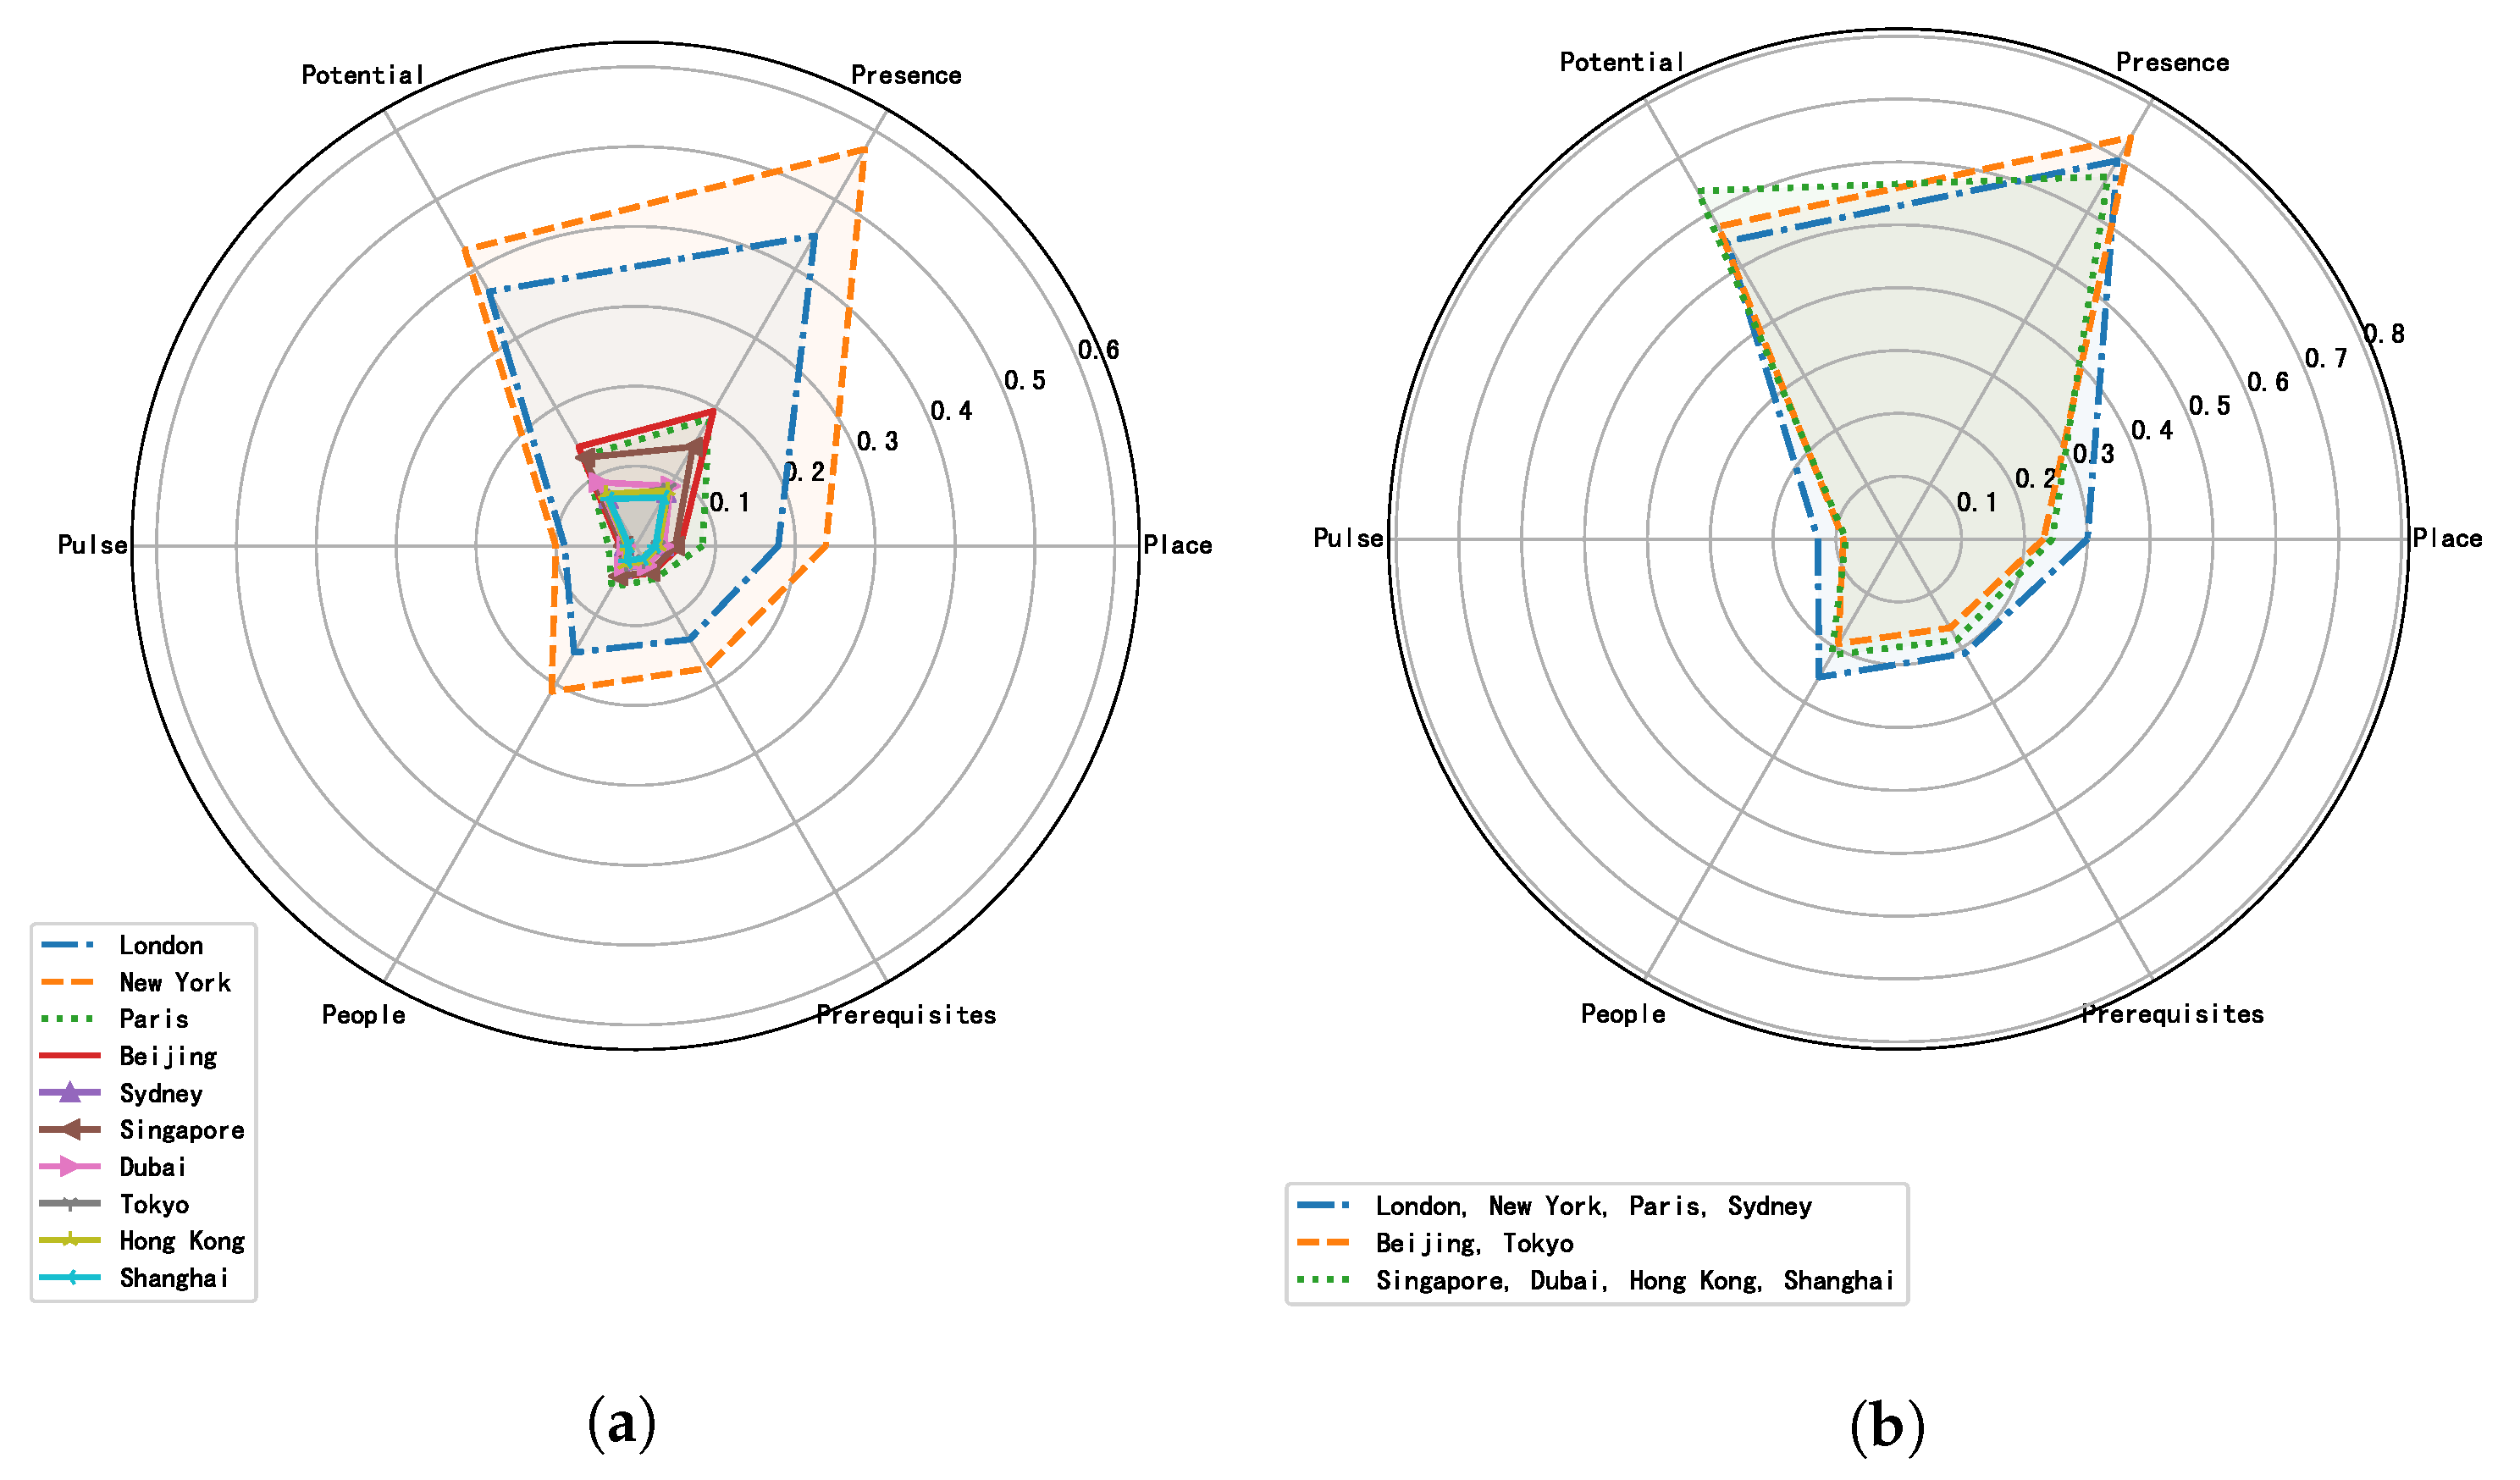
Judging from the six-dimensional values of global city brand influence (
Figure 4a), all of the six-dimensional structures of global cities share a common characteristic: there are significant differences among different dimensions of global city brand influence (one-way ANOVA F(5, 54) = 3.992,
p < 0.005, as shown in
Table 7). Specifically, (1) the dimension of presence is the most prominent followed by the dimension of potential; (2) the dimensions of place, people, and prerequisites are medium; while, (3) the dimension of pulse is relatively low.
After performing the l2-norm-based normalization on the six-dimensional vectors of city brand influence for each global city and applying the K-Means algorithm to the corresponding normalized unit vectors, ten global cities are automatically divided into three clusters based on their structural characteristics captured by the unit vectors. The best K (the number of clusters) is 3 and the sum of squared distances to the closest cluster center (inertia) is 0.017. Cluster 1 contains London, New York, Paris, and Sydney; cluster 2 contains Beijing and Tokyo; and, cluster 3 contains Singapore, Dubai, Hong Kong, and Shanghai.
The structural characteristics of city brand influence clusters are captured by the unit vectors of cluster centers (
Figure 4b): (1) the global cities in cluster 1 have relatively higher normalized values in the city brand influence dimensions of place, people, prerequisites, and pulse; (2) the global cities in cluster 2 have relatively higher normalized values in the city brand influence dimension of presence; and, (3) the global cities in cluster 3 have relatively higher normalized values in the city brand influence dimension of potential.
5. Conclusions and Discussion
The study adopted the research paradigm of computational social science and conducted theory-driven (city branding), data-driven (Google GDELT global news knowledge graph), and technology-driven (unsupervised machine learning) cross-disciplinary research in order to assess and compare the city brand attention, positivity, and influence, along with the dimensional structures of ten GaWC Alpha+ global cities projected by the global news media.
In terms of research materials (i.e., data collection), this study collected the big data of the GDELT global news knowledge graph, which covers the full-sample of cross-region, full-time (24/7), and multi-language global news articles related to ten global cities from 2017 to 2019. In terms of research method (i.e., data analysis), this study constructed an intelligent transforming and mapping method from the related GKG records to the city brand influence of global cities. From the theoretical perspective, this research method was built upon the theoretical framework of combining the cognitive and affective components of city brands, along with Anholt’s global city brand dimension system. From the technological perspective, this research method was implemented by performing word-embedding semantic mining and clustering analysis on the related GKG records that are based on the artificial intelligence technique of unsupervised machine learning.
In this study, comparative analysis of the overall and dimensional values of global city brands, along with their individual and cluster structural characteristics, were performed. The comprehensive conclusions on the global city brands of London, New York, Paris, Singapore, Tokyo, Hong Kong, Shanghai, Dubai, Beijing, and Sydney projected by the global news media are summarized, as follows:
- (1)
The city brand influence of ten global cities forms distinct levels and clusters.
Based on the overall values of the city brand influence of each city, ten global cities are ranked in descending order as follows: New York, London, Paris, Beijing, Singapore, Dubai, Sydney, Hong Kong, Tokyo, and Shanghai. Based on the overall and normalized six-dimensional values of city brand influence, these ten global cities form distinct levels and clusters, respectively.
From the perspective of overall city brand influence, three distinct levels of global cities are formed. The first level consists of New York and London; the second level consists of Paris, Beijing, and Singapore; and the third level consists of Dubai, Sydney, Hong Kong, Tokyo, and Shanghai. From the perspective of similar structural characteristics of city brand influence, three distinct clusters of global cities are formed. The first cluster consists of New York, London, Paris, and Sydney; the second cluster consists of Beijing and Tokyo; and, the third cluster consists of Singapore, Dubai, Hong Kong, and Shanghai, as detailed below.
The dimensional structures of global cities in the first cluster have higher normalized values in the city brand influence dimensions of place, people, prerequisites, and pulse. This indicates that along with the common structural characteristic shared by global cities, New York, London, Paris, and Sydney have more city brand influence in the quality of living, the prerequisites for development, and the “life” aspect of the “work–life” combination for people.
The dimensional structures of global cities in the second cluster have higher normalized values in the city brand influence dimension of presence. This indicates that along with the common structural characteristic shared by global cities, Beijing and Tokyo, have a growing city brand influence in terms of global awareness and global contributions.
The dimensional structures of global cities in the third cluster have higher normalized values in the city brand influence dimension of potential. This indicates that along with the common structural characteristic shared by global cities, Singapore, Dubai, Hong Kong, and Shanghai have more city brand influence in terms of opportunities for development and the “work” aspect in the “work–life” combination for people.
- (2)
Global cities share a common structural characteristic of city brand influence.
The six-dimensional structures of city brand influence of ten global cities follow a similar pattern:
The city brand influence dimensions of presence and potential are the highest of all dimensions. These two dimensions represent the city’s global status, standing, and contributions, along with the opportunities for development. In fact, high values of presence and potential within city brand influence is the most prominent characteristic of the ten global cities.
The city brand influence dimensions of place, people, and prerequisites are medium across dimensions. These three dimensions represent the quality of living and the prerequisites for development of cities. The dimensions of place and prerequisites represent the “hard conditions” for life and development, while the dimension of people represents the “soft conditions” of cultural diversity, friendliness, and safety. For the ten global cities, although the values of these three dimensions are not the most prominent, they are still relatively strong.
The city brand influence dimension of pulse is the lowest among all dimensions. This dimension represents the advanced requirements of “soft conditions,” i.e., finding interesting and exciting things to do in leisure time. For the ten global cities, this dimension is relatively insignificant.
- (3)
Western and Eastern global cities differentiate in the clustering of dimensional structures of city brand attention, positivity, and influence.
In the clustering of dimensional structures of city brand attention, positivity, and influence among global cities, New York, London, Paris, and Sydney are always in the same cluster. They are the global cities of the west and they have consistent and coherent structural characteristics in the clustering of city brand attention, positivity, and influence.
Global cities of the east (i.e., middle east, far east, and southeast Asia) vary in the clustering of dimensional structures of city brand attention, positivity, and influence.
In the clustering of dimensional structures of city brand attention, all of the global cities in the east are in the same cluster.
In the clustering of dimensional structures of city brand positivity, Tokyo and Hong Kong are in the same cluster as four western cities; Dubai, which is the global city in the middle east, forms a cluster itself; Beijing, Singapore, and Shanghai, which are global cities in the east with Mandarin as their native language, are in the same cluster.
In the clustering of dimensional structures of city brand influence, Beijing and Tokyo, capital global cities in the far east, are in the same cluster; while the rest of global cities in east Asia (i.e., Singapore, Hong Kong, and Shanghai), along with Dubai, form the other cluster of global cities in the east.
The city brand attention, positivity, and influence of global cities are constructed based on the projection from global news media image and assessed through unsupervised machine learning based semantic mining and clustering analysis on big data from the GDELT global news knowledge graph. The above conclusions not only unearth the very essence of these ten global cities, but also shed a light on discovering the cognitive and affective preferences of global news media toward these cities. Specifically, the empirical results of city brand attention primarily reflect the cognitive preferences, while the empirical results of city brand positivity primarily reflect the affective preferences. Additionally, the empirical results of city brand influence reflect how the cognitive and affective preferences are merged. We discuss the following implications of these preferences in an attempt to provide references for global city branding practice:
- (1)
Compared to city brand positivity, city brand attention is more important for improving the city brand influence of global cities.
As shown in the empirical results, the city brand influence of global cities is mainly determined by the city brand attention. In other words, the impact of city brand positivity on the city brand influence of global cities is much smaller. This affects not only the overall values, but also the dimensional structures of city brand influence. The difference in impact is due to the city brand influence being the product of corresponding city brand attention and positivity, the degree of variation of city brand attention being much higher than the degree of variation of city brand positivity, and the following three main characteristics of city brand positivity of global cities.
The overall and dimensional values of global city positivity are all smaller than 1. This indicates the corresponding sum of negative emotion accumulations of global news articles is higher than the positive emotion accumulations. In other words, news media usually takes a critical view and focuses on the negative aspects of the cities. Additionally, the news audience is likely to pay more attention to the negative news, which also reinforces the negative preferences of global news media. This is consistent with findings in the previous literature [
51,
52].
The differences among different dimensions of city brand positivity are not highly significant. This indicates that values of different dimensions of city brand positivity are at nearly the same level. For each global city, if one dimension of city brand positivity is high, then the rest of the dimensions are also high, and vice versa. It would be hard to significantly improve just a small subset of dimensions without improving the rest of the dimensions, and vice versa.
The differences among the overall values of city brand positivity of different global cities are small. According to the empirical results, there is a mild negative correlation between the city brand attention and city brand positivity, while the positive correlation between the city brand attention and city brand influence is much stronger. This indicates that, although improving the city brand attention of a global city (for example, improving the number of related global news articles) may bring a limited reduction in the city brand positivity, the corresponding improvement in city brand influence might be considerable.
- (2)
The preferences of global news media over global city brands fits the nature of global cities.
According to the conceptualization by Sassen [
1] and the operationalization by Beaverstock et al. [
2], global cities are the command centers of the world economy, the driving force in the strategic transnational network of cross-border dynamics, and the central nodes of global networks of producer services. Being influential and production/development-oriented is the nature of global cities. Additionally, as shown in the empirical results, global news media pays a great amount of attention to the global city brands that fit this nature. The preference structure of global news media over global cities is as follows:
Global cities that are more influential both internationally and domestically gain more attention from the global news media. On the one hand, the city brand attention and the city brand influence of New York and London are much higher than those of other global cities. They are also the two most internationally influential cities in the GaWC ranking system, They are at the level of Alpha++, while other global cities are at the level of Alpha+. Global media pays more attention to these two internally influential global cities. On the other hand, the first and second levels of overall values of city brand influence of global cities mostly consist of capitals, while the third level mostly consists of global cities that are not capitals. Capitals are more domestically influential, and global media pays more attention to them as well.
City brand dimensions that are more relevant to production and development gain more attention from the global news media. The common structural characteristic of city brand influence shows that global news media pays much more attention to the dimensions of presence and potential than other dimensions. These two dimensions represent the core functions of production and development of global cities (i.e., the global contributions, the economic and educational opportunities, and so on), while the rest of dimensions (i.e., place, prerequisites, people, and pulse) are more about the development prerequisites and living conditions for people in global cities.
One key contribution of this study is the construction of a word-embedding semantic mining solution for assessing the city brands of global cities through transforming and mapping from the big data of the GDELT global news knowledge graph. The academic and practical value are mainly reflected in the following three aspects: (1) the city branding theory-based projection from the media image of global cities constructed by global news media to global city brands; (2) the computational social science research method of unsupervised learning based semantic mining and clustering analysis on the big data of global knowledge graph; and, (3) the construction of concepts of city brand attention, city brand positivity, and city brand influence, along with their relationships and the roles in assessing the city brands of global cities.
Admittedly, the city brand influence of global cities in this study is only assessed based on the media image constructed by the global news media. In other words, the conclusions are made from the perspective of global news media’s presentation of global cities. Although the global news media is a major force in constructing global city brands and the full-sample big data of related global news articles mostly captures the objective nature of global cities, there are still other constructors of global city brands other than the global news media. Being unable to assess the global city brands from the perspectives of these constructors is the limitation of this study.
In future research, we will move from assessing the global city brands based on the global media image of global cities to assessing the global news media itself based on the theories of framing and agenda-setting, using the research paradigm of computational social science.


