Integrated Sustainability Assessment of Divergent Mediterranean Farming Systems: Cyprus as a Case Study


Abstract
1. Introduction
- The majority of farm level sustainability assessment tools use a visual integration approach and/or lists of individual indicators to present the results [2,9]. Only few of them combine visual and numerical integration approaches in order to maintain high level of transparency, detail and communicability. In fact, aggregation of indicator results (including normalization and weighting) to better aiding the decision-making process, is generally avoided in farm level sustainability assessment tools [9].
- Some approaches compare the sustainability of farms within a system or sector [3,11], whereas others compare the sustainability of quite similar FSs within a region [13,20]. As a matter of fact, sustainability frameworks are usually focused on a specific agricultural (sub)sector (e.g., dairy) or product; thus, the comparison of heterogeneous situations is not possible [7] and the dynamics of the wider agricultural sector are not considered [11]. In this perspective, studies using multiple indicators to compare the sustainability of different FSs or sectors would be very interesting [11,21]. An example of such a study is that of de Olde et al. [22].
2. Materials and Methods
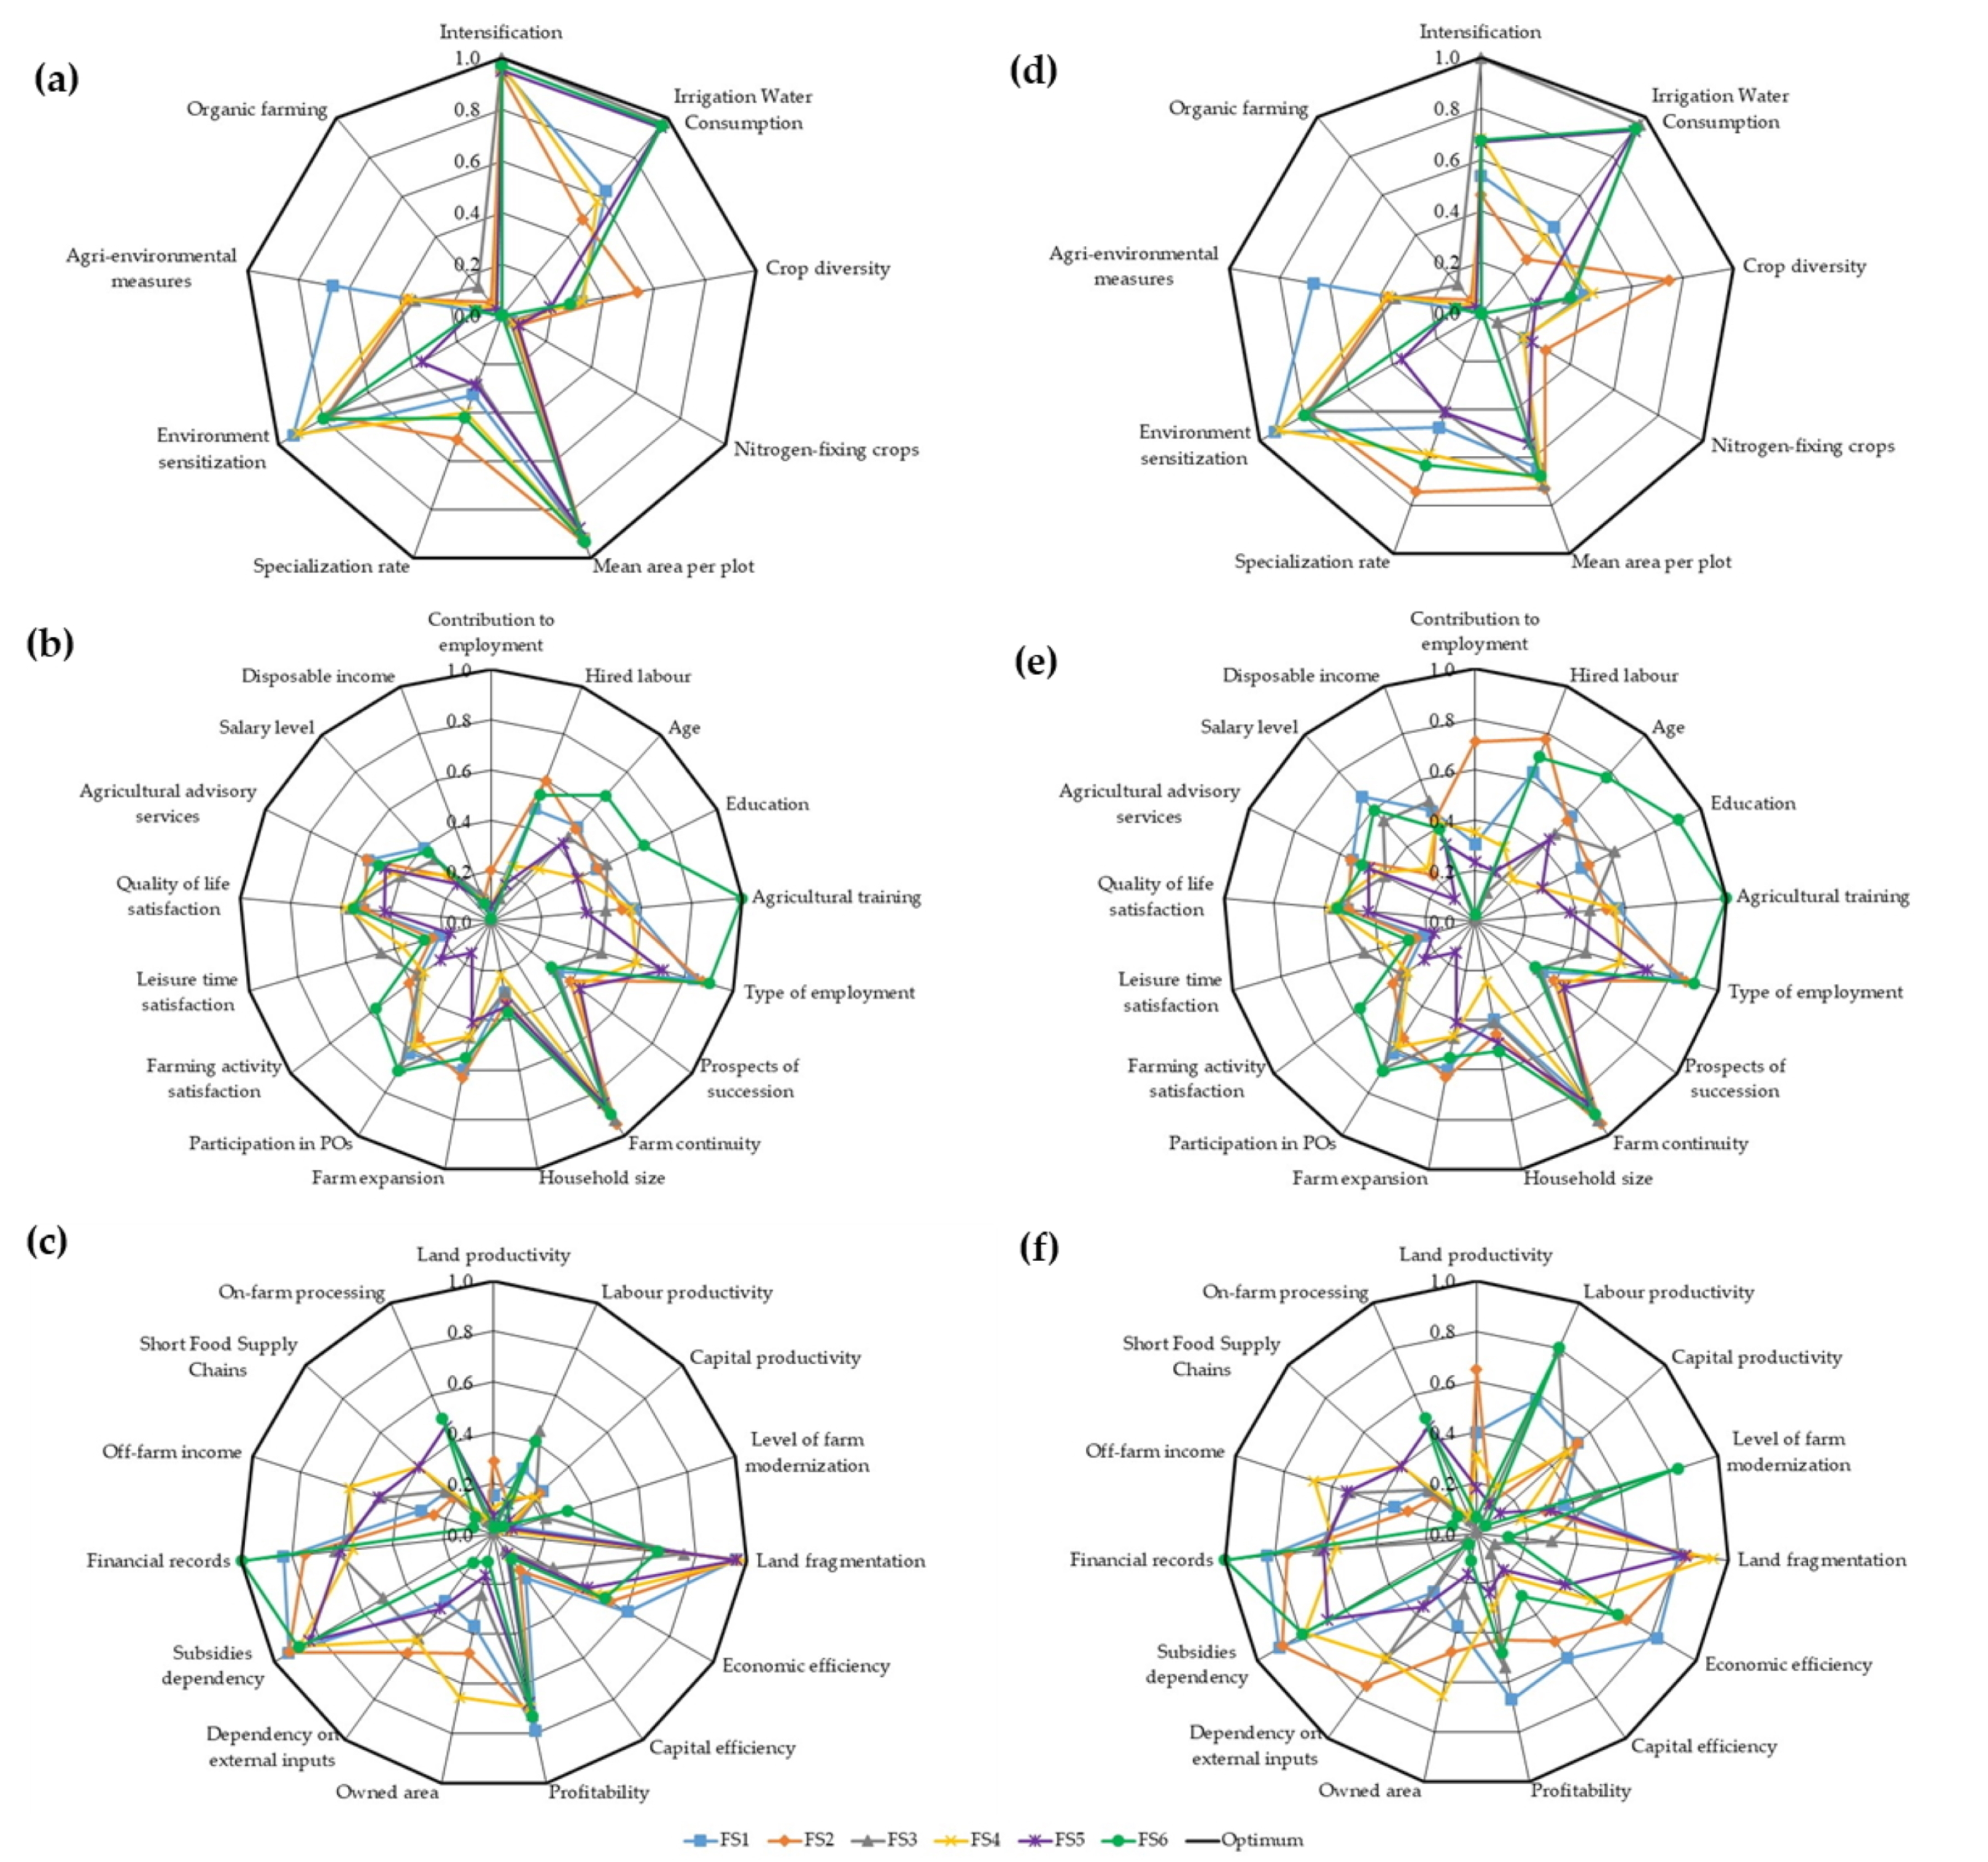
2.1. Case Studies
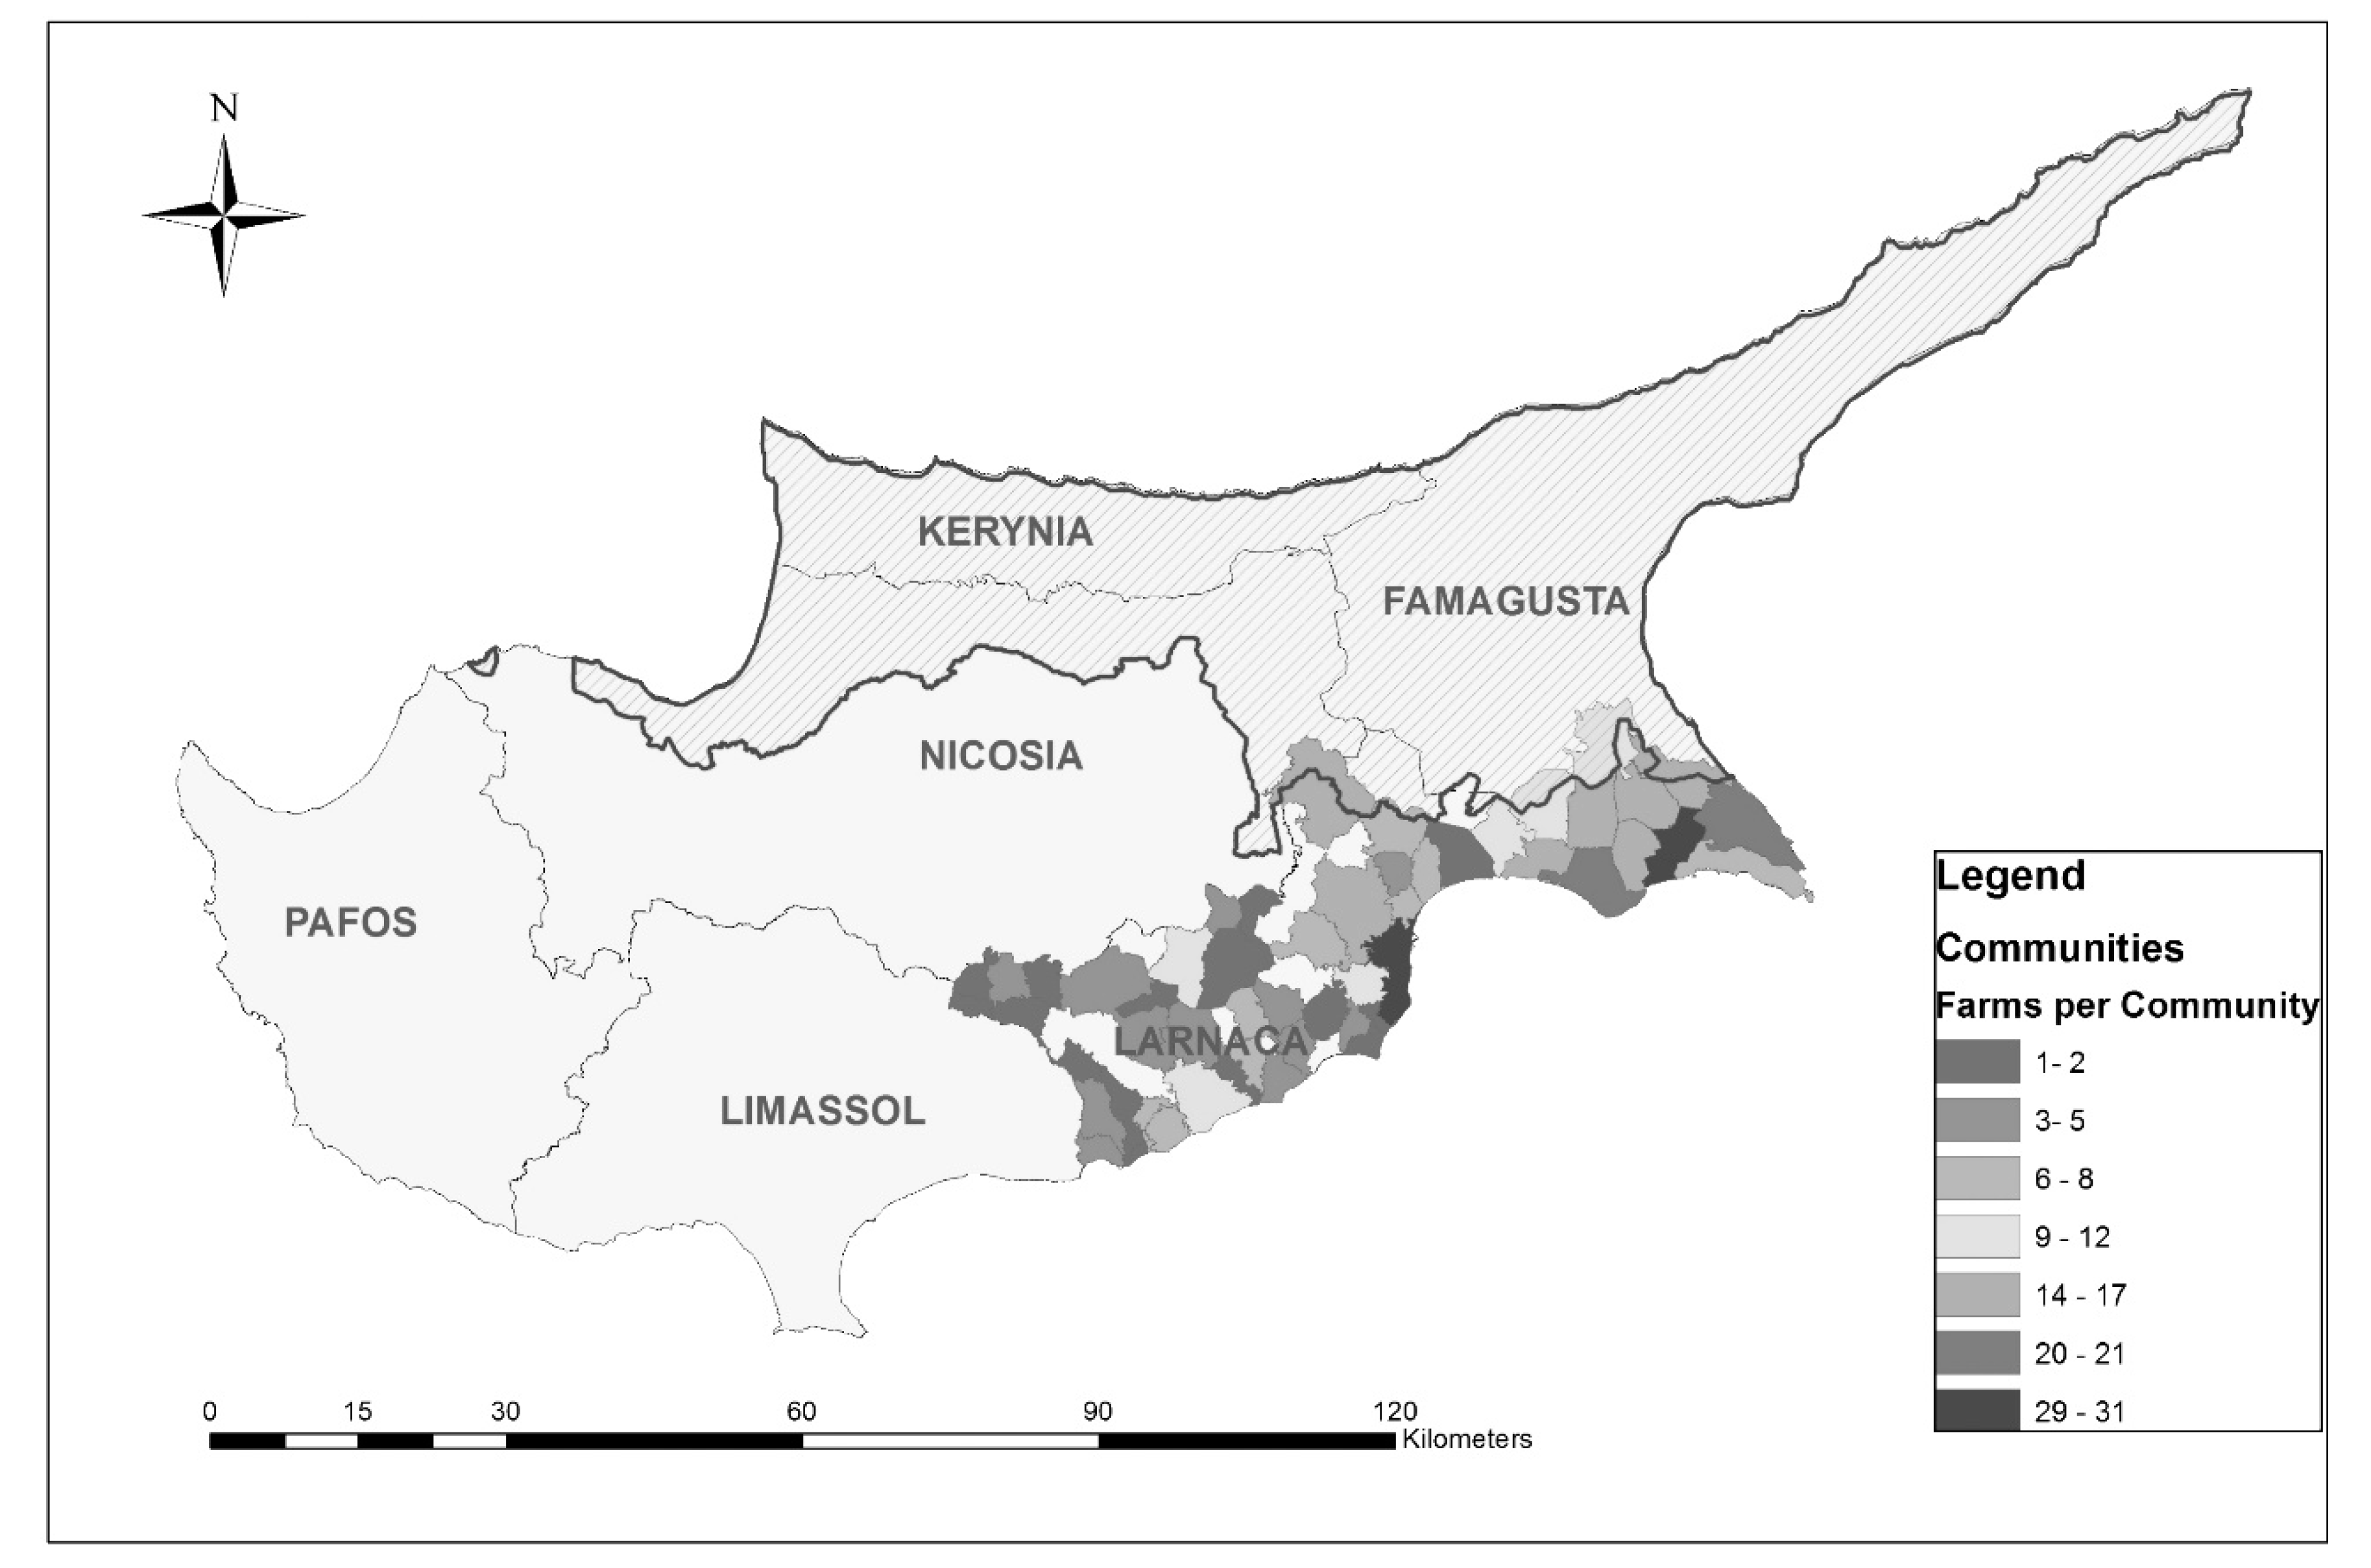
2.2. Methodological Framework
2.2.1. Sustainability Framework, Selection, and Calculation of Base Indicators
2.2.1.1. Contextualization of Sustainability Assessment
2.2.1.2. Selection of Base Indicators
2.2.1.3. Calculation of Base Indicators
2.2.2. Identification and Characterization of Farming Systems
2.2.3. Integrated Sustainability Assessment of Farming Systems
2.2.3.1. Numerical Integration
- Formulation of the theoretical framework.
- Selection and calculation of base indicators.
- Imputation of missing data.
- Correlation analysis between indicators of the same pillar.
- Normalization of indicators.
- Assignment of weights and aggregation.
- Decomposition of CSIs.
- Internal consistency and sensitivity analysis.
- Presentation of the results.
2.2.3.2. Visual Integration and Decomposition of CSIs (Stage 7)
2.2.3.3. Internal Consistency and Sensitivity Analysis (Stage 8)
3. Results and Discussion
3.1. Composite Sustainability Indices—Numerical Integration
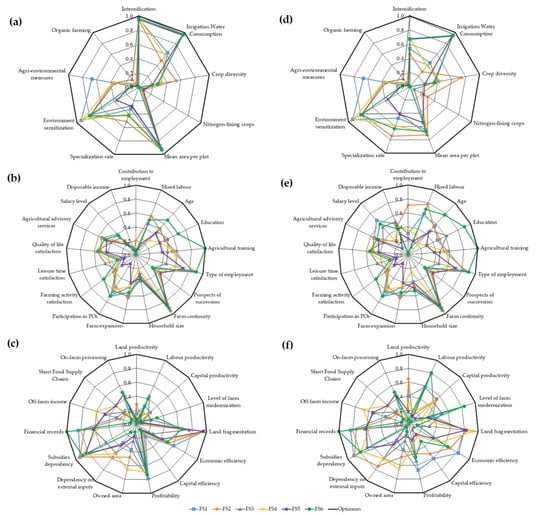
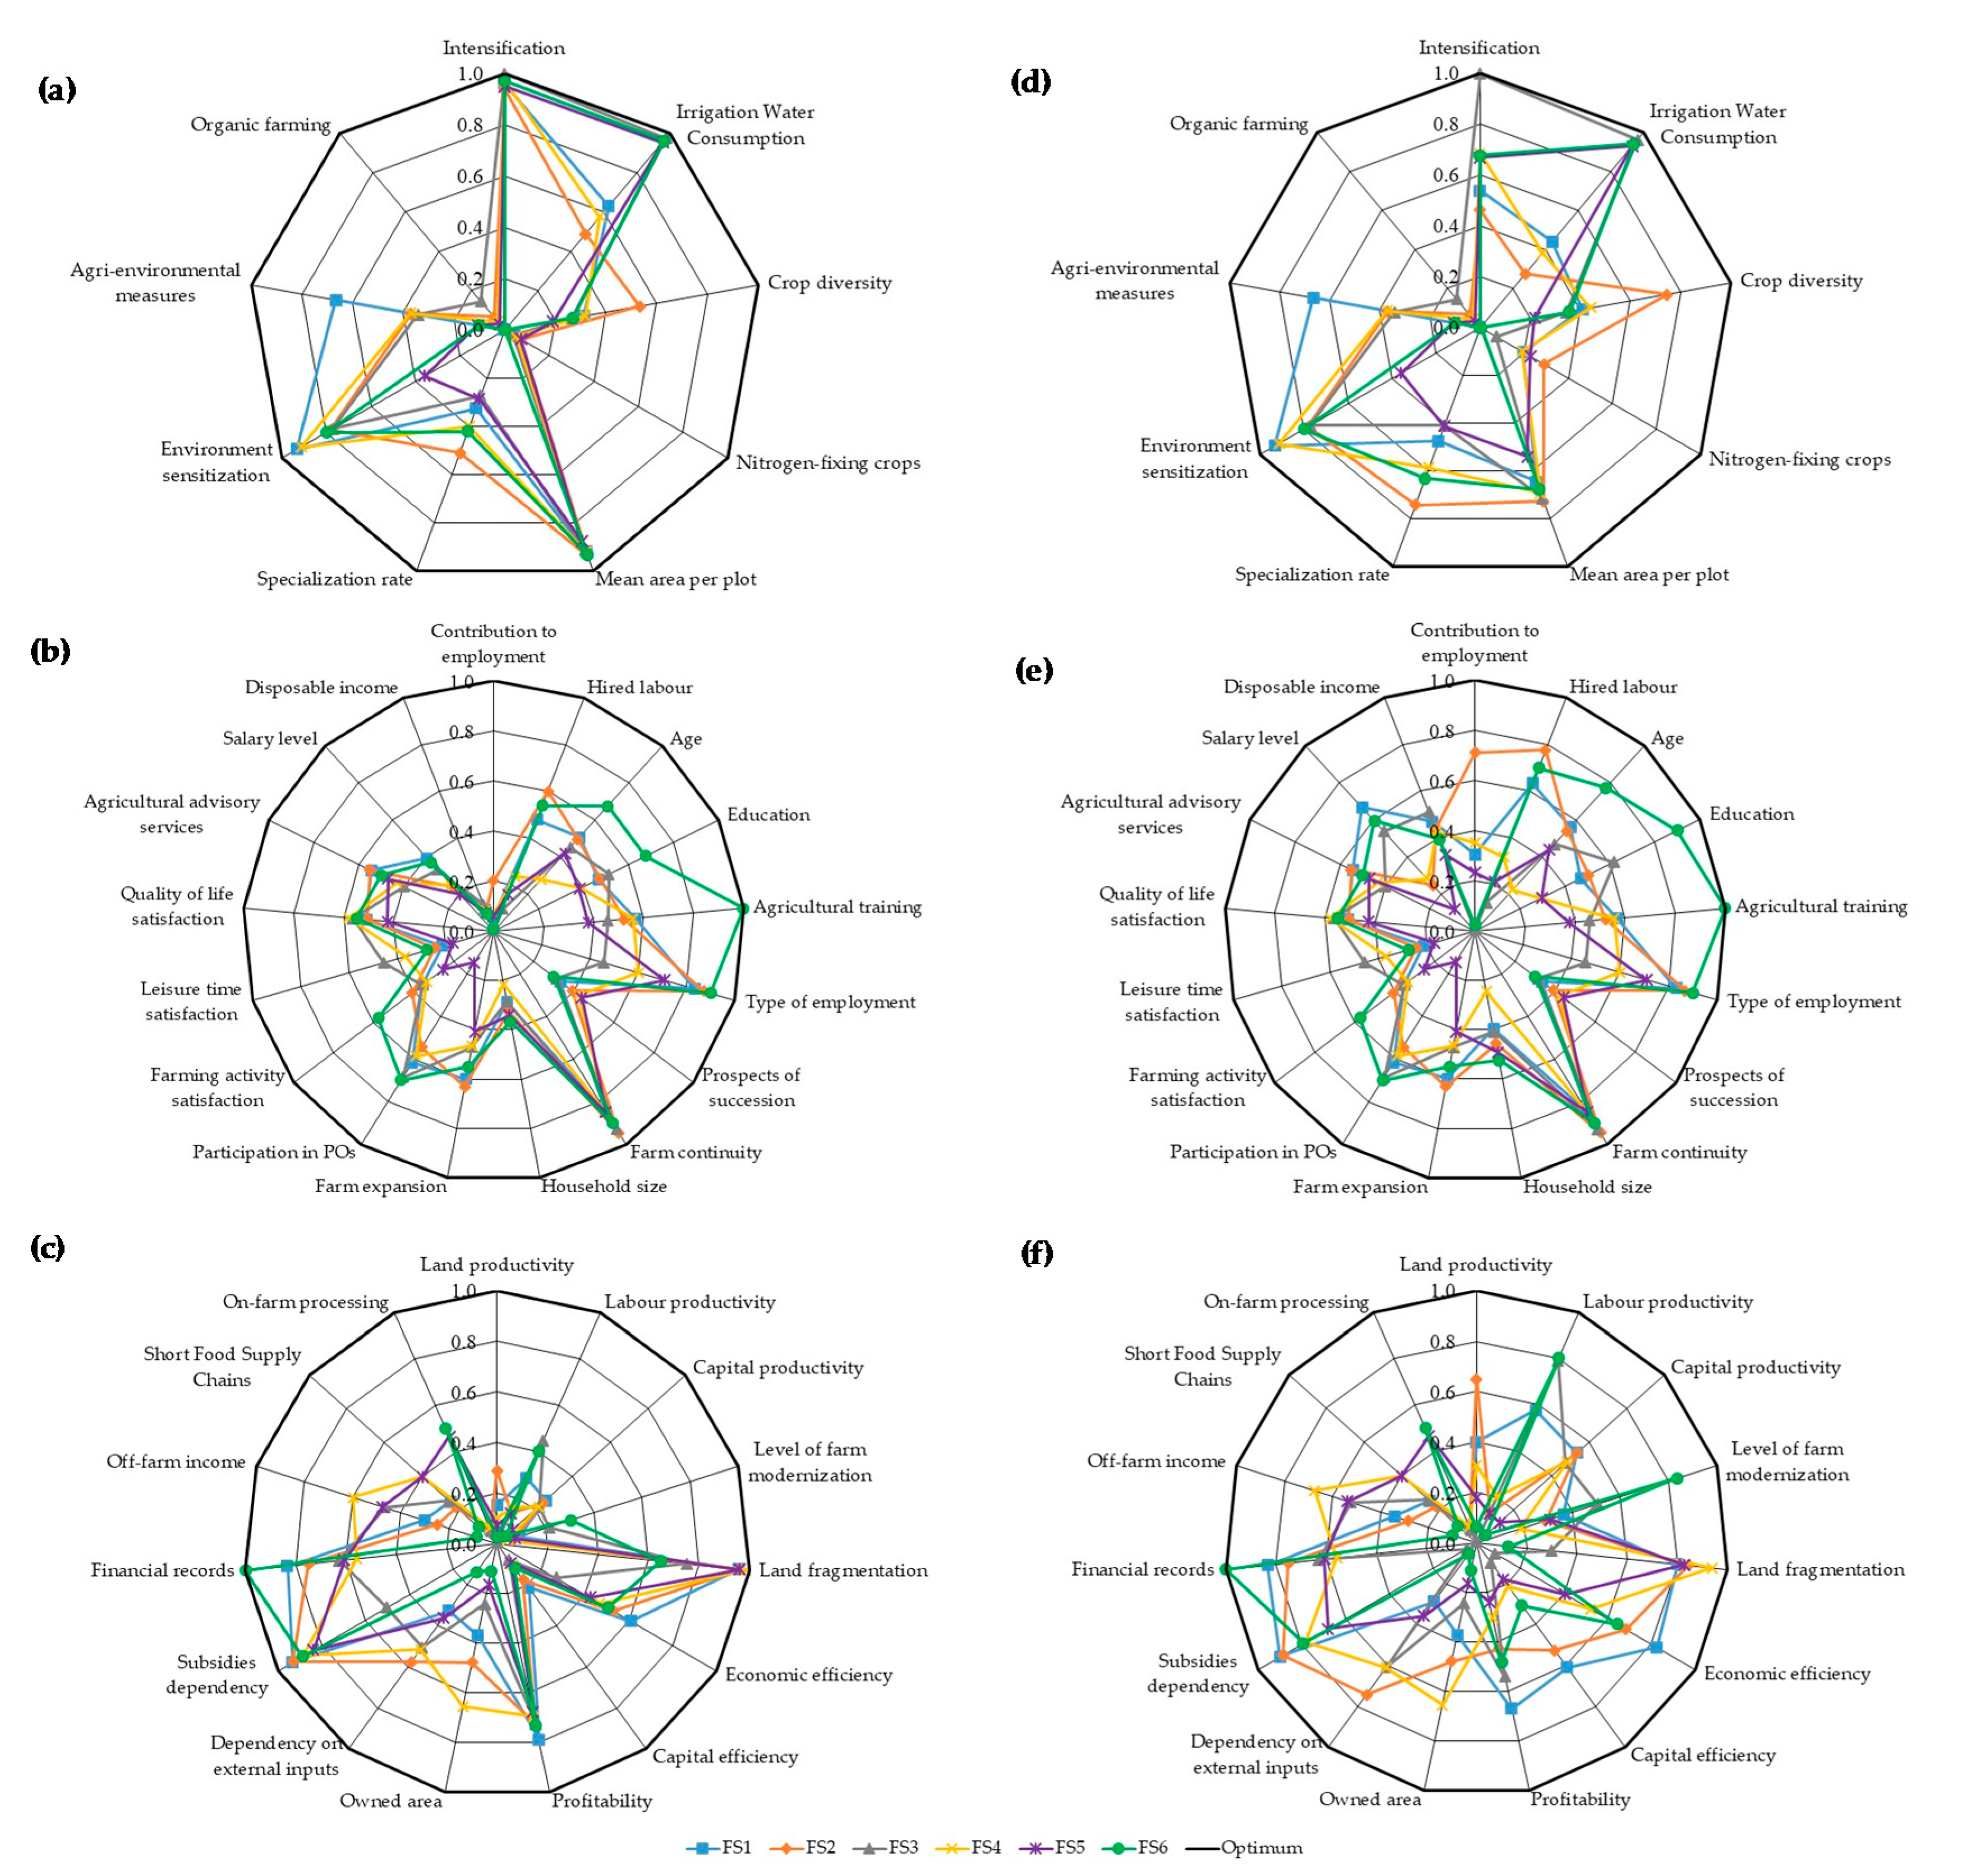
3.2. Visual Integration and Decomposition of CSIs
3.2.1. Environmental Indicators
3.2.2. Social Indicators
3.2.3. Economic Indicators
3.3. Internal Consistency and Sensitivity Analysis
3.4. Some Comments on the Sustainability Framework and Potential Limitations of the Study
4. Conclusions
Supplementary Materials
Author Contributions
Funding
Acknowledgments
Conflicts of Interest
References
- Lebacq, T.; Baret, P.V.; Stilmant, D. Sustainability indicators for livestock farming: A review. Agron. Sustain. Dev. 2013, 33, 311–327. [Google Scholar] [CrossRef]
- Van Passel, S.; Meul, M. Multilevel and multi-user sustainability assessment of farming systems. Environ. Impact Assess. Rev. 2012, 32, 170–180. [Google Scholar] [CrossRef]
- Meul, M.; Van Passel, S.; Nevens, F.; Dessein, J.; Rogge, E.; Mulier, A.; Van Hauwermeiren, A. MOTIFS: A monitoring tool for integrated farm sustainability. Agron. Sustain. Dev. 2008, 28, 321–332. [Google Scholar] [CrossRef]
- Gasparatos, A.; El-Haram, M.; Horner, M. A critical review of reductionist approaches for assessing the progress towards sustainability. Environ. Impact Assess. Rev. 2008, 28, 286–311. [Google Scholar] [CrossRef]
- de Olde, E.M.; Oudshoorn, F.W.; Sørensen, C.A.G.; Bokkers, E.A.M.; de Boer, I.J.M. Assessing sustainability at farm-level: Lessons learned from a comparison of tools in practice. Ecol. Indic. 2016, 66, 391–404. [Google Scholar] [CrossRef]
- Dantsis, T.; Douma, C.; Giourga, C.; Loumou, A.; Polychronaki, E.A. A methodological approach to assess and compare the sustainability level of agricultural plant production systems. Ecol. Indic. 2010, 10, 256–263. [Google Scholar] [CrossRef]
- Bonisoli, L.; Galdeano-Gómez, E.; Piedra-Muñoz, L. Deconstructing criteria and assessment tools to build agri-sustainability indicators and support farmers’ decision-making process. J. Clean. Prod. 2018, 182, 1080–1094. [Google Scholar] [CrossRef]
- Talukder, B.; Hipel, K.W.; vanLoon, G.W. Developing Composite Indicators for Agricultural Sustainability Assessment: Effect of Normalization and Aggregation Techniques. Resources 2017, 6, 66. [Google Scholar] [CrossRef]
- Arulnathan, V.; Heidari, M.D.; Doyon, M.; Li, E.; Pelletier, N. Farm-level decision support tools: A review of methodological choices and their consistency with principles of sustainability assessment. J. Clean. Prod. 2020, 256, 120410. [Google Scholar] [CrossRef]
- Röös, E.; Fischer, K.; Tidåker, P.; Nordström Källström, H. How well is farmers’ social situation captured by sustainability assessment tools? A Swedish case study. Int. J. Sust. Dev. World 2019, 26, 268–281. [Google Scholar] [CrossRef]
- Van Passel, S.; Nevens, F.; Mathijs, E.; Van Huylenbroeck, G. Measuring farm sustainability and explaining differences in sustainable efficiency. Ecol. Econ. 2007, 62, 149–161. [Google Scholar] [CrossRef]
- Häni, F.; Braga, F.; Stämpfli, A.; Keller, T.; Fischer, M.; Porsche, H. RISE, a tool for holistic sustainability assessment at the farm level. Int. Food Agribusiness Manag. Rev. 2003, 6, 78–90. [Google Scholar]
- López-Ridaura, S.; Masera, O.; Astier, M. Evaluating the sustainability of complex socio-environmental systems. the MESMIS framework. Ecol. Indic. 2002, 2, 135–148. [Google Scholar] [CrossRef]
- Gómez-Limón, J.A.; Sanchez-Fernandez, G. Empirical evaluation of agricultural sustainability using composite indicators. Ecol. Econ. 2010, 69, 1062–1075. [Google Scholar] [CrossRef]
- Castoldi, N.; Bechini, L. Integrated sustainability assessment of cropping systems with agro-ecological and economic indicators in northern Italy. Eur. J. Agron. 2010, 32, 59–72. [Google Scholar] [CrossRef]
- Haileslassie, A.; Craufurd, P.; Thiagarajah, R.; Kumar, S.; Whitbread, A.; Rathor, A.; Blummel, M.; Ericsson, P.; Kakumanu, K.R. Empirical evaluation of sustainability of divergent farms in the dryland farming systems of India. Ecol. Indic. 2016, 60 (Suppl. C), 710–723. [Google Scholar] [CrossRef]
- Bockstaller, C.; Guichard, L.; Makowski, D.; Aveline, A.; Girardin, P.; Plantureux, S. Agri-environmental indicators to assess cropping and farming systems. A review. Agron. Sustain. Dev. 2008, 28, 139–149. [Google Scholar] [CrossRef]
- OECD. Handbook on Constructing Composite Indicators: Methodology and User Guide; OECD Publishing: Paris, France, 2008. [Google Scholar]
- Binder, C.R.; Feola, G.; Steinberger, J.K. Considering the normative, systemic and procedural dimensions in indicator-based sustainability assessments in agriculture. Environ. Impact Assess. Rev. 2010, 30, 71–81. [Google Scholar] [CrossRef]
- Roy, R.; Chan, N.W.; Rainis, R. Rice farming sustainability assessment in Bangladesh. Sustain. Sci. 2014, 9, 31–44. [Google Scholar] [CrossRef]
- Ripoll-Bosch, R.; Díez-Unquera, B.; Ruiz, R.; Villalba, D.; Molina, E.; Joy, M.; Olaizola, A.; Bernués, A. An integrated sustainability assessment of mediterranean sheep farms with different degrees of intensification. Agr. Syst. 2012, 105, 46–56. [Google Scholar] [CrossRef]
- De Olde, E.M.; Oudshoorn, F.W.; Bokkers, E.A.M.; Stubsgaard, A.; Sørensen, C.A.G.; De Boer, I.J.M. Assessing the Sustainability Performance of Organic Farms in Denmark. Sustainability 2016, 8, 957. [Google Scholar] [CrossRef]
- Stylianou, A.; Sdrali, D.; Apostolopoulos, C.D. Capturing the diversity of Mediterranean farming systems prior to their sustainability assessment: The case of Cyprus. Land Use Policy 2020, 96, 104722. [Google Scholar] [CrossRef]
- Myers, N.; Mittermeier, R.A.; Mittermeier, C.G.; da Fonseca, G.A.B.; Kent, J. Biodiversity hotspots for conservation priorities. Nature 2000, 403, 853–858. [Google Scholar] [CrossRef] [PubMed]
- Cystat. Demographic Report 2016—Population Statistics; Printing Office of the Republic of Cyprus: Nicosia, Cyprus, 2017. [Google Scholar]
- Cystat. Census of Agriculture 2010—Agricultural Statistics; Printing Office of the Republic of Cyprus: Nicosia, Cyprus, 2014; Volume Series I, Report 8. [Google Scholar]
- Vlahos, G.; Karanikolas, P.; Koutsouris, A. Integrated farming in Greece: A transition-to-sustainability perspective. Int. J. Agric. Resour. Gov. Ecol. 2017, 13, 43–59. [Google Scholar] [CrossRef]
- Sofroniou, A.; Bishop, S. Water Scarcity in Cyprus: A Review and Call for Integrated Policy. Water 2014, 6, 2898–2928. [Google Scholar] [CrossRef]
- Van Cauwenbergh, N.; Biala, K.; Bielders, C.; Brouckaert, V.; Franchois, L.; Garcia Cidad, V.; Hermy, M.; Mathijs, E.; Muys, B.; Reijnders, J.; et al. SAFE—A hierarchical framework for assessing the sustainability of agricultural systems. Agric. Ecosyst. Environ. 2007, 120, 229–242. [Google Scholar] [CrossRef]
- Dixon, J.; Gulliver, A.; Gibbon, D. Farming Systems and Poverty: Improving Farmers’ Livelihoods in a Changing World; FAO and World Bank: Rome, Italy, 2001. [Google Scholar]
- Giller, K.E. Can We Define the Term ‘Farming Systems’? A Question of Scale. Outlook Agric. 2013, 42, 149–153. [Google Scholar] [CrossRef]
- MARDE Strategic Planning 2016–2018. Available online: http://moa.gov.cy/mediastuff/uploads/2019/03/Stratigikos-Sxediasmos-2016-2018-EN-150218.pdf (accessed on 16 June 2020).
- FAO. Sustainability Assessment of Food and Agriculture Systems (SAFA): Guidelines, Version 3.0; Food and Agricultural Organization of the United Nations: Rome, Italy, 2013. [Google Scholar]
- Rasul, G.; Thapa, G.B. Sustainability of ecological and conventional agricultural systems in Bangladesh: An assessment based on environmental, economic and social perspectives. Agric. Syst. 2004, 79, 327–351. [Google Scholar] [CrossRef]
- Latruffe, L.; Diazabakana, A.; Bockstaller, C.; Desjeux, Y.; Finn, J.; Kelly, E.; Ryan, M.; Uthes, S. Measurement of sustainability in agriculture: A review of indicators. Stud. Agric. Econ. 2016, 118, 123–130. [Google Scholar] [CrossRef]
- Nahed, J.; Castel, J.M.; Mena, Y.; Caravaca, F. Appraisal of the sustainability of dairy goat systems in Southern Spain according to their degree of intensification. Livest. Sci. 2006, 101, 10–23. [Google Scholar] [CrossRef]
- van Ittersum, M.K.; Ewert, F.; Heckelei, T.; Wery, J.; Alkan Olsson, J.; Andersen, E.; Bezlepkina, I.; Brouwer, F.; Donatelli, M.; Flichman, G.; et al. Integrated assessment of agricultural systems—A component-based framework for the European Union (SEAMLESS). Agric. Syst. 2008, 96, 150–165. [Google Scholar] [CrossRef]
- Talukder, B.; Blay-Palmer, A.; Hipel, K.W.; vanLoon, G.W. Elimination Method of Multi-Criteria Decision Analysis (MCDA): A Simple Methodological Approach for Assessing Agricultural Sustainability. Sustainability 2017, 9, 287. [Google Scholar] [CrossRef]
- Kelly, E.; Ryan, M.; Finn, J.; Hennessy, T. Farm-level indicators for evaluating sustainability and emerging new policy topics. 2016. Available online: https://www.flint-fp7.eu/downloads/reports/FLINT%20WP1_%20D1%204.pdf (accessed on 15 June 2020).
- Zahm, F.; Viaux, P.; Vilain, L.; Girardin, P.; Mouchet, C. Assessing farm sustainability with the IDEA method—From the concept of agriculture sustainability to case studies on farms. Sustain. Dev. 2008, 16, 271–281. [Google Scholar] [CrossRef]
- Van Passel, S.; Van Huylenbroeck, G.; Lauwers, L.; Mathijs, E. Sustainable value assessment of farms using frontier efficiency benchmarks. J. Environ. Manag. 2009, 90, 3057–3069. [Google Scholar] [CrossRef] [PubMed]
- O’Donoghue, C.; Devisme, S.; Ryan, M.; Conneely, R.; Gillespie, P.; Vrolijk, H. Farm economic sustainability in the European Union: A pilot study. Stud. Agric. Econ. 2016, 118, 163–171. [Google Scholar] [CrossRef]
- Eurostat Statistics Explained: Livestock Unit. Available online: http://ec.europa.eu/eurostat/statistics-explained/index.php/Glossary:Livestock_unit_(LSU) (accessed on 12 June 2020).
- Christou, A.; Dalias, P.; Neocleous, D. Spatial and temporal variations in evapotranspiration and net water requirements of typical Mediterranean crops on the island of Cyprus. J. Agric. Sci. 2017, 155, 1311–1323. [Google Scholar] [CrossRef]
- Burgass, M.J.; Halpern, B.S.; Nicholson, E.; Milner-Gulland, E.J. Navigating uncertainty in environmental composite indicators. Ecol. Indic. 2017, 75, 268–278. [Google Scholar] [CrossRef]
- Saisana, M.; Annoni, P.; Nardo, M. A Robust Model to Measure Governance in African Countries; EUR 23773 EN, European Commission; Joint Research Centre: Ispra, Italy, 2009. [Google Scholar]
- Giannakis, E.; Efstratoglou, S.; Antoniades, A. Off-Farm Employment and Economic Crisis: Evidence from Cyprus. Agriculture 2018, 8, 41. [Google Scholar] [CrossRef]
- Pretty, J. Agricultural sustainability: Concepts, principles and evidence. Phil. Trans. R. Soc. B 2008, 363, 447–465. [Google Scholar] [CrossRef]
- Reganold, J.P.; Glover, J.D.; Andrews, P.K.; Hinman, H.R. Sustainability of three apple production systems. Nature 2001, 410, 926–930. [Google Scholar] [CrossRef]
- Terres, J.-M.; Scacchiafichi, L.N.; Wania, A.; Ambar, M.; Anguiano, E.; Buckwell, A.; Coppola, A.; Gocht, A.; Källström, H.N.; Pointereau, P.; et al. Farmland abandonment in Europe: Identification of drivers and indicators, and development of a composite indicator of risk. Land Use Policy 2015, 49, 20–34. [Google Scholar] [CrossRef]
- Karelakis, C.; Abas, Z.; Galanopoulos, K.; Polymeros, K. Positive effects of the Greek economic crisis on livestock farmer behaviour. Agron. Sustain. Dev. 2013, 33, 445–456. [Google Scholar] [CrossRef]
- Cortez-Arriola, J.; Rossing, W.A.H.; Massiotti, R.D.A.; Scholberg, J.M.S.; Groot, J.C.J.; Tittonell, P. Leverages for on-farm innovation from farm typologies? An illustration for family-based dairy farms in north-west Michoacán, Mexico. Agric. Syst. 2015, 135, 66–76. [Google Scholar] [CrossRef]
- Iraizoz, B.; Gorton, M.; Davidova, S. Segmenting farms for analysing agricultural trajectories: A case study of the Navarra region in Spain. Agric. Syst. 2007, 93, 143–169. [Google Scholar] [CrossRef]
- European Commission. Report from the Commission to the European Parliament and the Council on the Case for a Local Farming and Direct Sales Labelling Scheme; COM: Brussels, Belgium, 2013; p. 866. [Google Scholar]
- Lairez, J.; Lopez-Ridaura, S.; Jourdain, D.; Falconnier, G.N.; Lienhard, P.; Striffler, B.; Syfongxay, C.; Affholder, F. Context matters: Agronomic field monitoring and participatory research to identify criteria of farming system sustainability in South-East Asia. Agric. Syst. 2020, 182, 102830. [Google Scholar] [CrossRef]


| Pillar | Indicator Name | Definition/Unit | Thresholds a | Effect |
|---|---|---|---|---|
| Environmental | Intensification | Cost of external inputs b per ha of UAA (k€ ha–1) | (1) min–max (2) 10th–90th | Negative |
| Irrigation Water Consumption | Absolute volume of irrigation water required per ha of UAA (m3 ha–1) | (1) min–max (2) 10th–90th | Negative | |
| Crop diversity | Number of crops per farm (no. crops farm–1) | (1) min–max (2) 10th–90th | Positive | |
| Nitrogen-fixing crops | Share of nitrogen-fixing crops c in UAA (%) | (1) min–max (2) 10th–90th | Positive | |
| Mean area per plot | Average plot size (ha plot–1) | (1) min–max (2) 10th–90th | Negative | |
| Specialization rate | Share of the main crop in UAA (%) | (1) min–max (2) 10th–90th | Negative | |
| Environment sensitization | The farmer acknowledges the negative impacts of agriculture on the environment and implements good agricultural practices d (binary) | Yes/No | Positive | |
| Agri-environmental measures | Farm enrolment in agri-environmental measures e (part of or the total UAA) (binary) | Yes/No | Positive | |
| Organic farming | Farm enrolment in organic farming systems (part of or the total UAA) (binary) | Yes/No | Positive | |
| Social | Contribution to employment | Human labor required per ha of UAA (AWU ha–1) | (1) min–max (2) 10th–90th | Positive |
| Hired labor | Permanent and seasonal hired labor costs/total labor costs (%) | (1) min–max (2) 10th–90th | Positive | |
| Age | Farmer’s age (years) | (1) min–max (2) 10th–90th | Negative | |
| Education | Farmer’s education level (years of schooling) | (1) min–max (2) 10th–90th | Positive | |
| Agricultural training | The farmer has followed agricultural education courses (binary) | Yes/No | Positive | |
| Type of employment | Full-time or part-time farmer (binary) | Full-time = 1Part-time = 0 | Positive | |
| Prospects of succession | Intergenerational continuity of farming activity (scale) | 0–3 f | Positive | |
| Farm continuity | Farmer’s willingness to continue farming in the next years (0 = no; 1 = maybe; 2 = yes) (scale) | 0–2 | Positive | |
| Household size | Number of household members (no. of members) | (1) min–max (2) 10th–90th | Positive | |
| Farm expansion | Size of the farm (in ha and/or LU) the last 5 years (0 = decreased; 1 = stable; 2 = increased) (scale) | 0–2 | Positive | |
| Participation in POs | Participation in agricultural Producer Organizations/unions/cooperatives (binary) | Yes/No | Positive | |
| Farming activity satisfaction | Perceived satisfaction level from farming (scale; farmer self-assessment) | 0–4 | Positive | |
| Leisure time satisfaction | Perceived satisfaction level from leisure time (scale; farmer self-assessment) | 0–4 | Positive | |
| Quality of life satisfaction | Perceived quality of life satisfaction (scale; farmer self-assessment) | 0–4 | Positive | |
| Agricultural advisory services | The farmer receives advice by public and/or private experts (scale) | 0–3 g | Positive | |
| Salary level | Return to labor (wages + net profit h) per AWU/legal minimum wage in other economic sectors (ratio) | (1) min–max (2) 10th–90th | Positive | |
| Disposable income | The total annual income (earned either at the farm or outside) that the household members have at their disposal (k€/household member) | (1) min–max (2) 10th–90th | Positive | |
| Economic | Land productivity | Farm income i per ha of UAA (k€ ha–1) | (1) min–max (2) 10th–90th | Positive |
| Labor productivity | Farm income per AWU (k€ AWU–1) | (1) min–max (2) 10th–90th | Positive | |
| Capital productivity | Farm income per unit of farm capital (non-land) (€ €–1) | (1) min–max (2) 10th–90th | Positive | |
| Level of farm modernization | Depreciation of land improvements, buildings, machinery and equipment per AWU (k€ AWU–1) | (1) min–max (2) 10th–90th | Positive | |
| Land fragmentation | Number of plots per farm (no. plots farm–1) | (1) min–max (2) 10th–90th | Negative | |
| Economic efficiency | Gross income j excluding subsidies/total production costs, viz. benefit-cost relation (ratio) | (1) min–max (2) 10th–90th | Positive | |
| Capital efficiency | Rate of return to total capital [(land rent + interests + net profit)/(farm capital + land capital)] (%) | (1) min–max (2) 10th–90th | Positive | |
| Profitability | Net profit/gross income (%) | (1) min–max (2) 10th–90th | Positive | |
| Owned area | Share of area owned by the farmer in UAA (%) | (1) min–max (2) 10th–90th | Positive | |
| Dependency on external inputs | Cost of external inputs/total production costs (%) | (1) min–max (2) 10th–90th | Negative | |
| Subsidies dependency | Total subsidies k/gross income (%) | (1) min–max (2) 10th–90th | Negative | |
| Financial records | Use of a farm financial record-keeping system (0 = no; 1 = informal; 2 = formal) (scale) | 0–2 | Positive | |
| Off/non-farm income | Off/non-farm income/total household income (%) | (1) min–max (2) 10th–90th | Positive | |
| Short Food Supply Chains | Utilization of Short Food Supply Chains, viz. direct sales and/or farmers’ markets and/or local supermarkets/greengroceries (binary) | Yes/No | Positive | |
| On-farm processing | The farmer is also a processor, viz. transforms part of or the whole production on-farm (binary) | Yes/No | Positive |
| Label of Farming Systems (n = Number of Farms) | Acronym | Share in the Total Sample (% of Farms) | Distribution of Farming Systems Across the Study Districts (% of Farms) | |
|---|---|---|---|---|
| Larnaca | Famagusta | |||
| Medium-sized irrigated farms with open field vegetables/potatoes, profitable with or without subsidies (n = 60) | FS1 | 18.5 | 36.7 | 63.3 |
| Small to medium-sized irrigated farms with greenhouse/open field vegetables and permanent crops, labor-intensive (n = 46) | FS2 | 14.2 | 65.2 | 34.8 |
| Large farms with market-oriented rainfed cereals and fodder crops a, high dependency on subsidies and high off/non-farm income (n = 35) | FS3 | 10.8 | 85.7 | 14.3 |
| Small irrigated farms with open field vegetables, potatoes and permanent crops, off-farm based (n = 70) | FS4 | 21.6 | 41.4 | 58.6 |
| Specialized medium-sized sheep/goats farms with high off/non-farm income (n = 103) | FS5 | 31.8 | 77.7 | 22.3 |
| Large specialized, capital-intensive dairy cattle farms, with young and educated farm managers (n = 10) | FS6 | 3.1 | 80.0 | 20.0 |
| Composite Sustainability Indices/System Ranking | Farming Systems (FSs) | |||||
|---|---|---|---|---|---|---|
| FS1 (n = 60) | FS2 (n = 46) | FS3 (n = 35) | FS4 (n = 70) | FS5 (n = 103) | FS6 (n = 10) | |
| (a) | ||||||
| EnCSI | 0.533 ± 0.077 a | 0.522 ± 0.114 a | 0.525 ± 0.127 a | 0.508 ± 0.088 a | 0.425 ± 0.100 b | 0.495 ± 0.064 ab |
| Ranking | 1 | 3 | 2 | 4 | 6 | 5 |
| SCSI | 0.453 ± 0.085 ac | 0.473 ± 0.086 c | 0.405 ± 0.094 ab | 0.396 ± 0.087 b | 0.346 ± 0.092 d | 0.527 ± 0.071 c |
| Ranking | 3 | 2 | 4 | 5 | 6 | 1 |
| EcCSI | 0.429 ± 0.076 a | 0.426 ± 0.079 ab | 0.358 ± 0.060 c | 0.431 ± 0.063 a | 0.388 ± 0.078 bc | 0.374 ± 0.049 abc |
| Ranking | 2 | 3 | 6 | 1 | 4 | 5 |
| GCSI | 0.472 ± 0.051 a | 0.474 ± 0.053 a | 0.430 ± 0.070 b | 0.445 ± 0.046 ab | 0.387 ± 0.057 c | 0.465 ± 0.044 ab |
| Ranking | 2 | 1 | 5 | 4 | 6 | 3 |
| (b) | ||||||
| EnCSI | 0.478 ± 0.109 a | 0.496 ± 0.139 a | 0.529 ± 0.142 a | 0.478 ± 0.114 a | 0.388 ± 0.136 b | 0.465 ± 0.088 ab |
| Ranking | 4 | 2 | 1 | 3 | 6 | 5 |
| SCSI | 0.525 ± 0.101 b | 0.546 ± 0.099 b | 0.457 ± 0.112 a | 0.431 ± 0.098 a | 0.374 ± 0.106 c | 0.598 ± 0.075 b |
| Ranking | 3 | 2 | 4 | 5 | 6 | 1 |
| EcCSI | 0.522 ± 0.115 a | 0.500 ± 0.117 ab | 0.344 ± 0.086 d | 0.461 ± 0.083 bc | 0.373 ± 0.102 d | 0.398 ± 0.075 cd |
| Ranking | 1 | 2 | 6 | 3 | 5 | 4 |
| GCSI | 0.508 ± 0.070 a | 0.514 ± 0.065 a | 0.443 ± 0.087 b | 0.457 ± 0.057 b | 0.378 ± 0.077 c | 0.487 ± 0.051 ab |
| Ranking | 2 | 1 | 5 | 4 | 6 | 3 |
| Indicator (Unit) | Farming Systems (FSs) | ||||||
|---|---|---|---|---|---|---|---|
| FS1 (n = 60) | FS2 (n = 46) | FS3 (n = 35) | FS4 (n = 70) | FS5 (n = 103) | FS6 (n = 10) | All (n = 324) | |
| Environmental pillar | |||||||
| Intensification (k€ ha–1) | 6.02 ± 3.93 | 8.88 ± 9.19 | 0.49 ± 0.19 | 4.13 ± 3.25 | 7.38 ± 19.10 | 4.12 ± 2.05 | 5.79 ± 11.75 |
| Irrigation Water Consumption (m3 ha–1) | 2828.9 ± 1420.5 | 3895.3 ± 1969.0 | 181.7 ± 268.8 | 3231.5 ± 1814.9 | 344.1 ± 652.3 | 294.0 ± 432.1 | 1913.2 ± 2010.6 |
| Crop diversity (no. crops farm−1) | 4.1 ± 2.8 | 6.9 ± 2.9 | 3.5 ± 1.8 | 4.1 ± 2.1 | 2.5 ± 1.5 | 3.5 ± 1.5 | 3.9 ± 2.6 |
| Nitrogen-fixing crops (%) | 4.0 ± 6.8 | 6.2 ± 8.7 | 3.4 ± 14.8 | 4.4 ± 9.4 | 6.1 ± 11.9 | 0.1 ± 0.2 | 4.9 ± 10.4 |
| Mean area per plot (ha plot−1) | 1.0 ± 0.9 | 0.8 ± 0.7 | 1.1 ± 1.7 | 1.0 ± 1.5 | 1.6 ± 1.6 | 0.9 ± 0.4 | 1.2 ± 1.4 |
| Specialization rate (%) | 67.5 ± 24.1 | 48.9 ± 20.6 | 72.6 ± 19.8 | 60.0 ± 24.0 | 71.3 ± 26.5 | 57.8 ± 14.0 | 64.7 ± 24.9 |
| Environment sensitization (% of farms) a | 93.3 | 78.3 | 77.1 | 91.4 | 35.9 | 80.0 | 70.4 |
| Agri-environmental measures (% of farms) a | 66.7 | 37.0 | 34.3 | 37.1 | 10.7 | 10.0 | 33.0 |
| Organic farming (% of farms) a | 0.0 | 6.5 | 14.3 | 4.3 | 2.9 | 0.0 | 4.3 |
| Social pillar | |||||||
| Contribution to employment (AWU ha−1) | 0.3 ± 0.3 | 1.0 ± 0.8 | 0.0 ± 0.0 | 0.3 ± 0.3 | 0.3 ± 0.6 | 0.1 ± 0.0 | 0.4 ± 0.6 |
| Hired labor (%) | 43.1 ± 19.9 | 54.2 ± 21.7 | 8.7 ± 17.8 | 21.3 ± 23.1 | 14.2 ± 21.4 | 48.5 ± 23.6 | 27.2 ± 26.6 |
| Age (years) | 52.1 ± 10.5 | 52.7 ± 10.5 | 55.0 ± 13.3 | 64.1 ± 7.6 | 56.6 ± 10.3 | 43.2 ± 11.5 | 56.3 ± 11.3 |
| Education (years) | 8.9 ± 2.8 | 9.0 ± 3.5 | 9.7 ± 3.2 | 7.6 ± 3.0 | 7.5 ± 3.1 | 12.5 ± 3.2 | 8.4 ± 3.3 |
| Agricultural training (% of farms) a | 56.7 | 52.2 | 45.7 | 55.7 | 37.9 | 100.0 | 50.0 |
| Type of employment (% of farms) b | 83.3 | 87.0 | 45.1 | 60.0 | 70.9 | 90.0 | 71.0 |
| Prospects of succession (scale) | 1.0 ± 1.0 | 1.2 ± 1.1 | 0.9 ± 1.1 | 1.3 ± 1.1 | 1.3 ± 1.2 | 0.9 ± 1.0 | 1.2 ± 1.1 |
| Farm continuity (scale) | 1.7 ± 0.6 | 1.9 ± 0.4 | 1.9 ± 0.4 | 1.7 ± 0.6 | 1.7 ± 0.6 | 1.8 ± 0.6 | 1.8 ± 0.6 |
| Household size (no. of members) | 3.6 ± 1.4 | 3.9 ± 1.7 | 3.6 ± 1.3 | 2.9 ± 1.2 | 4.1 ± 1.8 | 4.3 ± 1.6 | 3.7 ± 1.6 |
| Farm expansion (scale) | 1.2 ± 0.6 | 1.3 ± 0.6 | 0.9 ± 0.6 | 0.9 ± 0.5 | 0.8 ± 0.8 | 1.1 ± 0.9 | 1.0 ± 0.7 |
| Participation in POs (% of farms) a | 61.7 | 54.4 | 68.6 | 58.6 | 14.6 | 70.0 | 46.0 |
| Farming activity satisfaction (scale) | 1.4 ± 1.0 | 1.6 ± 1.0 | 1.4 ± 1.0 | 1.3 ± 1.0 | 1.0 ± 1.0 | 2.3 ± 1.2 | 1.3 ± 1.0 |
| Leisure time satisfaction (scale) | 0.9 ± 1.0 | 1.0 ± 1.0 | 1.8 ± 1.0 | 1.5 ± 0.9 | 0.7 ± 0.8 | 1.1 ± 1.3 | 1.1 ± 1.0 |
| Quality of life satisfaction (scale) | 2.0 ± 1.1 | 2.0 ± 1.0 | 2.3 ± 1.1 | 2.3 ± 1.0 | 1.7 ± 1.1 | 2.2 ± 1.0 | 2.0 ± 1.1 |
| Agricultural advisory services (scale) | 1.6 ± 0.7 | 1.7 ± 0.8 | 1.2 ± 0.9 | 1.3 ± 0.8 | 1.4 ± 0.8 | 1.5 ± 0.7 | 1.4 ± 0.8 |
| Salary level (ratio) | 1.70 ± 0.78 | 0.94 ± 0.20 | 1.40 ± 0.78 | 0.99 ± 0.29 | 0.75 ± 0.25 | 1.60 ± 0.79 | 1.10 ± 0.61 |
| Disposable income (k€/household member) | 8.06 ± 4.05 | 7.80 ± 4.01 | 9.72 ± 9.56 | 7.68 ± 4.37 | 7.18 ± 7.95 | 6.91 ± 2.08 | 7.81 ± 6.29 |
| Economic pillar | |||||||
| Land productivity (k€ ha−1) | 6.32 ± 6.23 | 11.83 ± 9.64 | 0.57 ± 0.22 | 4.37 ± 3.33 | 3.15 ± 5.04 | 1.35 ± 0.36 | 4.90 ± 6.41 |
| Labor productivity (k€ AWU−1) | 24.30 ± 9.51 | 12.87 ± 2.65 | 36.23 ± 17.02 | 14.47 ± 4.49 | 12.70 ± 3.69 | 32.85 ± 11.46 | 18.42 ± 11.21 |
| Capital productivity (€ €−1) | 0.59 ± 0.36 | 0.56 ± 0.30 | 0.52 ± 0.32 | 0.52 ± 0.30 | 0.24 ± 0.09 | 0.18 ± 0.07 | 0.44 ± 0.30 |
| Level of farm modernization (k€ AWU−1) | 2.00 ± 1.97 | 1.45 ± 1.45 | 4.71 ± 5.85 | 0.99 ± 1.28 | 1.63 ± 1.81 | 6.72 ± 4.18 | 2.02 ± 2.88 |
| Land fragmentation (no. plots farm−1) | 19.9 ± 23.2 | 17.4 ± 32.4 | 109.8 ± 102.7 | 7.0 ± 5.4 | 17.0 ± 23.1 | 155.7 ± 118.5 | 29.8 ± 57.6 |
| Economic efficiency (ratio) | 1.11 ± 0.16 | 1.01 ± 0.12 | 0.68 ± 0.13 | 0.94 ± 0.11 | 0.88 ± 0.11 | 0.98 ± 0.06 | 0.93 ± 0.17 |
| Capital efficiency (%) | 4.7 ± 4.6 | 3.6 ± 3.0 | 1.0 ± 0.5 | 1.7 ± 1.2 | 1.4 ± 1.2 | 2.1 ± 0.5 | 2.4 ± 2.8 |
| Profitability (%) | 13.1 ± 10.8 | 5.5 ± 8.1 | 5.8 ± 18.0 | 1.9 ± 7.6 | −0.4 ± 6.5 | 6.2 ± 6.1 | 4.3 ± 10.7 |
| Owned area (%) | 37.1 ± 30.4 | 47.8 ± 38.3 | 24.3 ± 32.0 | 65.6 ± 33.6 | 16.6 ± 27.8 | 10.9 ± 12.9 | 36.1 ± 36.5 |
| Dependency on external inputs (%) | 57.8 ± 10.4 | 40.9 ± 10.2 | 45.7 ± 10.0 | 45.1 ± 13.3 | 55.5 ± 12.0 | 70.5 ± 8.1 | 51.0 ± 13.5 |
| Subsidies dependency (%) | 5.3 ± 2.9 | 5.5 ± 5.9 | 36.8 ± 9.9 | 8.9 ± 6.9 | 12.3 ± 8.7 | 8.5 ± 4.3 | 11.8 ± 11.6 |
| Financial records (scale) | 1.7 ± 0.7 | 1.5 ± 0.8 | 1.3 ± 0.8 | 1.1 ± 0.9 | 1.2 ± 0.8 | 2.0 ± 0.0 | 1.4 ± 0.8 |
| Off/non-farm income (%) | 28.6 ± 28.1 | 23.6 ± 26.9 | 44.4 ± 33.2 | 56.8 ± 24.0 | 45.2 ± 31.5 | 8.3 ± 14.3 | 40.3 ± 31.1 |
| Short Food Supply Chains (% of farms) a | 25.0 | 21.7 | 25.7 | 40.0 | 39.8 | 10.0 | 32.1 |
| On-farm processing (% of farms) a | 6.7 | 6.5 | 5.7 | 7.1 | 46.6 | 50.0 | 20.7 |
| Farming System | EnCSI vs. SCSI | EnCSI vs. EcCSI | SCSI vs. EcCSI | GCSI vs. EnCSI | GCSI vs. SCSI | GCSI vs. EcCSI |
|---|---|---|---|---|---|---|
| FS1 (n = 60) | 0.35 ** | 0.00 | 0.07 | 0.60 ** | 0.79 ** | 0.49 ** |
| FS2 (n = 46) | 0.10 | −0.22 | −0.15 | 0.61 ** | 0.61 ** | 0.25 |
| FS3 (n = 35) | 0.25 | 0.30 | 0.19 | 0.75 ** | 0.70 ** | 0.58 ** |
| FS4 (n = 70) | 0.16 | −0.12 | −0.15 | 0.65 ** | 0.67 ** | 0.28 * |
| FS5 (n = 103) | 0.14 | 0.22 * | −0.19 | 0.75 ** | 0.55 ** | 0.44 ** |
| FS6 (n = 10) | 0.09 | 0.08 | 0.62 | 0.50 | 0.85 ** | 0.67 * |
| Overall (n = 324) | 0.33 ** | 0.12 * | 0.00 | 0.77 ** | 0.72 ** | 0.43 ** |
| Farming System | EnCSI a vs. EnCSI b | SCSI a vs. SCSI b | EcCSI a vs. EcCSI b | GCSI a vs. GCSI b |
|---|---|---|---|---|
| FS1 (n = 60) | 0.89 | 0.95 | 0.90 | 0.91 |
| FS2 (n = 46) | 0.95 | 0.96 | 0.85 | 0.92 |
| FS3 (n = 35) | 0.96 | 0.94 | 0.89 | 0.96 |
| FS4 (n = 70) | 0.85 | 0.94 | 0.82 | 0.88 |
| FS5 (n = 103) | 0.94 | 0.96 | 0.90 | 0.95 |
| FS6 (n = 10) | 0.89 | 0.94 | 0.81 | 0.88 |
| Overall (n = 324) | 0.91 | 0.96 | 0.84 | 0.95 |
© 2020 by the authors. Licensee MDPI, Basel, Switzerland. This article is an open access article distributed under the terms and conditions of the Creative Commons Attribution (CC BY) license (http://creativecommons.org/licenses/by/4.0/).
Share and Cite
Stylianou, A.; Sdrali, D.; Apostolopoulos, C.D. Integrated Sustainability Assessment of Divergent Mediterranean Farming Systems: Cyprus as a Case Study. Sustainability 2020, 12, 6105. https://doi.org/10.3390/su12156105
Stylianou A, Sdrali D, Apostolopoulos CD. Integrated Sustainability Assessment of Divergent Mediterranean Farming Systems: Cyprus as a Case Study. Sustainability. 2020; 12(15):6105. https://doi.org/10.3390/su12156105
Chicago/Turabian StyleStylianou, Andreas, Despina Sdrali, and Constantinos D. Apostolopoulos. 2020. "Integrated Sustainability Assessment of Divergent Mediterranean Farming Systems: Cyprus as a Case Study" Sustainability 12, no. 15: 6105. https://doi.org/10.3390/su12156105
APA StyleStylianou, A., Sdrali, D., & Apostolopoulos, C. D. (2020). Integrated Sustainability Assessment of Divergent Mediterranean Farming Systems: Cyprus as a Case Study. Sustainability, 12(15), 6105. https://doi.org/10.3390/su12156105