Analysis of Pollution Related Deficiencies Identified through PSC Inspections for the Period 2014–2018

 , , and
Abstract
1. Introduction
2. Background Concept and Objectives
- the absence of principal equipment or arrangement required by the conventions;
- non-compliance of equipment or arrangement with relevant specifications of the conventions;
- substantial deterioration of the ship or its equipment because of e.g., poor maintenance;
- insufficiency of operational proficiency, or unfamiliarity of essential operational procedures by the crew; and
- insufficiency of manning or insufficiency of certification of seafarers.”
- Paris MoU (Europe, North Atlantic region)
- Acuerdo de Vina del Mar 1992 (Latin American region)
- Tokyo MoU (Asia-Pacific region)
- Caribbean MoU (Caribbean region)
- Mediterranean MoU (Mediterranean region)
- Indian Ocean MoU (Indian Ocean region)
- Abuja MoU (West and Central African region)
- Black Sea MoU (Black Sea region)
- Riyadh MoU (United Arab Emirates, Kingdom of Bahrain, Kingdom of Saudi Arabia, Sultanate of Oman, State of Qatar, State of Kuwait)
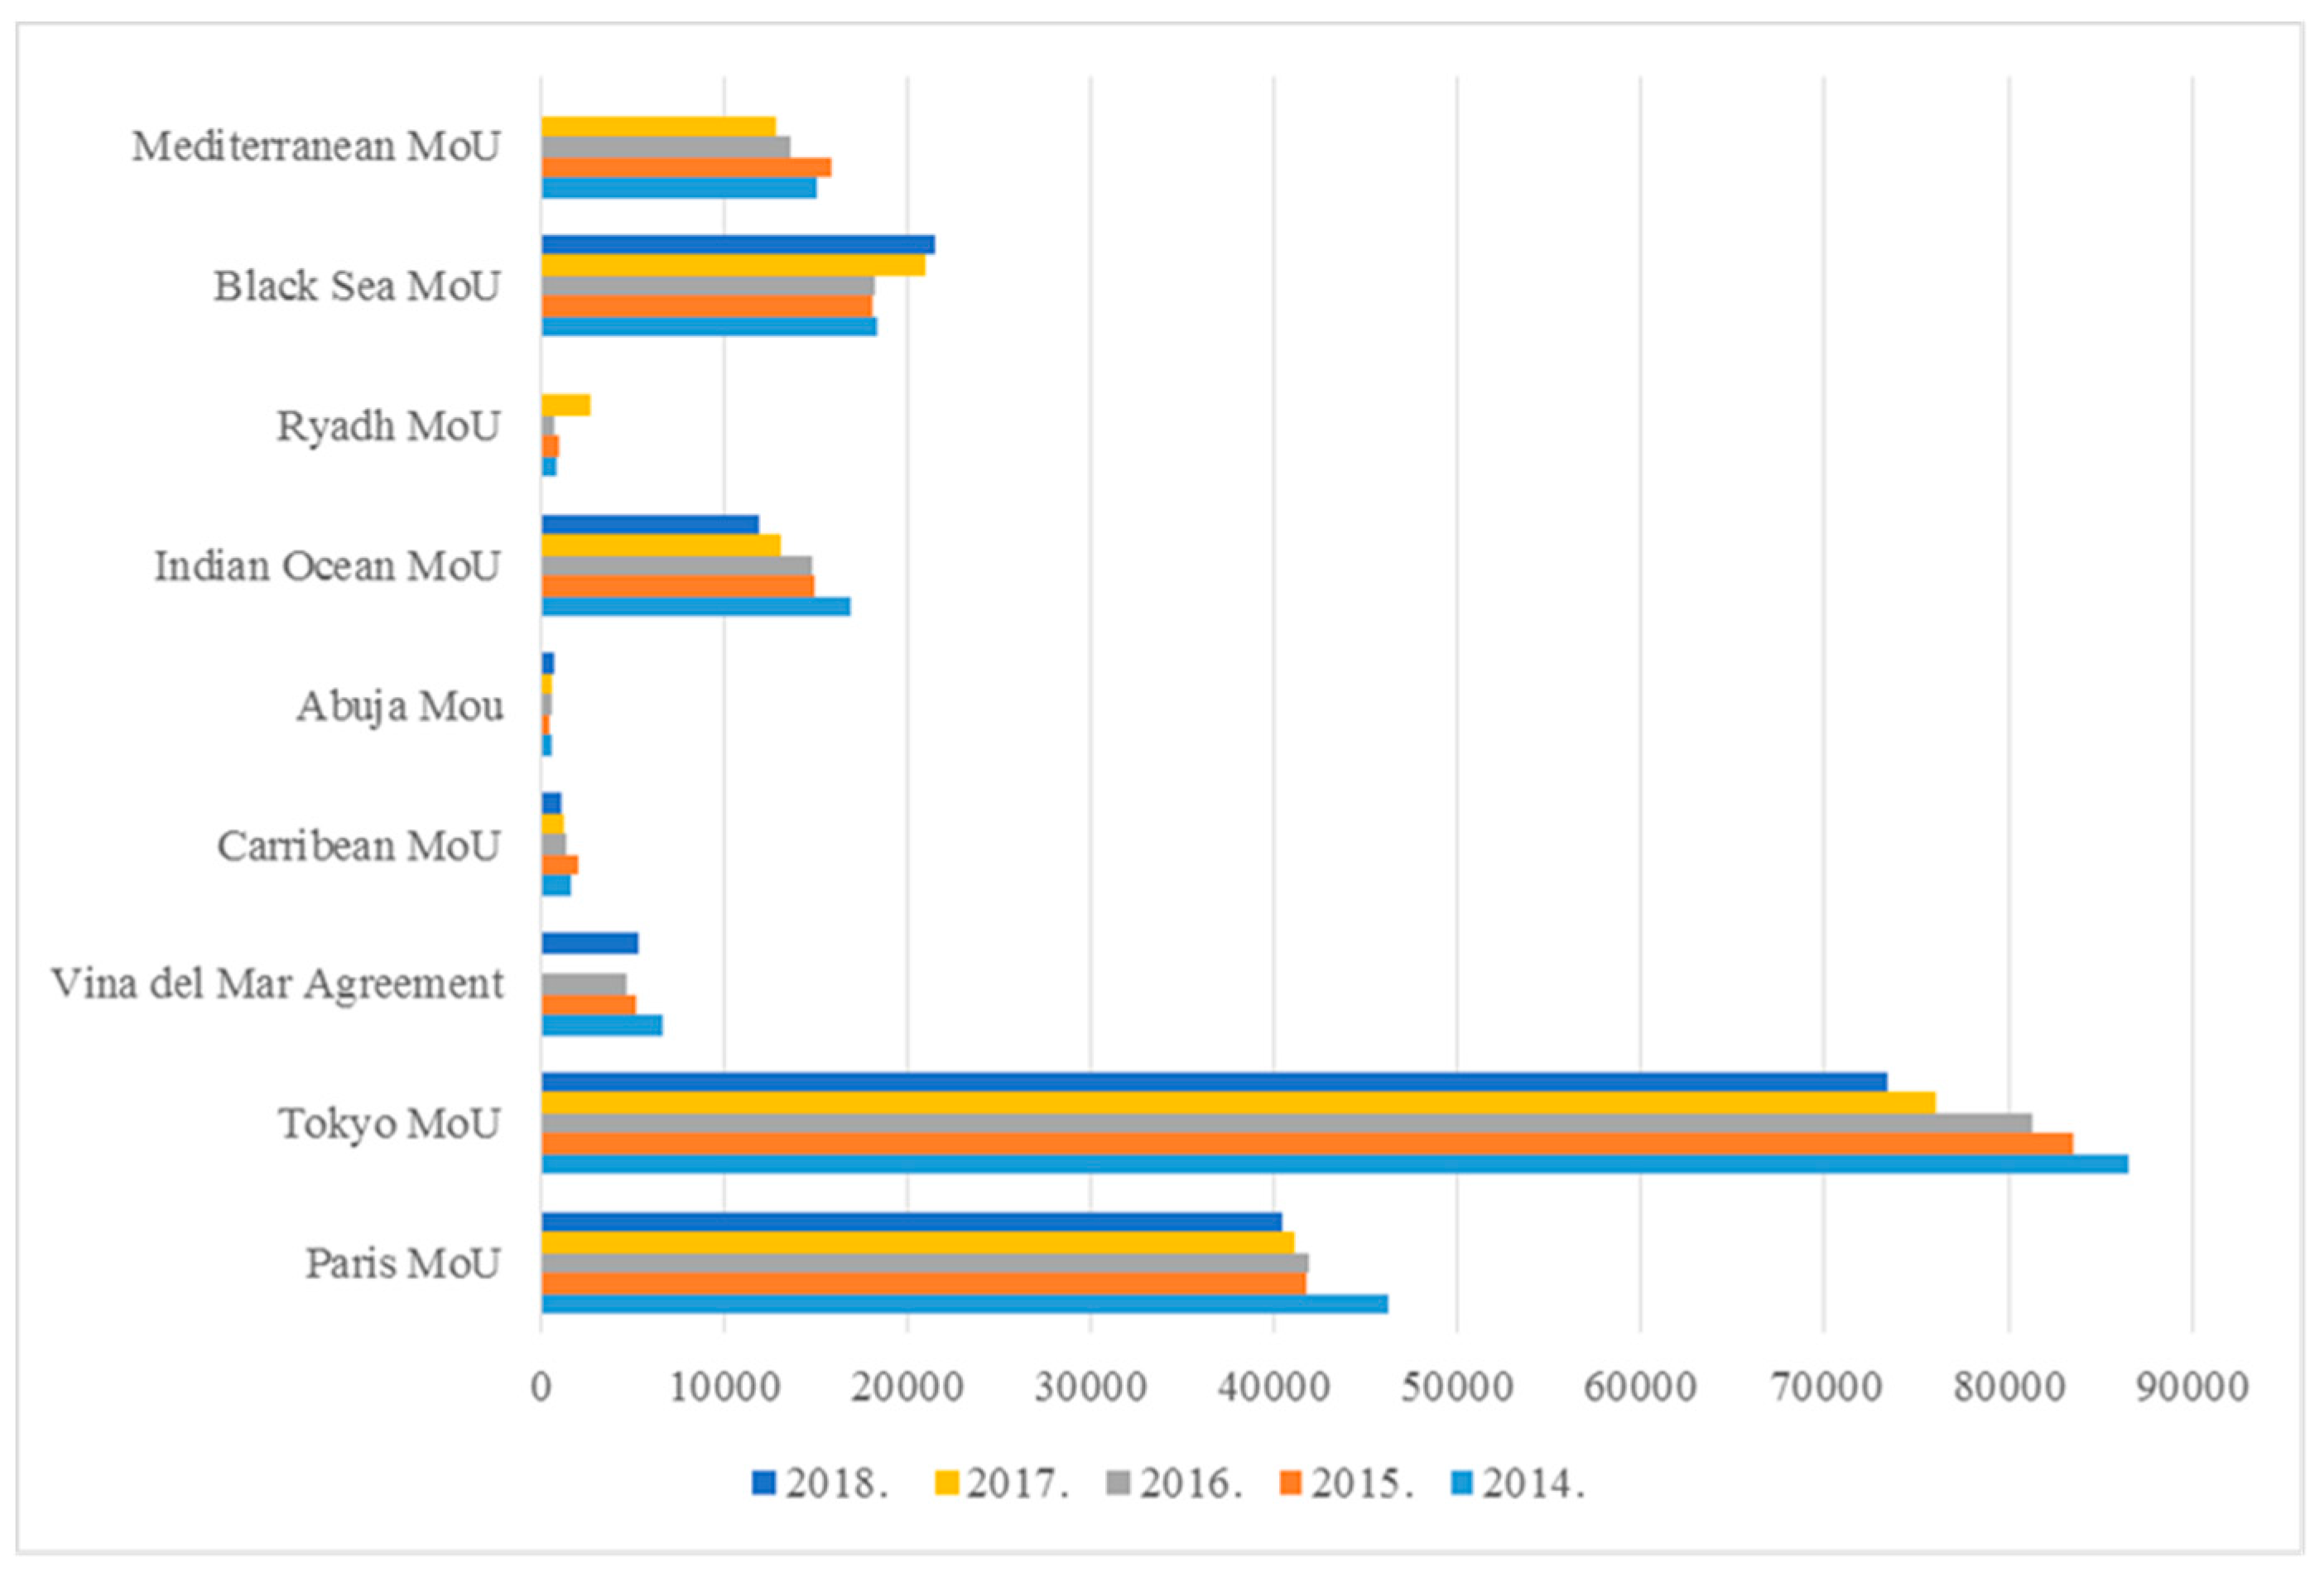
- analysis of the total number of identified deficiencies by using available MoU data on PSC;
- identification of the deficiencies for nine regional agreements on PSC;
- categorization of the deficiencies by the 6 Annexes of the MARPOL convention;
- antifouling systems and MARPOL-related operational deficiencies; and
- comparison of the gathered data for 2014–2018 period.
3. Materials and Methods
- The data extracted from each organization follows: number of inspections;
- number of observed deficiencies in total;
- number of observed deficiencies in category of pollution prevention; and
- number of observed deficiencies for each MARPOL Annex;
- antifouling and MARPOL-related operational deficiencies.
4. Results and Discussion
5. Conclusions
Author Contributions
Funding
Acknowledgments
Conflicts of Interest
References
- United Nations Conference on Trade and Development (UNCTAD). Review of Maritime Transport 2018; United Nations: New York, NY, USA, 2018. [Google Scholar]
- Unted Nations. The Sustainable Development Goals. Available online: https://www.un.org/sustainabledevelopment/development-agenda/ (accessed on 1 October 2017).
- International Maritime Organization (IMO). Linkages Between Imo’s Technical Assitance Work and the 2030 Agenda For Sustainable Development; IMO: New York, NY, USA, 2018. [Google Scholar]
- European Commission. Mobility and Transport. Available online: https://ec.europa.eu/transport/modes/maritime/safety_en (accessed on 1 October 2017).
- Emecen Kara, E.G.; Oksas, O.A. Comparative analysis of regional agreements on port state control. Am. Sci. Res. J. Eng. Technol. Sci. 2016, 18, 259–270. [Google Scholar]
- Knapp, S.; Bijwaard, G.; Heij, C. Estimated incident cost savings in shipping due to inspections. Accid. Anal. Prev. 2011, 43, 1532–1539. [Google Scholar] [CrossRef] [PubMed]
- International Maritime Organization (IMO). Port State Control. Available online: http://www.imo.org/en/ourwork/msas/pages/portstatecontrol.aspx (accessed on 5 July 2017).
- Emecen Kara, E.G. Risk assessment in the Istanbul Strait using Black Sea MOU port state control inspections. Sustainability 2016, 8, 390. [Google Scholar] [CrossRef]
- Ravira, F.J.; Piniella, F. Evaluating the impact of PSC inspector’s professional profile: A case study of the Spanish Maritime Administration. WMU J. Marit. Aff. 2016, 15, 221–236. [Google Scholar] [CrossRef]
- Knapp, S.; Franses, P.H. Comprehensive review of the maritime safety regimes: Present status and recommendations for improvements. Trans. Rev. 2010, 30, 241–270. [Google Scholar] [CrossRef]
- International Maritime Organization (IMO). Resolution A.787(19): Procedures For Port State Control; IMO: New York, NY, USA, 1995. [Google Scholar]
- International Maritime Organization (IMO). Resolution A.882(21): Amendments to the Procedures For Port State Control (Resolution A.787(19)); IMO: New York, NY, USA, 2000. [Google Scholar]
- Li, K.X.; Zheng, H. Enforcement of law by the port state control (PSC). Marit. Policy Manag. 2008, 35, 61–71. [Google Scholar] [CrossRef]
- Meija, M., Jr.; Cariou, P.; Wolf, F.C. Vessels at Risk and the Effectiveness of Port State Control Inspections; Laboratoire d’Economie et de Management Nantes-Atlantique Université de Nantes: Nantes, France, 2010. [Google Scholar]
- Heij, C.; Bijwaard, G.E.; Knapp, S. Ship inspection strategies: Effects on maritime safety and environmental protection. Trans. Res. Part D Trans. Environ. 2011, 16, 42–48. [Google Scholar] [CrossRef]
- Knapp, S.; Franses, P.H. A Global view on port state control: Econometric Analysis Of The Differences Across Port State Control Regimes. Marit. Policy Manag. 2007, 34, 453–482. [Google Scholar] [CrossRef]
- Nikcevic, J. Montenegro on the path to Paris MoU accession: Towards achieving a sustainable shipping industry. Sustainability 2018, 10, 1900. [Google Scholar] [CrossRef]
- McDorman, T.L. Regional port state control agreements: Some issues of international law. Ocean Coast Law J. 2000, 5, 207–226. [Google Scholar]
- Mehrotra, D. Memorandums of Understanding on Port State Control: The Need for a Global MOU? World Maritime University: Malmö, Sweden, 2000. [Google Scholar]
- ClassNK Annual Report on Port State Control. In Acuerdo Viña del Mar 1992: Annual Report on Port State Control- Latin American Agreement 2014; Nippon Kaiji Kyokai Survey Department: Tokyo, Japan, 2014.
- ClassNK Annual Report on Port State Control. In Acuerdo Viña del Mar 1992: Annual Report on Port State Control- Latin American Agreement 2015; Nippon Kaiji Kyokai Survey Department: Tokyo, Japan, 2015.
- ClassNK Annual Report on Port State Control. In Acuerdo Viña del Mar 1992: Annual Report on Port State Control- Latin American Agreement 2016; Nippon Kaiji Kyokai Survey Department: Tokyo, Japan, 2016.
- ClassNK Annual Report on Port State Control. In Acuerdo Viña del Mar 1992: Annual Report on Port State Control- Latin American Agreement 2017; Nippon Kaiji Kyokai Survey Department: Tokyo, Japan, 2017.
- ClassNK Annual Report on Port State Control. In Acuerdo Viña del Mar 1992: Annual Report on Port State Control- Latin American Agreement 2018; Nippon Kaiji Kyokai Survey Department: Tokyo, Japan, 2018.
- Black Sea Memorandum of Understanding on Port State. In Port State Control In The Black Sea Region-Annual Report 2014; Black Sea MoU: Istanbul, Turkey, 2014.
- Black Sea Memorandum of Understanding on Port State. In Port State Control In The Black Sea Region–Annual Report 2015; Black Sea MoU: Istanbul, Turkey, 2015.
- Black Sea Memorandum of Understanding on Port State. In Port State Control In The Black Sea Region–Annual Report 2016; Black Sea MoU: Istanbul, Turkey, 2016.
- Black Sea Memorandum of Understanding on Port State. In Port State Control In The Black Sea Region–Annual Report; Black Sea MoU: Istanbul, Turkey, 2017.
- Black Sea Memorandum of Understanding on Port State. In Port State Control In The Black Sea Region–Annual Report; Black Sea MoU: Istanbul, Turkey, 2018.
- Caribbean Memorandum of Understanding on Port State. In Caribbean Memorandum of Understanding on Port State Control-Annual Report 2014; Caribbean MoU: Kingston, Jamaica, 2014.
- Caribbean Memorandum of Understanding on Port State. In Caribbean Memorandum of Understanding on Port State Control-Annual Report 2015; Caribbean MoU: Kingston, Jamaica, 2015.
- Caribbean Memorandum of Understanding on Port State. In Caribbean Memorandum of Understanding on Port State Control-Annual Report 2016; Caribbean MoU: Kingston, Jamaica, 2016.
- Caribbean Memorandum of Understanding on Port State. In Caribbean Memorandum of Understanding on Port State Control-Annual Report; Caribbean MoU: Kingston, Jamaica, 2017.
- Caribbean Memorandum of Understanding on Port State. In Caribbean Memorandum of Understanding on Port State Control-Annual Report; Caribbean MoU: Kingston, Jamaica, 2018.
- Indian Ocean Memorandum of Understanding on Port State Control. In Indian Ocean Memorandum of Understanding on Port State Control-Annual Report 2014; Indian Ocean: Dabolim, India, 2014.
- Indian Ocean Memorandum of Understanding on Port State Control. In Indian Ocean Memorandum of Understanding on Port State Control-Annual Report 2015; Indian Ocean: Dabolim, India, 2015.
- Indian Ocean Memorandum of Understanding on Port State Control. In Indian Ocean Memorandum of Understanding on Port State Control-Annual Report 2016; Indian Ocean: Dabolim, India, 2016.
- Indian Ocean Memorandum of Understanding on Port State Control. In Indian Ocean Memorandum of Understanding on Port State Control-Annual Report 2017; Indian Ocean: Dabolim, India, 2017.
- Indian Ocean Memorandum of Understanding on Port State Control. In Indian Ocean Memorandum of Understanding on Port State Control-Annual Report 2018; Indian Ocean: Dabolim, India, 2018.
- Mediterranean Memorandum of Understanding on Port State. In Mediterranean Memorandum of Understanding on Port State Control–Annual Report 2014; Mediterranean MoU: Alexandria, Egiypt, 2014.
- Mediterranean Memorandum of Understanding on Port State. In Mediterranean Memorandum of Understanding on Port State Control–Annual Report 2015; Mediterranean MoU: Alexandria, Egiypt, 2015.
- Mediterranean Memorandum of Understanding on Port State. In Mediterranean Memorandum of Understanding on Port State Control–Annual Report 2016; Mediterranean MoU: Alexandria, Egiypt, 2016.
- Mediterranean Memorandum of Understanding on Port State. In Mediterranean Memorandum of Understanding on Port State Control–Annual Report 2017; Mediterranean MoU: Alexandria, Egiypt, 2017.
- Memorandum of Understanding on Port State Control for West and Central African Region. In Abuja MoU Annual Report 2014; Abuja MoU: Lagos, Nigeria, 2014.
- Memorandum of Understanding on Port State Control for West and Central African Region. In Abuja MoU Annual Report 2015; Abuja MoU: Lagos, Nigeria, 2015.
- Memorandum of Understanding on Port State Control for West and Central African Region. In Abuja MoU Annual Report 2016; Abuja MoU: Lagos, Nigeria, 2016.
- Memorandum of Understanding on Port State Control for West and Central African Region. In Abuja MoU Annual Report 2017; Abuja MoU: Lagos, Nigeria, 2017.
- Memorandum of Understanding on Port State Control for West and Central African Region. In Abuja MoU Annual Report 2018; Abuja MoU: Lagos, Nigeria, 2018.
- The Paris Memorandum of Understanding on Port State Control. In Port State Control Annual Report–Adjusting Course; Paris MoU: Hague, The Netherlands, 2014.
- The Paris Memorandum of Understanding on Port State Control. In Port State Control Annual Report–Safer Entry of Enclosed Spaces; Paris MoU: Hague, The Netherlands, 2015.
- The Paris Memorandum of Understanding on Port State Control. In Paris MoU Annual Report “Seafarers Matter”; Paris MoU: Hague, The Netherlands, 2016.
- The Paris Memorandum of Understanding on Port State Control. In Paris MoU Annual Report “Safeguarding Responsible and Sustainable Shipping”; Paris MoU: Hague, The Netherlands, 2017.
- The Paris Memorandum of Understanding on Port State Control. In Paris MoU Annual Report “Consistent Compliance”; Paris MoU: Hague, The Netherlands, 2018.
- Riyadh Memorandum Of Understanding on Port State Control. In Riyadh Memorandum of Understanding on Port State Control—Annual Report 2014; Riyadh MoU: Muscat, Sultanate of Oman, 2014.
- Riyadh Memorandum Of Understanding on Port State Control. In Riyadh Memorandum of Understanding on Port State Control—Annual Report 2015; Riyadh MoU: Muscat, Sultanate of Oman, 2015.
- Riyadh Memorandum Of Understanding on Port State Control. In Riyadh Memorandum of Understanding on Port State Control—Annual Report 2016; Riyadh MoU: Muscat, Sultanate of Oman, 2016.
- Riyadh Memorandum Of Understanding on Port State Control. In Riyadh Memorandum of Understanding on Port State Control—Annual Report 2017; Riyadh MoU: Muscat, Sultanate of Oman, 2017.
- Tokyo Memorandum of Understanding on Port State Control. In Annual Report On Port State Control in the Asia-Pacific Region 2014; Tokyo MoU: Tokyo, Japan, 2014.
- Tokyo Memorandum of Understanding on Port State Control. In Annual Report On Port State Control in the Asia-Pacific Region 2015; Tokyo MoU: Tokyo, Japan, 2015.
- Tokyo Memorandum of Understanding on Port State Control. In Annual Report On Port State Control in the Asia-Pacific Region 2016; Tokyo MoU: Tokyo, Japan, 2016.
- Tokyo Memorandum of Understanding on Port State Control. In Annual Report On Port State Control in the Asia-Pacific Region 2017; Tokyo MoU: Tokyo, Japan, 2017.
- Tokyo Memorandum of Understanding on Port State Control. In Annual Report On Port State Control in the Asia-Pacific Region 2018; Tokyo MoU: Tokyo, Japan, 2018.


| MoU | Annex I | Annex II | Annex III | Annex IV | Annex V | Annex VI | Anti-Fouling | Grand Total |
|---|---|---|---|---|---|---|---|---|
| Abuja Total | 116 | 0 | 4 | 18 | 28 | 7 | 1 | 174 |
| 2014 | 26 | 0 | 2 | 0 | 7 | 2 | 0 | 37 |
| 2015 | 16 | 0 | 0 | 1 | 4 | 2 | 0 | 23 |
| 2016 | 24 | 0 | 0 | 3 | 3 | 2 | 1 | 33 |
| 2017 | 25 | 0 | 1 | 2 | 2 | 0 | 0 | 30 |
| 2018 | 25 | 0 | 1 | 12 | 12 | 1 | 0 | 51 |
| Black Sea Total | 1444 | 30 | 36 | 316 | 1183 | 166 | 7 | 3182 |
| 2014 | 285 | 11 | 3 | 69 | 214 | 24 | 4 | 610 |
| 2015 | 251 | 3 | 6 | 73 | 200 | 18 | 0 | 551 |
| 2016 | 293 | 11 | 6 | 52 | 178 | 19 | 1 | 560 |
| 2017 | 359 | 1 | 8 | 67 | 279 | 22 | 1 | 737 |
| 2018 | 256 | 4 | 13 | 55 | 312 | 83 | 1 | 724 |
| Caribbean Total | 126 | 0 | 1 | 83 | 50 | 14 | 0 | 283 |
| 2014 | 0 | 0 | 0 | 0 | 0 | 0 | 0 | 0 |
| 2015 | 48 | 0 | 0 | 19 | 16 | 6 | 0 | 91 |
| 2016 | 26 | 0 | 0 | 22 | 13 | 4 | 0 | 69 |
| 2017 | 29 | 0 | 0 | 19 | 11 | 2 | 0 | 63 |
| 2018 | 23 | 0 | 1 | 23 | 10 | 2 | 0 | 60 |
| Indian Ocean Total | 1524 | 7 | 14 | 1357 | 929 | 513 | 4 | 4348 |
| 2014 | 283 | 0 | 10 | 293 | 204 | 110 | 0 | 900 |
| 2015 | 360 | 0 | 0 | 319 | 197 | 84 | 1 | 961 |
| 2016 | 327 | 2 | 1 | 299 | 174 | 117 | 1 | 921 |
| 2017 | 255 | 1 | 2 | 245 | 157 | 81 | 2 | 743 |
| 2018 | 299 | 4 | 1 | 201 | 197 | 121 | 0 | 823 |
| Paris Total | 3645 | 85 | 28 | 1718 | 2990 | 2475 | 50 | 10,991 |
| 2014 | 875 | 27 | 4 | 346 | 598 | 459 | 17 | 2326 |
| 2015 | 810 | 16 | 5 | 338 | 609 | 471 | 10 | 2259 |
| 2016 | 708 | 16 | 4 | 336 | 551 | 428 | 13 | 2056 |
| 2017 | 650 | 14 | 10 | 372 | 470 | 426 | 7 | 1949 |
| 2018 | 602 | 12 | 5 | 326 | 762 | 691 | 3 | 2401 |
| Riyadh Total | 183 | 4 | 3 | 57 | 66 | 2 | 0 | 458 |
| 2014 | 36 | 0 | 0 | 9 | 8 | 0 | 0 | 58 |
| 2015 | 30 | 0 | 1 | 7 | 10 | 0 | 0 | 105 |
| 2016 | 37 | 1 | 1 | 4 | 9 | 0 | 0 | 133 |
| 2017 | 80 | 3 | 1 | 37 | 39 | 2 | 0 | 162 |
| 2018 | 0 | 0 | 0 | 0 | 0 | 0 | 0 | 0 |
| Tokyo Total | 7871 | 101 | 98 | 6086 | 6688 | 4959 | 65 | 25,868 |
| 2014 | 1679 | 13 | 33 | 1199 | 1587 | 758 | 7 | 5276 |
| 2015 | 1607 | 17 | 30 | 1301 | 1252 | 847 | 13 | 5067 |
| 2016 | 1609 | 25 | 12 | 1199 | 1162 | 845 | 7 | 4859 |
| 2017 | 1468 | 30 | 10 | 1131 | 1014 | 886 | 22 | 4561 |
| 2018 | 1508 | 16 | 13 | 1256 | 1673 | 1623 | 16 | 6105 |
| Vina del mar Agreement Total | 387 | 0 | 3 | 110 | 854 | 108 | 10 | 1472 |
| 2014 | 0 | 0 | 0 | 0 | 0 | 0 | 0 | 0 |
| 2015 | 135 | 0 | 1 | 32 | 255 | 27 | 0 | 450 |
| 2016 | 112 | 0 | 1 | 30 | 283 | 29 | 3 | 458 |
| 2017 | 0 | 0 | 0 | 0 | 0 | 0 | 0 | 0 |
| 2018 | 140 | 0 | 1 | 48 | 316 | 52 | 7 | 564 |
| Grand Total | 15,296 | 227 | 187 | 9745 | 12,788 | 8244 | 137 | 46,776 |
| Mean ± SD | CV% | Min | Max | ||
|---|---|---|---|---|---|
| 2014 | #Def | 21,414.44 ± 28,280.37 | 132.06 | 609 | 86,560 |
| #Ins | 9117.67 ± 9471.17 | 103.88 | 836 | 30,405 | |
| #MARPOL | 1325.86 ± 1920.65 | 144.861 | 37 | 5276 | |
| 2015 | #Def | 20,321.56 ± 27,042.93 | 133.08 | 528 | 83,606 |
| #Ins | 9168.22 ± 9673.48 | 105.51 | 867 | 31,407 | |
| #MARPOL | 1188.13 ± 1729.31 | 145.55 | 23 | 5067 | |
| 2016 | #Def | 19,695.33 ± 26,524.28 | 134.67 | 642 | 81,271 |
| #Ins | 9873.11 ± 9869.12 | 99.96 | 859 | 31,678 | |
| #MARPOL | 1135.88 ± 1643.61 | 144.70 | 33 | 4859 | |
| 2017 | #Def | 20,639.17 ± 24,511.76 | 118.76 | 611 | 80,284 |
| #Ins | 9774.36 ± 8823.76 | 90.27 | 859 | 31,678 | |
| #MARPOL | 1211.82 ± 1529.37 | 126.20 | 34 | 4456 | |
| 2018 | #Def | 19,695.33 ± 26,524.28 | 134.92 | 692 | 79,287 |
| #Ins | 9873.11 ± 9869.12 | 99.96 | 887 | 29,608 | |
| #MARPOL | 1274.81 ± 1266.19 | 99.32 | 36 | 4711 |
| Mean ± SD | CV% | Min | Max | ||
|---|---|---|---|---|---|
| Paris | #Def | 42,270.2 ± 2290 | 5.42% | 40,368.00 | 46,224.00 |
| #Ins | 18,013.8 ± 262.46 | 1.46% | 17,840.00 | 18,477.00 | |
| #MARPOL | 2198.2 ± 189.39 | 8.62% | 1949.00 | 2401.00 | |
| Tokyo | #Def | 80,197.2 ± 5376.48 | 6.70% | 73,441.00 | 86,560.00 |
| #Ins | 31,278.8 ± 509.13 | 1.63% | 30,405.00 | 31,678.00 | |
| #MARPOL | 5388.2 ± 873.73 | 16.22% | 4822.00 | 6917.00 | |
| Vina del Mar | #Def | 5441.75 ± 2543.56 | 46.74% | 4612.00 | 6631.00 |
| #Ins | 8471.8 ± 678.81 | 8.01% | 7739.00 | 9366.00 | |
| #MARPOL | 386.5 ± 253.88 | 55.53% | 450.00 | 564.00 | |
| Carribean | #Def | 1518.8 ± 330.85 | 21.78% | 1186.00 | 2047.00 |
| #Ins | 793.2 ± 96.46 | 12.16% | 635.00 | 867.00 | |
| #MARPOL | 69.75 ± 33.21 | 47.61% | 60.00 | 89.00 | |
| Abuja | #Def | 618.6 ± 73.48 | 11.88% | 528.00 | 727.00 |
| #Ins | 2333.8 ± 381.41 | 16.34% | 1922.00 | 2916.00 | |
| #MARPOL | 34.8 ± 10.4 | 29.89% | 23.00 | 51.00 | |
| Indian Ocean | #Def | 14,307.8 ± 1913.23 | 13.37% | 11,847.00 | 16,856.00 |
| #Ins | 5938.6 ± 248.41 | 4.18% | 5674.00 | 6253.00 | |
| #MARPOL | 872.2 ± 84.16 | 9.65% | 747.00 | 961.00 | |
| Riyadh | #Def | 1300.75 ± 992.29 | 76.29% | 742.00 | 2687.00 |
| #Ins | 3627.25 ± 1673.53 | 46.14% | 3104.00 | 4165.00 | |
| #MARPOL | 114.5 ± 63.97 | 55.87% | 58.00 | 162.00 | |
| Black Sea | #Def | 19,433.2 ± 1648.51 | 8.48% | 18,094.00 | 21,450.00 |
| #Ins | 5096.2 ± 78.89 | 1.55% | 4997.00 | 5214.00 | |
| #MARPOL | 636.8 ± 89.48 | 14.05% | 551.00 | 739.00 | |
| Mediterranean | #Def | 14,321.5 ± 6515.99 | 45.50% | 12,786.00 | 15,823.00 |
| #Ins | 5325.25 ± 2395.35 | 44.98% | 5049.00 | 5740.00 | |
| #MARPOL | n/a | n/a | n/a | n/a |
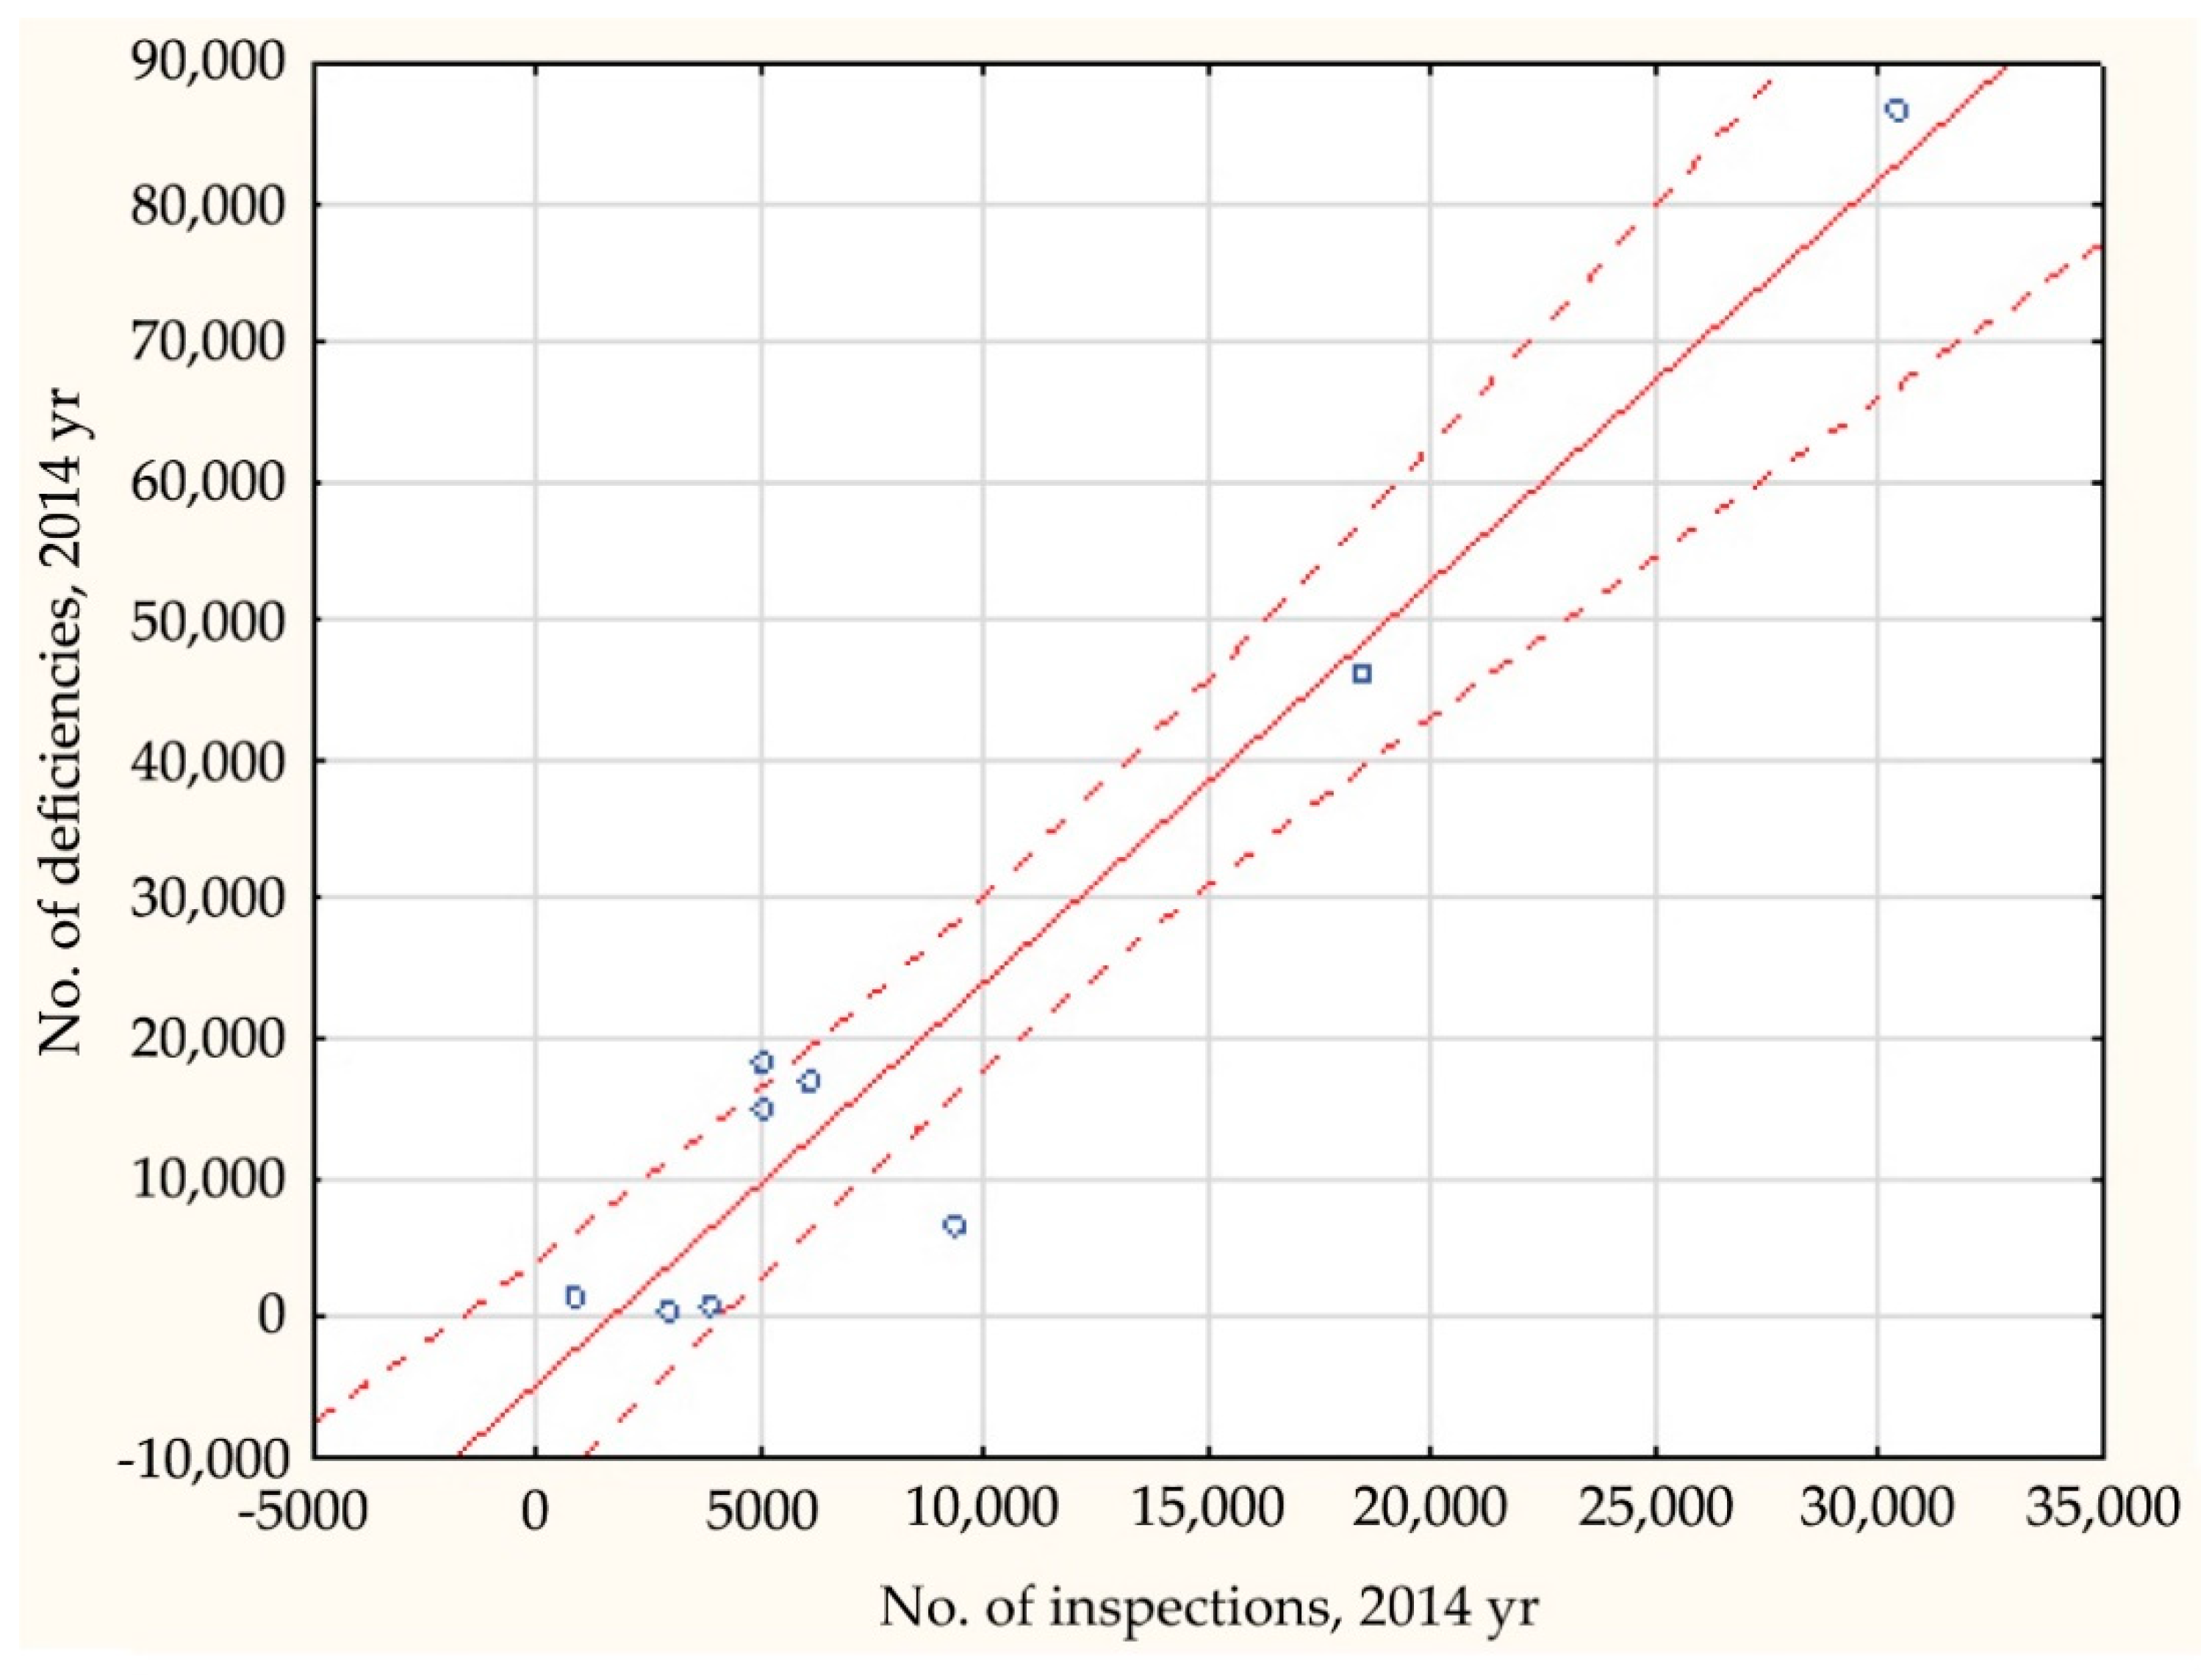
| 2014 | 2015 | 2016 | 2017 | 2018 | |
|---|---|---|---|---|---|
| r | 0.965 | 0.967 | 0.946 | 0.947 | 0.934 |
| r2 | 0.932 | 0.934 | 0.895 | 0.897 | 0.872 |
| t | 9.808 | 9.986 | 7.741 | 8.342 | 9.932 |
| p | <0.001 | <0.001 | <0.001 | <0.001 | <0.001 |
| 2014 | 2015 | 2016 | 2017 | 2018 | ||
|---|---|---|---|---|---|---|
| Paris | 0.05 | 0.05 | 0.05 | 0.05 | 0.06 | χ2(4) = 72.83 p < 0.001 |
| Tokyo | 0.06 | 0.06 | 0.06 | 0.06 | 0.09 | χ2(4) = 983.534 p < 0.001 |
| Vina del Mar | 0.01 | 0.09 | 0.10 | n/a | 0.11 | χ2(3) = 514.32 p < 0.001 |
| Carribean | n/a | 0.04 | 0.05 | 0.05 | 0.05 | χ2(3) = 0.874 p = 0.832 |
| Abuja | 0.06 | 0.04 | 0.05 | 0.05 | 0.07 | χ2(4) = 4.77 p = 0.311 |
| Indian Ocean | 0.05 | 0.06 | 0.06 | 0.06 | 0.07 | χ2(4) = 39.17 p < 0.001 |
| Riyadh | 0.07 | 0.11 | 0.18 | 0.06 | n/a | χ2(3) = 101.75 p < 0.001 |
| Black Sea | 0.03 | 0.03 | 0.03 | 0.04 | 0.03 | χ2(4) = 9.93 p = 0.042 |
| Mediterannean | n/a | n/a | n/a | n/a | n/a | |
| χ2(6) = 471.52 p < 0.001 | χ2(7) = 402.60 p < 0.001 | χ2(7) = 638.85 p < 0.001 | χ2(6) = 295.48 p < 0.001 | χ2(6) = 991.54 p < 0.001 |
© 2020 by the authors. Licensee MDPI, Basel, Switzerland. This article is an open access article distributed under the terms and conditions of the Creative Commons Attribution (CC BY) license (http://creativecommons.org/licenses/by/4.0/).
Share and Cite
Ukić Boljat, H.; Slišković, M.; Jelaska, I.; Gudelj, A.; Jelić Mrčelić, G. Analysis of Pollution Related Deficiencies Identified through PSC Inspections for the Period 2014–2018. Sustainability 2020, 12, 5956. https://doi.org/10.3390/su12155956
Ukić Boljat H, Slišković M, Jelaska I, Gudelj A, Jelić Mrčelić G. Analysis of Pollution Related Deficiencies Identified through PSC Inspections for the Period 2014–2018. Sustainability. 2020; 12(15):5956. https://doi.org/10.3390/su12155956
Chicago/Turabian StyleUkić Boljat, Helena, Merica Slišković, Igor Jelaska, Anita Gudelj, and Gorana Jelić Mrčelić. 2020. "Analysis of Pollution Related Deficiencies Identified through PSC Inspections for the Period 2014–2018" Sustainability 12, no. 15: 5956. https://doi.org/10.3390/su12155956
APA StyleUkić Boljat, H., Slišković, M., Jelaska, I., Gudelj, A., & Jelić Mrčelić, G. (2020). Analysis of Pollution Related Deficiencies Identified through PSC Inspections for the Period 2014–2018. Sustainability, 12(15), 5956. https://doi.org/10.3390/su12155956