1. Introduction
The spread of COVID-19 shocked the world in the early months of 2020, causing a health emergency that forced national governments to take drastic measures for its containment (e.g., lockdown) [
1,
2,
3]. This situation impacted both on a macroscopic scale (for example, with effects in finance [
4,
5,
6,
7] and environment [
8,
9,
10]) and on a microscopic one, afflicting the lives of individual people in many ways. Several studies addressed these latter aspects, highlighting changes in risk perception [
11] and lifestyle and feelings [
12,
13,
14,
15]. In Italy in particular, the government adopted a series of progressively restrictive measures for tackling the spread of COVID-19, to preserve the safety and health of the population and avoid the overload of hospitals. A progressive extension of restrictive measures for people was implemented, in parallel with the spread of the pandemic throughout the country. These measures dealt with both individual and social aspects, such as the prohibition of going out from home except for realizing core tasks (e.g., grocery shopping or medicine supply) or the stop to sporting events and activities.
The first cities subject to this kind of containment were Vo’ Euganeo and 10 towns in the Province of Lodi (23 February 2020). Closure of schools and universities and the stop to sporting and artistic events were decreed ten days later (4 March 2020). Then, a total lockdown was ordained for the Lombardia region and other 14 provinces, while more bland measures were taken for the rest of the country (8 March 2020). A total lockdown for all Italian regions started three days later (10 March 2020). From 12 March, the closure of all commercial shops (except groceries and pharmacies) was imposed, while the closure of all non-essential productive industries was finally enacted on 23 March 2020. This state of restrictive measures was later renewed with small variations in April while a substantial relaxation of restrictive measures started on 4 May 2020.
The World Health Organization (WHO) [
16] pointed out that the availability of drinking water is a fundamental condition for the safety of people. This is not a trivial consideration: it has been widely documented how the water availability of unsafe water is suspected to be the cause of epidemics since ancient times [
17]. However, in the case of this health emergency, the WHO [
16] stated the absence of evidence about the survival of COVID-19 in drinking water, and this made it a valuable ally for improving the hygiene conditions of individuals and for limiting the spread of the virus. Accordingly, the health measures proposed by the WHO suggest frequent hand hygiene.
The particular phenomenology of this pandemic, that forced many governments around the world to implement lockdown procedures, led to a change in the regime of water demand, with repercussions on management issues. The change in people’s habits and lifestyle, as well as their shelter at home, altered the traditional underlying consumption dynamics. An interesting study about this topic was published by WatEner [
18], which documented the changes in daily consumption patterns for the city of Karlsruhe (Germany) during March 2020. The authors reported anomalies in the regime of outflows by comparing recorded data before and during the adoption of restrictive measures. One of the most relevant findings was the shift and the damping in the morning peak demand shifted a couple of hours later.
Analyzing the changes in the demand for drinking water induced by lockdown and restrictive measures is an important instrument for analyzing and understanding the social and financial dynamics of our society. Furthermore, it allows water managers to highlight individual and social dynamics in undisturbed conditions, linking users’ lifestyles and habits to psychological and personal behaviors.
This study was motivated by the opportunity to focus on water drinking demand, a research field probably underrated especially if regarded from the practical implications that the availability of safe drinking water had on public health during this emergency. In particular, the goal of this research contribution is to extend the degree of knowledge about underlying dynamics that can exert influence on water drinking demand patterns, highlighting the influence of individual lifestyle, social factors and industrial production on hydraulic regimes of instantaneous flow data distribution.
Furthermore, with the aim to extend to a wide range of water distribution networks the study conducted by WatEner [
18], flow data during the Italian lockdown for several municipalities of Puglia region (Southern Italy) were critically analyzed with respect to a traditional water regime. This allowed the author to compare different dynamics in water drinking demand policies.
The paper is structured as follows: in Par. 2, source materials and adopted methodologies for analyzing data are described; in Par. 3, changes in instantaneous flow data and daily volume requested are investigated. Their critical analysis is then reported in Par. 4, while in the conclusive paragraph the main findings and key results are highlighted and remarked.
2. Data Collection and Analysis
Water drinking demand is affected and influenced by numerous parameters. Recent studies analyzed both the influence of climate and weather on domestic water consumption [
19,
20] and the impact of climate components and community intervention factors on residential water demand [
21].
Several efforts were spent on defining a suitable methodology aimed at simulating the residential water drinking demand. Darbandsari et al. [
22] proposed a framework based on agent-based modeling to simulate the behavioral characteristics of residential water users and their social interactions to some factors such as hydrologic conditions, water pricing, and advertising policies, etc. Considering the aleatory character of water demand, several studies proposed stochastic approaches [
23,
24,
25].
Usually, lifestyle along with climate, water scarcity and water price are considered the most influential factors on water drinking demand but, concerning demand pattern, the first one is the most important, affecting daily flow request [
26].
Starting from this consideration, the following case studies were selected to analyze how during the COVID-19 pandemic the restriction measures influenced the lifestyle of Italian people in this region and consequently the daily demand pattern.
Instantaneous flow data of water consumption for five towns located in Puglia (Southern Italy) are analyzed: Cellamare, Lizzano, Trani, Molfetta, and Bari (
Figure 1). Their population ranges between approximately 5700 inhabitants for Cellamare and 325,000 for Bari.
Table 1 reports, respectively, not only the inhabitants but also the population that commutes every day from the place of residence to the place of work or study and the incoming commuter population. The choice of these cities was initially motivated by the opportunity of investigating the outflow regimes dynamic for a different number of inhabitants, nevertheless, the nature of the data and the comparison with standard periods allowed us to also investigate also the influence of social and industrial activities, as well as the significant presence of commuters. In this way, it was possible to recognize a variety of case studies, aimed at providing a deeper understanding of the influence of individual and societal behaviors.
Flow data were extracted from the remote control system of the Acquedotto Pugliese (Puglia Aqueduct, AQP in the following lines), the largest aqueduct in Europe, which supplies the water drinking demand and manages the whole water distribution network of the Puglia region for a total length of 21,000 km of pipes. AQP, in addition to the drinking water supply system, also manages about 11,000 km of sewer networks, 5 treatment plants for production of drinkable water, and about 200 wastewater treatment plants. AQP takes water from artificial reservoirs, springs and groundwater thanks to a system of wells distributed into the territory, assuring the highest quality and safety standards.
The role of AQP in the social and economic management of the Puglia region is crucial, because of the historical water shortage that affected this area whose only inner resource is groundwater. Since the beginning of 20th century, AQP has provided increasing quantities of drinking water from outer regions, that led to a complete fulfillment of drinking demand. In the same period, irrigation and industrial use have also increased water demand, while groundwaters have been further threatened by pollution, salt intrusion and overexploitation.
For several years, AQP has adopted different plans and strategies (e.g., the Green Procurement Plan) to reduce losses, promote the reuse of wastewater, exploit photovoltaic, wind farms and hydroelectric plants for generation of renewable energy, enhance all actions within the overall framework of sustainable development and respect for the environment. Moreover, AQP is promoting awareness campaigns with the aim of reducing water consumption and eliminating the improper use of drinkable water. These activities can be framed in the achievement of Sustainable Development Goals (SDGs) and, in particular, Responsible Consumption and Sustainable Cities and Communities. Within this strategy, the data recorded in the lockdown period provide a unique opportunity to analyze population behavior and water consumption with the purpose of (i) enhance the knowledge of the existing systems and users and (ii) provide insights into perspective scenarios of future human systems related to further development of smart-working or other economic and social developments affecting communities and population fluctuation.
Data analyzed in this paper are related only to the water drinking demand including commercial areas and were recorded from 0:00 to 23:50 for each day at time steps of 10 min. To perform a comparative analysis of water drinking demand, we decided to investigate data from 1 January to 30 April for years 2019 and 2020. In this way, it was possible to analyze and compare the regular (2019) and anomalous (2020) periods. We did not consider the last few days of lockdown (1 to 4 May 2020).
For the sake of clarity, we highlight that the use of only a single year for comparison with 2020 is mainly motivated by the intrinsic variability of water consumption among years, which can due to several factors (e.g., population variability, climate fluctuation, economic development). From this perspective, 2019 can be held as the most similar year to 2020, making it eligible as an appropriate choice for the proposed comparison.
The main variables analyzed were the instantaneous flows and the daily cumulated volume to analyze both peak and average demand values. We also analyzed the daily water volume percentage change (
Daily Volume Reduction), evaluated as:
where
is the daily volume and
is the average daily volume during January and February.
This choice was also motivated by the need to compare the available measures with data from previous studies (e.g., [
28,
29]) and for detecting change points, due to a modified lifestyle, during the lockdown period.
3. Results and Discussion
The analysis of the collected data revealed the existence of different patterns that were related to different stages of the restrictions due to COVID-19 pandemic. In order to provide the reader with a better description of results, a separate discussion for instantaneous and daily data is reported. For the purpose of this study, we consider the entire lockdown period as lasting from 4 March to 30 April 2020, starting with the closure of schools and universities. Then we will refer to the “1st Stage” as the period from 12 to 22 March 2020 (closure of shops, commercial centers, restaurants, etc.) and the “2nd Stage” as the period starting on 23 March 2020, when restrictions to the industrial sector were applied.
3.1. Instantaneous Flow Data
Analysis of daily patterns in hourly demand during lockdown is shown for the week from 23 to 29 March 2020 (Monday–Sunday). For comparison, data are overlapped with a similar week of 2019 (25–31 March) in terms of water demand and climate aspects. These time-windows were selected to be equally significative and comparable, as well as unaffected by any specific singularity (e.g., religious holidays). Trends of daily water demand are displayed in
Figure 2,
Figure 3,
Figure 4,
Figure 5 and
Figure 6. Results are illustrated with a focus on three peaks in water demand identified in previous studies ([
28]), and related to population habits typical of the area: in the morning (8.00), at lunchtime (13.00–14.00) and dinnertime (21.00). For the sake of clarity, it should be remarked that these habits can be considered representative of normal conditions (2019).
Figure 2 and
Figure 3 show how for the two smaller towns (Cellamare and Lizzano) the pattern underwent an interesting change. The maximum peak in the morning moved about 2–2.5 h later, from 8.00 to approximatively 10.00, probably due to a progressive delay in the waking up time of different categories of people, and for a delayed routine in carrying out the normal practices of personal and domestic hygiene. Moreover, the second peak of the day almost completely disappears. Then, the trend in water demand decreases almost linearly until the early afternoon around 17.00 and then remains almost constant until 21.00, when it undergoes a slight peak linked to dinnertime. After this time slot, the water demand drops to the minimum night flow rate, which does not change significantly compared to 2019. With respect to the magnitude of the peak water demand, it can be observed that that value does not change significantly. However, an increase in water demand and total daily volume can be observed during the weekend.
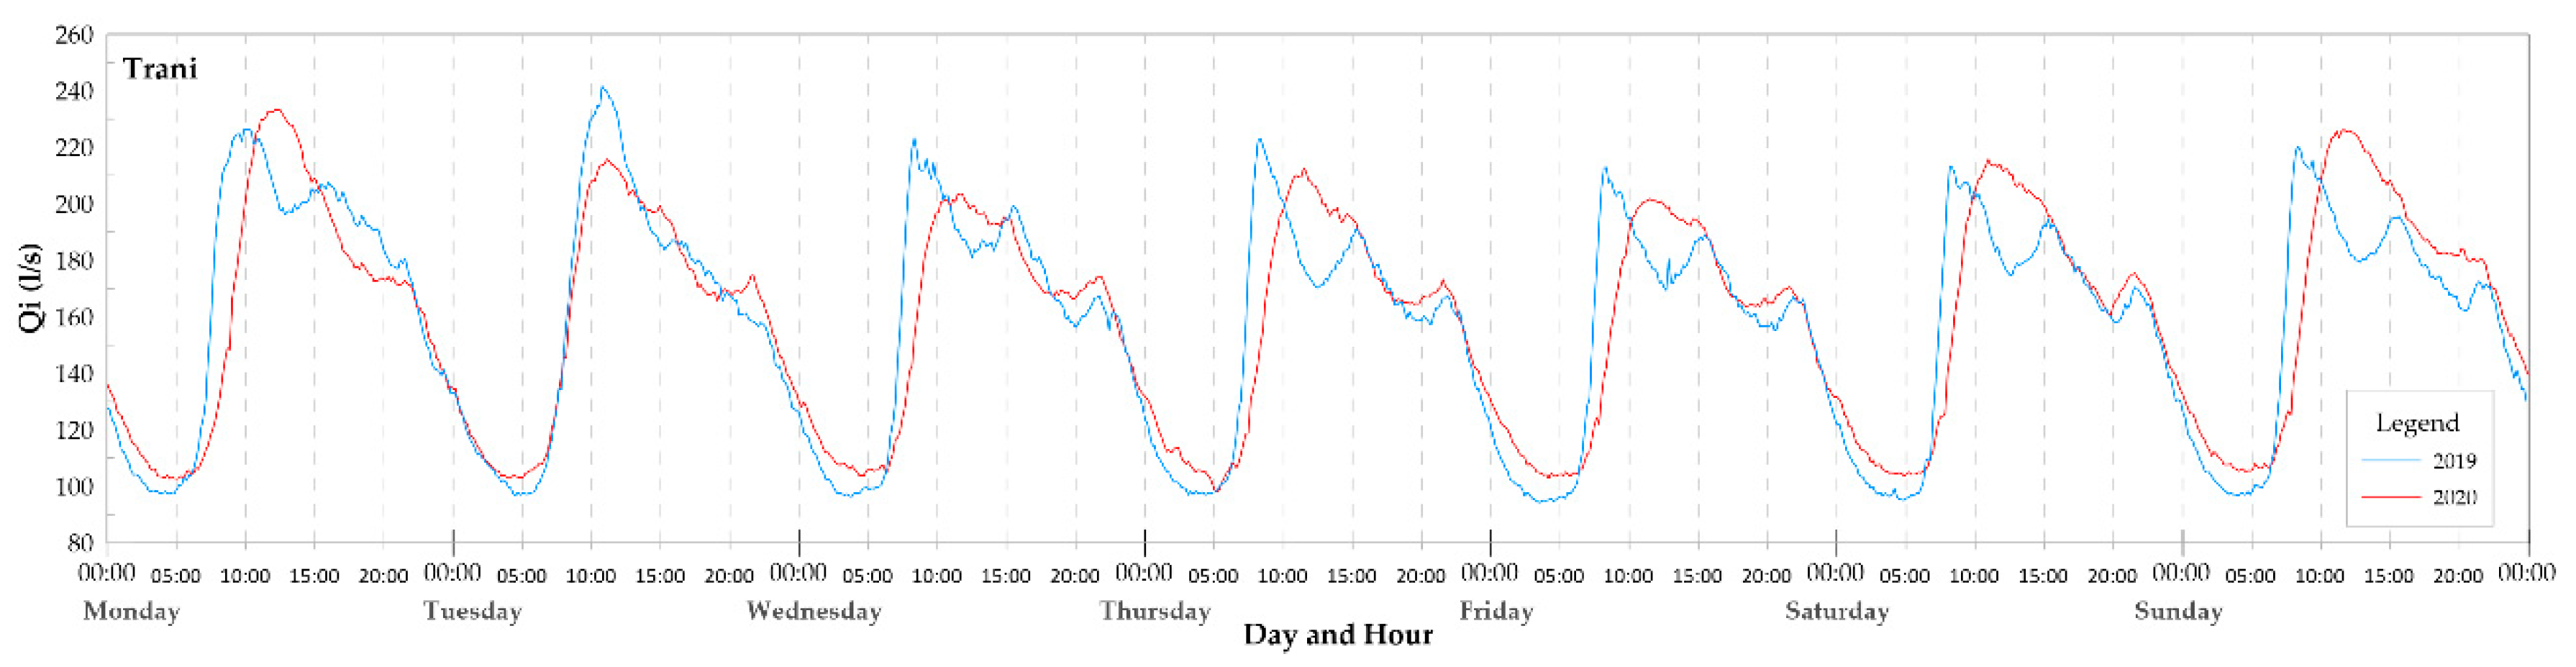
The city of Trani (
Figure 4) confirms a similar behavior, with a delay of the morning peak of the same amount of the two previous cases. A weak peak at lunchtime still remains, sometimes it merges with the morning peak and is definitely less pronounced than in normal periods. An afternoon decrease stage follows and then, again, a small peak around 21.00 can be observed, but less pronounced than for Lizzano and Cellamare.
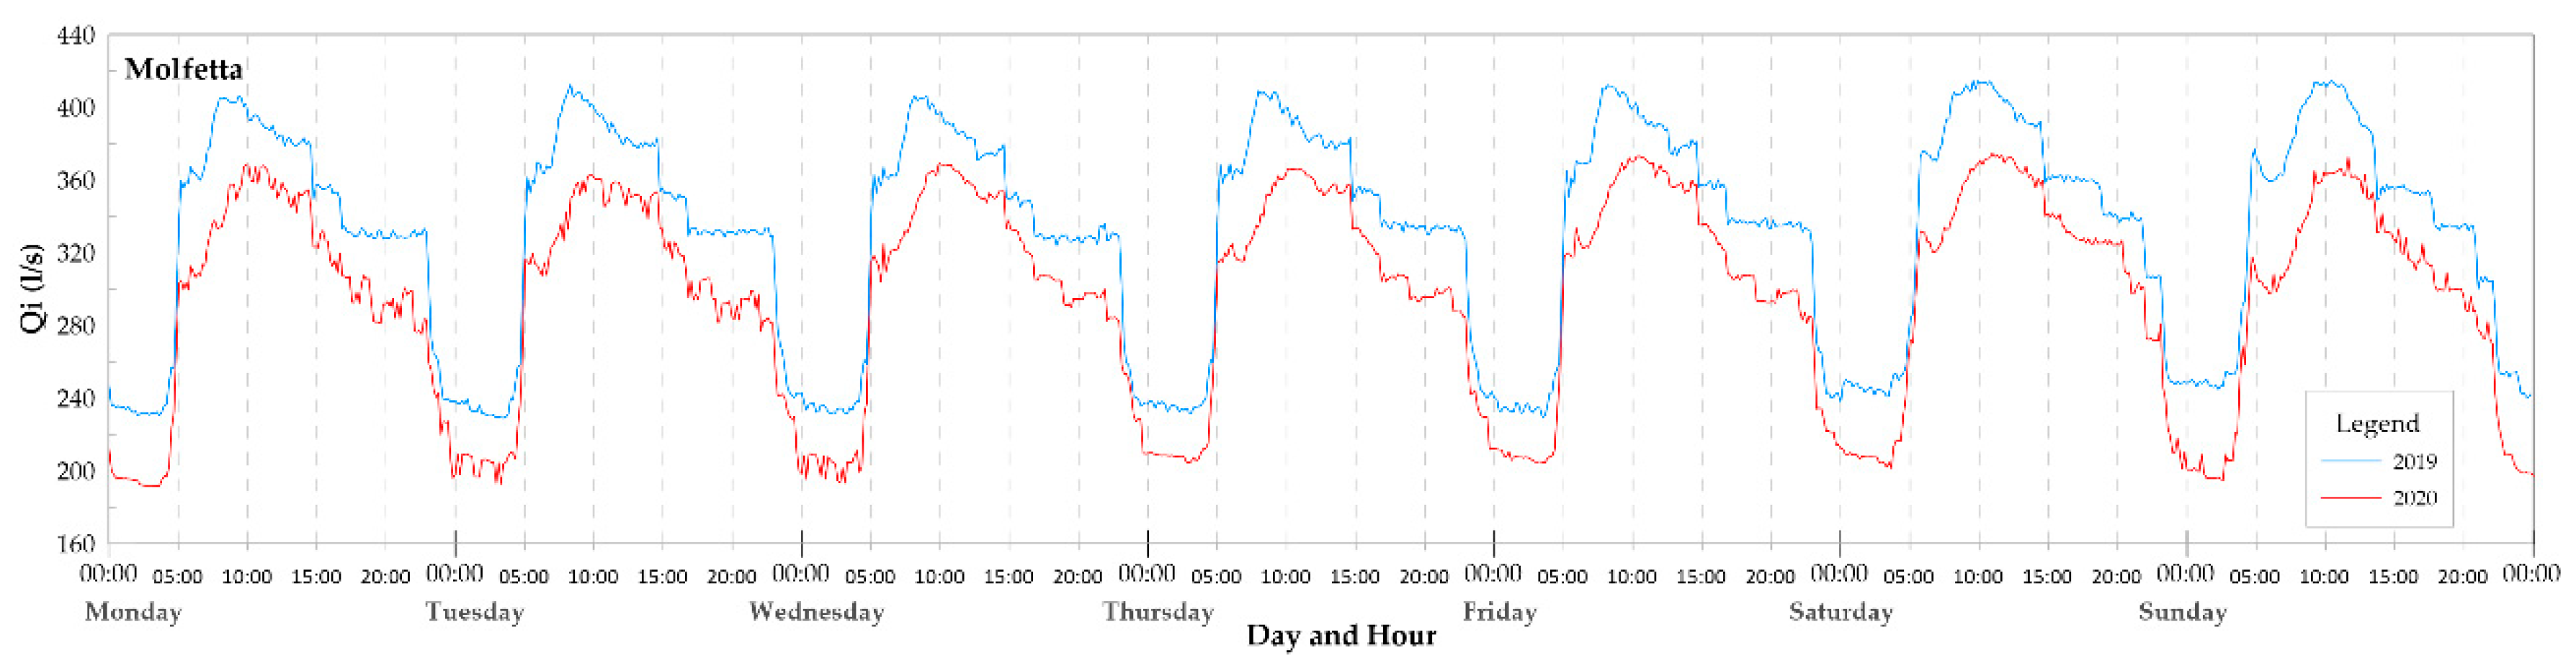
A different situation emerges when observing the behavior for the city of Molfetta (
Figure 5), where it appears that the entire water demand pattern is shifted downwards. Molfetta shows a comparable decrease for both the maximum and minimum flow rates. The maximum flow is always observed in the morning but about one hour later, going from 8.30–9.00 to circa 10. A further peak is depicted at lunchtime or a little later (around 14.00–14.30). After that, the flow rate decreases, stabilizing at circa 17.00 until 22.00, and then decreasing again reaching the minimum night consumption at 4.00 on the following day.
The downward trend in consumption is justified by a very large number of incoming commuters who did not weigh on the water demand of the inhabited center as well as an extensive commercial area, one of the largest in Puglia, during the lockdown. This also justifies a more contained delay of the morning peak, which seems to experience an almost complete damping.
In
Figure 6 the case of Bari is illustrated. This a very singular case, which needs two premises to be formulated. The first one arises from the observation (
Table 1) that this city normally receives about 75,000 commuters every day and that, during the lockdown, they were practically set to zero. The second one, instead, is referred to as a singularity due to a specific water management policy, effective for more than 50 years. Unlike in the rest of Italy, the water network distribution is allowed to provide water pressure two meters above the ground level. In the town, the use of private tanks and local pumping or boosting systems is mandatory to satisfy all utilities and houses on the upper floors. A large number of buildings are provided with such devices to guarantee the necessary pressure for each user. For this reason, the daily water demand pattern is damped by the tanks’ storage, and in a normal situation, Bari also shows less pronounced peaks.
Starting from these considerations, it can be observed, in this case also, a delay in the morning peak of about 2 h (from 8.00 to 10.00). The reason for this particular behavior can be traced back to the lack of water withdrawals due to the absence of users in offices, schools, universities, as well as in shops and business buildings, completely closed in the second lockdown stage. After the delayed morning peak, water demand decreases until 15.00, then, after a small peak, it decreases again, and reaches a plateau remaining stable until 20.00; then, after a smooth increase observed at 22.00, it decreases from 23.00 until it reaches the minimum night flow. Moreover, the minimum night flow is affected by the reduced filling of the private tanks.
3.2. Daily Volume
Interesting considerations emerged observing the daily volume for the same towns starting from 1 January until 30 April 2020 (
Figure 7 and
Figure 8).
Cellamare (
Figure 7a and
Figure 8a) does not show any significant change in daily volume during restrictions due to the COVID-19 pandemic: the reason may be found in the main economic activity, which is agriculture. The sector did not suffer a complete stoppage as it is considered an asset for necessary goods. Nevertheless, the compresence of workers has been limited for the respect of so-called social-distancing measures. Moreover, the number of commuters is not significant, neither ingoing nor outgoing. Therefore, despite the restrictions, the users’ habits actually changed in time distribution, without affecting total daily volumes. Lizzano (
Figure 7b and
Figure 8b) shows an average decrease of 150 m
3/d, but since the end of February. This decrease is noteworthy but not entirely attributable to the pandemic restrictions considering its initial stage. Trani (
Figure 7c and
Figure 8c) shows a moderate variability in the first stage (closure of schools and commercial activities) and a more pronounced variability associated to decrease during the second stage (closure of industrial activities).
Molfetta and Bari (
Figure 7d,e, and
Figure 8d,e) show a different behavior, with a gradual decrease in the daily volumes starting from the first closures (schools and commerce), and a stable reduction in volumes during the total closing stage.
Concerning the most-demanding day of the week, for Trani and the smaller towns the maximum daily water volume is observed on Saturdays like observed for Apulian towns by Balacco et al. [
28] before and during the pandemic restrictions. In Molfetta and Bari, the most demanding day is characterized by some apparently random variability. Nevertheless, during the lockdown stages, a maximum daily water volume has been observed frequently on Saturday.
In
Table 2, we report the minimum daily volume observed before lockdown and the percentage of days above such threshold during the two lockdown stages.
It is interesting to note that outflows seem to not be affected by the influence of lockdown for small towns (Cellamare and Lizzano), while in Trani, a modest reduction in minimum values is depicted only in the second stage. Instead, this behavior is substantially different for the cities strongly influenced by a fluctuant population, commercial and industrial activities. In particular, this latter aspect emerges in a marked way for the city of Bari, where the percentage of days above the minimum pre-lockdown increased from 18.18 to 94.87% moving between the two stages of restrictions. Finally, these two cities showed a minimum value of outflow volume on 8 March 2020, i.e., during the period of closure of school and universities, as a confirmation of the importance of the fluctuant incoming population in the water drinking management policies.
Figure 8 summarizes this percentage change from the 1 March 2020 and until the end of April 2020, confirming what can already be deduced by
Figure 7. Summarizing results of
Figure 7 and
Figure 8, the amount of reduction in water volume seems to be mostly related to the town population but also to the percentage of incoming commuters.
By comparing the maximum and the minimum daily flow rate of the first four months for 2019 and 2020, it is possible to observe, respectively, how for Cellamare (
Figure 9a,b) and Lizzano (
Figure 9c,d) a particular trend cannot be observed due to the restrictions.
Trani showed a moderate decrease in the maximum daily flow rate (
Figure 9e) while the minimum flow rate showed a major decrease even already started in February, hence the cause could be ascribed also to other local factors and not only to the pandemic (
Figure 9f).
On the contrary, for Molfetta (
Figure 9g,h) and Bari (
Figure 9i,l) a pronounced decrease in both maximum and minimum data can be observed, starting from the closure of schools and universities. In these last four figures, this was highlighted by adding an additional blue band from 4 to 11 March 2020.
3.3. Discussion
Drinking water availability plays a crucial role in ensuring proper living conditions for humans and ecosystems. The need for such a type of resource is especially exacerbated during health emergencies, when the water, due to its indispensable nature, may act as a vehicle for bacteriological infections. However, this is not the case of the COVID-19 pandemic, and this allowed the freshwater availability to be a precious ally in tackling the spread of the virus. Furthermore, progressive steps of lockdown measures changed the social lifestyles and financial dynamics of Italy. In this framework, water distribution systems experienced changes in outflow regimes, both in module and temporal behavior, reflecting social conditions with evidence directly proportional to the role of single cities in the social environment.
Concerning the three peaks traditionally observed in a weekly plot of instantaneous outflows, a substantial modification in their phenomenology was observed during the lockdown. In particular, the morning peak was generally shifted 1–2 h later, and its decay rate appears to be generally smoothed: the reason for this tendency can be traced back to the modified lifestyle of people and is in accordance with that observed in the work of WatEner [
18]. This statement finds feedback in the work of Cellini et al. [
12] where authors, through a survey-based approach carried out along the Italian territory, highlighted changes in sleep habits of people. In detail, for workers and students, a statistically significant correlation was found in bedtime and waketime, depicting how both were delayed. However, if the first was delayed for both categories by around 41 min, the latter was postponed by around 45 min for students and around 1 h and 13 min for workers. These progressive steps can reasonably be viewed as the reason for the delay of peaks for all cities. It should be noted that the city of Molfetta keeps in maintaining the first peak at around 5.00 without any apparent delay: the reason is probably linked to the key role that this city assumes in the economy of the area, representing the clearinghouse for fisheries and agricultural sectors, kept open during the lockdown.
The peak related to lunchtime appears, but not so evident as in 2019. This is also due to the smoothing of the morning peak, which is followed by a sort of plateau until 12.00. Then a small peak keeps in appearing and extends until 15.00, when all after-lunch cleaning operations of crockery and kitchens are finished. Dealing with the peak of dinnertime, it seems to appear at the same time as the previous year, but with different modalities for the cities observed. In fact, for Cellamare, Lizzano and Trani, the outflow rate seems to be slightly superior during the lockdown, while for Molfetta and Bari (
Figure 5 and
Figure 6), it is appreciably reduced. This different behavior cannot be explained by population, with Trani being comparable to Molfetta for the number of inhabitants. Thus, the key distinguishing factor seems to be the percentage of incoming daily commuters, which is particularly relevant for Molfetta, in particular for its big commercial district, and Bari. which also adds a consistent university student population.
If instantaneous flow rates are very helpful for understanding the modified lifestyle of people, the daily volume is more sensible for understanding commercial and industrial activities, markedly denoting the influence of lockdown on a macroscale. In fact,
Figure 7a,b and
Figure 8a,b show that these cities, Cellamare and Lizzano, have a similar pattern to daily flows before and during the lockdown, confirming the hypothesis of the reduced amount of commutant population and industrial activities. For Trani,
Figure 7c and
Figure 8c show a distinctive reduction in the 2nd stage (closure of the industrial sector). However, the strongest and stable reductions are observed, as confirmed by
Table 2, for the cities of Molfetta and Bari (
Figure 7d,e and
Figure 8d,e), characterized by commercial districts and consistent incoming daily commuter population. This behavior is not surprisingly similar to the decay in Italian electricity consumption depicted by Cicala [
4].
Final feedback on the regimes in modified outflow rates of Bari and Molfetta appeared in
Figure 9, where a relevant decrease in maximum and minimum daily flow rates started from the first stage of lockdown.
As emerges from this discussion of results, water demand regimes during lockdown were subject to modifications related to the restriction measures for people and industrial and commercial activities. These changes reflected the modified lifestyle and work cycles, confirming the results conducted in similar studies (e.g., [
4,
12]). The importance of these observations can be reconducted both to the trust of people in the role of drinking water in health care and its importance in the industrial sector for a region traditionally affected by water shortage. Finally, these data collected in this singular period can be fundamental supports for understanding water-related social dynamics and better planning water resources management in the following years.
4. Conclusions
Since the end of January 2020, the COVID-19 pandemic changed the lives of many people in almost all over the planet with a total number of cases of 14,890,516 and several deaths equal to 616,317 (source [
30]).
Italy, immediately after China (where the infections started), was the second nation hit hard with further damage resulting from the total novelty of what was happening and with the strong uncertainty of how the situation could have evolved.
Based on these considerations, the Italian government promptly decided to apply heavy restraint measures in order to contain the ever-increasing number of cases and, especially, deaths. Suddenly, in a few days, about 62 million people found themselves constrained in their homes, unable to do things they were used to, prevented from being able to enjoy the freedom they have always had since their birth.
At the date of publication of this paper (July 2020), the COVID-19 epidemic in Italy is not over, gatherings of people in public places are still forbidden, and social-distancing measures are mandatory in every activity. Like every other region in Southern Italy, Puglia has been affected by the pandemic less dramatically than other regions in the Center and North Italy. When the lockdown began, the daily rate of diagnosed infected people in Puglia was very low, then it grew and peaked on the 30 March; today it is practically at zero value. The number of cases in hospitals and intensive care units was always below the maximum capacity of the regional health services.
So far, the containment measures adopted at the National and Regional level can be considered effective. The results of this study also allow us to conclude that the population of Puglia, and, by analogy, of Southern Italy, have thoroughly followed governmental prescriptions, despite their heavy economic consequences, thus reinforcing the effectiveness of the measures.
The Apulian population thus changed their habits and the times in which they carried out daily operations such as waking up, having lunch, etc. Starting from these considerations, it was investigated, using water demand data of five Apulian towns, how this change in habits could have had repercussions on water consumption. Flow data, extracted from the remote control system of the AQP and recorded at time steps of 10 min, permitted us to conduct a comparative analysis of water demand for a representative week during the restriction measures. The goal of our analysis was to describe in both quantitative and qualitative terms how this singular modulation of activities influenced water outflow regimes, investigating five cities characterized by a different degree of social and financial complexity.
Results highlighted the different habits of users, a delayed wake up by about 2 h (about 10.00 a.m.) in general, and water demand starting from this time that lasted until 14.00–15.00, this aspect implicated the absence of a classic water peak demand corresponding to the lunchtime. Instead, the water demand pattern was unchanged during the evening and the night, and even in some cases corresponding to the bigger towns, the demand pattern translated downwards. The last one was confirmed by comparing the daily volume requested and both explained considering the total absence of commuters during the lockdown.
The results of this study once again highlight how user habits are one of the dominant factors on the trend of drinking water consumption and how knowing the social habits and social structure of a residential zone can represent a valid support for forecasting the same consumption. Social phenomena are usually ascribed to traditional and historical habits but are also affected by economical and logistic developments. Certainly, the prediction of consumption peaks remains a complex task, characterized by both deterministic trends and stochastic random variability.

 ,
, 


