1. Introduction
One of the ideas derived from precision agriculture is the application of existing technologies to build better and more efficient systems to handle agriculture businesses. Nowadays, we have devices that often have built-in complex sensors and that can connect and communicate which each other easily. These devices and systems also allow collecting and processing large amounts of data with fairly small and affordable hardware. Internet of Things (IoT) seeks to take these common technologies and devices that are present in today’s world and interconnect everything to accomplish new objectives and applications.
The concept of IoT together with existing technologies opens a wide range of opportunities to apply in the field of agriculture monitoring. Some of these opportunities are the following: Wireless Sensor Networks (WSNs), full connectivity between the system’s nodes, constant monitoring of the environmental status, efficient energy and water use in order to achieve an autonomous system, or keeping the economic costs constrained.
This paper contributes to the state of the art by analyzing the literature to find out the main features involved in most WSNs for smart irrigation systems. Secondly, the paper describes an open system implementing all the studied technologies.
The projects’ target application is small and middle-size agriculture plantations that are currently not automatized and could take advantage of a low-cost energy-autonomous sensor network.
The rest of the document has the following structure. After this introduction, a state of the art section analyses the literature of similar systems and provides a comparison between all of them. Then, we describe our proposed solution by explaining the architecture, as well as the operation and communication technologies that are used. Later, the section “Cloud analysis” describes the data analysis performed in a cloud platform using the data received from sensors. Section five describes the project from the energy efficiency point of view. The manuscript finishes with a conclusion section that summarizes the facts, status, and future lines of work of the project.
2. State of the Art
Over the last years, there have been huge developments in technological applications that allow easily integrating and connecting multiple sensors in networks. Microcontrollers have played a key role in the prolific development of IoT projects, specifically in the field of precision agriculture. The inclusion of a WSN for gathering information is one of the key requirements for projects within the area of agricultural field monitorization. Authors in [
1] indicate that the overarching goal of the future sensing systems is synergy. They also highlight that the gap between research and practice keeps growing significantly and that efforts to integrate WSNs with existing technologies are much needed. Therefore, understanding the context of efficient sensor networks on agriculture implementation can help provide a general idea of the sector’s growing and current status [
2]. It is worth mentioning some of the key factors that can heavily influence the growth of this sector, which include reduced energy consumption, reduced costs, data security, scalability, as well as common development platforms and connection protocols [
3].
Putting special focus now on the precision agriculture sector, it is interesting to mention some of the IoT applications with more potential during the following decade [
4,
5]: agricultural drone surveillance, cattle monitoring, smart greenhouse, wide agricultural plantation management, and smart watering system. Since the energy and water resources are rather limited and expensive, one of the main aims of the agricultural sector is looking for more efficient watering systems. Currently, the development and investigation of watering systems are focusing on new trends and types of watering methods, such as nebulization watering or watering drip systems [
6]. Naturally, these watering systems must be powered by heavy machinery that allows big amounts of water to be pumped over large distances. Apart from the traditional diesel engines or centralized electric engines, a number of additional solutions are currently under development.
It is worth to mention the idea of microgrids, where small autonomous cells can provide energy to activate the aforementioned systems [
7]. For middle and large agricultural farming businesses, vertical and seamless integration between all features is needed, primarily in areas where the connection to the main distribution grid is not possible. A clarifying example is SenseFarm that allows implementing a sensor network based on LoRa, which was originally designed for smart cities [
8]. The most interesting aspect of this solution is a common base of technologies that can be easily adapted for different applications.
We review now a number of additional studies that have implemented other agricultural systems that use technologies similar to ours. Ramani et al. [
9] designed a system based on Arduino-compatible devices, which included sensors and wireless communication through 3G. This system was also able to generate its own energy through photovoltaic panels. Saxena et al. [
10] proposed a similar system, where they introduced a solar-based WSN with several distributed nodes to measure humidity and temperature using sensor data.
Additionally, Adenugba et al. [
11] described a solar-based energy harvesting WSN system that controls the irrigation through sensor values and a weather prediction. This prediction is based on historic and current data to determine through neural networks if it is going to rain on a certain day or not.
Mekonnen [
12] described a WSN based on Arduino and ZigBee communication protocol that includes an off-grid photovoltaic cell to supply power to the system. They collect sensor data in a cloud platform to provide graphs about the sensor data evolution. As the main contribution, their system implements also machine learning algorithms to determine the actions to be taken regarding irrigation. Vij et al. [
13] also described a very similar system. The work of Jin et al. [
14] is also aligned to the AI-oriented proposals. They use a hybrid deep learning model to obtain more accurate predictions of temperature, wind speed, and humidity to meet the needs of precision agricultural production. Marcu et al. [
15] described a system that contains sensors collecting several parameters, such as temperature, leaf wetness, relative humidity of the air, and soil and solar radiation. The nodes are also powered by solar cells and batteries and send the data to a cloud platform to generate a graphical representation.
Kumar et al. [
16] proposed a cost-effective system that monitors sensor data such as soil moisture, temperature, relative humidity, and light intensity to automate the irrigation and provide a graphical representation of the values. Sudharshan et al. [
17] focused their design on the use of fuzzy logic to automatize the irrigation. The system also uses a solar cell to power the system. Sharma et al. [
18] also focused their work on maximizing the WSN network lifetime using a solar energy harvesting technique. However, their work is just a mere simulation of network lifetime; they did not really create a prototype.
Khoa [
19] also described an Arduino-based WSN with WiFi and LoRa wireless communications. They measured five parameters to increase crop productivity: temperature, temperature–humidity, soil moisture, rain, and water level. Their studies indicate an improvement of 30% in economic benefits with respect to the traditional watering method. However, this system does not include any energy harvesting technology to avoid the necessity of a wired power supply. The system developed by Devanand et al. [
20] does not need energy harvesting of any form either. They centered their design in a cost-effective Arduino platform. It provides automatic irrigation based on sensor values, although it does not provide any cloud analysis.
Mahbub’s [
21] WSN is based on Arduino devices that use WiFi for node communication, and the coordinator node uses GSM to send data to the cloud. It also uses a photovoltaic cell to power the nodes. The data analysis done in this project is based on a Google Sheet, which allows creating simple graphs showing the evolution of the data. As the main contribution, this system implements an SMS alert system with predefined messages to the farmer.
Zervopoulos et al. [
22] also described an Arduino WSN system that uses ZigBee and WiFi for communications. Their study especially focused on message synchronization and network problems in networks with a high number of nodes. Touseau et al. [
23] also worked on a similar topic developing disruption-tolerant RESTful support for smart agriculture. They used an HTTP REST web service and CoAP protocols for this purpose. In this case, they used Raspberry Pi boards for each node.
Trilles et al. [
24] proposed an open and low-cost sensorized system for the cultivation of a vineyard. Their system is based on Arduino boards and uses Bluetooth for node-coordinator communication and GPRS for coordinator-cloud communication. The messaging service is orchestrated through lightweight REST messages. They use a solar panel and a battery to provide energy to the system. The system uses sensor data (temperature, humidity, and rainfall) to send SMS notifications.
Based on this analysis, we can conclude that Arduino-compatible devices are the most popular devices chosen for the development of smart agriculture, at least for the experimental systems described in the literature. Most of them use ZigBee and WiFi technologies for nodes-coordinator communication, as well as GSM or LoRa for communication between the coordinator-node and the cloud platform. Furthermore, most of them include some kind of energy harvesting system, usually through a photovoltaic cell. Finally, most of these systems use the data from sensors (mostly temperature and humidity) to activate the watering systems when needed.
After this literature review, we can summarize the main conclusions on WSN features in agriculture environments as follows:
Energy autonomy: Energy autonomy is usually obtained by energy harvesting, for example, based on solar cells. This is very helpful to be able to install the nodes in any place without having to worry about energy supply.
Irrigation based on sensor values and real-time weather forecast: Irrigation is implemented commonly based on sensor values to efficiently estimate the adequate quantity of water and energy needed. For example, irrigation systems frequently use real-time weather forecasts to minimize the quantity of water and energy in order to avoid unnecessary irrigation.
Remote visualization: Cloud analysis and remote multi-device visualization are implemented to allow operators/owners to monitor the exploitation in real-time.
Message orchestration: Large WSNs require some message orchestration to ensure that the coordinator node is able to receive and process in the correct order the data sent by the rest of the nodes.
Alert systems: Most systems implement alerts to notify the operator/farmer about events that need attention.
Cost-effective design: Having the lowest investment possible is an important factor to be able to have a profitable business, and having cost-effective designs is a mandatory feature of these systems.
Open project: The use of open hardware and/or free software usually reduces considerably the investment and facilitates the deployment, interoperability, and prototyping. Furthermore, this hardware and software facilitate personalization of the final system according to the requirements. Finally, if there is a community around the product, they can support the installation and maintenance, as well as ensure continuous improvements.
Once these main features to study are defined, we can compare (see
Table 1) each one for the analyzed systems. As can be seen, none of the analyzed systems covers all the studied features. For that reason, in our study, we proposed a system that includes all of them. Next sections will provide a detailed description of the proposed system.
3. Proposed Solution
The proposed system is a WSN consisting of a coordinator node, which is in charge of collecting sensor data from the rest of the nodes and sending such data to the cloud. Additionally, there is a set of sensor nodes that collects the information from sensors (temperature, humidity, rain, or light) and handles the actuators (e.g., watering pump). The coordinator sends data to the cloud platform, which is able to represent the received data and system status in graphs that are easily interpretable by the user. The coordinator node takes the decisions about how and when the actuators (irrigation system) must be enabled based on the sensor data and forecast data. Depending on weather conditions and sensor values, the coordinator node will send the command to the nodes to activate the irrigation.
Regarding energy efficiency, every single node in the system is energy-autonomous thanks to batteries and a solar energy recharging solution. Next subsections extend this explanation.
3.1. Architecture
The system is composed mainly of three parts: Cloud Platform, Coordinator Node, and Sensor Nodes (see
Figure 1).
The coordinator node and sensor nodes are built using an Arduino Microcontroller. On this Arduino board, we integrate several extensions such as WiFi and ZigBee modules, environmental sensors and self-charged energy structures. Next, the hardware for each of the two different nodes is briefly described.
Coordinator Node: This Arduino-based node together with the additional communication modules handle the communication between the information system in the cloud and the end node devices (sensor nodes). In addition to an Arduino Mega ADK [
25], a WiFi module (ESP8266) [
26] and a ZigBee module [
27] are part of the node. The ZigBee module is connected using an Xbee Shield module that allows easy and secure connection. The node also includes an OLED small screen [
28] to show operation messages. This screen is useful for setup purposes or when the operator starts/stops the node. It also shows events about network problems.
Figure 2 shows how the ESP8266 module is connected to the Arduino Mega to provide connectivity to the Internet. It also shows a picture of how it looks with the ESP8266, OLED screen, and the Xbee Shield connected.
Sensor Nodes: They are strategically located in representative spots of the agriculture field. They are Arduino NANO boards [
29] that have an Xbee module connected together with environmental sensors (temperature, humidity, light, etc.). Specifically, the following sensors are connected:
DHT11 sensor for temperature and air humidity [
30];
Light-dependent resistor (LDR) for light levels [
31];
YL-83 sensor for rain levels [
32]; and
YL-69 sensor for soil moisture levels [
33].
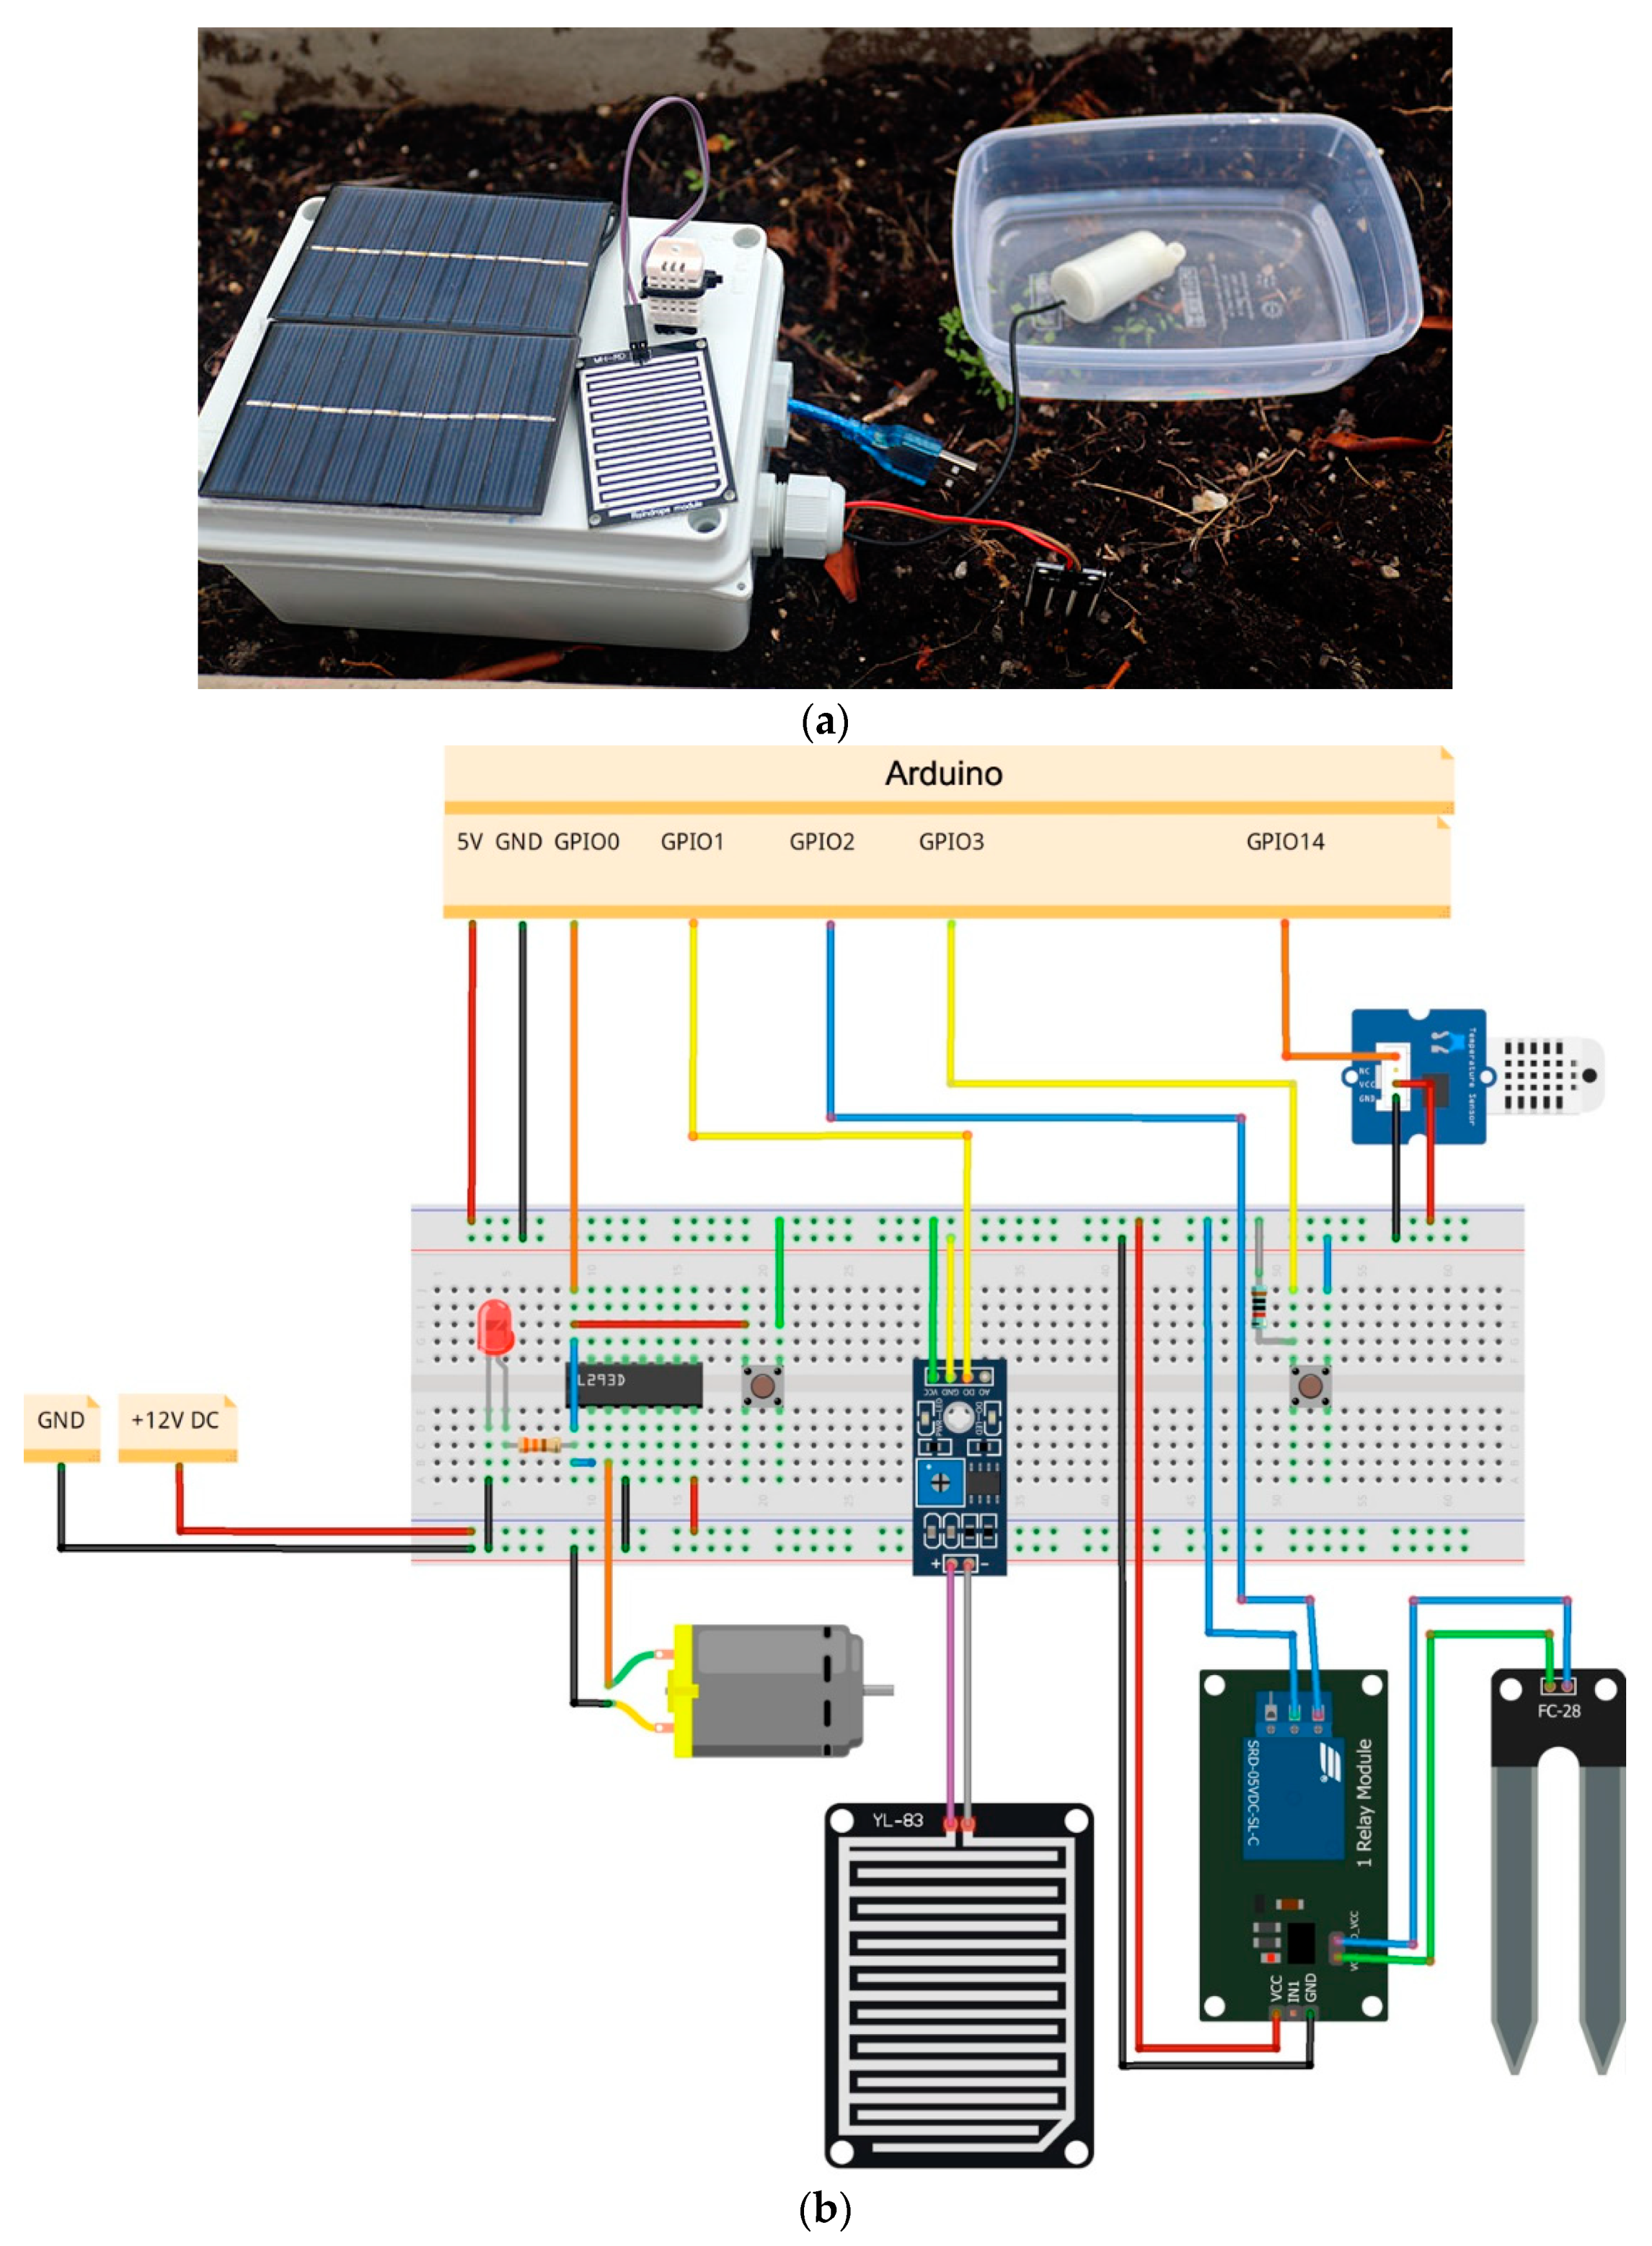
Within the project targets of simplicity and cost-effectiveness, several models of sensors were installed and tested. Due to the final agricultural application, an exceptional precision in the data collected by sensors is not inherently required. For this reason, after several tests, the conclusion is that the use of general-purpose sensors is satisfactory in terms of precision to maintain a positive cost-effectiveness balance.
As previously mentioned, a complete energy harvesting system is implemented thanks to a solar cell and a battery. Thus, the system is able to self-charge and work autonomously without a wired power connection. This setup contains a lithium-ion polymer battery (LiPo), a small size photovoltaic panel and a LiPoRider board [
34]. Further details will be offered in the Energy Efficiency section. In
Figure 3, we show a picture exemplifying one of the real sensor nodes.
Both sensor nodes and the coordinator node are built based on an Arduino platform. However, the Arduino board is only used for prototyping. Once the system is validated, the Arduino-based prototype will be converted into an ad-hoc PCB designed for the final application with the most suitable sensors and radio technologies in each case. This is possible since Arduino is a fully open-source architecture. Using Arduino in the process makes the steps from electronic prototyping to final product cheaper, flexible, and faster. The final board will be a cheaper, more compact, and efficient device.
We have opened both the hardware and software designs publicly, and thus the community can pick up our designs to use them or continue building upon them. Therefore, anyone could deploy our system and take advantage of its benefits, and at the same time contribute to the project and benefit the rest of the agricultural community.
3.2. Communications
As previously mentioned, the communication between the sensor nodes and the coordinator node has been implemented with ZigBee. For large-scale fields where the ZigBee signal might reach the coordinator node weakened, a repeater node can be added to cover the gap between the coordinator node and the sensor nodes. This repeater node acts only as an amplifier to allow the signal from sensor nodes to reach the coordinator node.
The ZigBee protocol performs especially well under low energy requirements. However, its short-range coverage makes it only a good choice for small exploitations. Other radio link alternatives should be used for larger applications, such as those based on LPWAN (such as LoRa) or mobile network operators (such as GSM, GPRS, 4G, or 5G).
The communication protocol connecting the deployed network with the cloud interface and server is set up with MQTT (Message Queuing Telemetry Transport), which is a well-known IoT protocol built over TCP/IP.
The IoT cloud platform used in the project, ThingSpeak, recently added support for MQTT. It allows the user to visualize and control every aspect of the deployed network. The cloud service, through the coordinator node, controls the watering system depending on the collected data or by direct user commands. The final goal for data processing is to achieve an efficient system for improving resource management and the subsequent savings in water and power.
The interaction and data exchange from the WSN with the cloud services are also based on the MQTT protocol. An intuitive way of describing the behavior of this protocol is under a subscribe/publish scheme, which can be observed in
Figure 4.
3.3. Operation
The coordinator node is constantly monitoring over the sensor nodes situated in the ground and controlling the watering systems deployed for those fields.
Nowadays, there are several online alternatives specialized for IoT services. We evaluated several free and paid platforms, such as Adafruit, ThingSpeak, Amazon WS, and Thinger. Finally, ThingSpeak was selected for the dashboard and analytics implementation in the cloud since it supports the MATLAB programming language, is very powerful for data analytics, and provides easy graph representation.
Relative to the watering decision logic in the coordinator node over the collected data, multiple combinations and factors were considered in order to find a proper way to achieve the target of increasing the efficiency in water and electricity consumption.
Once the coordinator node code has started (see
Figure 5), the program retrieves the expected probability of precipitation for the area where it is located.
This information is obtained by using a local weather forecast API service, after providing the ZIP code of the town (in Spain this service is provided by AEMET). If the forecast data reveals a raining probability along the day higher than the predefined threshold, the watering system will not be triggered on this day to save energy and water. If there is no high raining probability, the program checks the values from the sensors against some preset thresholds to determine if all the conditions are met to start the irrigation. These values can be modified by the operator at any moment, and the predefined values are as follows:
Minimum temperature to start irrigation. This threshold is preset to 10 °C.
Maximum value of relative humidity to start irrigation. This threshold is preset to 80%.
Maximum probability of forecasted precipitation. This threshold is preset to 65%.
Until all conditions are met, the coordinator node will be sending data about the system status to ThingSpeak and checking all conditions. When all conditions are met, the water pump is activated. Meanwhile, the pump status and the values from sensors are sent to the platform.
Regarding the sensor nodes, they get the values from sensors in a loop and send them to the coordinator node periodically. Furthermore, in this loop, the sensor nodes ask the coordinator node if they must start irrigation. The sensor node enables the water pump only when it receives a “start” command from the coordinator node (
Figure 6).
4. Cloud Analysis
4.1. ThingSpeak Setup
The information obtained from the sensors is stored in what ThingSpeak calls channels. Up to eight fields can be added to each channel with the data to monitor and can be later analyzed and displayed in graphs.
Each channel has an identification number, a writing key, and a reading key, which every object or equipment must indicate in its code to be able to use its API. On the other hand, each channel has privacy options to make it either public or private. In this project, we created four channels that are identified as follows:
The irrigation control system. This channel is used to view the status of the sensors, the engine, and the percentage of probability of precipitation.
The analysis of climatology. This channel has two fields: one to indicate the maximum temperatures of the day, and the other contains a graph with the relationship of temperature with relative humidity.
Pump analysis. This channel has two graphs that inform about the times when the pump ran for the last 30 days and the daily running time.
System savings. This channel shows the efficiency data of the smart system. Specifically, the graphs of this channel indicate the number of times in the last seven days that the engine was not started based on the precipitation forecast. It also represents the amount of water and electrical energy saved in those last seven days and the consumption of water and electricity over the last 30 days.
4.2. Display Graphs Using MATLAB Visualizations
This application facilitates the creation of visualization graphs of different types generated with a MATLAB code, which is fed with data obtained from the fields of the channels. For this project, eight visualization graphics were created:
Temperature and humidity graph (
Figure 7 top). This application allows generating a scatter plot visualization that facilitates the comparison of these two variables.
Figure 7 (bottom) shows the MATLAB code that creates this graph.
Daily running time. This graph contains the information on the time (in minutes) that the pump has been running every day.
Running time during the last 30 days. The code generated for this graph is the same as the one previously described, with the only difference being that this graph displays aggregated information for the last 30 days.
Pump operation time saved based on forecast prediction. This graph provides information on the time (in minutes) that the engine has not been running due to the high probability of precipitation even when all other conditions for starting the pump were met. The graph provides this information for the last seven days.
Water saved based on forecast predictions. This graph provides information about the water saved (in liters) thanks to cancelling irrigation when there was a high raining probability.
Electric energy saved. This graph contains information about the energy not consumed thanks to the fact that the pump did not start because of the weather forecast.
Water consumption. This graph provides an estimation of the water consumed (in liters) for irrigation in the last 30 days. For its calculation, the system takes the information from the graph “Running time during last 30 days” and multiplies it by the estimated water liters per minute.
Electric energy consumed in the last 30 days. This graph provides the electrical energy consumed by the water pump. This code is generated by multiplying the pump electrical consumption and the minutes that the pump has been running during the last 30 days.
4.3. Notifications
ThingSpeak also has the possibility of sending notifications through the Twitter social network based on the information collected, thanks to the ThingTweet application. It is an application that allows you to connect a Twitter account with the ThingSpeak platform and thus be able to send alerts to the user through the social network.
Through the account linked to the system, messages are created with several warnings programmed to keep the end-user informed about the operation of the irrigation system. Certain conditions must be met to send the tweet notifications, which are programmed using the React application in ThingSpeak.
The ThingSpeak’s React application allows the user to program the desired reactions based on the data received from the channels. Thus, if a certain condition is met, a MATLAB analysis code is executed, or a message is sent via Twitter. Two reactions were configured that launch a MATLAB analysis code execution and seven that generate the creation of messages via Twitter:
Maximum temperature. This reaction starts the execution of the MATLAB Analysis High Temperature Calculation code (
Figure 8) when the Irrigation Control System Channel Temperature field has a value greater than or equal to 30 °C for the first time.
Pump running. This reaction starts the execution of the MATLAB Analysis Pump Status code when the Pump Status field of the Irrigation Control System channel has a value equal to 1 (pump running).
Control of the irrigation system. In this reaction, the system checks every 30 min if the Irrigation Control System channel has not received any data during the last 60 min. If this condition is met, the application activates ThingTweet Irrigation System Control to publish the scheduled message: “Review system. It has been at least one hour without receiving any updates.”
Pump stopped. The system checks every 60 min if the Pump Analysis channel has not received any data during the last 20 h. Each time the condition is met, the application activates the ThingTweet Pump Stop setting to publish the scheduled message.
Pump does not stop. It tests every 60 min if the state of the pump is equal to 1 (pump running). If it does, it reacts by activating ThingTweet’s Non-Stop Pump that will post the scheduled Tweet “Check the pump. It has been running for too long.”
Soil moisture sensor warning. It checks every 60 min that the Soil Moisture Sensor field of the Irrigation Control System channel contains a value equal to 1 (sensor inactive). When this requirement is met, the soil moisture sensor warning of the ThingTweet application is executed, which in turn will send the corresponding message: “Check the soil moisture sensor. It takes too long to change its status.”
Rain warning. This reaction tests the Rain Sensor field of the Irrigation Control System channel every ten minutes to check if it has a value different than 0 (sensor active). When this requirement is met, the Rain Warning from the ThingTweet application is executed and the tweet “It’s raining” is sent.
Temp-Max notice. This reaction checks every 60 min if the temperature indicated in the temperature field in the Irrigation Control System channel is greater than or equal to 30 °C. When this condition is met for the first time on a day, the reaction triggers the notice to post the following message on Twitter: “The maximum environment temperature has reached 30 °C.”
Temp-min warning. With this reaction, it is checked every 60 min if the temperature is less than or equal to 10 °C. The reaction triggers the ThingTweet to post the Tweet “Ambient temperature less than 10 °C.”
5. Energy Efficiency
Energy management is another one of the key points of IoT agricultural projects, especially for those that are located in a large unwired area. The end devices that incorporate a full sensor suite must have energy autonomy. In other words, no external power is available to supply them with energy. In order to reach this target, three components are often needed: a renewable power source, an energy storage unit, and a charge/discharge control module to handle the battery operations.
To achieve a fairly efficient energy system, a set of LiPo batteries together with reduced-size solar panels were installed in every sensor node. Due to the complexity of the LiPo batteries, a specific controller is needed to manage the load of the battery. For this purpose, a LiPo Rider module was chosen.
In this way, we achieved good energy efficiency through a self-charging module that permits the sensor node to work autonomously for extended periods of time. This was achieved by using specific Arduino code and hardware configuration that help to reduce the base rate of energy consumption and a solar panel/battery tuple.
5.1. Nodes
The Arduino models analyzed for the prototyping were Arduino Mega ADK, Arduino Uno, and Arduino Nano. Each of these three mentioned models is composed of a microcontroller together with several other board elements. By studying different models, we aimed to accomplish two objectives. Firstly, we aimed to test the minimum required features regarding the number of sensors, inputs, and so on, and contextualize this with its economic potential. The second objective was about the energy consumption of these modules in each field of application.
In
Table 2, a visual comparison of different energy hardware and software setups shows the duration and consumption, giving an idea of which are the main key points about the energy consumption pattern in Arduino devices. It is important to note that these consumption values are based on an individual ATmega328P Microcontroller and Arduino Uno board, which also include the mentioned ATmega328P and, additionally, other on-board elements. Both of them were compared in idle state and using software energy-saving technics through Sleep modes.
A conclusion from
Table 2 is that some of the most important consumption problems are related to non-linked microcontroller elements. This information opens a potentially wide range of energy-related improvements that can be accomplished by reducing the number of non-essential elements included by default in Arduino boards. Eventually, this can help to create more energy-efficient nodes. Recapitulating, testing which is the minimum technical requirement allowed selecting the appropriate Arduino Board for each node function. Therefore this was an important point about energy improvement experimentation regarding the Arduino platform. Other component consumption, from sensors or ZigBee modules, will be presented in the following sections, but power consumption can be considered of marginal respect to Arduino module consumption.
5.2. Sensors
Regarding sensor energy consumption and different powering modes, it naturally depends on the nature and model of the sensors. However, this project seeks to establish a base to allow future development to specific agriculture applications. Due to this final target, specific sensor models are not a priority. Commonly, we use generic sensors to collect temperature, rain, or humidity measurements.
5.3. Communications
Another aspect for consideration is the one regarding the use of specific protocols for internal and external communications. The ZigBee protocol provides better adaptability to particular IoT or WSN needs, e.g., reducing energy consumption, packet size, simplified design of specific topologies, or network routing are some of the advantages. This makes the implementation much easier, robust, and secure.
Regarding the energy consumption, ZigBee protocol counts on parameters leveraging configuration parameters to achieve lower energy consumption, such as sleep modes. In
Table 3, XBee ZigBee power consumptions in several available modes are presented.
Another point regarding the protocols is QoS (Quality of Service), routing algorithm, and bandwidth organization. Finding a lighter protocol and its correct parameter and keeping the best network performance is not a trivial task.
5.4. Self-Charging System
Achieving a system that can efficiently provide sufficient energy is one of the main targets. Due to this fact, a more extensive experimentation process was conducted for this decision. Regarding both WSN and IoT projects, energy management is one of the most limiting issues to take care of. A solution can be functional and technically correct from a design perspective, but in real situations deployed in rural areas, these solutions must endure different environmental and operational affairs, working properly and for long periods of time. In order to reach this target, the proposed energy system can be split into three parts.
A set of photovoltaic solar panels (6 V 1 W) will provide the energy system with a renewable energy source. In the market, there are plenty of versions with different capacity, size, technology, and pricing. We tested several models for the sensor nodes, but since our choice was restricted by the cost-performance ratio, we eventually selected a standard photovoltaic panel.
Batteries are the ones allowing the deployed system’s prototype to continue operating during night hours. In the market, there are plenty of models and technologies regarding batteries. After evaluating the different alternatives, a LiPo battery was finally included. These batteries are currently the most frequently employed in a project such as, for example, radio-control planes or drones. These batteries are interesting for IoT projects due to their capacity and constant discharging rate. Regarding the negative points, two factors must be mentioned. The price of these batteries is not cheap, but it is still affordable. Perhaps, the most important disadvantage lies in the handling complexity.
Due to the previously mentioned complexity for using LiPo batteries, a third component is needed. A device must control the charge and discharge of the LiPo battery at all times. This is highly important because an incorrect setup or unbalanced charge in the design of these LiPo batteries could lead to malfunctioning or accidents. There are several of these controllers on the market. In this project, a LiPo Rider was chosen.
Taking into consideration the previously discussed power consumption of each system component, the whole device is able to work day and night autonomously. The system uses the LiPo battery during those periods of time when light is not available and a solar panel as a recharging element. Thus, the device can sustain extended periods of work without further energy support.
6. Conclusions
In this manuscript, we have introduced a low-cost, energy-efficient WSN system for smart irrigation. The system provides contributions not only related to energy- and cost-efficiency, but also regarding the data analysis done based on weather forecasts and sensor values. This analysis allows reducing the number of times that the pump is activated, which translates into water and energy savings. However, the system not only reduces water and energy consumption but also provides detailed information about the savings derived from its use and triggers automatic notifications.
From the design point of view, one of the most important factors to reduce the gap between a prototype model and a market-ready system is the economic cost. As mentioned in the introduction, one of the main targets of this project was to present an interesting and affordable solution for middle and small farming companies. With this idea in mind, several technical decisions have been made under these premises. Environmental sensors are among the most common and well-known sensors in the market. LiPo batteries are widely used in radio-control modeling. Furthermore, open hardware devices like Arduino are easy to obtain. These devices have a broad support community around with thousands of users, projects and tutorials. Additionally, this project is not only based on open hardware devices such as Arduino, but the final schemas and codes were also released as open hardware and software with the intention of creating a not-for-profit community around the system to ensure continuous evolution.
Finally, it is worth to mention that among the future lines of work, authors plan to evolve the electronic design towards a PCB to get cheaper devices in order to significantly reduce the total cost of the project. In addition, authors plan to perform in-field real energy-consumption measures to compare if the official information provided by the datasheets corresponds to the real ones.


 ,
, 


