Abstract
Under the background of rapid urbanization, the urban heat island (UHI) effect is becoming increasingly significant. It is very important for the sustainable development of cities to carry out quantitative research on the mitigation of the UHI effect at an urban scale. Taking Shenzhen as an example, this paper puts forward a method for building a cooling corridor for the city with multiscenarios based on the theory of ecological security pattern (ESP), which can realize quantitative planning of the spatial layout of urban green infrastructure (UGI) to alleviate the UHI effect. In this study, cooling sources are identified from the three dimensions of habitat quality, landscape connectivity, and the capacity to provide cooling ecosystem services. The cooling corridors that are superior at cooling, isolation, and ventilation are selected and optimized. The results show that the identified ecological cooling source area accounts for 33.18% of the total area of Shenzhen, and more than 85% of the area falls within the scope of the basic ecological control line of Shenzhen. There are 48 cooling corridors with a total length of 289.17 km in the cooling priority scenario, which mostly pass through the high-temperature and subhigh-temperature areas of each administrative region and city, providing a good cooling effect but poor feasibility. There are 48 corridors with a total length of 326.66 km in the isolation priority scenario, which mostly pass through the administrative region boundary and have a weak connection with the urban heat island, avoiding the built-up areas with strong human activities. As consequence, cooling is relatively achievable, but its effect is not ideal. There are 47 corridors with a total length of 368.06 km in the ventilation priority scenario, including many urban main roads and river systems that fully utilize the area’s strong natural wind conditions and realize various functions; however, the cooling effect is suboptimal. Corridors with great potential in cooling, isolation, ventilation, and noise reduction were determined after comprehensive optimization.
1. Introduction
Rapid urbanization transforms the natural and seminatural landscape into a landscape with impervious surfaces, which produces a series of environmental problems, including the urban heat island (UHI) effect [1]. The UHI is a phenomenon in which the urban temperature is higher than the suburban temperature because of the unbalanced energy flow in the process of urbanization [2,3]. The UHI effect not only increases the energy consumption of the city but also aggravates air pollution and endangers the health of residents [4]. Mitigating the UHI effect has become an important urban problem that needs to be solved immediately. In recent years, most relevant research has explored the ability of urban geometry, reflective surfaces, vegetation, water bodies, etc. to slow down the UHI effect [5]. Increasing the number of urban green spaces is one of the most effective ways to reduce the UHI effect [5,6] but is limited by urban space and the diversification of urban functional demands. On the other hand, the spatial patterns of urban green space will also significantly affect their mitigation effects on UHI [7,8,9,10]. However, there is a lack of research on the mitigation of UHI by reasonably planning the spatial patterns of urban green spaces. Therefore, the concept of green infrastructure (GI) is used in this study to realize urban green space planning to mitigate the UHI effect. GI is defined as a network of planned and nonplanned green spaces including all natural, seminatural, and artificial green spaces with multiple ecological functions in, around, or between urban areas [11,12]. UGI has been proven to be effective in regulating urban ecosystem services and improving the thermal environment [13,14,15]. To date, most studies on UGI to alleviate the UHI effect have focused on the community scale [16,17], and there have been some suggestions for increasing the presence of UGI at the city scale or planning for a single type of green space, such as urban parks [18,19]. Few studies have carried out quantitative research on the overall UGI spatial layout from the whole city’s perspective.
The ecological security pattern (ESP) is a potential landscape spatial pattern consisting of some key nodes, patches, and corridors and is of great significance to ensure the integrity of the ecosystem’s structure and function [20]. In a narrow sense, the ESP is an existing or potential ecological infrastructure [20]. Generally, the basic method of identifying the source, setting the resistance surface, and extracting the corridor is used to build the ESP [20]. The ecological source is an important element in the ecological process, and the ecological corridor is the carrier of ecological flow, which is able to become UGI through construction and maintenance [21]. The corridor connecting the source areas enables the ecological flow between important ecological sources to be realized at a minimum cost [22]. By identifying the important sources that can provide good cooling services and extracting the cooling corridors, an ESP with cooling as its ecological target can be constructed at the city scale. On the one hand, a cooling corridor will ensure the connectivity and integrity of urban cooling functions. On the other hand, corridors with green spaces or UGI as their main backgrounds are not only able to lower their own temperatures and that of their surrounding areas but can also isolate and ventilate the heat island. Therefore, UGI planning and construction aimed at alleviating UHI can be realized by identifying the cooling corridor at the urban scale.
This study increases the scale of UGI planning to alleviate the UHI effect from the microscale to the urban scale, and a method is proposed for constructing urban cooling corridors based on an ESP for Shenzhen city, which has high temperature risk and was selected for the case study. In this paper, the service capacity of the cooling ecosystem, habitat quality, and landscape connectivity are considered comprehensively to identify the cooling sources. Then, the cooling priority scenario, isolation priority scenario, and ventilation priority scenario are established, and the urban cooling corridors with different functions are identified. Finally, the corridors are compared and comprehensively optimized.
2. Study Area and Data Sources
Shenzhen (113°46’ E–114°37’ E, 22°27’ N–22°52’ N), located in the south of Guangdong Province, is one of the core cities of the Guangdong-Hong Kong-Macao Greater Bay Area. Since the establishment of the special economic zones in 1979, Shenzhen has witnessed rapid development. It has successively established eight administrative zones and two new functional zones, covering an area of approximately 1997.27 km2 (Figure 1). Shenzhen is a typical highly urbanized area. The land in the city has been converted into state-owned land, and the urbanization rate is 100%. Based on a survey of the land change in Shenzhen in 2016, it was observed that the proportion of construction land area to the total area was 43.37%. Shenzhen has a subtropical oceanic monsoon climate with high-temperature summers and warm winters. The average annual temperature is 22.4 °C. Since the 1980s, when Shenzhen entered a period of rapid urban expansion and steady development, 19, 28, 15, and 25 extreme heat days were experienced in 1989, 1990, 2000, and 2004, respectively, with the ongoing threat of heat waves [23].
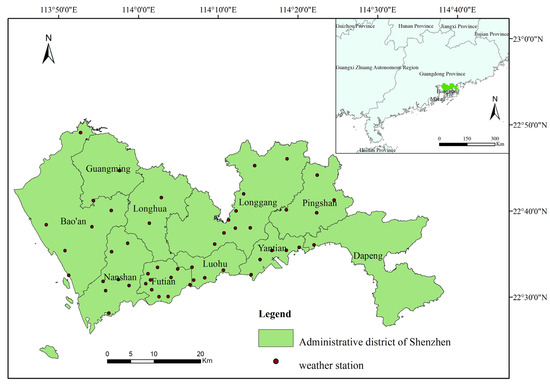
Figure 1.
Geographic location of Shenzhen.
In this paper, Landsat remote sensing data with a medium spatial resolution (30 m) were used to retrieve the urban surface temperature. The OLI and TIRS data from the geospatial data clouds (http://www.gscloud.cn/) of two Landsat 8 images were selected: image 1 (122/44) 18 September 2016 and image 2 (121/44) 27 September 2016. Remote sensing images were selected based on three major requirements: less cloud influence, close time, and complete coverage of the study area. After organizing the Landsat data for 2016, we found that only two of the selected images met the requirements of less cloud influence (11.88% and 0.52%, respectively), and their times were close. Most of the others had no data or their cloud coverage was as high as 50%, which seriously affected the data quality. Although September is not the time of the year with the highest daily UHI intensity for Shenzhen, the daytime temperatures during this period are still very high and close to those during summer, given the climate characteristics of Shenzhen. In addition, the images at 2:00 p.m. (with the highest temperature during the day) were selected, which were relatively representative and able to reduce most of the errors to some degree. The data used in the study also include the temperature, wind speed, and wind direction with a 5 min granularity taken from 51 stations of the Shenzhen Meteorological Bureau in 2016, along with vector data of the basic ecological control line range defined by the City Planning Commission of Shenzhen in 2005, building census data from the Committee of Planning and Land Resources of Shenzhen in 2015, data from the land change surveys, and basic information, such as the political boundaries and road network of Shenzhen in 2016.
3. Method
3.1. Identifying Cooling Sources
Cooling sources are patches that can provide important cooling ecosystem services. Good habitat quality and important landscape connectivity are also needed [24]. In this study, the cooling sources were identified after comprehensively considering three dimensions: the service capacity of the cooling ecosystem, habitat quality, and landscape connectivity.
The two remote sensing images were preprocessed by geometric correction, radiometric calibration, atmospheric correction, mosaics, and clipping, and then, the surface temperature data were obtained from the preprocessed images with the Monowindow Algorithm. The specific emissivity of different ground objects was directly used to transfer the pixel brightness temperatures to the LST in this method [25]. The formula is as follows:
where TS is the surface temperature (K), TB is the brightness temperature, λ is the emission wavelength, the OLI/TIRS of Landsat 8 is 10.9 μm, σ is the Boltzmann constant (1.38 × 10 − 23 J/K), c is the velocity of light (2.998 × 10⁸ m/s), h is the Planck constant (6.626 × 10 − 34 Js), and ε is the surface emissivity [26].
The calculation method for surface emissivity based on image classification was selected, and the research area was divided into the water body, natural surface (cultivated land, forest land, grassland, etc.), urban surface (buildings, roads, etc.), and bare soil using supervised classification. Since most of the pixels in the study area were mixed pixels, the surface emissivity value was obtained according to the calculation method of the surface emissivity of mixed pixels proposed by Qin et al. in 2004 [27].
where εN, εU, and εBS are the surface emissivity of the natural surface, urban surface, and bare soil surface, respectively; Pv is vegetation coverage; RV, RB, and RS are the temperature ratios of vegetation, buildings, and bare soil, respectively; and εv, εS, and εB are the surface emissivity of pure pixels of vegetation, bare soil, and buildings, respectively. dε can be simply estimated according to the proportion of vegetation:
Vegetation coverage (Pv) can be estimated by dimidiate pixel model (DPM) as follows:
where NDVI is the normalized vegetation index, NDVIS is the NDVI value of the area without vegetation coverage, and NDVIV is the NDVI value of the pixels completely covered by vegetation.
The temperature ratio Ri is related to the vegetation coverage and can be estimated by the following formula:
where RV, RB, and RS are the temperature ratios of vegetation, buildings, and bare soil, respectively.
Then, the invariant target method was used to match a histogram of the overlapping regions of the two images to obtain the surface temperature distribution map of Shenzhen. The accuracy of the inversion result of the surface temperature was verified by the air temperature data of 18 September 2016 at 2:50 p.m. from meteorological station. The monitoring time of the meteorological station data used was the same as that of the remote sensing image acquired, which ensured time consistency. Afterwards, the research area was divided into a low-temperature zone (0–25.38 °C), a sublow-temperature zone (25.38–27.86 °C), a subhigh-temperature zone (27.86–30.34 °C), and a high-temperature zone (30.34–39.57 °C) by taking the minimum value, the average temperature minus one standard deviation, the average temperature, the average temperature plus one standard deviation, and the maximum value as the boundary points [28]. The low-temperature zone and sublow-temperature zone were considered to be capable of better providing cooling ecosystem services, and the temperature value of the region was standardized according to the following equation to obtain the distribution of the cooling capacity of low-temperature patches in Shenzhen:
where Tnor is the normalized cooling capacity, Ti is the temperature value of the pixel i, and Tmin and Tmax are, respectively, the minimum and maximum LST values of Shenzhen.
Habitat quality: The habitat quality was evaluated based on the Integrated Valuation of Ecosystem Services and Trade-offs (InVEST) model. In the model, the habitat quality is mainly affected by four factors: the relative influential ability of stress factors, the sensitivity of the habitat to stress factors, the distance between grid units and sources of stress factors, and the degree of legal protection of a land unit. We assumed that the legal protection of land would be effective when considering only the three other factors. The habitat suitability of different land use types was normalized by the biodiversity value equivalents of the ecosystem services value based on the per unit area revised by Xie (2015) [29]. According to the existing research results and the characteristics of the study area, the important stress factors were selected and the relevant parameters were set.
Landscape connectivity: The representative index of the landscape connectivity analysis is the probability of connectivity (PC). However, the PC index represents the overall connectivity of the landscape, and it was necessary to analyze the importance of individual patches in the landscape; thus, the dPC index was used [24]. In total, 1837 pieces of ecological land with an area larger than 0.1 Km2 were used as habitat patches to analyze the connectivity, and the results were normalized to obtain the importance distribution map of ecological landscape connectivity in Shenzhen.
Finally, the cooling capacity distribution map of low-temperature patches, the habitat quality distribution map, and the connectivity of the landscape distribution map were superimposed as one with equal weight, and five grades were divided by the natural discontinuity method: the most important patch, the second-most important patch, the important patch, the generally important patch, and the unimportant patch, with the first three grades selected as the cooling sources.
3.2. Setting up the Resistance Surfaces in Different Scenarios
The minimum cumulative resistance (MCR) model is the most commonly used method to identify corridors. It measures the cost of moving from source to destination and reflects the potential development trend and possibilities [22]. The equation is as follows:
where MCR is the minimum cumulative resistance, Dij is the space distance from source J to destination i, Ri is the resistance coefficient of the resistance surface against movement, and f is the positive correlation between MCR and the ecological process.
Generally, corridors have the two functions of connection and isolation. In addition, the corridor itself is existing or potential ecological land, which can engage in the functions of cooling, ventilating, and beautifying the city. Three different scenarios for the resistance surface are constructed in this paper, focusing on achieving cooling, isolation, and ventilation, respectively. The cooling priority scenario makes the cooling corridors pass through the heat island area as much as possible, regardless of the construction cost, to maximize the dispersion of the UHI. In addition, the closer the green space is to the center of heat island and the higher the background temperatures are, the more significant the cooling effect is [30]. Accordingly, the temperature is taken as the basic resistance surface in this scenario. The higher the temperature is, the smaller the resistance is, so the corridor with the highest temperature and the best cooling effect can be identified. Isolation priority scenario: The agglomeration development mode in Shenzhen leads to multiple heat island clusters. Generally, the weak connection of these UHI clusters can be found in an area of low development intensity, a low density of construction land, and a small resistance of the construction corridor. Therefore, this scenario has strong operability. From a macroperspective of separating UHI clusters, isolating the connection and preventing the aggregation of UHI clusters, the lower the temperature is, the smaller the resistance becomes. Thus, the low-cost cooling corridor can be identified by increasing the resistance of the construction land. The ventilation priority scenario takes the ventilation effect of the cooling corridor into consideration from a more microperspective and makes full use of the good natural wind conditions of the existing main roads and river systems. Considering a lower temperature and smaller resistance, corridors with a good ventilation effect can be identified by reducing the resistance of roads and rivers.
3.3. Identifying and Classifying Cooling Corridors
The geometric center of the important cooling sources was extracted as the cooling node, and the MCR model was adopted. Based on the basic resistance surfaces of different scenarios, the cooling corridors of MCR were identified by taking each ecological node as the starting point and the remaining “n−1” (n is the total number of nodes) as the target point group. Then, based on the remaining nodes that were not connected to the cooling corridor network, the sub-MCR cooling corridors were identified to complete the extraction work in the whole research area.
To formulate more relevant management strategies, the corridors are also classified. Because the cooling priority scenario does not consider factors other than cooling (which is an ideal state that is not in conformity with the urban development plan and has poor operability), these corridors are not classified accordingly. In the isolation priority scenario, good natural wind is more conducive to air circulation and better at alleviating the UHI effect. Therefore, the corridors that are parallel to the prevailing wind direction in summer and located in key positions cutting off the UHI are the first-class corridors, while the rest are second-class corridors. The rose-colored wind direction and wind speed diagram was drawn based on the meteorological data from Shenzhen to distinguish the prevailing wind directions in summer. From a micro perspective of urban wind corridors, the ventilation priority scenarios consider two factors that could affect the ventilation effect in terms of the prevailing wind direction and heights of buildings around the corridors. Taking the cooling corridors as the center, the average heights of buildings in the buffer zones of 25, 50, and 100 m are counted and weighted as 3, 2, and 1, respectively. The weighted average value is then calculated, and whether the height is greater than 10 m is taken as the evaluation criterion to judge whether the ventilation effects will be hindered.
4. Results
4.1. Cooling Sources
The accuracy of the surface temperature data is verified, demonstrating that the average error between the surface temperature data and the monitoring data of the meteorological stations is only 1.77 °C, which indicates that the surface temperature data can better reflect the ability of the patches to provide cooling services. We also sought to explore the spatial variability of air temperature data from the meteorological stations and judge whether it is consistent with that of LST. However, the difference between the highest temperature (27.7 °C) and the lowest temperature (23.6 °C) among the 51 meteorological stations is only 4.1 °C. Since most of the meteorological stations in Shenzhen are located in parks and other areas with rich urban vegetation, the air temperature is relatively low. The stations are clearly mostly located in subhigh-temperature areas or low-temperature areas, as shown in Figure 2. In addition, the meteorological stations are distributed unevenly. Accordingly, the air temperature data from meteorological stations cannot accurately reflect the spatial variability of the urban temperature or UHI distribution. As consequence, meteorological station data were used only to verify the calculation results of the LST data to some extent. The meteorological station data were divided into three intervals of higher than 26.4 °C, 25–26.4 °C, and lower than 25 °C, and their distribution was observed and summarized accordingly. Most of the stations with air temperatures higher than 26.4 °C were surrounded by high-temperature areas or subhigh-temperature areas, and most of the stations with air temperatures lower than 25 °C were surrounded by low-temperature areas. The stations with air temperatures ranging from 25 to 26.4 °C are mostly located in the transition zone between the low-temperature area and high-temperature or subhigh-temperature areas. On this basis, the spatial distribution of air temperature is relatively consistent with that of the LST data.
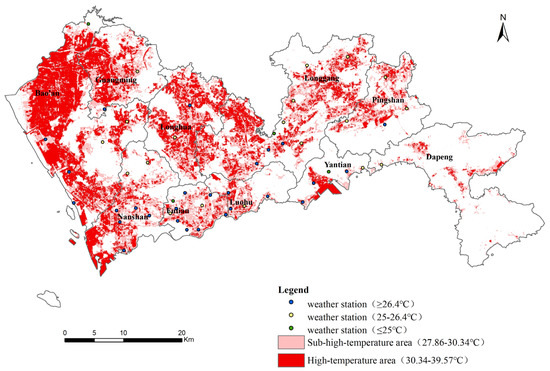
Figure 2.
Spatial distribution of air temperature and land surface temperature.
Studies on UHI phenomenon were initially realized using meteorological observation data. However, due to the small number and uneven distribution of meteorological stations, the obtained data are scattered in the form of dots, which greatly limits research on the spatial distribution and internal structures of UHI. With the progress of science and technology, a variety of remote sensing methods have been discovered to study the UHI effect, thus supplementing the deficiencies of meteorological station data. Thermal infrared remote sensing is an indirect method of temperature measurement and represents the ability of the surface to radiate infrared light. The temperature data measured by thermal infrared remote sensing provide the land surface radiation temperature. Compared to the atmospheric temperature data, the LST data are continuous and uniform and can be used to analyze the spatial distribution trends on an urban scale. Furthermore, the atmospheric temperature is closely related to the LST and can be estimated by remote sensing data. During the daytime, the relationship between the LST and air temperature is determined by the surface energy balance system. Accordingly, it is difficult to estimate the air temperature from the LST when not all the main variables are captured by the spectrometer of the sensor. However, it is worth noting that although it is impossible to infer the air temperature directly from the statistical relationship between the LST and atmospheric temperature, their spatial distribution trends are similar. In conclusion, it is reasonable to identify cooling corridors using LST data, which show a spatial distribution trend consistent with the air temperature data of meteorological stations at the same time scale.
The area of the cooling sources accounts for 33.18% of the total area of Shenzhen (Figure 3). These sources are mainly distributed in forests and parks with abundant vegetation resources, in reservoirs as water source protection areas, and in coastal intertidal zones. The most important patches are mainly distributed in Paiya Mountain and Qiniang Mountain in the east of Shenzhen. Most of these areas retain the vegetation characteristics of subtropical evergreen broad-leaved forest or monsoon rain forest areas with abundant vegetation resources. The patches of secondary importance present a scattered distribution, mainly in Wutong Mountain and Malan Mountain in the east, and also provide rich vegetation resources. The second-most important patches in the west are mainly distributed in the Yangtai Mountain, Shiyan Reservoir, Tiegang Reservoir, Xili Reservoir, Shenzhen Reservoir, and coastal intertidal zones. The commonly important patches are also scattered, mainly in Nanshan Park, Tanglang Mountain Park, and the surrounding areas of the most important and second-most important patches. By overlapping the cooling sources and the basic ecological control line of Shenzhen, it can be concluded that more than 85% of the area of the cooling sources falls into the basic ecological control line. On the one hand, this confirms the rationality and effectiveness of the method for extracting cooling sources. On the other hand, this result also indicates that most of the important cooling sources can be effectively protected.
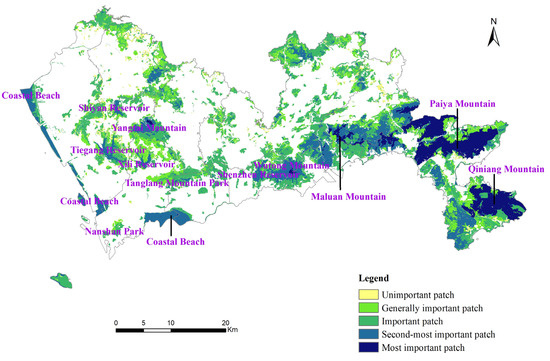
Figure 3.
Spatial distribution of the cooling sources in Shenzhen.
4.2. Cooling Corridors in Different Scenarios
Forty-eight cooling corridors with a total length of 289.17 km are provided in the cooling priority scenario (Figure 4). In this scenario, the cooling corridors mostly pass through the interior of the administrative districts and directly pass through the high-temperature areas and subhigh-temperature areas. The corridor can fully disperse the UHI clusters and maximize its cooling effects, but the corridor mostly passes through the urban built-up area directly and has poor operability.
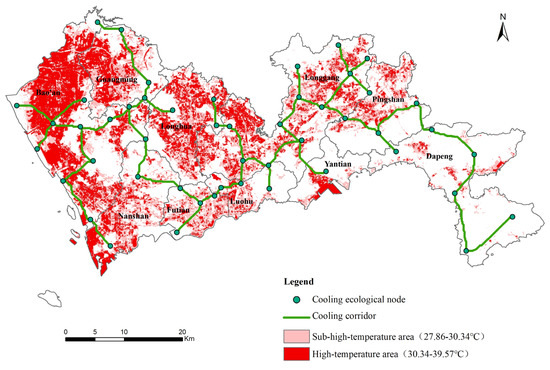
Figure 4.
Cooling corridors in the cooling priority scenario.
Forty-eight cooling corridors with a total length of 326.66 km were obtained in the isolation priority scenario (Figure 5). In this scenario, corridors pass through the weak connection of the UHI groups and are mostly located at the boundaries of administrative districts. The rose-colored diagram of wind direction and speed shows the prevailing southerly wind in Shenzhen in the summer. The corridors that are parallel to the prevailing wind direction and are located at an important position for the isolating heat island group are classified as first-class corridors, while the rest are second-class corridors. In the process of urban construction, the focus should be on the construction of first-class corridors and controlling the heights of buildings around them to ensure air circulation.
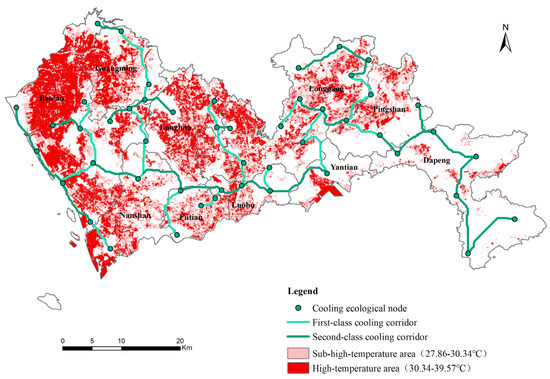
Figure 5.
Cooling corridors in the isolation priority scenario.
Forty-seven cooling corridors with a total length of 368.06 km were identified in the ventilation priority scenario (Figure 6). Compared with the isolation priority scenario, more corridors directly pass through the interior of the administrative districts in the ventilation priority scenario. This is because parts of the main roads and river systems are included in the corridors and pass through the interior of the administrative districts. According to the difference of the ventilation effect, the corridors are divided into four classes.
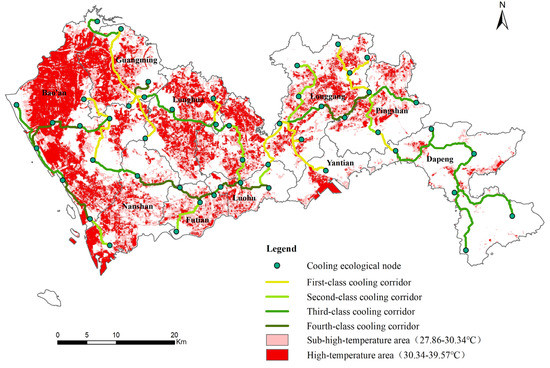
Figure 6.
Cooling corridors in the ventilation priority scenario.
The direction of the first-class corridor is consistent with the prevailing wind direction, and the heights of the buildings in the buffer zone around the corridor are less than 10 m, which can fully strengthen urban internal ventilation and alleviate the UHI effect. Thus, the first-class corridors should receive the most attention. The direction of the second-class corridor is consistent with that of the prevailing wind, but the heights of the surrounding buildings are greater than 10 m. The ventilation effect of the second-class corridor is good, but the heights of surrounding buildings should be controlled. The direction of the third-class cooling corridor is not parallel to the prevailing wind, but the heights of the surrounding buildings are less than 10 m. As a consequence, the spatial configuration of the surrounding buildings should be changed. The fourth-class cooling corridor is not parallel to the prevailing wind, and the heights of the surrounding buildings are greater than 10 m with a poor ventilation effect.
The results of sensitivity analysis are shown in the Appendix A.
4.3. Comparison and Optimization of Cooling Corridors
Next, we compare the corridors in the three scenarios (Table 1). The total length of the corridors increases from the cooling priority scenario to the isolation priority scenario and, further, to the ventilation priority scenario. In the cooling priority scenario, the maximum cooling effect is only considered where the average temperature of the path area is the highest with the best cooling effect. However, the corridors pass through the area with the largest building volume, causing significant resistance from construction and a poor ventilation effect. The corridors in the isolation priority scenario avoid the built-up areas with significant human activity. The building volume along the corridors is the smallest, with a high feasibility of construction and a good ventilation effect, but the average temperature of the path area is low, and the cooling effect is not ideal. From the perspective of urban wind corridors, we make full use of natural wind conditions and the existing main roads, rivers, waters, and other resources in the ventilation priority scenario. These corridors can not only achieve cooling and ventilation but also play a role in protecting water sources, dampening noise on both sides of the road, and other functions. Similar to the isolation scenario, the temperature of the path area is low, and the cooling effect is not ideal.

Table 1.
Comparison of the cooling corridors in the three different scenarios.
To maximize the comprehensive benefits of the corridor, the corridors in the 3 scenarios were optimized in several steps (Table 2), and 49 corridors with a total length of 353.11 km were obtained (Figure 7). Most of these corridors directly pass through the high-temperature area or are located in key positions for isolating the heat island clusters, allowing them to better alleviate the UHI effect and eliminate the corridors that are difficult to construct and develop with higher operability.
Table 2.
Optimized operations of the corridor.
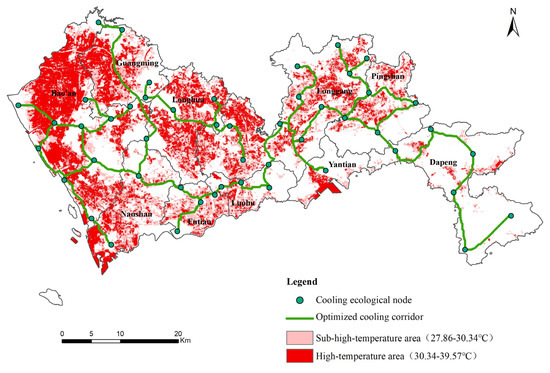
Figure 7.
Optimized cooling corridors.
5. Discussion
Based on the ESP method, this study established three different scenarios and constructed an urban cooling corridor focusing on different functions, to comprehensively optimize the recognition results of different scenarios and thus realize the urban scale planning of UGI to alleviate UHI effect. The potential of an optimized cooling corridor in cooling, isolation, ventilation, and noise reduction was analyzed. According to the results, the corridor with a length of 145.86 km (41.31%) passes through the high-temperature area and subhigh-temperature area, which suggests that the optimized corridor is good at separating UHI and cooling. For isolation, two commonly used landscape fragmentation indexes were selected to evaluate the degree of fragmentation of UHI before and after corridor construction. The Patch Density (PD) Index is the number of patches per unit area. The larger the value is, the stronger the fragmentation of the landscape becomes [31]. The Aggregation Index (AI) reflects the degree of aggregation for different types of patches, which can reveal the spatial information of landscape types, the smaller the value is, the stronger the fragmentation is [9]. The PD increases from 2.71 to 2.81, and the AI decreases from 95.19 to 94.93, after the construction of the corridor, indicating that the corridor has potential for isolation. The lengths of the corridors parallel to the prevailing wind direction with surrounding buildings less than 10 m in height are 206.64 km (58.24%) and 225.94 km (63.98%), respectively, indicating that the corridor is also good at ventilation. In addition, there are 23 corridors passing through the 50 m buffer zone of the city’s main roads, which have the potential to reduce road noise.
Considering the current situation of the environment and the requirements for planning and development in Shenzhen, the key cooling landscape components, such as existing cooling sources, should be managed and protected effectively. Cooling sources and corridors should be reserved in the process of development and construction to effectively protect the stability and sustainability of the urban ecosystem. In addition, the construction and maintenance of UGI along the key corridors should be increased with the addition of green or blue cooling infrastructure, such as artificial greenways and artificial lakes. Building green roofs, green pavement, green facades, and vertical greening systems at key locations where it is not convenient to change the land type has also been suggested [32]. For key corridors with good ventilation conditions, such as the first-class corridors in the isolation priority scenario and the first-class and the second-class corridors in the ventilation priority scenario, it is also necessary to strictly control the height of the surrounding buildings and construct a parallel green buffer zone to promote the ventilation effect and better alleviate the UHI effect.
Based on the ESP method, this paper realized the construction and optimization of cooling corridors in different scenarios, which will have great significance for planning and constructing UGI to alleviate the UHI effect. However, the establishment of the resistance surface in this paper was relatively simple due to the limitations of data acquisition and technology, only considering the temperature, construction land, roads, river system, and other common factors, all of which could be developed into a more comprehensive study. A more elaborate construction of cooling ecological patterns that relies on more detailed geospatial data and UGI planning to alleviate the UHI effect needs to be further explored. A comprehensive ESP that combines the ecological corridor and ecosystem service functions of the UGI in biodiversity protection, rainwater management, and other aspects also deserves further attention. In addition, with the rise of urban agglomerations and the Greater Bay Area, along with other economic regions, it is also of great significance to carry out UGI planning at the scale of urban agglomerations to alleviate the UHI effect and ensure ecological security. Finally, the evaluation and verification of the results of constructing ESP is a relatively deficient field at present. In the future, field measurements or scenario simulation experiments can be carried out to evaluate the effectiveness and uncertainty of the results.
6. Conclusions
This study identified the cooling sources and constructed cooling corridors under different scenarios and completed its optimization in Shenzhen based on the theory of ESP to plan the spatial layout of UGI at the city scale to better alleviate the UHI effect and to realize quantitative research on UHI mitigation at the urban scale, which is of great theoretical and practical significance. The results show that most of the cooling sources fall within the basic control line of Shenzhen, which is mainly distributed in forests and parks with abundant vegetation resources, reservoirs as water source protection areas, and large coastal intertidal zones.
There are significant differences in spatial distribution and functions of the corridors under the three different scenarios. Most of the corridors in the cooling priority scenario pass through the inner part of each administrative district and the urban high-temperature and subhigh-temperature areas with a good cooling effect but poor feasibility. The corridors in the isolation priority scenario pass through the administrative region boundary and the weak connection among the UHI clusters, avoiding the built-up areas with strong human activities, which is highly achievable, although the cooling effect is not ideal. Most of the corridors in the ventilation priority scenario are incorporated into the urban main roads and river systems, which makes full use of the good natural wind conditions and diversified functions, but the cooling effect is not fully realized. After optimizing the corridors in the three scenarios, a new corridor system with potential in cooling, isolation, ventilation, and other functions was obtained.
Author Contributions
J.W. provides research direction and research ideas, N.S. conducts preliminary data processing, S.L. completes result analysis and paper writing, Y.Z. reviews the paper, and H.C. provides data and technical support. All authors have read and agreed to the published version of the manuscript.
Funding
Programs of Science and Technology of Shenzhen: JCYJ20170412150910443; National Key Research and Development Program of China: 2019YFB2102000; National Natural Science Foundation of China: 41671180.
Conflicts of Interest
We declare that we have no financial and personal relationships with other people or organizations that can inappropriately influence our work, there is no professional or other personal interest of any nature or kind in any product, service and/or company that could be construed as influencing the position presented in, or the review of, the manuscript entitled, “Construction of Cooling Corridors with Multiscenarios on Urban Scale: A Case Study of Shenzhen”.
Appendix A. Sensitivity Analysis
The sensitivity analysis of the model under the isolation and ventilation priority scenario was carried out as a supplement. Under the isolation priority scenario, the cooling corridors are identified by setting up the resistance surface with resistance values of +0, +1, +2, and +4 for the construction land and keeping the other conditions unchanged. The results are shown in Figure A1 and Figure A2. Ultimately, the identified cooling corridors are similar under the three scenarios of increasing the resistance of the construction land. However, there is a large difference between the results of the cooling corridor identified with no increase in construction land resistance and the others. The specific performance is as follows. The scenario with an increase in construction land resistance can best avoid construction land and reduce development costs. Conversely, the cooling corridors can avoid most of the high-temperature and subhigh-temperature areas of the city with a worse cooling effect under the condition of no additional construction land resistance. Accordingly, the corridors with strong operability and a good cooling effect can be better identified by combining the two factors of temperature and construction land resistance.

Figure A1.
Results of the sensitivity analysis under the isolation priority scenario with temperature.

Figure A2.
Results of sensitivity analysis under the isolation priority scenario with construction land.
Under the ventilation priority scenario, the cooling corridors are identified by setting up the resistance surface with a resistance value of −0, −1, −2, and −4, respectively, for the roads and water bodies, while keeping the other conditions unchanged. The results are shown in Figure A3 and Figure A4. Compared with the case of a constant resistance of the roads and water bodies, the identified cooling corridors are more likely to pass through the high-temperature area of the city to reduce road resistance. Additionally, the natural wind from the roads and water system strengthens the internal ventilation of the city, which better alleviates the UHI effect. Accordingly, it is of great significance to reduce the resistance of the road and water bodies to identify the corridors under the ventilation priority scenario.

Figure A3.
Results of the sensitivity analysis under the ventilation priority scenario with temperature.

Figure A4.
Results of the sensitivity analysis under the ventilation priority scenario with roads and rivers.
References
- Li, J.; Song, C.; Cao, L.u.; Zhu, F.; Meng, X.; Wu, J. Impacts of landscape structure on surface urban heat islands: A case study of Shanghai, China. Remote Sens. Environ. 2011, 115, 3249–3263. [Google Scholar] [CrossRef]
- Voogt, J.A.; Oke, T.R. Thermal remote sensing of urban climates. Remote Sens. Environ. 2003, 86, 370–384. [Google Scholar] [CrossRef]
- Mirzaei, P.A. Recent challenges in modeling of urban heat island. Sustain. Cities Soc. 2015, 19, 200–206. [Google Scholar] [CrossRef]
- Wong, K.V.; Paddon, A.; Jimenez, A. Review of World Urban Heat Islands: Many Linked to Increased Mortality. J. Energy Resour. Technol. -Trans. ASME 2013, 135, 022101. [Google Scholar] [CrossRef]
- Lai, D.; Liu, W.; Gan, T.; Liu, K.; Chen, Q. A review of mitigating strategies to improve the thermal environment and thermal comfort in urban outdoor spaces. Sci. Total Environ. 2019, 661, 337–353. [Google Scholar] [CrossRef]
- Emmanuel, R.; Loconsole, A. Green infrastructure as an adaptation approach to tackling urban overheating in the Glasgow Clyde Valley Region, UK. Landsc. Urban Plan. 2015, 138, 71–86. [Google Scholar] [CrossRef]
- Li, X.; Zhou, W.; Ouyang, Z.; Xu, W.; Zheng, H. Spatial pattern of greenspace affects land surface temperature: Evidence from the heavily urbanized Beijing metropolitan area, China. Landsc. Ecol. 2012, 27, 887–898. [Google Scholar] [CrossRef]
- Maimaitiyiming, M.; Ghulam, A.; Tiyip, T.; Pla, F.; Latorre-Carmona, P.; Halik, Ü.; Sawut, M.; Caetano, M. Effects of green space spatial pattern on land surface temperature: Implications for sustainable urban planning and climate change adaptation. J. Photogramm. Remote Sens. 2014, 89, 59–66. [Google Scholar] [CrossRef]
- Estoque, R.C.; Murayama, Y.; Myint, S.W. Effects of landscape composition and pattern on land surface temperature: An urban heat island study in the megacities of Southeast Asia. Sci. Total Environ. 2017, 577, 349. [Google Scholar] [CrossRef]
- Amani-Beni, M.; Zhang, B.; Xie, G.D.; Shi, Y.T. Impacts of Urban Green Landscape Patterns on Land Surface Temperature: Evidence from the Adjacent Area of Olympic Forest Park of Beijing, China. Sustainability 2019, 11, 513. [Google Scholar] [CrossRef]
- Tzoulas, K.; Korpela, K.; Venn, S.; Yli-Pelkonen, V.; Ka´zmierczak, A.; Niemela, J.; James, P. Promoting ecosystem and human health in urban areas using Green Infrastructure: A literature review. Landsc. Urban Plan. 2007, 81, 167–178. [Google Scholar] [CrossRef]
- Norton, B.A.; Coutts, A.M.; Livesley, S.J.; Harris, R.J.; Hunter, A.M.; Williams, N.S.G. Planning for cooler cities: A framework to prioritise green infrastructure to mitigate high temperatures in urban landscapes. Landsc. Urban Plan. 2015, 134, 127–138. [Google Scholar] [CrossRef]
- Bowler, D.E.; Buyung-Ali, L.; Knight, T.M.; Pullin, A.S. Urban greening to cool towns and cities: A systematic review of the empirical evidence. Landsc. Urban Plan. 2010, 97, 147–155. [Google Scholar] [CrossRef]
- Akbari, H.; Kolokotsa, D. Three decades of urban heat islands and mitigation technologies research. Energy Build. 2016, 133, 834–842. [Google Scholar] [CrossRef]
- Maiolo, M.; Pirouz, B.; Bruno, R.; Palermo, S.A.; Arcuri, N.; Piro, P. The Role of the Extensive Green Roofs on Decreasing Building Energy Consumption in the Mediterranean Climate. Sustainability 2020, 12, 359. [Google Scholar] [CrossRef]
- Berardi, U. The outdoor microclimate benefits and energy saving resulting from green roofs retrofits. Energy Build. 2016, 121, 217–229. [Google Scholar] [CrossRef]
- Salata, F.; Golasi, I.; Petitti, D.; Vollaro, E.L.; Coppi, M.; Vollaro, A.L. Relating microclimate, human thermal comfort and health duringheat waves: An analysis of heat island mitigation strategies through a case study in an urban outdoor environment. Sustain. Cities Soc. 2017, 30, 79–96. [Google Scholar] [CrossRef]
- Brown, R.D.; Vanos, J.; Kenny, N.; Lenzholzer, S. Designing urban parks that ameliorate the effects of climate change. Landsc. Urban Plan. 2015, 138, 118–131. [Google Scholar] [CrossRef]
- Imran, H.M.; Kala, J.; Ng, A.W.M.; Muthukumaran, S. Effectiveness of vegetated patches as Green Infrastructure in mitigating Urban Heat Island effects during a heatwave event in the city of Melbourne. Weather Clim. Extrem. 2019, 25, 100217. [Google Scholar] [CrossRef]
- Yu, K. Security patterns and surface model in landscape ecological planning. Landsc. Urban Plan. 1996, 36, 1–17. [Google Scholar] [CrossRef]
- Xu, J.; Fan, F.; Liu, Y.a.n.; Dong, J.; Chen, J. Construction of Ecological Security Patterns in Nature Reserves Based on Ecosystem Services and Circuit Theory: A Case Study in Wenchuan, China. Int. J. Environ. Res. Public Health 2019, 16, 3220. [Google Scholar] [CrossRef]
- Peng, J.; Pan, Y.; Liu, Y.; Zhao, H.; Wang, Y. Linking ecological degradation risk to identify ecological security patterns in a rapidly urbanizing landscape. Habitat Int. 2018, 71, 110–124. [Google Scholar] [CrossRef]
- Liu, Y.; Li, S.; Wang, Y.; Zhang, T.; Peng, J.; Li, T. Identification of multiple climatic extremes in metropolis: A comparison of Guangzhou and Shenzhen, China. Nat. Hazards 2015, 79, 939–953. [Google Scholar] [CrossRef]
- Wu, J.S.; Zhang, L.Q.; Peng, J.; Feng, Z.; Liu, H.M.; He, S.B. The integrated recognition of the source area of the urban ecological security pattern in Shenzhen. Acta Ecol. Sin. 2013, 331, 4125–4133. (In Chinese) [Google Scholar] [CrossRef]
- Artis, D.A.; Carnahan, W.H. Survey of emissivity variability in thermography of urban areas. Remote Sens. Environ. 1982, 12, 313–329. [Google Scholar] [CrossRef]
- Dissanayake, D.M.S.L.B. Land Use Change and Its Impacts on Land Surface Temperature in Galle City, Sri Lanka. Climate 2020, 8, 65. [Google Scholar] [CrossRef]
- Qin, Z.; Li, W.; Xu, B.; Chen, Z.; Liu, J. The Estimation of Land Surface Emissivity for Landsat TM6. Remote Sens. Land Resour. 2004. (in Chinese) [CrossRef]
- Chen, Y.; Yu, S. Impacts of urban landscape patterns on urban thermal variations in Guangzhou, China. Int. J. Appl. Earth Obs. Geo Inf. 2017, 54, 65–71. [Google Scholar] [CrossRef]
- Xie, G.; Zhang, C.; Zhang, L.; Chen, W.; Li, S. Improvement of the Evaluation Method for Ecosystem Service Value Based on Per Unit Area. J. Nat. Resour. 2015, 30, 1243–1254. (in Chinese) [Google Scholar] [CrossRef]
- Shashua-Bar, L.; Hoffman, M.E. Vegetation as a climatic component in the design of an urban street: An empirical model for predicting the cooling effect of urban green areas with trees. Energy Build. 2000, 31, 221–235. [Google Scholar] [CrossRef]
- Uuemaa, E.; Roosaare, J.; Mande, Ü. Scale dependence of landscape metrics and their indicatory value for nutrient and organic matter losses from catchments. Ecol. Indic. 2005, 5, 350–369. [Google Scholar] [CrossRef]
- Aflaki, A.; Mirnezhad, M.; Ghaffarianhoseini, A.; Ghaffarianhoseini, A.; Omrany, H.; Wang, Z.-H.; Akbari, H. Urban heat island mitigation strategies: A state-Of-The-Art review on Kuala Lumpur, Singapore and Hong Kong. Cities 2017, 62, 131–145. [Google Scholar] [CrossRef]
© 2020 by the authors. Licensee MDPI, Basel, Switzerland. This article is an open access article distributed under the terms and conditions of the Creative Commons Attribution (CC BY) license (http://creativecommons.org/licenses/by/4.0/).