Abstract
This paper presents a review of carbon dioxide (CO2) emissions from transportation in an attempt to establish a quick and suboptimal update of the methods used to calculate and analyze CO2 emissions from transportation. Transportation is the largest contributor to air pollution through the release of high amounts of CO2 gas into the atmosphere. The methods for calculating and analyzing the carbon footprint of transportation; which is of critical importance in the management of greenhouse gases that contribute to global warming; are still being developed. However; there are some differences in the definitions and methods used to calculate the carbon footprint of transportation in previous studies. This review focuses on the similarities of the methods used to measure CO2 emissions as well as the analyses used to evaluate the emissions. This paper will also highlight the advantages and limitations of each research work. By doing this; the present study contributes to the selection of appropriate methods for calculating CO2 emissions from transportation and draws attention to environmental issues. It is hoped that the implementation of the most appropriate framework will help to reduce CO2 emissions from transportation
1. Introduction
Economic activities and development projects are essential in the pursuit of the modernization of a country and improvements of the standard of living of the population of a country. However, the environmental problems caused by the implementation of these economic activities and development projects are often ignored. Rapid expansion and development have caused numerous adverse environmental impacts. In consequence, this has an adverse impact on human health, the national economy and natural resources. Pollution is the process of introducing objects or substances into the environment as a result of anthropogenic activities which in consequence disturb and threaten the natural environment. The Environment Quality Act [1] states that pollution is a direct or indirect change to the physical, chemical, biological or radiation levels of any part of the environment through the liberation, removal or disposal of wastes, which could have a potentially hazardous or dangerous effect on the health, safety or welfare of the public and other organisms, such as plants and animals.
In this respect, air pollution has caused the greenhouse gas effect. Greenhouse gases trap heat in the atmosphere. There are four main greenhouse gases, namely carbon dioxide (CO2), nitrous oxide (N2O), methane (CH4) and fluorinated gases. Table 1 presents the characteristics of these gases. Greenhouse gases are released by the combustion of fossil fuels, deforestation, industry, fermentation by enteric bacteria, among other factors. However, these gases are removed through photosynthesis and photolysis; the gases are also broken down in the atmosphere in a reaction with oxygen and hydroxyl groups. The remaining greenhouse gases absorb infrared radiation and indirectly influence ozone concentration in the stratosphere, and when the amounts of these gases are sufficiently high, they will contribute to global warming [2].

Table 1.
Characteristics of greenhouse gases.
As the amount of these gases increases, they heat up and slow down the heat release process. This will result in the melting of polar ice sheets and mountain glaciers, higher global temperatures and rising sea levels [4]. In addition, low-lying areas will be flooded and agriculture and livestock will decline due to a lack of photosynthesis. The most important effect is when the high volume of CO2 in the atmosphere causes a change in the global climate. Olivier and Peters [5] stated that, in 2017, 73% of the emitted greenhouse gases were CO2, compared to methane (18%), nitrous oxide (6%) and fluorinated gases (3%), as shown in Figure 1. Based on the high volume of CO2 emission, it can be concluded that CO2 is the major contributor to climate change and global warming.
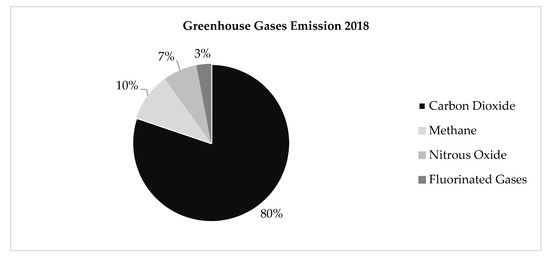
Figure 1.
Global share of greenhouse gas emissions in 2018. Source: The United States Environmental Protection Agency [3].
There are many sources contributing to CO2 emissions, such as the generation of electricity, commercial and residential buildings, agricultural activities, land use and forestry, industry and transportation [6,7]. Of these sources, the major contributor of CO2 emissions is urbanization and transportation [8] because transportation is essential for carrying out daily activities, such as commuting to and from work and school or traveling. The United States Environmental Protection Agency [3] stated that, in 2017, the transportation sector contributed the largest percentage of CO2 emissions (28.9%), followed by electricity (27.5%), industry (22.2%), commercial and residential buildings (11.6%), agriculture (9%) and land use and forestry (0.8%). The continuously increasing amount of CO2 emitted by transportation has raised concerns. There is an urgent need to gain a clear understanding of the factors, types and quantities of fuel consumed and how the increasing amount of CO2 emissions is contributing to global warming.
This paper will assess the current level of knowledge regarding the methods used to measure CO2 emissions from the transportation sector by designing and implementing a basic research method that distinguishes between the types of measurement and analysis of CO2 emissions used in previous studies, and the currently implemented policies concerning green environment technology in the effort to achieve zero CO2 emissions by the year 2050 [9]. This paper is organized as follows: Section 2 of this paper explains the methodology of this study; Section 3 describes CO2 emissions from transportation; Section 4 discusses the methods used in previous studies to measure CO2 emissions; Section 5 discusses the analysis performed in the investigation of CO2 emissions; Section 6 presents a review of the current policy regarding sustainable development goals; Section 7 presents Malaysia’s sustainable development goals; Section 8 presents the important insights that may be useful to researchers and policymakers for ensuring sustainable transport in Malaysia; Section 9 presents the conclusion of the work.
2. Methodology
This paper presents the body of information collected from a thorough review of the literature from electronic sources, including journals, books, reports published by an international organization and articles. The articles were found in the Science Direct, Elsevier, e-Journal Portal Universiti Kebangsaan Malaysia (UKM) and Google Scholar databases and Google database through a search engine using six keywords: greenhouse gases; CO2 emissions; CO2 emissions from transportation; CO2 emissions through Geographical Information System (GIS) application; Sustainable Development Goals (SDGs); sustainable policy. All articles have been subjected to a peer review process and were published between 1996 and 2019. Then, six topics were determined based on the review: (1) CO2 emissions from transportation, including 13 papers; (2) methods for measuring CO2 Emissions, including 20 papers; (3) analysis of CO2 emissions, including 20 papers; (4) implemented sustainable development policy, focusing on 15 countries that have paid attention to sustainable development, including Australia, Bangladesh, Brunei, Cambodia, China, India, Indonesia, Japan, Korea, Malaysia, Singapore, Thailand, the United Kingdom (UK), Uruguay and the USA; (5) Sustainable Development Goals (SDG) in Malaysia; (6) the way forward for ensuring sustainable transport in Malaysia. We also carried out a comparison analysis to determine which method is suitable for use to measure CO2 emissions in the air; CO2 emissions analysis publications were also used to determine which countries and journal databases focused more on CO2 emissions from transportation in academic publications. Figure 2 shows the overall methodology for this study.
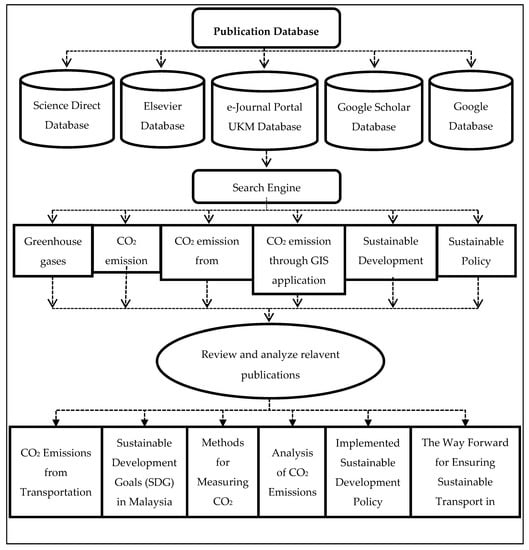
Figure 2.
Overall methodology.
3. Carbon Dioxide Emissions from Transportation
The increasing reliance on motor transport has led to the increased release of greenhouse gases, especially CO2, which have an adverse impact on the environment and, in turn, contribute to global warming and climate change. The combustion of gasoline in an engine produces CO2 and N2O, which contributes to ozone depletion. In addition to burning fossil fuels, these vehicles release pollutants into the air that cause environmental damage [10]. The quality of air is determined by the type of transportation system used [11]. The use of motor vehicles is a major contributor to CO2 emissions, and the amount of CO2 emission is expected to rise 305% by the year 2050 if substantive steps are not taken to deal with this problem [12].
The Statista Portal [13] randomly selected 20 countries to investigate CO2 emissions from transportation and found that the United States produced the highest amount of CO2 in 2017, followed by Canada, Australia and Saudi Arabia, as shown in Figure 3. The US is a highly developed country and has the highest usage of motor vehicles. There is therefore an urgent need to find ways to deal with the high CO2 emissions from the transportation industry. One of the solutions to these problems is the implementation of green development in the transportation industry.
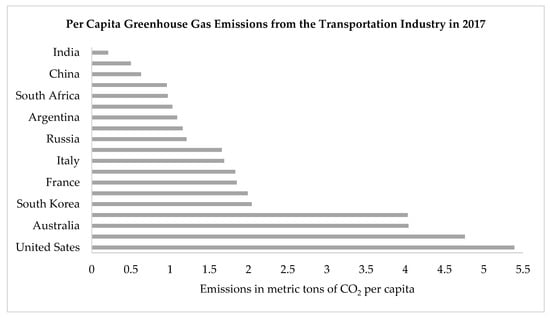
Figure 3.
Greenhouse gas emissions from the transportation industry in 2017. Source: Statista Portal [13].
In Figure 4, we show that the transportation sector in Indonesia emitted the highest amount of CO2 in 2017 for Association of Southeast Asian Nations (ASEAN) countries [14], followed by Malaysia, Thailand, Vietnam, Philippines, Singapore, Myanmar, Cambodia and Brunei. Based on these statistics, it can be concluded that the country with the highest population is responsible for the highest CO2 emissions. The amount of CO2 emitted is closely related to the use of motor vehicles, where the country with the highest population has the highest number of motor vehicles on the road. Thus, a low carbon mobility solution is needed to minimize CO2 emissions.
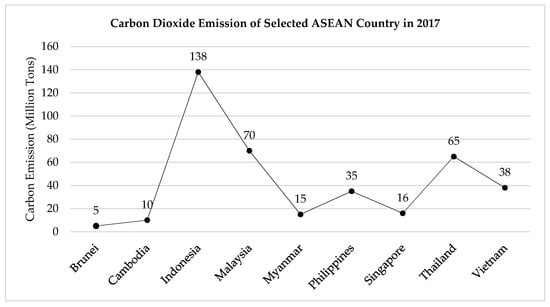
Figure 4.
CO2 emissions of ASEAN countries in 2017. Source: ASEAN Jakarta [14].
Sukor et al. [15] investigated CO2 emissions from transportation and found that the amount of CO2 emitted by the transportation sector increased when the harmful pollutants derived from the fossil fuels react with chemical substances during the combustion process before being released into the atmosphere. The amount of CO2 emissions is dependent on the condition of the vehicle and the type of fossil fuel used. Trucks emit the highest amount of CO2 compared to vans, although vans emit a higher amount of CO2 compared to small trucks [16]. Mickunaitis et al. [17] have demonstrated a linear relationship between CO2 and fuel consumption, where the CO2 emissions by diesel-powered automobiles are lower than those that run on petrol; however, one liter of diesel produces 2.7 kg of CO2, while one liter of petrol only produces 2.4 kg CO2. Based on these studies, it can be concluded that the larger engine displacement of a vehicle leads to higher fuel consumption and CO2 emissions; additionally, the fuel consumption of heavier vehicles is higher, and this means higher CO2 emissions. The fuel consumption of vehicles increases with every 100 kg increase in their weight; this results in a 6.5% and 7.1% increase in CO2 emissions by petrol and diesel-powered vehicles, respectively. In their investigation of the effect of carbon footprint management on road freight transport, Li et al. [18] introduced a method for calculating CO2 emissions, which took into account the load and speed of vehicles, and they suggested an investigation into the impacts of carbon pricing decisions among multiple organizations on the amount of CO2 emissions through different types of vehicles and transport modes in future. Santos [19] pointed out that, among the challenges faced in the effort to reduce CO2 emissions from transportation in Paris, are the lack of a global legally binding agreements and the comparatively higher costs of green technology. The reduction in CO2 requires cooperation between environmental organizations and environmental taxes and subsidies in order to change the relative costs of sustainable technology. At present, one of the most important discussions in legal and moral philosophy is the impact of traffic congestion on the emission of greenhouse gases for road transport. Bharadwaj et al. [20] reported that driving in congested traffic not only increases the amount of fuel consumed but also results in 53% higher CO2 emissions. This view is consistent with the findings by Zhang et al. [21] that fuel consumption and CO2 emissions are highest during the daily peak hour congestion. Therefore, the amount of CO2 emissions can be lowered by reducing traffic congestion. The difference between the state of congested flow and free-flow is a critical factor in CO2 emissions, exposure and health risk assessment and transportation planning. Many countries, including the United Kingdom, Taiwan and several countries in Europe, have implemented policies banning internal combustion engines in an attempt to reduce air pollution and improve the safety of their populations. The United Kingdom has made a commitment to cease the sale of conventional petrol and diesel-powered cars and vans by the year 2040 and reduce national vehicle emissions to zero by 2050. Taiwan has committed to banning the manufacture of non-electric motorcycles and four-wheel drive vehicles by 2035 and 2040, respectively. Europe hopes to reduce CO2 emissions by 40% by 2030 and ultimately to have zero CO2 emissions by 2050 in the hope of reducing climate change. In light of that, the authority of each country around the world should offer incentives to the owners of current vehicles to make a transition to “clean” alternatives instead of imposing harsher penalties. Saighani and Sommer [22] believe that CO2 emissions from transportation can be reduced by using technology to produce more efficient vehicles in addition to cultivating better driving behaviors. This can be achieved by, among other factors, improving engine efficiency and aerodynamics and producing lightweight vehicles and hybrid electric vehicles. However, despite the optimistic assumptions, the impact of these measures will only be seen over the next 20 years. Schroder and Cabral [12] examined the panel data for CO2 emissions produced by the Lisbon transportation industry based on fuel consumption and estimated emissions using a 3D routing model and concluded that eco-friendly methods are able to reduce fuel consumption by 20% and thereby reduce emissions. Unfortunately, the longer distances of eco-friendly routes require high expenses in terms of construction. It is worth noting that there is a contentious debate with regard to the effort to reduce CO2 emissions in the transportation sector, since manufacturers are only willing to invest in sustainable development while generating maximum profits.
4. Methods for Measuring Carbon Dioxide Emissions
Previous studies have used different methods for measuring CO2 emissions. One method calculates the rate of CO2 released based on vehicle type and speed [23], while another method makes the calculation based on the amount of fuel consumed with travel distance [24]. CO2 emissions can also be measured by using air quality monitoring instruments [25]. Researchers have used several different methods to calculate CO2 emissions in order to obtain a more accurate measurement. Each of these methods has its advantages and disadvantages in terms of the data, time and cost of measurement [23].
The Asian Development Bank [26] has adopted a policy that measures CO2 emissions based on the distance travelled, fuel consumption, vehicle speed and type of vehicle. This was a policy supported by the USA, where the amount of carbon emitted by motor vehicles is influenced by: vehicle or fuel characteristics, including engine type and technology, air conditioning, fuel properties and quality, deployment and the effectiveness of maintenance; fleet characteristics, which include vehicle utilization by vehicle type, transport mode, the age profile of the vehicle fleet and the adequacy of fleet maintenance programs; operating characteristics, namely the distance travelled, speed, degree of traffic congestion, and traffic control system [27]. These criteria must be taken into account when calculating CO2 emissions from transportation.
The distance travelled method multiplies the individual travel distance with the CO2 emissions factor of the travel mode. This is a comparatively simple formula and has been used in [28,29,30]. Even though many researchers have calculated the emission factors of CO2 for a particular city, it cannot be used by researchers conducting research in another location or city [8] since the emissions factor is dependent on vehicle type, passenger load factor and engine size. Furthermore, the number of vehicles on the road during peak hours is different for each study area. The formula used in this method is given by Equation (1), where Mi is the individual commuting CO2 emissions, Di is the individual commuting distance and Ei is the CO2 emissions factor of the travel mode [31].
Since the CO2 emissions for a short travel distance are generally lower, Wei and Pan [31] proposed the use of new green technologies to increase energy efficiency, and the planning of mixed land use should be implemented to protect the environment. Carpooling, especially in congested areas, can reduce CO2 emissions since a smaller number of vehicles are used to transport a larger number of commuters.
A number of researchers have determined CO2 emissions based on fuel consumption. CO2 increases in proportion with the amount of fuel consumed. Tarulescu et al. [32] calculated CO2 emissions using this method, where the standard emission factor was based on three factors: (i) spark ignition engine, at 0.249 (tons CO2/MWh); (ii) compression ignition engines, at 0.267 (tons CO2/MWh); (iii) biofuels, at 0.000 (tons CO2/MWh). The formula used in their study is given in (2), where XUsedFuel is the energy consumption for road transportation (kWh), D is the route distance (km), Caverage is the average fuel consumption (liters/km) and Y is the conversion factor for each fuel (kWh/liters), where Y = 9.2 for gasoline and Y = 10 for Diesel.
Aksoy et al. [33] measured CO2 emissions by expanding an earlier fuel consumption model by considering vehicle weight, vehicle technical data and route distance in their formula. They found that CO2 emissions are directly correlated with the type of vehicle and distance of travel, where a higher amount of fuel consumption results in higher CO2 emissions. The formula for measuring CO2 emissions is given by (3). Sukor et al. [15] used the formula to measure emissions, where C is CO2 emissions from transportation (kg CO2), FC is the fuel consumption of the vehicle (L/100 km) and f is the fuel-based emission factor (kg CO2/L).
The measurement based on vehicle speed calculates the total network energy use based on the average network speed. According to Grote et al. [34], this method is suitable for urban areas because the route networks in an urban area have applied the average speed levels of the vehicles, which need to be followed by drivers. Among the drawbacks of this method is the fact that it does not take into account the actual speed of each vehicle due to the different vehicle operating characteristics, which result in varying amounts of CO2 emission. However, it is worth noting that the same result was obtained when the average speed was in used in the calculation [35]. Gharineiat and Khalfan [23] calculated CO2 emissions based on the fuel consumed per unit of distance fx in ml/km, where vs is the average network speed of travel in km/h, fi is the idle fuel consumption rate in ml/h, c is a regression coefficient derived and K is the adjustment factor which allows for varying vehicle parameters in the vehicle fleet. The constant term (cK) takes into account the drag, inertia and effect of grade on fuel consumption. The formula used by this method is shown in (4) [23].
CO2 emissions can also be calculated based on vehicle type. Each type of vehicle has a different CO2 standard emission factor, where trucks emit a higher amount of CO2 compared to light vehicles, but the total amount of CO2 emitted by light vehicles is higher due to the much higher number of light vehicles on the road. In order to estimate the discharge factor for this approach, vehicles were classified based on vehicle type and the fuel used, where light vehicles use petrol and heavy vehicles use diesel. The formula used in this method is shown in (5) [23]. This model considers the difference in speed, vehicle type and fuel, where E is the estimated speed-based emission sin g/km, P is the city-cycle emission factor in g/km, which is different for each pollutant and vehicle type, and F(x) is the speed-related function, which is dependent on pollutant and vehicle type.
Table 2 shows the primary methods used in previous studies to measure CO2 emissions. These measurements were made using specific formulas that take into account the distance travelled, fuel consumption, vehicle speed and vehicle type. This paper reviewed 20 previous research works since most researchers used the same method in their studies, although the parameters taken into account may differ depending on the criteria of the studies.
Table 2.
Measurement method of CO2 used in previous studies.
A recent and promising approach takes into consideration the use of air quality monitoring instruments and the green-transportation sector. A common method for calculating CO2 emissions from transportation takes into consideration several parameters, including vehicle type, fuel type and travel distance. Researchers are currently focusing increased attention on using air quality monitoring instruments to detect CO2 in the atmosphere. Obanya et al. [25] measured air quality using calibrated hand-held devices. This is a time-saving approach since it provides the ability to cover large study areas. The advantage of using air quality monitoring instruments is that they are able to make accurate measurements of all chemicals in greenhouse gases, such as methane, ozone, nitrogen oxides and others [43]. In the past, air quality monitoring instruments have been very expensive, but they are now more affordable and are equipped with the latest technology [44].
This study aims to gain a better understanding of the measurement methods of CO2 emissions, because the selection of measurements is an important factor for determining the types of data used in a study and implementing the systematic analysis of CO2 emissions from transportation; the measured CO2 emissions are compared based on seven parameters, namely classification, data gathering methods, output, cost, time and accuracy. Each CO2 emission measuring method has a different classification; for example, based on the mode of transportation, when using the travel distance method, vehicle speed or vehicle type are based on the type of fuel used when using the fuel consumption method. However, measurements made using air quality monitoring instruments—for instance, the study by [45]—are based on peak hours.
The data required for measuring CO2 emissions from transportation are different for each method. The data required in the travel distance method are the travel distance and emission factor of the transport mode. The vehicle speed method requires data on transport mode vehicle speed. The vehicle type method requires data for the emission factor of a transport mode and vehicle speed. The fuel consumption method requires data for the type of fuel, distance travelled, amount of fuel and vehicle speed. The air-quality tool method does not require any data because it uses instruments to measure CO2 emissions. A questionnaire survey has to be carried out to gather the data required for the travel distance method, the vehicle speed method, the vehicle type method and the fuel consumption method. One of the benefits of using air quality monitoring instruments is that, unlike other methods that only provide the total amount of CO2 emissions, they also provide the volume of N2O, CH4 and fluorinated gases emitted. Therefore, it facilitates future research if upgrading existing research without having to go to the site for observation.
In terms of cost comparison, four items are used—equipment, labor and training, operation and maintenance and instrument calibration—and evaluated by a rating system, according to the modified study in [46], as shown in Table 3 and Table 4. The cost of air quality monitoring instruments is very high (score 2) compared to other methods that do not involve any cost (score 5). The second cost indicator—labor and training costs—includes the cost of implementing a questionnaire survey to gather data on the distance travelled, fuel consumption, vehicle speed and vehicle type measurement method. This method is very expensive (score 1) since more than five people are needed to conduct the survey. This method is also time consuming due to the large number of respondents required to achieve a good result. The method of using air quality monitoring instruments involves the lowest cost (score 4) because only a small number of personnel is needed to conduct on site observation. The third cost indicator—operation and maintenance—is inexpensive (score 3) since it requires only an air-quality monitoring instrument because this method is mainly used for operation data processing and as a tool. The maintenance of air quality monitoring instruments does not involve any cost as the instruments are assumed to be in good condition. The probability of the instruments being damaged is low because they are designed to a high specification [9]. Lastly, instrument calibration is essential for data quality assurance. The accuracy of the original data is important to ensure the result of the data analysis is accurate, especially for compliance purposes, or for population exposure and health risk assessments. According to the TRANSCAT Portal [47], a CO2 sensor should be calibrated about once a year using a standard span gas that contains a known percentage of CO2 through outdoor air, which should contain 350 to 450 parts per million of CO2. There are three types of standard method calibration for gaseous contaminants, based on the International Organization for Standardization (ISO); (1) initial calibration, where zero air and calibration gas atmospheres are supplied for the first time; (2) operational precision checks, where the zero and span responses of the instrument are checked for drift on a regular basis; (3) operational recalibration, where the analyzer exceeds the instrument performance requirements, or after six months since the last calibration [48]. Therefore, instrument calibration requires medium costs.
Table 3.
Rating system for cost indicators.
Table 4.
Rating system for average cost scores.
The last item compared in this study is the accuracy of the gathered data. Accuracy is important since it is a measure of how well the data describe the actual conditions and shows that the life-cycle of the data is consistent [49]. Inaccurate data will result in incorrect conclusions. With the exception of the air quality measurement tool, all measurement methods depend on the feedback provided by road users in the questionnaire survey. The questionnaire survey is typically more subjective and less accurate due to respondent experience. However, in the last 20 years, this method of CO2 emissions measurement has been preferred by researchers, including the authors of the work presented in [29,31,36,42]. Compared to air-quality tool measurement, this method uses a real time observation that records the data automatically, and it is possible to compute and store data over a long period and with a larger storage capacity. Clements et al. [44] stated that air-quality monitoring instruments are very robust and function continuously with high accuracy and that the observations are repeatable. Therefore, the use of air-quality monitoring instruments is better than other methods in terms of accuracy. Table 5 shows a summary of the comparison of CO2 emission measurement.
Table 5.
Summary of comparison of CO2 emission measurement.
In conclusion, five methods for measuring CO2 emission have been used in previous studies—distance travel, fuel consumption, vehicle speed, vehicle type and air quality monitoring instruments. A systematic review of the literature has proven that the use of air quality monitoring instruments is the best method compared to other methods for measuring CO2 emissions from transportation by virtue of its short observation period, real-time data and ability to also provide information about other greenhouse gases. However, the measurement depends on the objective of conducting the research.
5. Analysis of Carbon Dioxide Emissions
Many countries are presently focusing on reducing CO2 emissions and are implementing the development of low-carbon cities. One component in low-carbon city development is the reduction in CO2 emissions from transportation. Scientists have analyzed CO2 emissions to achieve this implementation by investigating the factors influencing CO2 emissions and have proposed models for CO2 emissions from transportation that can be used to reduce CO2 emissions in the future. The most important factor in reducing CO2 emissions is the determination of the amount of emissions followed by the analysis of emitted CO2.
Ding et al. [37] analyzed CO2 emissions by using a decomposition model that is frequently used in quantitative analysis. This method was used to decompose the changing of CO2 emissions into a combination of several factors; then, the influence degree of all factors could be identified. Wang et al. [41] expanded the decomposition method by implementing two steps—(i) integrating the specific characteristics of road freight transport and (ii) contrasting them with the transparency of statistics in their country. The results were found to be reasonable through this method. The outcomes of using the decomposition method showed that the CO2 emissions from transportation can be reduced by using four measures: (i) controlling the intensity of transportation energy emissions; (ii) improving the efficiency of transportation energy utilization; (iii) optimizing the transportation structure; (iv) regulating the demand for transportation.
Zhuang et al. [42] used a mathematical model to analyze CO2 emissions, where the direct and indirect gas emissions were analyzed using a life cycle assessment method. This method is more precise than others because it is based on the lifestyle of China’s residents. Similarly, Tarulescu et al. [32] proposed the use of a mathematical model through polynomial regression to analyze CO2 emissions. The results were plotted and the resulting graph showed that higher fuel consumption resulted in a higher amount of CO2 being released into the atmosphere. Therefore, the amount of CO2 emissions can be reduced by encouraging the use of bicycle lanes, vehicle fleet renewal and green urban public transport systems, such as the use of hybrid cars.
The Geographical Information System (GIS) can be a useful tool for evaluating and analyzing the spatial data related to the study of emissions. Byrne and Donnely [50] used GIS to perform a visual and numerical representation of the model’s resulting calculations through a grid squares analysis of CO2 emissions. Asdrubali et al. [51] developed a GIS-based tool for greenhouse gas emissions to support local decision-makers in an innovative manner that is different from traditional greenhouse gas inventories. Shu et al. [40] used the spatial scale of routes to calculate CO2 emissions based on a vehicle’s traveled distance. Dalumpines [52] and Chen and Crawford [53] combined GIS applications with remote sensing applications. The remote sensing application was used to identify the changes in land use and to produce a thematic classification map, which was then integrated with the GIS application to carry out advanced analysis. GIS applications can be used to perform both statistical analysis [54] and spatial analysis. Its capabilities were proven to support decision making and analyze and manipulate various types of data and information in an effective way [55].
Grote et al. [34] proposed five models for analyzing CO2 emissions: (1) an average speed emissions model based on average vehicle speeds for each route in an urban area; (2) a traffic situation emissions model that takes into account congested situation; (3) a traffic variable emissions model that influences traffic movement capacity in certain cases; (4) a cycle variable emissions model that requires information on the number of stops per km, average speed and maximum acceleration; (5) a modal emissions model that calculates the instantaneous values of engine power and engine speed. Similarly, Bharadwaj et al. [20] analyzed CO2 emissions during peak hours and found that traffic congestion caused higher CO2 emissions compared to the rate of emissions during free flow conditions.
Schroder and Cabral [12] used the most current technology in the 3D routing model to analyze vehicle fuel consumption in order to determine CO2 emissions by using GIS applications. This model was used to determine eco-friendly routes and to calculate total fuel consumption as total travel time and distance; the routes were visualized with a detailed 3D profile to gain a better understanding of them. There are four important elements in the implementation of this model: (i) the generation of a 3D road network by connecting a 2D road network and merging it with digital elevation model (DEM) data; (ii) the calculation of vehicle and fuel consumption within the 3D road network by using the computer program to calculate emissions from road transport III by implementing emission estimation models (COPERT III EEM); (iii) route optimization to ensure minimum fuel consumption and its dependence on the situation scenarios; (iv) implementation of the 3D visualization of specific routes. The researchers concluded that GIS has the ability to effectively manipulate CO2 emission data and analyze geographical data.
In conclusion, previous studies have carried out different analyses to investigate CO2 emissions. The method of analysis used in each study is dependent on the type of data available and the scope of the study. According to Gharineiat and Khalfan [23], the most suitable models for an urban setting are those based on fuel consumption and total distance travelled. Thus, the available data should be identified before choosing the most suitable method of analysis. Table 6 summarizes the analyses used in previous studies.
Table 6.
Analysis of CO2 emissions by previous studies. GIS: Geographical Information System.
The systematic literature review has provided a much-needed basis for collecting and analyzing CO2 data. Several keywords and related concepts were used as search strings in the journal databases—for instance, “CO2 emission from transportation”, “CO2 emission from transportation using GIS application”, “low carbon cities”, “sustainable development”, “policy of low carbon cities” and “measurement of CO2 from transportation”. However, the search carried out in this study is limited to the period from January 2008 to September 2019 because the first pilot initiative was launched in 2008 [59]. In order to explore the analysis done by previous studies and to gather the relevant resources, a broad search protocol was used through multi-disciplinary academic publishing and distribution bibliographic databases, such as Google Scholar, ScienceDirect, Elsevier and Springer. Twenty journals were selected for an in-depth review due to the similarity in the previously carried-out investigations, although some of the investigations have been expanded using several elements depending on the scope of the studies [37,41]. Figure 5 shows the number of publications that analyzed CO2 emissions, with the highest numbers of publications in 2011, 2013 and 2017. Most of the studies were carried out in China.
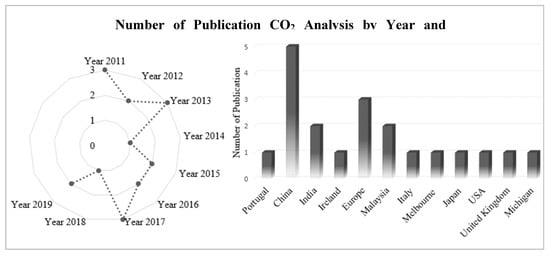
Figure 5.
Number of CO2 emissions analysis publications.
6. Implemented Sustainable Development Policy
Many countries have adopted the implementation of low-carbon cities (LCC) in an effort to achieve sustainable development that can protect the earth from the effect of global warming and climate change in the future. This paper has reviewed the policies implemented in 15 countries that have been paying serious attention to ensuring sustainable development, including Japan, the USA, the United Kingdom, Malaysia and others, as shown in Table 7. One of the aims of this paper is to present the existing policies regarding the maintenance of a sustainable environment that can serve as a guideline for researchers because every policy has its own strategies that focus on the same elements, such as urban development, sustainable transportation, green technologies in building construction and others. Thus, researchers can refer to existing policies to investigate environmental sustainability and how it relates to their studies.
Table 7.
Existing policies of environmental sustainability. LCC: low-carbon city.
7. Sustainable Development Goals (SDG) in Malaysia
The Sustainable Development Goals (SDGs) are a framework adopted by the members of the United Nations in 2015 in an attempt to achieve a better and more sustainable future for all. This framework addresses the issues of global interest in dealing with poverty, inequality, climate change, environmental degradation, peace and justice, as shown in Figure 6. Specific targets have been set for each of the 17 goals, and it is hoped that these targets will be achieved by the year 2030 [75].
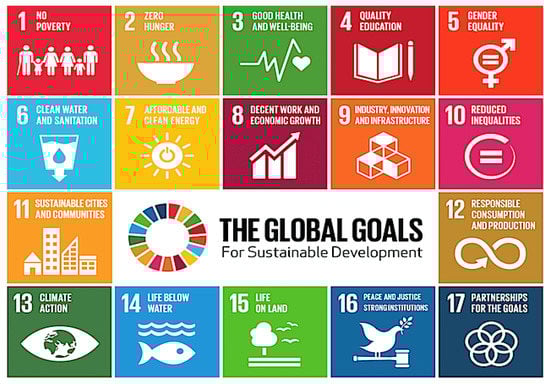
Figure 6.
Elements of the Sustainable Development Goals. Source: Briggs and Leong [76].
Malaysia has adopted a sustainable development approach since the 1970s. Special focus is given to the elimination of poverty, improving the welfare of citizens, providing educational opportunities for all and preserving the environment. The focus on sustainable development was launched in 2009 with the introduction of the New Economic Model, which consists of three goals: the attainment of higher income, inclusiveness and sustainability. These goals are consistent with three of the goals stated in the SDGs, namely the economy, social welfare and the environment. Six other strategic pillars have been set out in the 11th Malaysia Plan (2016–2020) to achieve the SDGs. These pillars aim to increase wealth in order to ensure a just society, enhance the welfare of all citizens, expedite the development of human capital to become a developed country, push towards a sound growth for sustainability and resilience, improve the infrastructure to ensure economic growth and to restructure economic growth to achieve a higher level of well-being [76].
With regard to the environment, one of the effective catalysts in achieving the SDGs is improving the public transport system. The transportation sector can be connected with each of the goals in the SDGs; in particular, the goals related to food sufficiency health, energy and climate change, infrastructure, urban areas and population centers. The public transport systems in most urban areas are lacking in terms of safety, efficiency and sustainability. These have an adverse impact on marginalized members of the low-income group and widen the gap between social classes. There is an urgent need to implement a green transportation system that is energy efficient and uses renewable energy sources that do not cause as high a level of pollution as fossil fuels. Globally, the transport sector releases one quarter of the of energy-related greenhouse gases worldwide, and the rate of emissions by this sector is rising at a higher rate than all other sectors. There is also an urgent need to deal with other environmental issues, including establishing public transport systems that are able to withstand natural catastrophes and changing weather patterns.
Green transportation is able to reduce the mortality rate by reducing the number of deaths due to road traffic accidents. In 2016, Malaysia recorded a total of 521,466 road accidents that resulted in the deaths of 7152 people [77]. This is an average of 20 deaths per day, which cost the country over RM nine billion. According to the World Health Organization [78], Malaysia has the third highest fatality rate from road traffic accidents. There is also an urgent need to design a public transport system that gives better protection to women from sexual violence and abuse in addition to reducing mugging and robbery incidences on public vehicles and at stations. A mechanism should also be put in place to make it easy for drivers and passengers to recognize and report human trafficking.
The National Transport Policy (NTP) 2019–2030 was launched to provide policies and strategies to improve the economic competitiveness of Malaysia and provide strong social consequences in terms of inclusivity and accessibility while reducing the negative impact of the transport system on the environment [79]. Prime Minister Tun Dr Mahathir Mohamad stated that the NTP 2019–2030 will serve as a guideline for providing an intelligent, connected, convenient and safe public transport system. This policy aims to embrace the Fourth Industrial Revolution (IR 4.0) in order to promote the modal shift from private vehicles to public transport [80]. This will provide a sustainable transportation system that will drive economic expansion and ensure the welfare of the people.
In summary, a sustainable transport system has to be a critical element of the strategy for sustainable growth. Considering that transport infrastructure will last for many decades, the current policies implemented by the local and national governments will have a long-term impact on urban development and thus on the climate.
8. The Way Forward for Ensuring Sustainable Transport in Malaysia
Malaysia is aiming to implement sustainable development, especially in the transportation sector, with the launching of the Low-Carbon Mobility Blueprint and Action Plan (LCMB). The three major objectives of the LCMB are increasing the ridership of public transport, expediting the use of clean energy vehicles and enhancing the automotive industry’s capability to produce more efficient vehicles that produce lower emissions [81]. One of the successful implementations of green technology in transportation is MyRapid. MyRapid has brought about substantial improvements in the public transport system, particularly in the Klang Valley and Penang, where the modal share of public transport in Klang Valley has increased from 16% in 2010 to 20% in 2015. The Rapid KL buses have been successfully integrated with the Mass Rapid Transit (MRT) and Light Rail Transit (LRT) systems. According to Adnan [82], MRT recorded a 32% increase in ridership after the launching of the My100 and My50 program on 1 January 2019. Since then, a total of 1.2 million commuters use the MRT and LRT on a daily basis. GreenTech Malaysia has increased the number of EV charging stations across the nation through the ChargEV initiative, in which 250 stations have been set up in Kedah, Pulau Pinang, Pahang, Perak, Selangor, Kuala Lumpur, Putrajaya, Negeri Sembilan, Melaka and Johor. These charging stations are strategically located at hotels, shopping malls, and petrol stations, among others, and thereby help to promote these businesses. In 2018, a total of 132,307 charging hours and 47,502 charging sessions were recorded, which is a 51% increase from 2017 [83].
The Carlist.my Portal reported on 16 July 2019 that, compared to other ASEAN countries, CO2 emissions in Malaysia are among the highest [84]. This highlights the urgency to promote low-carbon mobility. There is a critical need for Malaysia to effectively reduce CO2 emission from transportation. In this regard, a number of countries have successfully reduced CO2 emissions from transportation by: (1) banning the use of cars in urban areas during a certain period (Mexico City [45]); (2) implementing car-sharing programs (China [64]); (3) minimizing the use of fossil fuels by introducing green transport (Shanghai [31]); (4) developing green areas in which plants with a high capacity to absorb CO2 are planted (Melbourne [53]). Malaysia will be able to emulate the measures taken by these countries in its efforts to effectively reduce CO2 emissions from transportation, depending on their economic feasibility and Malaysia’s current development planning. This effort may also be carried out through cooperation between governments and non-governmental organizations.
Additionally, future research in Malaysia should focus on: (1) revising transportation law—for example, low-occupancy vehicles should not be permitted during peak hours; (2) developing a database for sustainable transport management, since this would facilitate better analysis and decision making; (3) educating primary and secondary school students, as well as the public, regarding the significance of sustainable transportation; (4) making CO2 assessment mandatory for all companies above a certain size. These measures are of critical importance in the effort to reduce CO2 emissions. In conclusion, the transportation sector will make improvements in terms of accessibility and connectivity, reducing traffic congestion, reducing spending on car fuel, improving the environment and promoting a healthy lifestyle. Importantly, there is a global intention to achieve the goal of zero emissions of CO2 by the year 2050.
9. Conclusions
It is unfortunate that the various methods for calculating CO2 emissions from transportation have led to misconceptions or pragmatic applications. This review has made a significant contribution to dealing with this problem by establishing the sources of CO2 emissions. As such, it has identified the major elements of the methods used to make direct and indirect measurements of CO2 emissions. To that end, this study has presented the different formulas used to measure CO2 emissions from transportation, including the methods of distance travel, fuel consumption, vehicle speed, vehicle type and air-quality tool measurement. The comparison was performed based on seven indicators: accuracy, classification, cost of equipment, labor and training, operation and maintenance, the type of data needed, the method of obtaining data, the type of output and time observation. Based on the comparison, we are able to conclude that air-quality tool measurement is the best method to observe CO2 emissions due to its short observation period and real-time data, and also because it provides information about other greenhouse gases. However, each method has its specialization and the appropriate method depends on the aim of the research.
This review has also attempted to give insight into the analysis of CO2 emissions. The result of the review of previous studies shows that the analysis of CO2 emissions has been conducted through various methods, such as the decomposition model, mathematical model, comprehensive modal emissions model, GIS application analysis and others. Besides that, this study also gives an overview for the agenda of the Sustainable Development Goals and has listed a policy for sustainable development that has been implemented globally. An additional benefit of this review is to adapt CO2 emission principles into green transportation development technologies. The author believes that many important components of CO2 emissions from transportation have been ignored that may shed light on organizational phenomena and at different levels of exchange. Therefore, it is hoped that this review provides possible avenues for revisiting old concepts and introducing new ones in the future.
Author Contributions
Conceptualization, N.F.F.Y. and K.N.A.M.; methodology, N.F.F.Y.; validation, N.F.F.Y.; K.N.A.M.; M.R.M.Y. and N.E.A.B.; formal analysis, N.F.F.Y. and K.N.A.M.; writing—original draft preparation, N.F.F.Y; writing—review and editing, N.F.F.Y.; K.N.A.M.; M.R.M.Y. and N.E.A.B.; supervision, K.N.A.M.; M.R.M.Y. and N.E.A.B.; project administration, N.F.F.Y.; K.N.A.M.; M.R.M.Y.; funding acquisition, M.R.M.Y. All authors have read and agreed to the published version of the manuscript.
Funding
This research was funded by the Malaysian Ministry of Higher Education, grant FRGS/1/2019/TK08/UKM/02/1.
Acknowledgments
The author would like to thank Universiti Kebangsaan Malaysia (UKM) and the Ministry of Education for their financial support under research grant FRGS/1/2019/TK08/UKM/02/1.
Conflicts of Interest
The authors declare no conflict of interest.
References
- Environment Quality Act (Amendment 2012). Environmental Quality Act. Pencetakan Nasioanal Malaysia Berhad; Kuala Lumpur, Malaysia, 2012. Available online: https://www.ecolex.org/details/legislation/environmental-quality-amendment-act-2012-lex-faoc159115/ (accessed on 3 December 2019).
- Zahir, M.H.M.; Woon, C.O.; Raman, S.N.; Mohamed, M.F.; Napiah, Z.M. Kajian Persepsi Arkitek terhadap Pelaksanaan Bumbung Hijau di Malaysia: Faedah, Halangan dan Cadangan. J. Kejuruter. 2019, 31, 375–381. [Google Scholar]
- United States Environmental Protection Agency. Greenhouse Gas Emissions. 2019. Available online: https://www.epa.gov/ghgemissions/overview-greenhouse-gases (accessed on 3 December 2019).
- Masson-Delmotte, V.; Zhai, P.; Pörtner, H.-O.; Roberts, D.; Skea, J.; Shukla, P.R.; Pirani, A.; Moufouma-Okia, W.; Péan, C.; Pidcock, R. Warming of 1.5 °C above Pre-Industrial Levels and Related Global Greenhouse Gas Emission Pathways, in the Context of Strengthening the Global Response to the Threat of Climate Change, Sustainable Development, and Efforts to Eradicate Poverty. Intergov. Panel on Clim. Chang. in press.
- Olivier, J.G.; Peters, J.A.H.W. Trends in Global CO2 and Total Emission Greenhouse Gas Emissions: 2018 Report; PBL Netherlands Environmental Assessment Agency: The Hague, The Netherlands, 2018; pp. 1–53. [Google Scholar]
- Olajire, A.A.; Azeez, L.; Oluyemi, E.A. Chemosphere Exposure to hazardous air pollutants along Oba Akran road, Lagos–Nigeria. Chemosphere 2011, 84, 1044–1051. [Google Scholar] [CrossRef] [PubMed]
- Uning, R.; Latif, M.T.; Othman, M.; Juneng, L.; Hanif, N.M.; Nadzir, M.S.M.; Maulud, K.N.A.; Jaafar, W.S.W.M.; Said, N.F.S.; Ahamad, F.; et al. A review of Southest Asian Oil Palm and Its CO2 Fluxes. Sustainability 2020, 12, 5077. [Google Scholar] [CrossRef]
- Chang, C.; Lin, T.-P. Estimation of Carbon Dioxide Emissions Generated by Building and Traffic in Taichung City. Sustainability 2018, 10, 112. [Google Scholar] [CrossRef]
- Inoue, T.; Yamada, K. Economic Evaluation toward Zero CO2 Emission Power Generation after 2050 in Japan. Energy Procedia 2017, 142, 2761–2766. [Google Scholar] [CrossRef]
- Shah, R.M.; Yunus, R.M.; Kadhum, A.A.H.; Yin, W.W.; Minggu, L.J. Kajian Fotomangkin Berasaskan Grafin untuk Penurunan Karbon Dioksida. J. Kejuruter. 2018, 30, 19–32. [Google Scholar]
- Mahmud, M.; Llah, I.H.A. Pencemaran Udara di Bukit Rambai, Melaka Sewaktu Peristiwa Jerebu Tahun 2005. Geogr. Malays. J. Soc. Space 2010, 6, 30–39. [Google Scholar]
- Schroder, M.; Cabral, P. Computers, Environment and Urban Systems Eco-friendly 3D-Routing: A GIS Based 3D-Routing-Model to Estimate and Reduce CO2-Emissions of Distribution transports. Comput. Environ. Urban Syst. 2019, 73, 40–55. [Google Scholar] [CrossRef]
- Statista Portal. Per Capita Greenhouse Gas Emissions from the Transportation Industry Worldwide in 2017, by Select Country; Energy & Environmental Services: Hamburg, Germany, 2019; Available online: https://www.statista.com/statistics/388081/global-nickel-consumption-projection/ (accessed on 3 December 2019).
- The World Bank. The Low Carbon City Development Program (LCCDP) Guidebook: A Systems Approach to Low Carbon Development in Cities; The World Bank: Washington, DC, USA, 2014; pp. 1–82. [Google Scholar]
- Sukor, N.S.A.; Basri, N.K.; Hassan, S.A. Carbon Footprint Reduction in Transportation Activity by Emphasizing the Usage of Public Bus Services among Adolescents. IOP Conf. Ser. Mater. Sci. Eng. 2017, 226, 1–8. [Google Scholar] [CrossRef]
- Transport & Environment. CO2 Emissions from Cars: The Facts. 2018. Available online: https://www.transportenvironment.org/publications/co2-emissions-cars-facts (accessed on 3 December 2019).
- Mickunaitis, V.; Pikunas, A.; Mackoit, I. Reducing Fuel Consumption and CO2 Emission in Motor Cars. Transport 2007, 22, 160–163. [Google Scholar] [CrossRef]
- Li, J.; Lu, Q.; Fu, P. Carbon Footprint Management of Road Freight Transport under the Carbon Emission Trading Mechanism. Math. Probl. Eng 2015, 2015, 814527. [Google Scholar] [CrossRef]
- Santos, G. Road transport and CO2 emissions: What are the challenges? Transp. Policy 2017, 59, 71–74. [Google Scholar] [CrossRef]
- Bharadwaj, S.; Ballare, S.; Chandel, M.K. Impact of Congestion on Greenhouse Gas Emissions for Road Transport in Mumbai Metropolitan Region. Transp. Res. Procedia 2017, 25, 3538–3551. [Google Scholar] [CrossRef]
- Zhang, K.; Batterman, S.; Dion, F. Vehicle emissions in congestion: Comparison of work zone, rush hour and free-flow conditions. Atmos. Environ. 2011, 45, 1929–1939. [Google Scholar] [CrossRef]
- Saighani, A.; Sommer, C. Potentials for Reducing Carbon Dioxide Emissions and Conversion of Renewable Energy for the Regional Transport Market—A Case Study. Transp. Res. Procedia 2017, 25, 3479–3494. [Google Scholar] [CrossRef]
- Gharineiat, Z.; Khalfan, M. Using the Geographic Information System (GIS) in the Sustainable Transportation. Int. J. Civ. Archtectural Eng. 2011, 5, 1425–1431. [Google Scholar]
- Kan, Z.; Tang, L. Estimating Vehicle Fuel Consumption and Emissions Using GPS Big Data. Int. J. Environ. Res. Public Health 2018, 15, 566. [Google Scholar] [CrossRef]
- Obanya, H.E.; Amaeze, N.H.; Togunde, O.; Otitoloju, A.A. Air Pollution Monitoring Around Residential and Transportation Sector Locations in Lagos Mainland. J. Health Pollut. 2018, 8, 180903. [Google Scholar] [CrossRef]
- Asian Development Bank. Reducing Carbon Emissions from Transport Projects; Independent Evaluation Department: Metro Manila, Philippines, 2010. [Google Scholar]
- Faiz, A.; Weaver, C.S.; Walsh, M.P. Air Pollution from Motor Vehicles: Standard and Technologies for Controlling Emissions; World Bank Group: Washington, DC, USA, 1996. [Google Scholar]
- Illic, I.; Vukovic, M.; Strbac, N.; Urosevic, S. Applying GIS to Control Transportation Air Pollutants. Pol. J. Environ. Stud. 2014, 23, 1849–1860. [Google Scholar]
- Yuan-yuan, L.; Yuan-qing, W.; Rui, A.; Chao, L. The Spatial Distribution of Commuting CO2 Emissions and the Influential Factors: A Case Study in Xi’an, China. Adv. Clim. Chang. Res. 2015, 6, 46–55. [Google Scholar] [CrossRef]
- Velaquez, L.; Munguia, N.E.; Will, M.; Zavala, A.G.; Verdugo, S.P.; Delakowitz, B.; Giannetti, B. Sustainable Transportation Strategies for Decoupling Road Vehicle Transport and Carbon Dioxide Emissions. Manag. Environ. Qual. Int. J. 2015, 26, 373–388. [Google Scholar] [CrossRef]
- Wei, P.; Pan, H. Research on Individual Carbon Dioxide Emissions of Commuting In Peri-Urban Area of Metropolitan Cities Peri-Urban Area of Metropolitan Cities—An Empirical Study in Shanghai. Transp. Res. Procedia 2017, 25, 3459–3478. [Google Scholar] [CrossRef]
- Tarulescu, S.; Tarulescu, R.; Soica, A.; Leahu, C.I. Smart Transportation CO2 Emission Reduction Strategies. IOP Conf. Ser. Mater. Sci. Eng. 2017, 252, 012051. [Google Scholar] [CrossRef]
- Aksoy, A.; Kucukoglu, I.; Ene, S.; Ozturk, N. Integrated Emission and Fuel Consumption Calculation Model for Green Supply Chain Management. Procedia Soc. Behav. Sci. 2014, 109, 1106–1109. [Google Scholar] [CrossRef]
- Grote, M.; Williams, I.; Preston, J.; Kemp, S. Including congestion effects in urban road traffic CO2 emissions modelling: Do Local Government Authorities have the right options? Transp. Res. Part D 2016, 43, 95–106. [Google Scholar] [CrossRef]
- Toffolo, S.; Morello, E.; Rocco, D.; Di Valdes, C.; Punzo, V. ICT—Emissions Deliverable 2.1: Methodology; Garcia-castro, A., Vouitsis, I., Ntziachristos, L., Samaras, Z., Eds.; European Commission: Brussels, Belgium, 2013. [Google Scholar]
- Bhautmage, U.P.; Tembhurkar, A.R.; Sable, A.; Sinha, S.; Adarsh, S. Carbon Footprint for Transportation Activities of an Institutional Campus. J. Energy Environ. Carbon Credit. 2015, 5, 9–19. [Google Scholar]
- Ding, J.; Jin, F.; Li, Y.; Wang, J. Analysis of Transportation Carbon Emissions and Its Potential for Reduction in China. Chin. J. Popul. Resour. Environ. 2013, 11, 17–25. [Google Scholar] [CrossRef][Green Version]
- Goodchild, A.; Wygonik, E.; Mayes, N.; Mayes, N. An analytical model for vehicle miles traveled and carbon emissions for goods delivery scenarios. Eur. Transp. Res. Rev. 2018, 10, 1–10. [Google Scholar] [CrossRef]
- Singleton, A. A GIS Approach to Modelling CO2 Emissions Associated with the Pupil School Commute. Int. J. Geogr. Inf. Sci. 2014, 28, 256–273. [Google Scholar] [CrossRef]
- Shu, Y.; Lam, N.S.N.; Reams, M.; Rouge, B. A New Method for Estimating Carbon Dioxide Emission from Transportation at Fine Spatial Scales. Environ. Res. Lett. 2010, 5, 1–19. [Google Scholar] [CrossRef]
- Wang, T.; Li, H.; Zhang, J.; Lu, Y. Influencing Factors of Carbon Emission in China’s Road Freight Transport. Procedia-Soc. Behav. Sci. 2012, 43, 54–64. [Google Scholar] [CrossRef]
- Zhuang, X.; Jiang, K.; Zhao, X. Analysis of the Carbon Footprint and Its Environmental Impact Factors for Living and Travel in Shijiazhuang City. Adv. Clim. Chang. Res. 2011, 2, 159–165. [Google Scholar] [CrossRef]
- Xie, X.; Semanjski, I.; Gautama, S.; Tsiligianni, E. A Review of Urban Air Pollution Monitoring and Exposure Assessment Methods. Int. J. Geo-Inf. 2017, 6, 389. [Google Scholar] [CrossRef]
- Clements, A.L.; Griswold, W.G.; Rs, A.; Johnston, J.E.; Herting, M.M.; Thorson, J.; Collier-oxandale, A.; Hannigan, M. Low-Cost Air Quality Monitoring Tools: From Research to Practice (A Workshop Summary). Sensors 2017, 11, 2478. [Google Scholar] [CrossRef]
- Rusbintardjo, G.; Jiun, C.M.; Ibrahim, A.N.H.; Babashamsi, P.; Yusoff, N.I.M.; Hainin, M.R. A Comparative Study of Monitoring Methods in Sustainable Pevement System Development. J. Teknol. 2019, 81, 41–51. [Google Scholar] [CrossRef]
- Raje, F.; Tight, M.; Pope, F.D. Traffic pollution: A search for solutions for a city like Nairobi. Cities 2018, 82, 100–107. [Google Scholar] [CrossRef]
- TRANSCAT Portal. Understanding Air Quality Test Instruments. Available online: https://www.transcat.com/calibration-resources/application-notes/air-quality-measurement/ (accessed on 22 May 2020).
- Chae, B.; Yang, C.; Olson, D.; Sheu, C. The impact of advanced analytics and data accuracy on operational performance: A contingent resource based theory (RBT) perspective. Decis. Support Syst. 2014, 59, 119–126. [Google Scholar] [CrossRef]
- Fortin, J.A.; Cardille, J.A.; Perez, E. Multi-sensor Detection of Forest-cover Change across 45 years in Mato Grasso, Brazil. Remote Sens. Environ. 2020, 238, 111266. [Google Scholar] [CrossRef]
- Byrne, E.; Donnely, E. Carbon Emissions, Transport and Location: A Sustainability Toolkit for Stakeholders in Development. In Proceedings of the Irish Transport Network 2012 Conference, University of Ulster, Ireland, 29–30 August 2012; pp. 1–9. [Google Scholar]
- Asdrubali, F.; Presciutti, A.; Scrucca, F. Development of a greenhouse gas accounting GIS-based tool to support local policy making—Application to an Italian municipality. Energy Policy 2013, 61, 587–594. [Google Scholar] [CrossRef]
- Dalumpines, R. Using RS and GIS in Developing Indicators to Support Urban Transport Ecological Footprint Analysis: The Case of Ahmedabad City, India; International Institute for Geo-Information Science and Earth Observation Enschede: Enschede, The Netherlands, 2008. [Google Scholar]
- Chen, S.; Crawford, R.H. Modeling the Carbon Footprint of Urban Development: A Case Study in Melbourne. In Living and Learning: Research for a Better Built Environment: 49th International Conference of the Architectural Science Association; The Architectural Science Association and The University of Melbourne: Melbourne, Australia, 2015; pp. 267–277. [Google Scholar]
- Yazid, M.R.M.; Baharin, N.I.K.; Yaacob, N.F.F. A Study of Reducing Carbon Footprint towards the Sustainability Campus. In Proceeding of the International Conference on Education, Islamic Studies and Social Sciences Research 2019, Madani Hotel, Medan North Sumatra, Indonesia, 2–3 September 2019; pp. 1–11. [Google Scholar]
- Yousefi-sahzabi, A.; Sasaki, K.; Djamaluddin, I.; Yousefi, H.; Sugai, Y. GIS modeling of CO2 Emission Sources and Storage Possibilities. Energy Procedia 2011, 4, 2831–2838. [Google Scholar] [CrossRef]
- Idris, N.; Mahmud, M. Kajian Jejak Karbon di Kuala Lumpur. J. Soc. Sci. Humanit. 2017, 12, 165–182. [Google Scholar]
- Lorena, A.; Albert, M.; Maria, D. Carbon Footprint Analysis: Towards a Projects Evaluation Model for Promoting Sustainable Development. Procedia Econ. Financ. 2013, 6, 353–363. [Google Scholar] [CrossRef]
- Ma, F.; Wang, W.; Sun, Q.; Liu, F.; Li, X. Ecological Pressure of Carbon Footprint in Passenger Transport: Spatio-Temporal Changes and Regional Disparities. Sustainability 2018, 10, 317. [Google Scholar] [CrossRef]
- Hunter, G.W.; Sagoe, G.; Vettorato, D.; Jiayu, D. Sustainability of Low Carbon City Initiatives in China: A Comprehensive Literature Review. Sustainability 2019, 11, 4342. [Google Scholar] [CrossRef]
- Australian Government. Annual Report Highlights; Low Carbon Living: Sydney, Australia, 2017.
- Jilani, T. Low-Carbon Society Development towards 2025 in Bangladesh; Government of Bangladesh: Kyoto, Japan, 2012.
- Islamic Development Bank. Low-carbon Transport for Development: Trends and Recommendations for Islamic Development Bank Member Countries; Development Bank’s Country Programs Complex: Jeddah, Saudi Arabia, 2018. [Google Scholar]
- Moa, H. Low Carbon Development Strategy for Cambodia toward 2050; Ministry of environment and Royal University of Agriculture: Phnom Penh, Cambodia, 2015; pp. 1–4.
- Price, L.; Zhou, N.; Fridley, D.; Ohsnita, S.; Khana, N. Low-Carbon City Policy Databook: 72 Policy Recommendations for Chinese Cities from the Benchmarking and Energy Savings Tool for Low Carbon Cities; Gleeson Library: San Francisco, CA, USA, 2016. [Google Scholar]
- Nallathiga, R. Low Carbon Intensity Urban Planning Strategies for India; Strategies for India Part 1 the Growing Cities of India: Towards Sustainability and Emission Reduction; Oxford University Press: New Delhi, India, 2010. [Google Scholar]
- Institute for Global Environmental Strategies. In Low Carbon City Planning Project in Surabaya, Indonesia; Institute for Global Environmental Strategies: City of Kitakyushu, Japan, 2015.
- Kobayashi, H. Japan’s Actions towards the Creation of Low-Carbon Cities. In Proceedings of the third International Forum for Sustainable Asia and the Pacific, Keio University, Tokyo, Japan, 27 July 2011. [Google Scholar]
- Kwang, W.I. Korean Strategy for Low-Carbon Green City; Korea Research Institute for Human Settlements: Anyang City, Korea, 16 November 2016. [Google Scholar]
- Ministry of Energy Green Technology and Water Malaysia (KeTTHA). Low Carbon Cities Framework; GreenTech: Selangor, Malaysia, 2017.
- National Climate Change. Take Action Today for A Carbon-Efficient Singapore; National Climate Change Secretariat: Singapore, 2016. [Google Scholar]
- Limmeechokchai, B. Low-Carbon Society Vision 2030—Thailand; Sirindhorn International Institute of Technology Thammasat University Thailand: Bangkok, Thailand, 2010. [Google Scholar]
- Crown. The UK Low Carbon Transition Plan—National Strategy for Climate and Energy; The Stationery Office: Northway, London, UK, 2009. [Google Scholar]
- IRENA. Renewable Energy Policy Brief—Uruguay; International Renewable Energy Agency: Abu Dhabi, UAE, 2015. [Google Scholar]
- United Nation. Transforming our World: The 2030 Agenda for Sustainable Development; Division for Sustainable Development Goals: New York, NY, USA, 2015. [Google Scholar] [CrossRef]
- Briggs, H.G.; Leong, H.K. Malaysia Stocktaking Report on Sustainable Transport and Climate Change—Data, Policy, and Monitoring. 2016. Available online: http://www.mot.gov.my/SiteCollectionDocuments/Darat/MY_StockTakingReport_Final.pdf (accessed on 3 December 2019).
- Eleventh Malaysia Plan. In ELEVENTH MALAYSIA PLAN (2016–2020); Economic Planning Unit, Prime Minister’s Department: Kuala Lumpur, Malaysia, 2016.
- Yaacob, N.F.F. Spatial Relationship between Road Characteristics and Environmental Factors towards Road Accident in Kedah; Universiti Teknologi MARA: Kuala Lumpur, Malaysia, 2019. [Google Scholar]
- World Health Organization (WHO). Global Status Report on Road Safety. Available online: https://www.who.int/violence_injury_prevention/road_safety_status/2018/en/ (accessed on 24 January 2020).
- National Transport Policy (NTP). National Transport Policy 2019–2030; Ministry of Transport Malaysia: Putrajaya, Malaysia, 2019.
- SCOOP Portal. Industry 4.0: The Fourth Industrial Revolution—Guide to Industry 4.0. 2020. Available online: https://www.i-scoop.eu/industry-4-0/ (accessed on 3 December 2019).
- Kanniah, K.D. Low Carbon Society Blueprint for ISkandar Malaysia 2025; UTM-Low Carbon Asia Research Center: Johor bahru, Malaysia, 2013. [Google Scholar]
- Adnan, A.S. My100, My50 Lonjak 40 Peratus Pengguna rel, Bas Prasarana. Berita Harian Online: Kuala Lumpur, Malaysia. Available online: https://www.bharian.com.my/berita/nasional/2019/05/567349/my100-my50-lonjak-14-peratus-pengguna-rel-bas-prasarana (accessed on 24 January 2020).
- GreenTech Malaysia. Low Carbon Mobility; GreenTech Malaysia Portal: Selangor, Malaysia. Available online: https://www.greentechmalaysia.my/our-services/low-carbon-mobility/ (accessed on 24 January 2020).
- ASEAN Jakarta. Sustainable Land Transport Indicators on Energy Efficiency and Greenhouse Gas Emissions in ASEAN—Guidelines; ASEAN Secretariat: Jakarta, Indonesia, 2019. [Google Scholar]
© 2020 by the authors. Licensee MDPI, Basel, Switzerland. This article is an open access article distributed under the terms and conditions of the Creative Commons Attribution (CC BY) license (http://creativecommons.org/licenses/by/4.0/).