Abstract
Urban rail transit has received much attention in the last two decades, and a significant number of cities have established urban rail transit networks (URTNs). Although URTNs have brought enormous convenience to the daily life of citizens, system failures still frequently occur, therefore the vulnerability of URTNs must be a concern. In this paper, we propose a novel measurement called the node strength parameter to assess the importance of nodes and present a redundant recovery scheme to imitate the system recovery of URTNs subjected to failures. Employing three malicious attacks and taking the Nanjing subway network as the case study, we investigated the network vulnerability under scenarios of different simulated attacks. The results illustrate that passenger in-flow shows the negligible impact on the vulnerability of the node, while out-flow plays a considerable role in the largest strength node-based attack. Further, we find that vulnerability will decrease as passenger out-flow increases, and the vulnerability characteristics are the same with the increase in the construction cost of URTNs. Considering different attack scenarios, the results indicate that the highest betweenness node-based attack will cause the most damage to the system, and increasing the construction cost can improve the robustness of URTNs.
1. Introduction
In 1863, the UK opened the first subway line in the world, in London; since then, many metropolises have constructed their own urban rail transit systems. In the 21st century, more and more people have immigrated to cities, which have expanded rapidly, hence urban rail transit has been given increasing attention in recent decades. To relieve traffic congestion, improve living conditions and decrease urban pollution, many cities have constructed their own URTNs. Taking China as an example, more than 40 cities have built URTNs in the last thirty years. Urban rail transit is an extraordinarily complicated system, and minor incidents may lead to unacceptable results, such as injuries, deaths, or property loss. It is known that accidents involving URTNs around the world may cause serious results; therefore, more attention should be given to this topic, as well as more effort made in studies to decrease the intensity and frequency of accidents.
Many studies have discussed the vulnerability and robustness of URTNs, and many useful results have been obtained in the last two decades, which can be divided into two categories. In the first category, researchers mainly focus on the vulnerability and robustness of the topological structures of URTNs. Derrible and Kennedy [1] took 33 subway networks as examples to analyze the complexity and robustness of URTNs, and presented a method to improve their robustness. Zhang et al. [2] applied complex network theory and methods to analyze networked characteristics and considered Shanghai subway network as an example to investigate the vulnerability of URTNs subjected to failures. Sun and Guan [3] assessed the vulnerability of the Shanghai subway network by coupling station degree and betweenness as the station intensity; Sun et al. [4] also studied the vulnerability of the Beijing metro network based on the multi-static weighted method. Sun et al. [5] analyzed the vulnerability of the Shanghai urban rail network, while Yang et al. [6] used complex network theory to assess the robustness of the Beijing subway network. Zhang and Wang [7] investigated the transportation functionality vulnerability of URTNs based on moving block technology and took the Nanjing subway network as an example to illustrate the feasibility and effectiveness of the presented model. De-Los-Santos et al. [8] evaluated the passenger robustness of rail transit networks from two aspects, i.e., without-bridging and with-bridging interruptions; Lu [9] modeled the resilience of URTNs based on operational incidents, while Wang et al. [10] considered the Shanghai subway network as an example to investigate robustness using a multiple perspective method. Zhang et al. [11] proposed a framework to assess resilience based on the performance loss of triangle stations and quantified the vulnerability of the Shanghai subway network subjected to random and intentional attacks. Sun et al. [12] employed the tap-in and tap-out data on passenger distribution to estimate the influences of three common disruptions of URTNs. Shang et al. [13] integrated Lagrangian and Eulerian observations to estimate the passenger flow state according to a space-time-state, hyper-network-based assignment approach.
In the second perspective, many contributions studied the associated systems when evaluating network vulnerability and robustness indirectly. Sun et al. [14] proposed an integrated Bayesian approach to assign passenger flow in URTNs; Wei and Chen [15] used empirical mode decomposition and neural network methods to forecast the short-term passenger flow of URTNs. The above two studies employed mathematical theory and methods to analyze and predict passenger flow to improve the robustness of URTNs. Yang et al. [16] took the Beijing subway network as an example to measure route diversity; Saidi et al. [17] analyzed the long-term planning for ring-radial rail systems, and Raveau et al. [18] compared the passenger behavior for route choice in URTNs from five aspects. These three studies investigated route-planning to boost robustness.
Certainly, there are many related studies which analyze the delays, disruptions, and line utilization of rail transit systems. Luxton et al. [19] used software packages to conduct risk assessment analysis on different sections of the railway station, and formulated mitigation measures to eliminate these weaknesses in the system to prevent terrorist attacks. Potti et al. [20] used SIMUL8 computer software to establish a railway system simulation model, and analyzed the scope when moving an urban freight on rail by evaluating the utilization levels of the Cross-City railway line in the UK. Wales et al. [21] addressed these issues by first developing an event-based simulation using Simul8 software to analyze the current system’s performance and its response to delays. Marinov et al. [22] studied the organization, plan, and management of train movements, and described the analytical methods, simulation techniques and specific computer packages for analyzing and evaluating the behavior of rail systems and networks. The aforementioned studies indicate that rail transit networks have been given increasing attention from many perspectives in the last two decades, which shows their importance in the daily life of citizens.
Although many methodologies have been applied to study the vulnerability of URTNs subjected to various failure types, most studies have only considered topology and few studies have focused on redundancy. Therefore, this paper will adopt a real passenger flow and redundant system to analyze the vulnerability of URTNs. The rest of the paper is organized as follows: Section 2 analyzes topological characteristics and takes the Nanjing subway network as an example to discuss network characteristics. Section 3 presents a new assessment model of network vulnerability using a redundant system, and the node strength is redefined based on passenger flow. Section 4 employs three types of malicious attacks to assess network vulnerability and the Nanjing subway network is considered as an example to illustrate the feasibility and effectiveness of the proposed model. Finally, conclusions are drawn in Section 5.
2. Structural Characteristics of URTNs
In this section, we analyzed topological features of URTNs and topological networks can be abstracted from URTNs. In a URTN, the station and rail are represented by the node and edge of a complex network, respectively, and the edge can reflect an interaction between two directly connected nodes. In general, a subway network can be represented by an graph , where is the set of nodes and is the set of edges, is the number of nodes, if the node is directly connected with node , and if node is not directly connected with node .
This section takes the Nanjing subway network as an example case to analyze the topological characteristics of URTNs. The first line of Nanjing subway opened on May 15, 2005, and there are seven operation lines (including 1, 2, 3, 4, 10, S1, S8), 129 stations, and 133 rails in Nanjing subway network, shown in Figure 1. It can also be found that the largest degree station (or node) is Nanjingnan station, with degree 5, while there are eight stations with degree 4, one station with degree 3, one hundred and seven stations with degree 2 and twelve stations with degree 1.
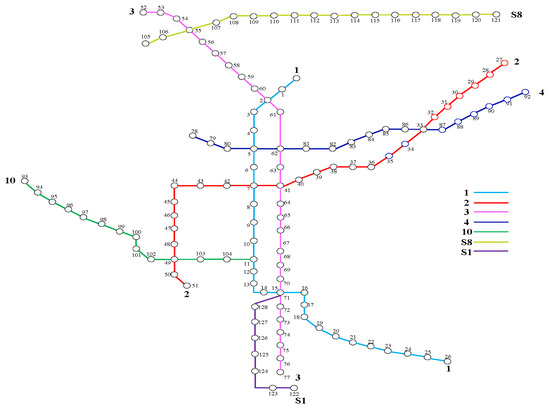
Figure 1.
The operation route of Nanjing subway network.
2.1. Network Property on Station
In this subsection, two network parameters are employed to analyze network properties. Node degree indicates the number of edges connected to the node, and the degree of the i-th node is defined as follows
where the degree indicates the number of nodes directly connected to the node , hence the degree of station reflects the local connectivity of URTNs.
Node betweenness is described by the number of shortest paths between all pairs of nodes passing this node, and reflects the importance of the node over the network, and the node betweenness [6,9,23] of the i-th node is denoted by
where is the number of shortest paths between and , is the number of shortest paths from to through the node in . The betweenness is often used to describe the transport ability of the station of URTNs, and therefore nodes with a high betweennesses play vital roles in the transport ability of URTNs.
2.2. Node Strength on Station
In the current approaches, the cross-section passenger flow is regarded as passenger flow of a station, however, the cross-section passenger flow cannot give a detailed representation of the real passenger flow of the node. In this subsection, the passenger flow of a station is described by the passenger in-flow and out-flow, and given as follows
where represents the passenger flow of node , and denote the in-flow and out-flow of node , respectively.
There are few studies discussing the node strength which is represented by the original passenger flow [4], and as the actual node strength is larger than the original passenger flow, it can reflect the robustness of URTNs subjected to congestions. Therefore, the node strength of node is described by the following formula
where is the number of nodes directly connected to the node , denotes the passenger in-flow from the node to node , denotes the out-flow from the node to node , and are tunable parameters and used to measure the node strength of URTNs, when , the node strength is the original passenger flow of the station and Table 1 shows that the largest strength node is Zhujianglu station.

Table 1.
Top five stations based on network parameters of Nanjing subway.
In this paper, the parameters and reflect the changes in the passenger in-flow and out-flow. Meanwhile, passenger in-flow and out flow will increase with the increase in citizens, and the node strength must be given a large redundancy for future safety from congestions or disturbances. Although this study is theoretical, it will present some constructive suggestions for new URTNs. Figure 2 presents the node strength of Zhujianglu station with different parameters ; when , the node strength denotes the original passenger flow. Figure 2 gives a visualization of the node strength and shows that the node strength becomes larger and larger with the increase in tunable parameters , and the increase rates of node strength are different to each other, which indicates that there is not a linear increase in node strength with the increase in tunable parameters.
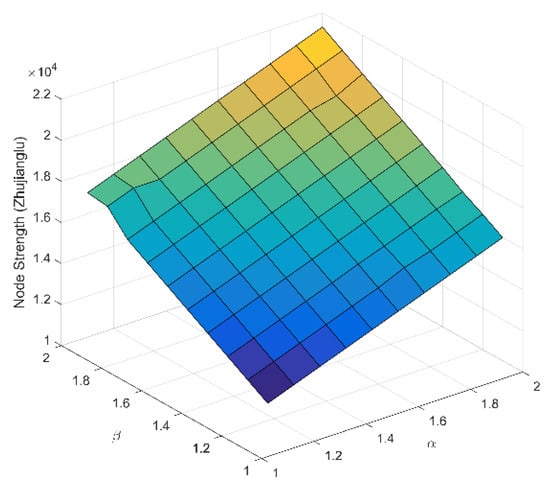
Figure 2.
Node strength on Zhujianglu station versus different tunable parameters.
Table 2 gives the top five stations about node strength with different parameters and , and it shows that the largest strength nodes are Zhuajinglu station and Xinjiekou station under all scenarios. It is known that node strength reflects the transport ability of the station; therefore, these top five stations must be given prior concerns and protections to improve the robustness of Nanjing subway network.
Table 2.
Top five stations based on strength with tunable parameters.
3. Failure Model with Redundant Recovery
It is well known that the subway network is very fragile when suffering malicious attacks, which illustrates that failures will cause many damages to subway network, and serious failure sometimes may lead to injuries or even deaths. Therefore, the subway should pay more attention to improving this situation. In this section, a new methodology is proposed to assess the vulnerability of URTNs based on emergency management, and the node capacity, failure propagation, and redundant recovery are analyzed to construct the failure model of URTNs subjected to malicious attacks.
3.1. Node Capacity of Station
Node capacity, referring to the maximum flow tolerance of a station in UTRNs, can often reflect the collection and dispersion ability. In the existing study, the node capacity was discussed by the degree and betweenness, and the coupled relationship between degree and betweenness. In this study, the coupling relationship between degree and betweenness is used to discuss the vulnerability of rail transit. In this paper, the node capacity of station is described by the real passenger flow and can reflect the actual station state [4]. The node capacity on station of subway network is defined as follows [4,10,24]
where denotes the tolerance parameter, which can describe the construction cost of the station, ranging from , and is the original passenger flow of the station . Meanwhile, the node capacity equals the original passenger flow when , hence the node capacity will increase with the increase in the tolerance parameter . Equation (5) has been widely accepted in studies focusing on the vulnerability and robustness of complex networks.
3.2. Failure Mechanism
In this subsection, the failure mechanism of network is analyzed to address cascading dynamics of failures. In other words, when a node suffers from failures or attacks, there will always be a redistributing process of passenger flow, and the visualization graph of redistribution is illustrated in Figure 3, which is a direct graph and similar to the graph discussed in [22]. For instance, when the i-th node fails, the related in-flow edges will be disconnected from this node according to the model of passenger flow, which means that no more passengers could arrive at the i-th node, but passengers on out-flow edges still could depart to neighbor nodes, such as the j-th node. Therefore, it can be directly observed that the neighbor node will suffer increasing flow pressure, and then this pressure will be transferred to the second neighbor nodes.
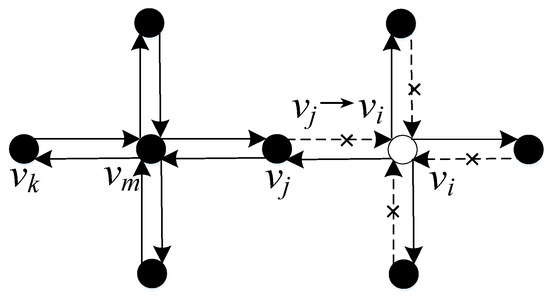
Figure 3.
Visualization of the passenger flow redistribution after the node failure.
In this paper, the extra pressure from node to due to the failure of could be defined in the form of passenger flow as follows
where the notation denotes the redistributing direction from the departure node to the destination node, and is the passenger flow from node to , is the current number of neighbor nodes of the node after the failure of node . When the total flow exceeds its tolerance, namely , cascading failures will be triggered. Otherwise, it will be safe.
3.3. Recovery Mechanism
As many studies demonstrations, the node under failures could not get healed by itself, and it needs external materials to recover and function again. However, this also shows that, given enough time, nodes could recover from congestion disturbances by passenger self-organization. When the node passenger flow exceeds the node capacity, a self-recovery function depicted by passenger flow with a time variable , is required to describe the self-healing process. Through this function, it is clearly illustrated how the extra or overloaded passenger flow will be redistributed. Therefore, when , the function could be defined as follows
where represents the self-recovery function, and denotes the self-healing factor. represents flow rate without failures, denotes the passenger flow rate under cascading failures. describes the current passenger flow at the time .
4. Vulnerability Assessments of URTNs
In this section, the vulnerability of URTNs is assessed under cascading failures. Three malicious attacks are employed to discuss characteristic changes in the maximum effective group (MEG) of URTNs, and MEG is described as follows
where is the number of nodes in MEG after cascading failures, and is the total number of nodes.
4.1. Vulnerability Analysis under the Largest Strength Node-Based Attack
This subsection discusses the vulnerability of URTNs subjected to the largest strength node-based attack (LSA), and LSA is the attack of the node with the largest strength. Meanwhile, the Nanjing subway network is taken as an example to analyze characteristic changes in MEG based on different parameters. Figure 4 and Figure 5 present characteristic changes in MEG when and , respectively, for the Nanjing subway network. From these two figures, it can be found that for the same tolerance parameter and the same tunable parameter , the Nanjing subway network displays a great vulnerability and shows the same vulnerability as when subjected to LSA for a different parameter , which indicates that different parameter will have little effect on the characteristic changes in URTNs. Meanwhile, it could be observed that the robustness of Nanjing subway network when is better than when .
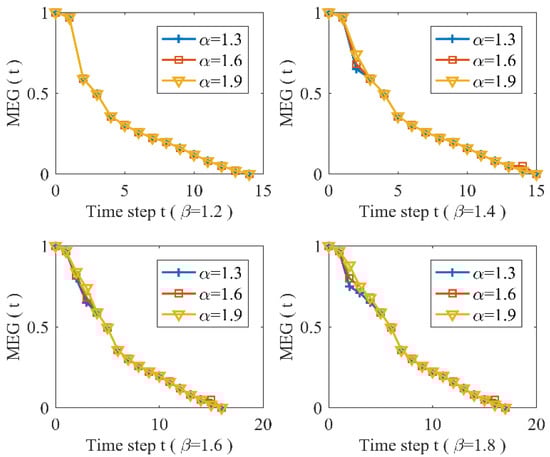
Figure 4.
The maximum effective group changes for
and different .
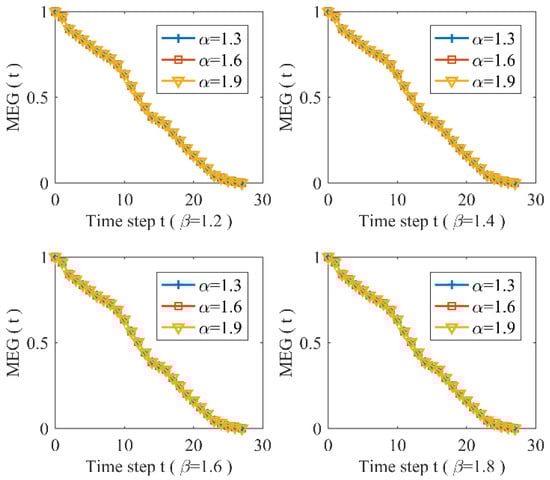
Figure 5.
The maximum effective group changes for
and different .
Figure 6 and Figure 7 describe characteristic changes in MEG when and with different of Nanjing subway network subjected to LSA respectively, and they also indicate that URTNs are very vulnerability when suffering malicious attacks. Figure 6 illustrates that the vulnerability characteristics of URTNs possess the same changing trends when , and it shows that MEG increases as the tunable parameter increases with a fixed , which demonstrates that URTNs become more robust during the redundant recovery. Figure 7 addresses the vulnerability characteristics of URTNs for ; it shows that URTNs are very vulnerable under the LSA, and the MEG exhibits the same vulnerability for a fixed tunable parameter and different tunable parameter . Taking both Figure 6 and Figure 7 into consideration, it can be found that the vulnerability of URTNs becomes more similar as the tolerance parameter increases.
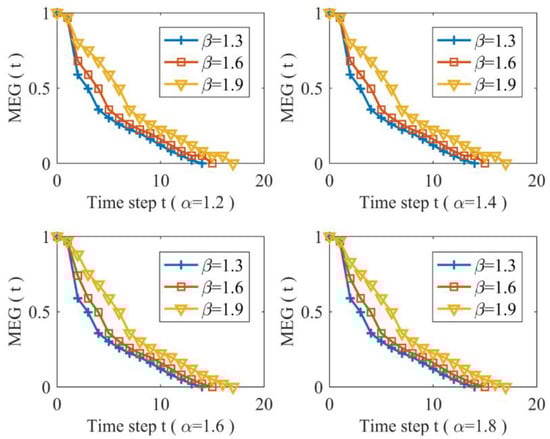
Figure 6.
The maximum effective group changes for
and different .
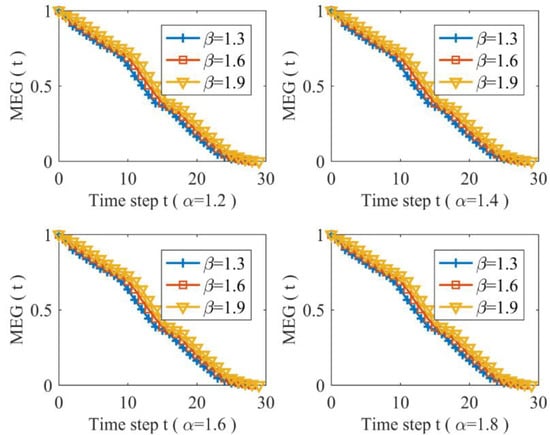
Figure 7.
The maximum effective group changes for
and different .
4.2. Comparison Analysis on Vulnerability under Different Attacks
In this subsection, the largest degree node-based attack (LDA), the highest betweenness node-based attack (HBA) and the largest strength node-based attack (LSA) are employed to analyze the cascading failures of URTNs with redundant recovery based on the proposed methodology, LDA is the attack to the node with the largest degree, and HBA is the attack to the node with the highest betweenness. Moreover, the Nanjing subway network is used as the example to investigate the vulnerability of URTNs subjected to three malicious attacks with a different tolerance parameter and the same tunable parameters .
Figure 8 presents characteristic changes in MEG with a different tolerance parameter and different attacks, and it shows that three malicious attacks will lead to the same damages to Nanjing subway network for . Meanwhile, it can be found that HBA will cause the most damage to the Nanjing subway network for , which means that HBA is the most effective method to destroy UTRNs, hence the nodes with a higher betweennesses must be given more protections. Moreover, it can be discovered that the network becomes more robust as the tolerance parameter increases. Furthermore, Figure 8 illustrates that the Nanjing subway network exhibits some certain robustness subjected to LSA, and the MEG will not change when and . Therefore, it is demonstrated in Figure 8 that the topology is a critical aspect to improve the robustness of URTNs, and nodes with larger degrees and a higher betweennesses are more important than nodes with merely a larger strength.
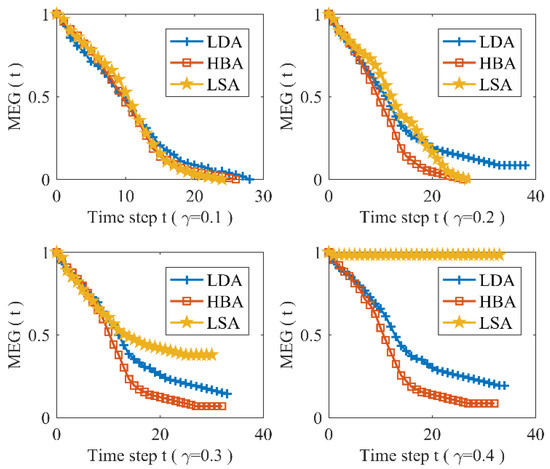
Figure 8.
The maximum effective group changes under different attacks.
Figure 9 presents characteristic changes in the vulnerability of URTNs subjected to HBA, while Figure 10 and Figure 11 exhibit characteristic changes in the vulnerability of URTNs subjected to LDA and HBA, respectively. It is observed that URTNs become more robust as the tolerance parameter increases, which indicates that the large construction cost could improve the robustness of the network. Meanwhile, Figure 9 and Figure 10 indicate that there are no cascading failures when , and Figure 11 shows that there are no cascading failures when ; both results show that HBA and LDA may cause more serious damages than LSA. Therefore, nodes with larger degrees and higher betweennesses must be given more protections in the future.
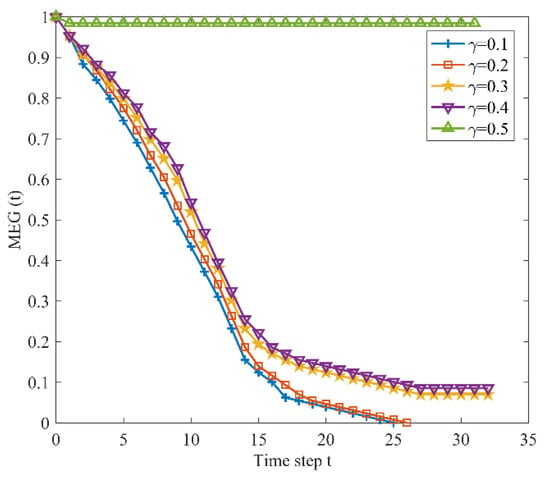
Figure 9.
The maximum effective group changes subjected to highest betweenness node-based attack.
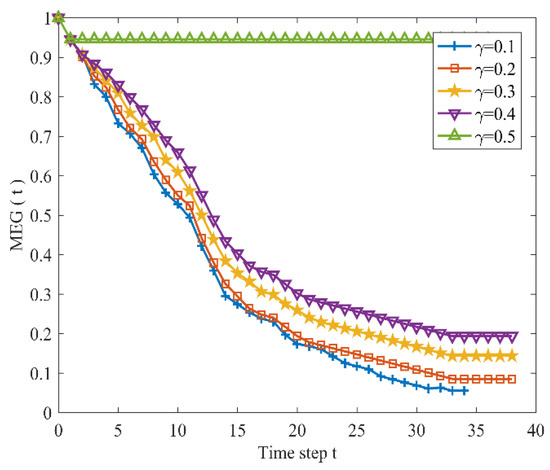
Figure 10.
The maximum effective group changes subjected to largest degree node-based attack.
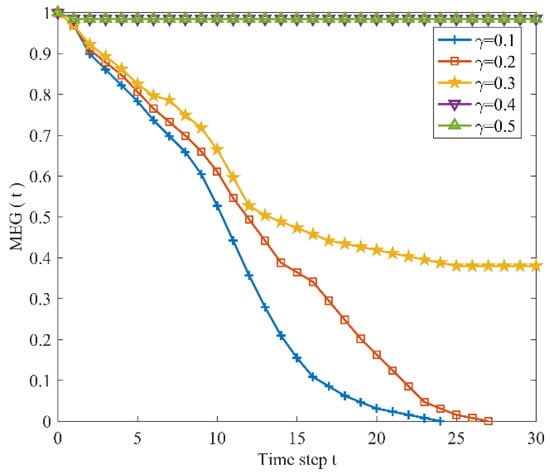
Figure 11.
The maximum effective group changes subjected to largest strength node-based attack.
This section analyzes the vulnerability of URTNs, and we found that URTNs are very vulnerable subjected to three malicious attacks. The results show that the passenger in-flow has a small influence on the vulnerability, while the passenger out-flow has a large influence on the vulnerability under the proposed model. Therefore, the critical nodes of URTNs must be given advanced protections and the emergency management for passenger out-flow must be planned in the early design program. Moreover, the results indicate that the highest betweenness node-based attack is the most effective destroy URTNs, which also tell us that the node with the highest betweenness must be given the most protection in UTRNs. Furthermore, results also show that the robustness will increase with the increase in the node capacity of URTNs, which illustrates that increasing the node capacity will improve the robustness of URTNs; that is to say, increasing the construction cost will improve the robustness of the URTNs. In actual URTNs, the robustness can be improved by increasing the construction costs, which can expand the node capacity and improve the emergent ability of urban rail transit systems.
5. Conclusions
In this paper, a novel node strength indicator is proposed to measure the importance of nodes by the passenger flow of URTNs, and a redundant recovery scheme is applied to simulate the recovery system of URTNs subjected to failures. Meanwhile, malicious attacks, including HBA, HBA and LSA, are employed to model the three most severe failures of nodes, and the Nanjing subway network is taken as the example to prove the feasibility and effectiveness of the proposed model. The results indicate that the in-flow exhibits an ignorable impact on the vulnerability, and the out-flow plays an essential role in the vulnerability of URTNs. Moreover, conclusions could also be drawn that nodes with larger degrees and higher betweennesses are more important than those with larger strength, which means these important nodes should be given more protection in the future.
Author Contributions
Investigation and writing, J.Z. and S.W.; Methodology and editing, Z.W.; Resources, W.S.; Review, S.L. All authors have read and agreed to the published version of the manuscript.
Funding
This research was jointly funded by Qinglan Project of Jiangsu Higher Education Institutions of China, grant number 2020, Xuzhou Science and Technology Project of China, grant number KC19006 and the National Natural Science Foundation of China, grant number 61673197 and 61801197, and the APC was funded by KC19006.
Conflicts of Interest
The authors declare no conflict of interest.
References
- Derrible, S.; Kennedy, C. The complexity and robustness of metro networks. Physica A 2010, 389, 3678–3691. [Google Scholar] [CrossRef]
- Zhang, J.; Zhao, M.; Liu, H.; Xu, X. Networked characteristics of the urban rail transit networks. Physica A 2013, 392, 1538–1546. [Google Scholar] [CrossRef]
- Sun, D.J.; Guan, S. Measuring vulnerability of urban metro network from line operation perspective. Transp. Res. Part A 2016, 94, 348–359. [Google Scholar] [CrossRef]
- Sun, L.; Huang, Y.; Chen, Y.; Yao, L. Vulnerability assessment of urban rail transit based on multi-static weighted method in Beijing, China. Transp. Res. Part A 2018, 108, 12–24. [Google Scholar] [CrossRef]
- Sun, D.; Zhao, Y.; Lu, Q.C. Vulnerability analysis of urban rail transit networks: A case study of Shanghai, China. Sustainability 2015, 7, 6919–6936. [Google Scholar] [CrossRef]
- Yang, Y.; Liu, Y.; Zhou, M.; Li, F.; Sun, C. Robustness assessment of urban rail transit based on complex network theory: A case study of the Beijing Subway. Saf. Sci. 2015, 79, 149–162. [Google Scholar] [CrossRef]
- Zhang, J.; Wang, M. Transportation functionality vulnerability of urban rail transit networks based on movingblock: The case of Nanjing metro. Physica A 2019, 535, 122367. [Google Scholar] [CrossRef]
- De-Los-Santos, A.; Laporte, G.; Mesa, J.A.; Perea, F. Evaluating passenger robustness in a rail transit network. Transp. Res. Part C 2012, 20, 34–46. [Google Scholar] [CrossRef]
- Lu, Q. Modeling network resilience of rail transit under operational incidents. Transp. Res. Part A 2018, 117, 227–237. [Google Scholar] [CrossRef]
- Wang, S.; Nie, S.; Zhao, L.; Stanley, H.E. A multiple perspective method for urban subway network robustness analysis. AIP Adv. 2018, 8, 075219. [Google Scholar] [CrossRef]
- Zhang, J.; Wang, S.; Wang, X. Comparison analysis on vulnerability of metro networks based on complex network. Physica A 2018, 496, 72–78. [Google Scholar] [CrossRef]
- Sun, H.; Wu, J.; Wu, L.; Yan, X.; Gao, Z. Estimating the influence of common disruptions on urban rail transit networks. Transp. Res. Part A 2016, 94, 62–75. [Google Scholar] [CrossRef]
- Shang, P.; Li, R.; Guo, J.; Xian, K.; Zhou, X. Integrating Lagrangian and Eulerian observations for passenger flow state estimation in an urban rail transit network: A space-time-state hyper network-based assignment approach. Transp. Res. Part B 2019, 121, 135–167. [Google Scholar] [CrossRef]
- Sun, L.; Lu, Y.; Jin, J.; Lee, D.H.; Axhausen, K.W. An integrated Bayesian approach for passenger flow assignment in metro networks. Transp. Res. Part C 2015, 52, 116–131. [Google Scholar] [CrossRef]
- Wei, Y.; Chen, M. Forecasting the short-term metro passenger flow with empirical mode decomposition and neural networks. Transp. Res. Part C 2012, 21, 148–162. [Google Scholar] [CrossRef]
- Yang, X.; Chen, A.; Ning, B.; Tang, T. Measuring route diversity for urban rail transit networks: A case study of the Beijing metro network. IEEE Trans. Intell. Transp. Syst. 2017, 18, 259–268. [Google Scholar] [CrossRef]
- Saidi, S.; Wirasinghe, S.C.; Kattan, L. Long-term planning for ring-radial urban rail transit networks. Transp. Res. Part B 2016, 86, 128–146. [Google Scholar] [CrossRef]
- Raveau, S.; Guo, Z.; Muñoz, J.C.; Wilson, N.H.M. A behavioural comparison of route choice on metro networks: Time, transfers, crowding, topology and socio-demographics. Transp. Res. Part A 2014, 66, 185–195. [Google Scholar] [CrossRef]
- Luxton, A.; Marinov, M. Terrorist Threat Mitigation Strategies for the Railways. Sustainability 2020, 12, 3408. [Google Scholar] [CrossRef]
- Potti, P.; Marinov, M.; Sweeney, E. A Simulation Study on the Potential of Moving Urban Freight by a Cross-City Railway Line. Sustainability 2019, 11, 6088. [Google Scholar] [CrossRef]
- Wales, J.; Marinov, M. Analysis of delays and delay mitigation on a metropolitan rail network using event based simulation. Simul. Model. Pract. Theory 2015, 52, 52–77. [Google Scholar] [CrossRef]
- Marinov, M.; Sahin, I.; Ricci, S.; Vasic-Franklin, G. Railway operations, time-tabling and control. Res. Transp. Econ. 2013, 41, 59–75. [Google Scholar] [CrossRef]
- Freeman, L.C. A set of measures of centrality based on betweenness. Sciometry 1977, 40, 38–41. [Google Scholar] [CrossRef]
- Motter, A.E.; Lai, Y.C. Cascade-based attacks on complex networks. Phys. Rev. E 2002, 66, 065102. [Google Scholar] [CrossRef] [PubMed]
© 2020 by the authors. Licensee MDPI, Basel, Switzerland. This article is an open access article distributed under the terms and conditions of the Creative Commons Attribution (CC BY) license (http://creativecommons.org/licenses/by/4.0/).