1. Introduction
Currently, the use of information and communication technologies (ICTs) is included in all the activities of society. Universities are not far behind, and include ICTs in most of their processes. These processes integrate the administrative management on which the existence of the universities depends or use them as support for academic management [
1]. The most extended use of ICTs for academic management is the learning management system (LMS) [
2] that supports online interaction between teachers and students. However, there are scenarios in which specific support by ICTs is needed to solve common problems centered on learning. These scenarios allow ICTs to apply new models and educational methods in student learning. A guide to this may be the personalization that companies have achieved with their customers through data analysis models that allow managers, executives and analysts to discover trends and improve the services and products they offer to their customers.
Personalized service can be introduced to educational environments where the process is similar to that applied at the business level, but the objective in education is to improve the methods or activities that generate learning in students [
3]. Learning environments are based primarily on a range of interactive and delivery services. Personalized learning recommendation systems can provide learning recommendations to students based on their needs [
4,
5]. Companies use data analysis architectures whose results help them make decisions about their business. These architectures are called business intelligence (BI); their ability to extract data from different sources, process them and turn them into knowledge is a solution that can be also included in the educational management of a university [
6].
As a precedent, it is important to consider that several universities use a BI platform with an administrative or operational focus, which helps them make decisions in the financial management of the institution [
7]. In the same way, previous works [
8,
9] have performed an analysis of desertion rates considering models and statistical tools with the use of economic and academic variables, segmenting the analysis into whether students have enrolled or not in the next semester. This formula is perfectly valid; however, it leaves aside the causes that determined why students abandon their studies. By contrast, our proposal is differentiated by its ability to analyze the data of students’ academic activities and focus on the learning problems they present. This analysis helps make decisions in educational management and the improvement of the learning methods established by teachers [
10].
In this work, three research questions are proposed that help to align the concepts and processes in their design; in addition, they seek to establish the current situation of the environment where this work is carried out:
Is the execution of a BI architecture viable for the analysis of academic data?
What are the difficulties that can be found in the implementation of a BI architecture?
In addition, do the results coincide with an educational reality that collaborates with learning?
To answer each of these questions, this work includes the description of a BI framework that bases its design on a detailed review of the previous works, the Unified Modeling Language (UML) diagram and a complete method for applying academic data mining. This work extracts data from various academic sources, processes them and allows us to identify, through data mining algorithms, the strengths and weaknesses of each student. Once the results are obtained, knowledge is generated about the learning process of each student, allowing appropriate decisions to be made in order to improve the way the student learns.
This article is organized as follows:
Section 2 reviews the existing work relating to the purpose of this study;
Section 3 describes the components and processes of the proposed framework;
Section 4 applies the method to a case study, to test the feasibility of the method; and
Section 5 presents the conclusions.
2. Related Work
The literature review presented follows the guidelines published in the methodology for systematic literature review proposed by Kitchenham et al. [
11] and by Petersen et al. [
12]. Kitchenham et al. describe how the results of a literature review in software engineering should be planned, executed and presented; Petersen et al. provide a guide on how to conduct a rigorous review of the literature and follow a systematic procedure. For our literature review, the works were grouped according to the type of tool, model, paradigm or discussion they employ in their own analysis of educational data. For this type of classification, it was necessary to know the status of scientific work in learning environments that include the use of BI techniques that improve education. The objective of this literature review is to try to learn how they do it, and what methods and techniques they use. The search string “business intelligence AND education” was selected, and only documents published during the last 5 years were considered.
The searches were made based on the information provided in the title, abstract and keywords of the works. From the selected works, a detailed reading of the introduction and conclusions was performed, in order to filter out the non-related publications.
The inclusion and exclusion criteria used for the selection of documents were the following:
Journal article: the first selection criterion is that the papers considered are journal articles, and that they are written in English.
Out of context: this criterion applies to works that do not directly relate to the research topic. These documents met the search criteria because the terms were mentioned in the text, but their contributions did not relate to the subject of this study.
Duplicated: this criterion excluded all the works whose contribution was already included in the selection of another database.
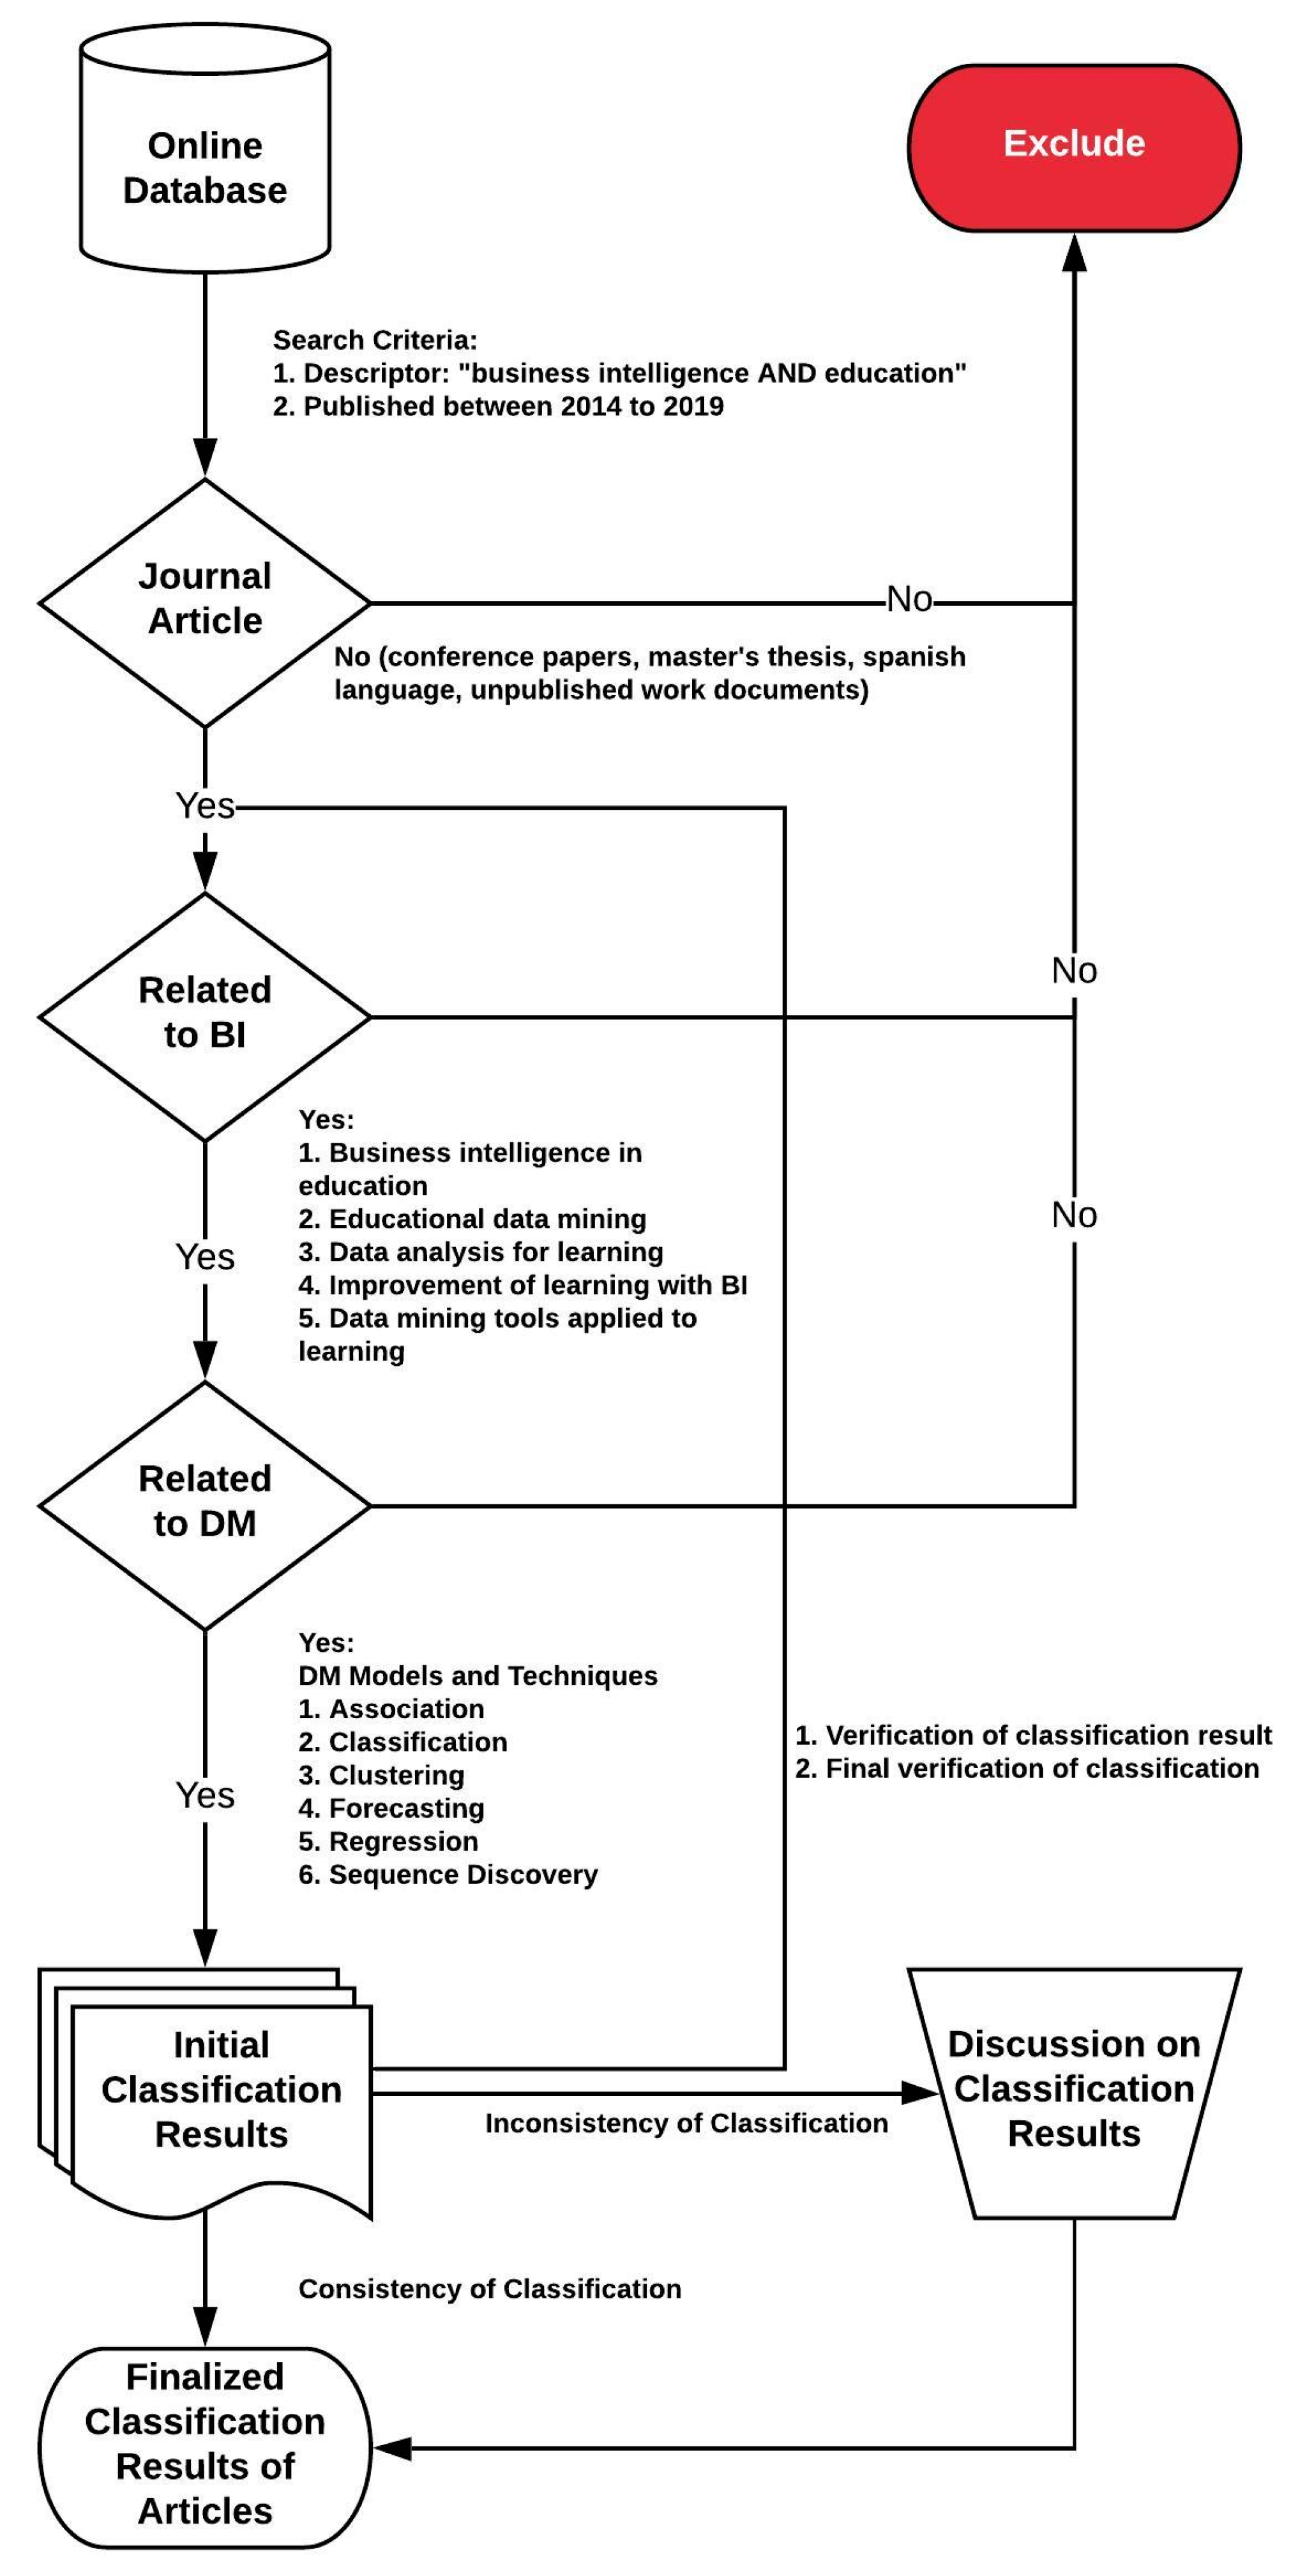
Figure 1 represents the flowchart of the bibliography selection process; the first phase collects the articles from the online databases. The string terms used to search for articles in online databases, such as Springer Link, Web of Science, ACM Digital Library, IEEE Digital Library (Xplore) and Scopus, are found in
Table 1. In the selection process, each of the articles was analyzed according to the guidelines that must be met for the design of a BI. In the next stage, we reviewed the works that included data mining applications. This filter was applied because a BI platform integrates data mining algorithms that generate knowledge of the analyzed data. These articles then passed to the classification stage and, finally, were integrated as valid literature for the study. Works that did not meet the conditions defined in the selection were automatically excluded from the process.
The works were classified according to the type, contribution and scope of the research. The articles were classified according to the type of research based on the processes proposed in [
11] and [
13], prioritizing articles in which the proposed solution to a problem is innovative or a significant extension of an existing technique. Obtaining the results of the review began with the location of the primary studies, then moved on to the extraction of the data and, finally, the categorization and the resulting scheme.
In the first search conducted of the five academic sources, 2138 documents related to the terms used in the search string were obtained. These works were filtered using several additional parameters to limit the area of action of the topics. The first filter applied was based on requiring that the search string be present in the title, as well as in the keywords. A brief review of the abstracts of the most promising articles related to the search was made, considering 169 documents. From these articles, an exhaustive review of the introduction and conclusions was performed in order to identify its guidelines and the relationship between BI and learning in universities. After this process, 20 articles were selected; these works were taken as a basis for the development of certain areas of this study.
Table 2 presents the articles considered as the basis of this study; they are classified according to the type of study. The ‘Type of study’ column depends on the proposal of the work; the different types of study than have been identified are the works that present an application, a model or a case study. The ‘Degree of incidence’ column helps to classify the works that are directly related to the study. A high level indicates that the work are closely related to the application of an integrated BI model in education. The average level indicates that the work is related to the theme when deploying a BI model applied to a specific part of an educational environment. The low level contains the works that address the issue of BI in education, but in its development, and which do not contribute a model, architecture or framework that contributes to the analysis of educational data. The ‘Article’ column contains the references of each of the works. The selected works are divided into two groups. The first group manages a lot of information on specific cases where BI platforms are used to determine improvement in academic management; this group focuses on the management of universities without accessing the academic management of students where they can detect how they learn. The other group focuses on the analysis of the data generated in certain courses, but if the analysis changes the environment, the method does not adapt to it. This is the starting point for the implementation of the BI framework, since the designed method is adapted to all possible variables that are considered in an academic environment. One important contribution of our BI framework is its versatility, and how it can be used to solve different problems that arise in their environment. The BI framework presented in this paper is founded on the gaps and needs identified during our literature review.
3. Method
For the development of the method of a BI framework for learning analytics, the seven guidelines the design science research in information systems (IS) were considered [
31]. These guidelines have been the basis for research in IS over the last few years. The research used a method that is an alternative, or complement, to the natural science approach that is dominant in IS research. In design science research, the researcher creates and evaluates ICT artifacts designed to solve the identified organizational problems [
32].
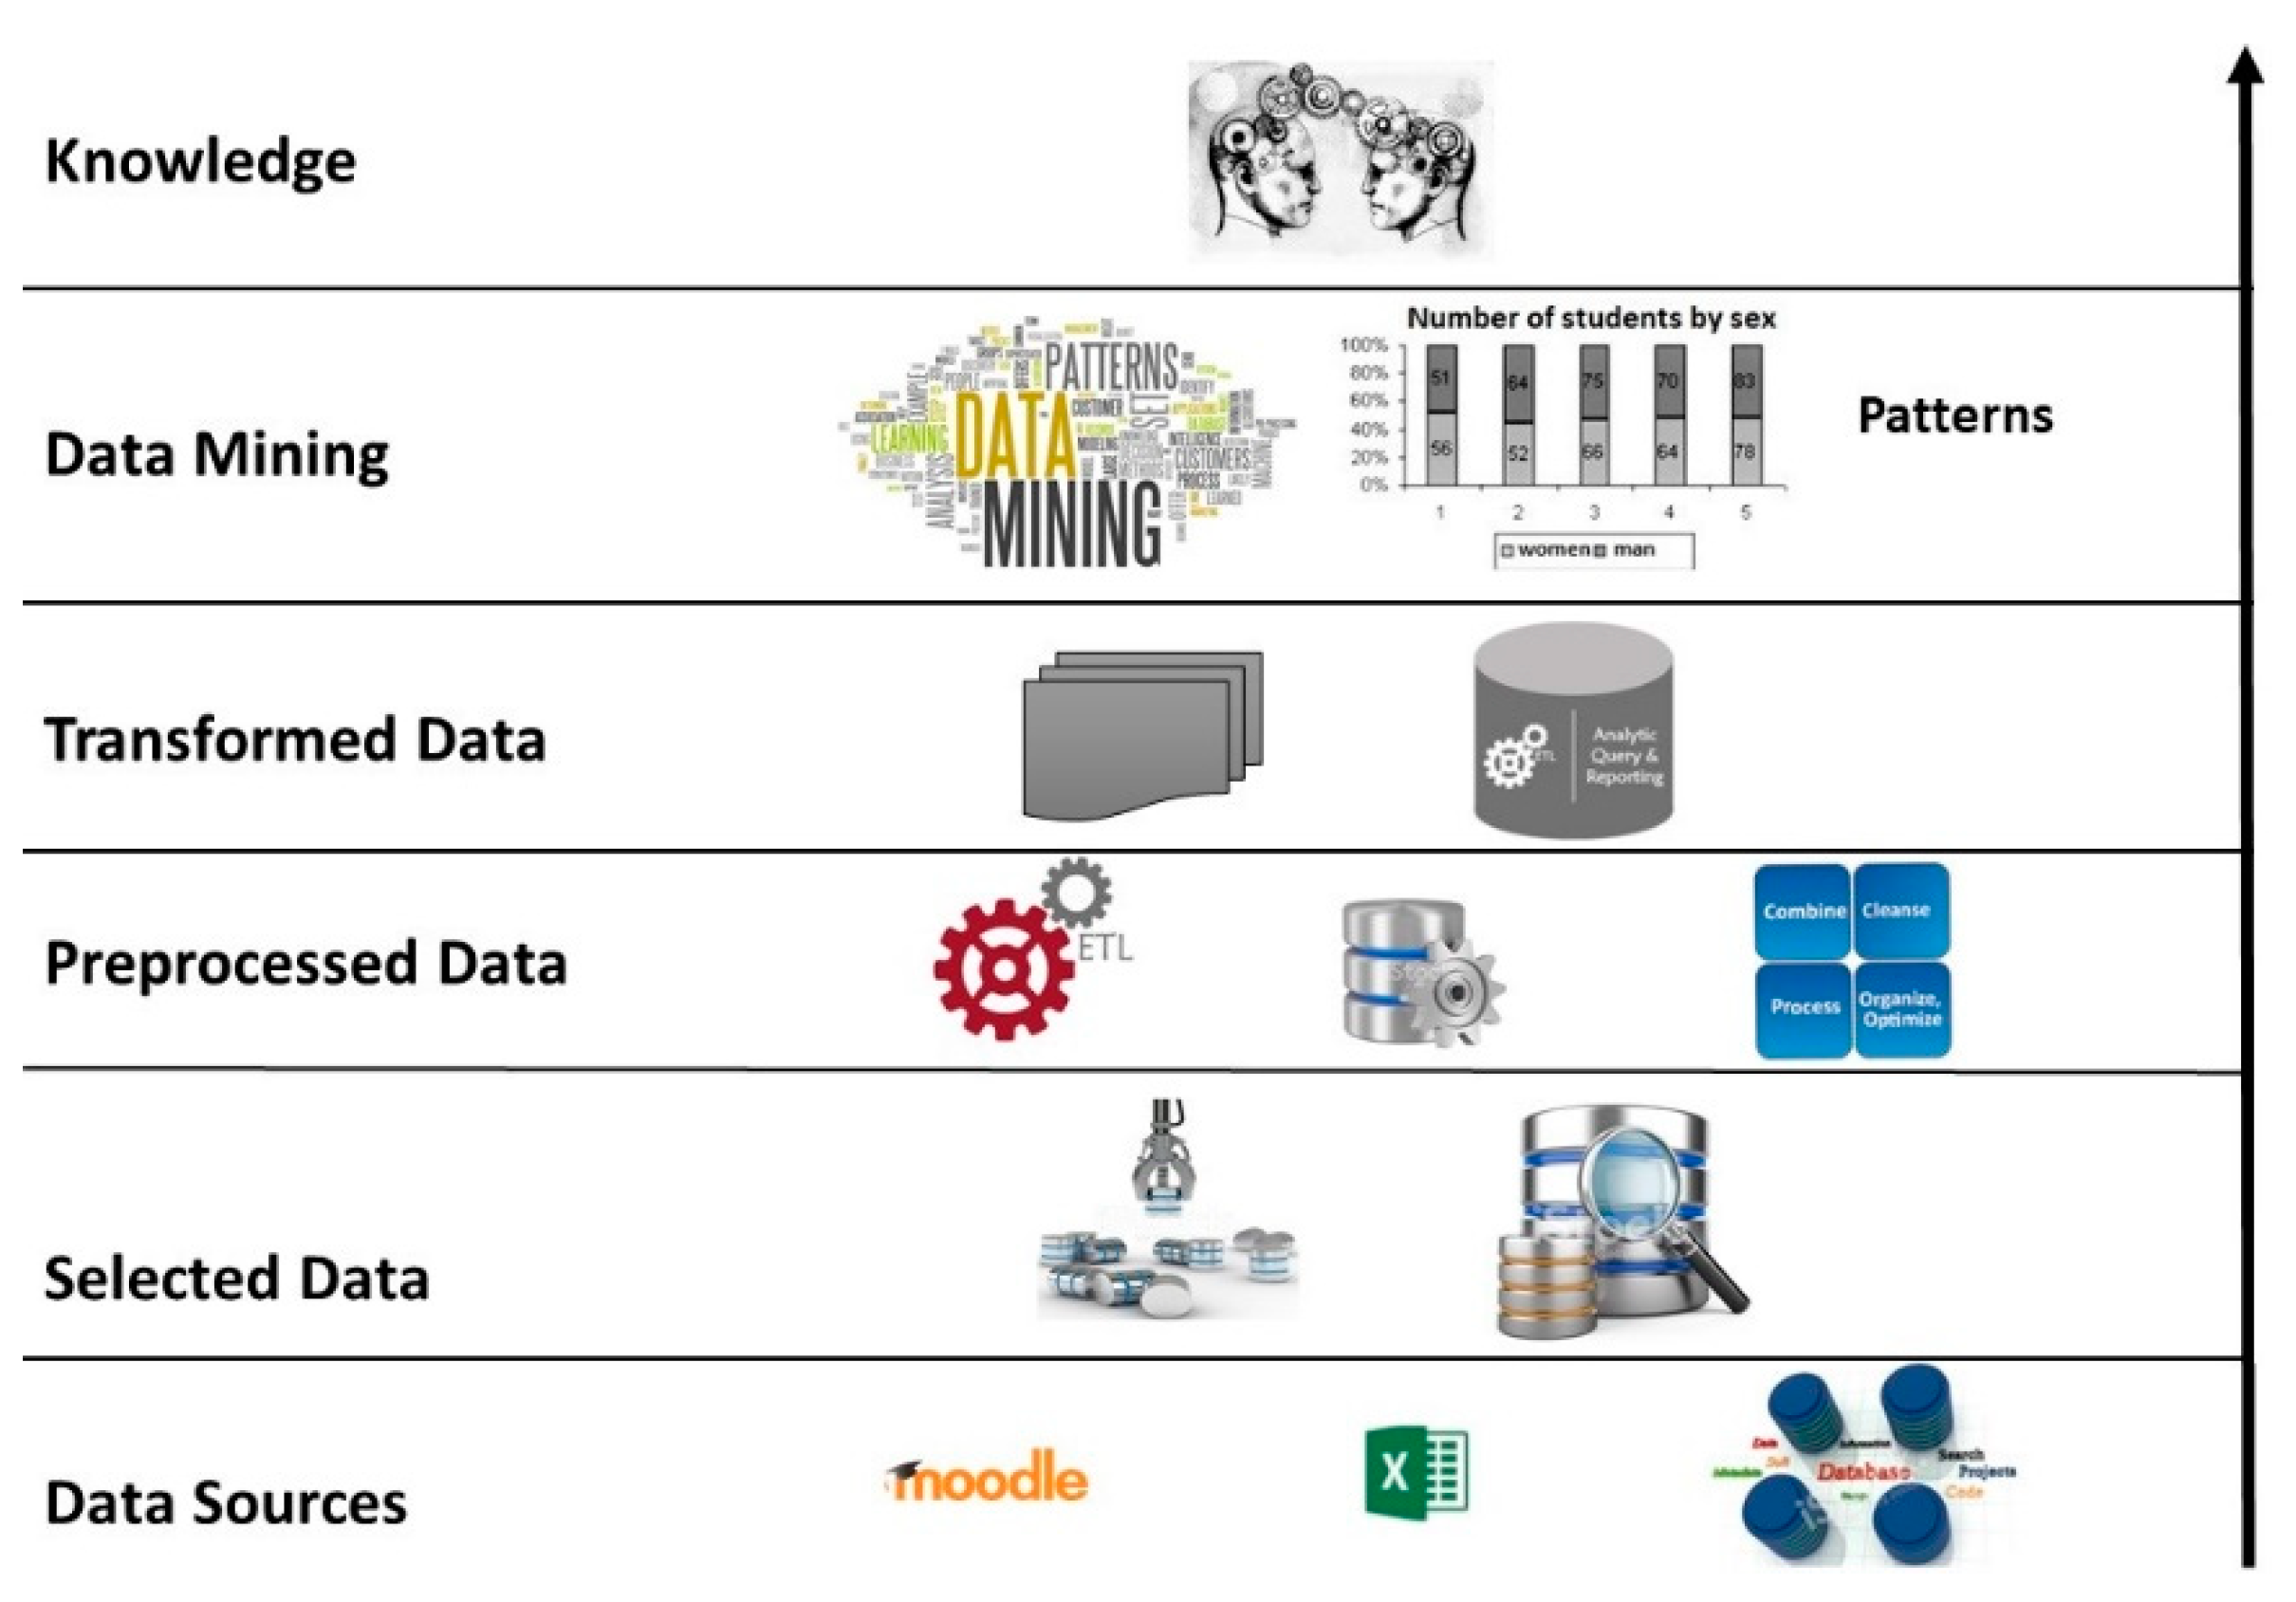
Taking the design science approach as a guide, the BI method applied to education was developed. The method of the integrated BI framework for learning analytics was composed of six stages: the selection of data sources, the selected data, the preprocessed data, the transformed data, the data mining and the discovery of knowledge.
Figure 2 details the stages considered in the implementation of the BI framework [
14]. In the following, the different stages of the BI framework are explained in detail.
Once the sources that are important in the analysis have been identified, the selection of the data is made. The objective is to avoid ambiguity, and for the BI process to guarantee quality results. This process includes a data dictionary, which is effectively a technical description for each of the repositories belonging to the university [
33]. In the data dictionary, the fields of the data, their origin, their availability and the person in charge are recorded. With the information gathered about the sources and data dictionary, the variables according to which the BI system will work are identified. In an educational environment, unlike a business one, other types of variables must be integrated that influence the analysis process. For example, the variables considered are academic, psychosocial and financial; this additional information gives flexibility to the system when it is necessary to change the object of study.
The selected data must go through a preprocessing stage; this phase involves a process of extraction, transformation and loading (ETL). The ETL extracts the data that are part of the analysis directly from the different data sources [
34]. Depending on the tool, complete tables can be extracted from a database or, if greater granularity is desired, only one column can be extracted, depending on the data entry model. The available data pass to a transformation stage, where techniques are applied that allow the treatment of the null or voiding values, eliminating records or imputing missing data. From this process, adequate raw material is obtained, which means that the data will be complete, clean and consistent. The transformation also allows the form of the data to be modified by creating newly derived attributes, changing the type of attribute or making a partial or total change of a table. Another technique used is the discretization in which a numerical value is converted to an ordered nominal value. For example, qualification records can change from 0 to 100 for ‘approved–failed’. This is performed in order to facilitate understanding when presenting the results to data analysts. There are data that need a more elaborate process for their transformation; in these circumstances, nested queries and stored procedures are applied in the databases; this process depends on the complexity of the information that will be added to the system. Finally, in this phase, the same ETL is used to load the data that has been transformed and validated to a repository, whose characteristic is that it consolidates all the data from different sources that are accurate and of high quality. The load, as well as the extraction, depends on the tool that is used for the ETL [
35].
The data that have gone through preprocessing need to be stored in a repository that allows easy exploitation and ensures high availability. To comply with these requirements, a data warehouse (DW) was designed considering the star model [
36]. The design of the model consists of a fact table that contains the data necessary for the analysis and is fed by several dimension tables [
13]. The BI architecture developed allows data to be consolidated, segmented or reorganized as necessary, in order to process a wide variety of questions relevant to the user’s area of interest [
37]. This feature was obtained by creating cubes of on-line analytical processing (OLAP) that generate management modules, which make the cubes extensible and customized [
38]. In the last phase of the system, management tools are developed, allowing reports to be considered that can easily be viewed in a browser or as Excel files, depending on the needs. As a method for knowledge discovery, data mining algorithms such as decision trees, cluster, etc. are applied. These algorithms allow correlations between data, patterns and important facts to be identified and knowledge maps to be created [
39].
3.1. Visual Modeling of Business Intelligence
In our approach, the design of the BI architecture was defined through various Unified Modeling Language (UML) diagrams. The objective was to clarify each stage of the framework design so that it is replicable in any educational institution.
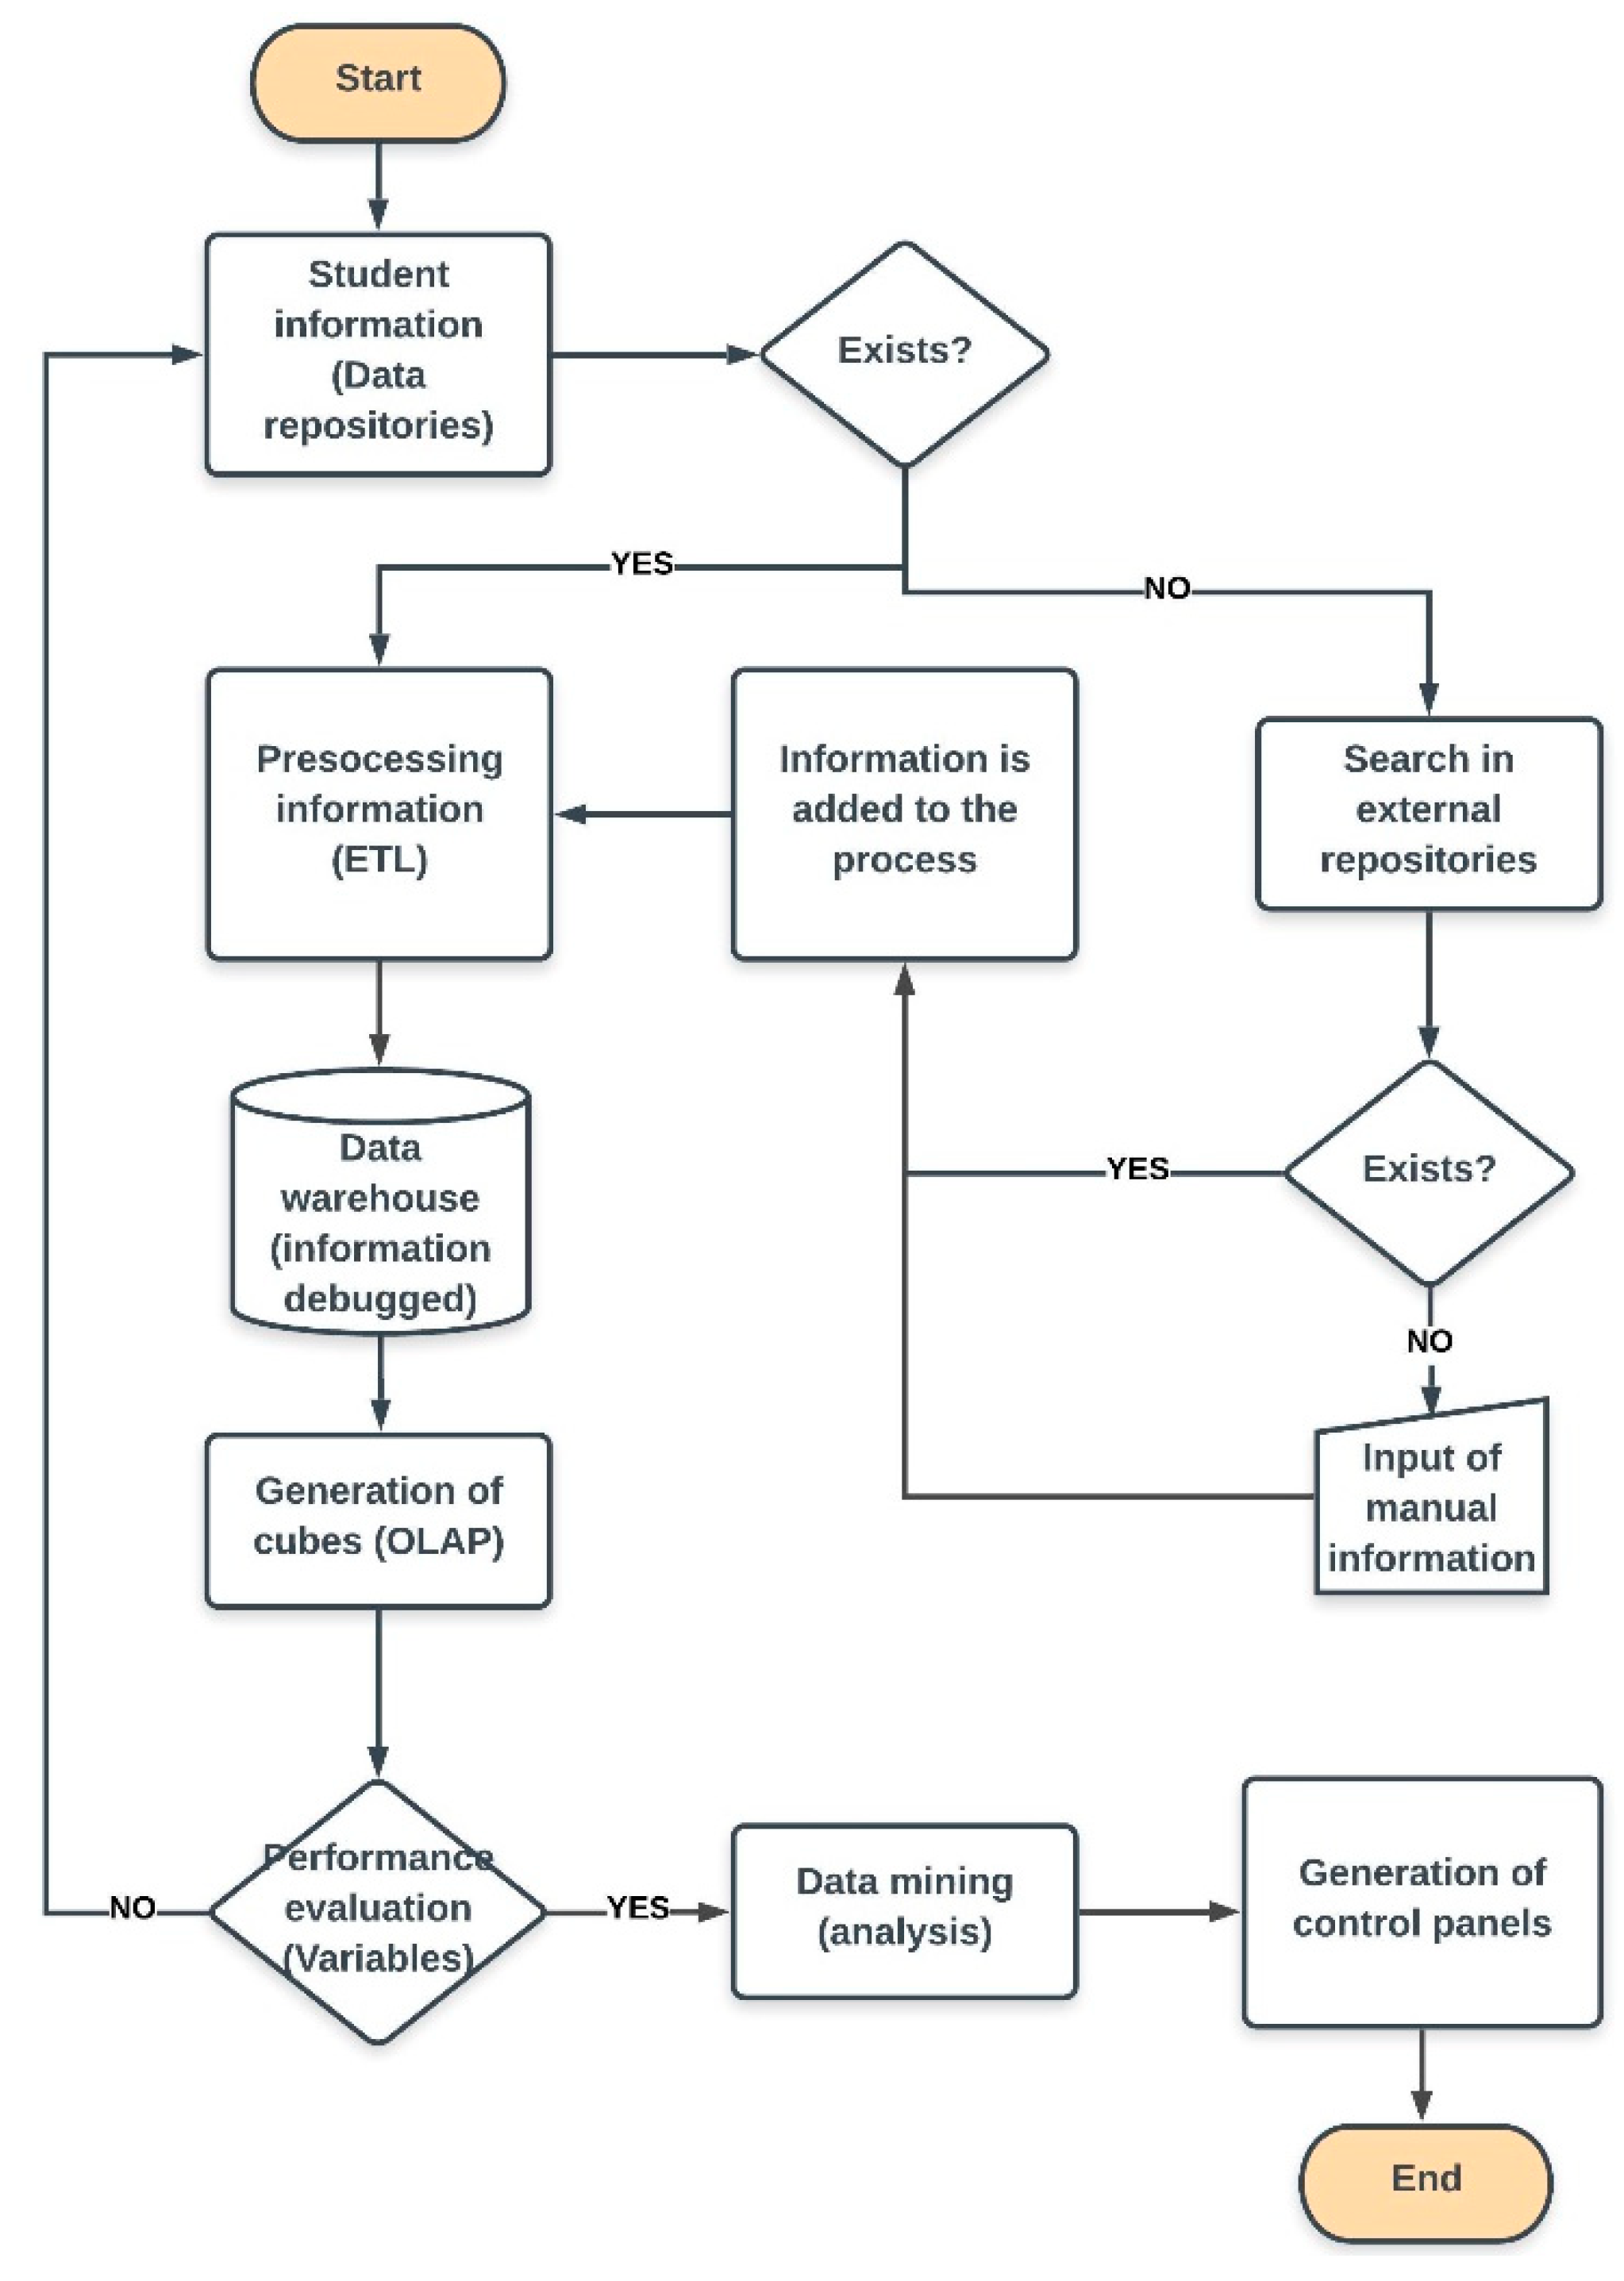
Figure 3 details the activity diagram, where the first step is the collection of information about students from the different repositories, and the loading of the data. The clean, quality data are stored in the DW; the DW is an optimized multidimensional database that facilitates the creation of OLAP cubes. The cubes consist of making a disposition of the data in vectors to perform a quick analysis of the data. If the data exist, they pass to the processing stage through the ETL, which is responsible for extracting the information.
The next step is the evaluation of the variables, where it is verified that the cubes contain enough information about the evaluated variable. For example, there could be dimensions that are not complete or that require additional data; to these dimensions it is necessary to add all the information that affects the event. Similarly, when there are no measures in the analysis dimension, it is necessary to go back to the beginning of the process to add these variables. If the process continues and is not corrected, the result cannot be quantified; therefore, the decision-making is compromised.
If the variables considered in the design of the cubes contain the information required for the analysis, the mining algorithms are applied to the data; this application allows the classification of the students according to the patterns identified by the process. The application of data mining algorithms is usually performed within the same BI application thorugh the use of internal tools within the process. If, for any reason, the process of data mining has to be executed independently, it is necessary to consider tools that integrate the design of the proposed architecture. Finally, the BI application has to present the data in an appropriate way to the user, and in exact times. The decision-making systems present the results in dashboards; their integration is acheived through connectors to the DW that contains the quality data; another option is that the data presentation applications are directly integrated with the tool of data mining.
Figure 4 represents the management process the tool uses as a SIPOC diagram (an acronym of supplier > inputs > process > outputs > customers). In the first phase, it determines the data on which the process is based; for this work, the data generated by the students and the data of the academic and financial systems of the students were considered. The entries are the data generated by the students and recorded on various platforms, such as an LMS, academic systems that store grades, student attendance.
The information systems are supported by the entries of the financial information, as well as the socioeconomic information of the students. The BI needs all possible data that provide information on the performance of students, including information that comes from the high school, and from this, it can make projections and know the state of knowledge of each student. The process phase includes the entire knowledge discovery in databases (KDD) process, which begins with the data collection where all the data considered in the entries are integrated [
40].
The selected data are processed in the ETL for later stages, submitting them to the data mining algorithms and discovering the knowledge of the object of study. The output phase manages two transitory points; the data processed by the ETL and stored in the DW. In the first point, the output presents clean, quality data that is used in the data analysis.
The second point, and most important, analyzes the data, allowing for the identification of patterns, the classification of individuals or the making of projections. This phase allows us to aquire knowledge about the students, the way they learn and the activities that help them generate learning. The final stage is made up of the customers that are the students, teachers and administrators in our BI framework. The consumption of data is achieved through a dashboard, where the information is easy to consume.
3.2. Selection of Data Sources
In the analysis of learning outcomes, data scientists integrate several additional sources, such as structured and unstructured databases. Traditionally, knowledge about aspects of student learning was obtained from information stored in databases. With the inclusion of new study variables in learning, as well as new tools, it has been necessary to obtain more information about student behavior. This behavior does not necessarily have to be registered as part of a traditional database model. For example, one source that can help define student trends is social networks, whose data can be analyzed by techniques such as sentiment analysis.
At present, the greater the volume of data on an object of study, the greater the knowledge that can be obtained using methods and techniques that allow the analysis of learning. However, it must be remembered that any analysis process should be evaluated based on the quality of results, as well as the time at which they are presented, so that the resulting decisions can be made appropriately. To guarantee the speed and quality of the analysis process, it is important to establish a preliminary phase in the KDD process. The selection of the sources is presented as a preliminary phase, in which the data scientist analyzes what each of the sources is, their importance, and whether they already exist or need to be generated.
The available data sources are evaluated by different criteria. The criteria are variables that measure whether the sources are relevant, efficient, impactful or sustainable. What is sought is the identification of the degree of importance that each source has for the analysis process carried out by the BI.
3.3. Selection of Data
For the selection of data, it is important to know the existing data, their relationships and the characteristics of each field, so the development of a data dictionary is essential. A data dictionary is a centralized repository of information about the data, such as their meaning, relationship to other data, origin, use and format. The data dictionary contains the logical characteristics of the students that will be used in the BI framework, including names, descriptions, identifiers, content and organization. With these details, the analysis can make use of data from different repositories and assess their relationships with lower processing costs and heightened effectiveness. In the process of data selection, the records of a database are integrated into the analysis, depending on the problem that needs to be resolved, to the point that all the records can be included. However, it is better to avoid adding all records, so as not to overload the process and thereby reach the desired level of depth in the analysis at appropriate times. To facilitate the data selection process, it is common to work with questions that help identify the different fields that will comprise the variables, for example:
Is there information available on the systems that can be used?
Does this information help the analysis?
Of all the available types of information, which one interests us?
Are the details of all the available information interesting, or just the details of the information that we need?
Once the data have been selected, a method for ETL is defined. This process depends on the availability of databases; sometimes, it is possible that ETL processes are not able to access certain repositories. In these particular cases, it is necessary to collaborate with the analysts of the database in order to create queries and preprocess the data, and that these are exported and loaded into the DW.
3.4. Preprocessing
The data found in the different repositories may not all be clean, or may contain errors. A lack of cleaning and treatment in the data reduces the quality of the analysis by generating useless rules in the data mining stage. The problems found in the data repositories considered in this study include incomplete data that are missing attribute values, inconsistent data and even discrepancies between the data [
41]. The preprocessing of data is achieved with filters that can be applied in a supervised and unsupervised manner. In both cases, there is the option of cleaning the attribute or instance; this depends on the type of data that the analysis needs. The advantage of prior data preparation is that a smaller data set is generated, improving the efficiency of the data analysis process, especially at the mining application stage.
The tasks and classifications assumed in preprocessing are responsible for obtaining data from various sources of information, solving representation and coding problems by integrating data from different tables to create homogeneous information. The data preprocessing consolidates the data in an appropriate way to extract the information that is produced through the data summary or the aggregation operation. The data reduction filters relevant data for the application of the mining models through the selection of features, the selection of instances and discretization.
3.5. Transformation
Data transformation consists of creating new attributes from the original attributes. Transformation also includes global transformations, which involve the exchange of rows with columns, where the data is transformed through a certain type of selection. The selection of data can opt for a vertical selection, which acts directly on the attributes of the object of analysis. Horizontal selection then acts on the data instances and, finally, a sample of the population can be used to perform the transformation. These instances are followed by two possible actions [
34]. In the first action, several interviews are applied to detect the origin of the data. In the interview, the administrator of the database is responsible for disclosing the age of the records that are online. The second action allows us to know the structure of the tables and the fields that appear in the entity-relationship diagram of each database included in the investigation.
3.6. Data Warehouse Design
Due to the large amount of data handled in the university environment, the design and construction of a DW is necessary [
42]. The integration of the DW with the system provides agility in processing and high availability of the data. For the design of the DW, the Kimball methodology was adopted, which is based on the dimensional life cycle of a business.
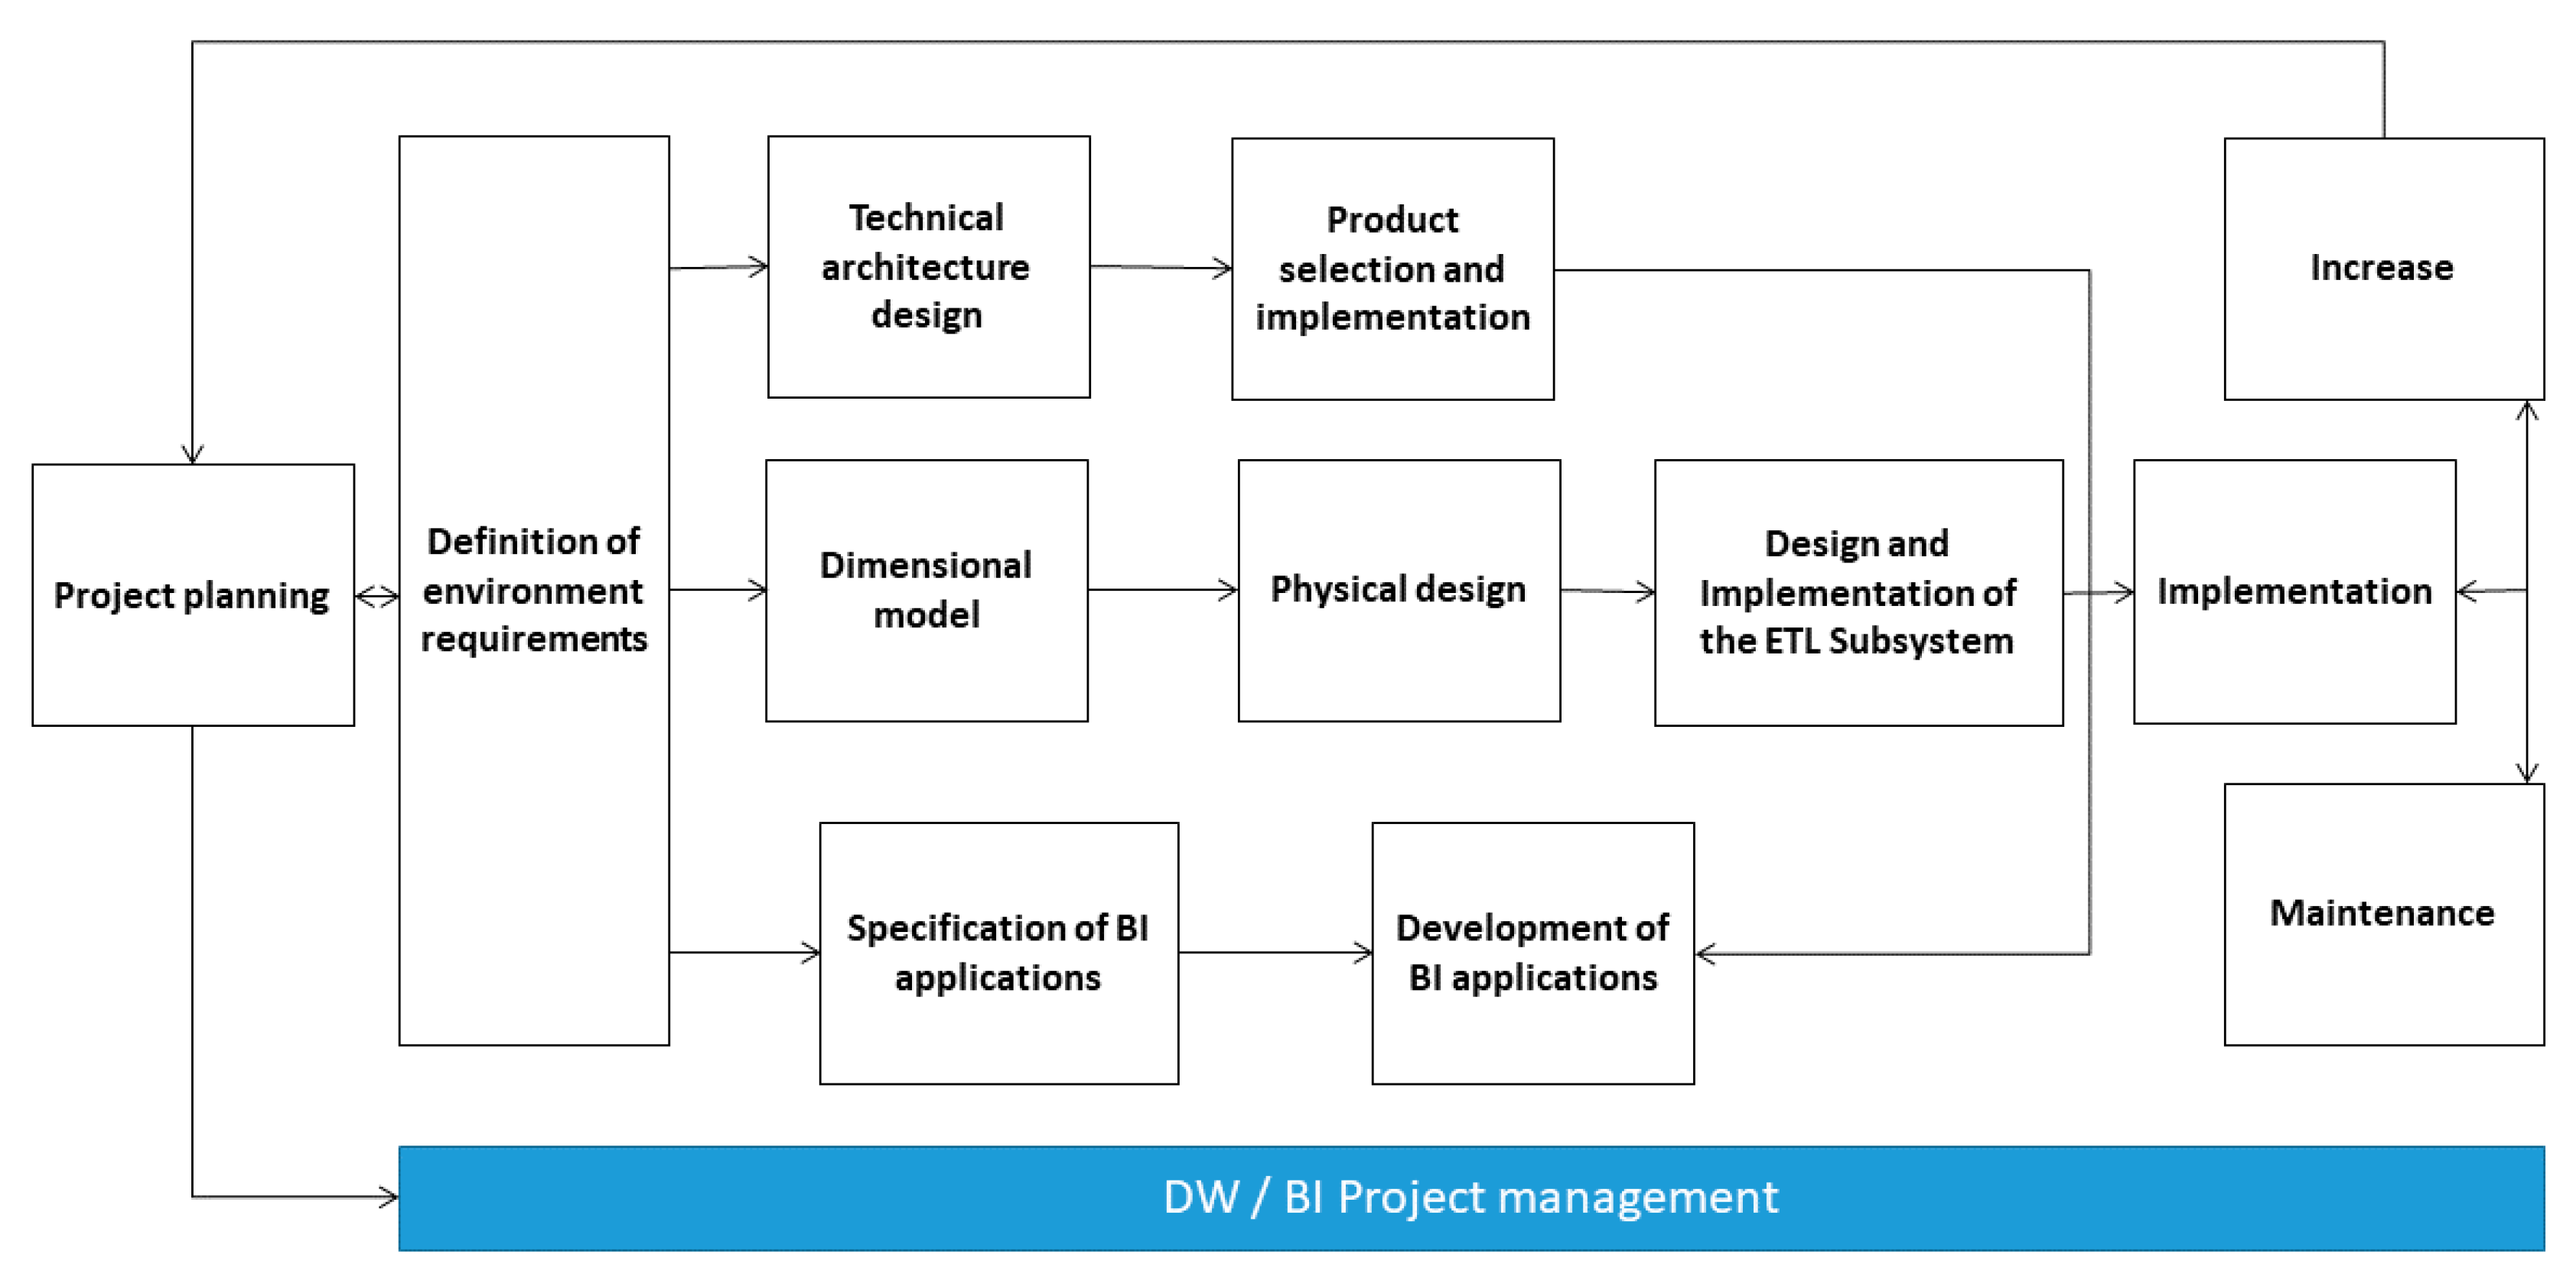
The solution of ‘DW and BI’ is extremely complex when implemented through the Kimball methodology; this complexity can be simplified by improving the processing of BI [
43]. The tasks of this ‘life-cycle’ methodology are shown in
Figure 5, where two characteristics can be observed. First, the central role of the task of defining requirements must be highlighted. The requirements for measuring an academic event form the initial support of the subsequent tasks. The measurement has an influence on the project plan. Second, three routes or paths that focus on three different areas are shown:
Technology (upper path): this has implications relating to specific software.
The dimensional model (middle path): its design and implementation integrate the ETL subsystem to store the data in the DW.
BI applications (bottom path): this route includes tasks in which business applications are designed and developed for end users.
The analysis of the requirements for the design of DW was achieved through interviews with administrative, academic and technical personnel. The objective was to learn as much as possible about a university environment, its competitors and the student population. Part of the preparation process was to find out who really should be interviewed, which involved carefully examining the organigrams of the organization.
The four groups of interviewees considered crucial for the collection of the data necessary for the analysis of requirements were: the people responsible for making the strategic decisions at an administrative and academic level; personal systems, i.e., the people familiar with the types of the administrators and intermediate academics responsible for exploring strategic alternatives and applying decisions; the people in charge of solving computer problems and managing the data that exists; and, finally, the people that need to be interviewed for political reasons.
Finally, the most critical business requirements or processes were prioritized, for which a dimensional model was created through a dynamic and highly iterative process. The design process began with a high-level dimensional model obtained from the prioritized processes of the matrix [
45].
For the iterative process, four steps were considered:
The selection of the business process: in this step, the area to be modeled was selected; this is a management decision, and depends mainly on the analysis of requirements and analytical issues.
The selection of dimensions: the dimension tables identified were those whose attributes are possible headings in the reports, pivot tables, cubes, or any form of visualization, one-dimensional or multidimensional.
The identification of measurements and fact tables: the measurements are attributes of the tables selected to be analyzed; they summarize or group the data using the cut criteria known as dimensions.
The linking of measurements to the level of granularity: each of the records of the DW contains a measurement expressed in numbers, such as the number of students or tasks, time and notes, etc.
3.7. Data Mining
The data submitted to be preprocessed were available for the application of data-mining algorithms. In the data-mining application, we looked for patterns that are relevant in a certain segment [
46]. The choice of algorithm for a data analysis task can be considered a challenge, since each algorithm generates a different result [
47]. However, this does not mean that an analysis cannot use more than one algorithm; the important thing is to determine the most effective entries and then apply a certain algorithm to predict a particular result based on existing data [
48]. The choice of data-mining algorithms was made according to
Table 3, where several examples of tasks and algorithms that can meet these needs are presented. The data mining algorithms for the construction of the model were selected based on the study [
39] that offered an ideal process for this phase.
3.8. Interpretation and Evaluation
Once the entire architecture of a KDD process has been deployed, the model goes to the validation phase, verifying that the results are valid and sufficiently satisfactory. In the interpretation stage, the data are analyzed according to the patterns and models that were found in them. Patterns are local structures that make statements about a space restricted by variables; for example, a common anomaly is the detection of a student’s absences from a course [
50]. Models are global structures that make claims about any point in the measurement space; for example, based on the behavior of a group of students in certain subjects, a projection of their effectiveness in future activities can be made. In the presentation of results, the visualization techniques are important because the final models or the descriptions in text format can be difficult to interpret for the final users.
4. Case Study
As an example of the application of our method of BI for education, this case study presents an analysis of the desertion of students at a university. The study began with the analysis of a data set generated from the information concerning the registration process and academic performance record of 3,207 students who entered the distance learning program of a university in Ecuador. The data were evaluated for the period between March 2014 and September 2018; the analysis includes six cohorts because the academic process in this university takes place in semesters, which means that all students who attended up to the sixth semester were considered.
The databases examined were those of the academic and financial management that included a certain amount of data from the LMS [
51]. These data were requested from the admissions department and from the academic management of the registry of the higher education institution participating in this study. The inclusion criteria were limited to the information available, and were as follows: age, sex, college grade, subjects taken, subjects passed and status in program [
52]. Once the process of quality control and the validation of the information corresponding to the study variables was carried out, 2030 (63.3%) records were included. The variable of analysis in the study was student desertion (dependent variable), defined as a condition of those students enrolled in the first three years of their course, or the initial six semesters. The independent variables that explain the desertion were a set of variables called ‘pre-university’: the college grade corresponding to the numerical value of the general average of a student’s secondary studies, the number of subjects approved; the number of enrollments in the defined periods, the subjects taken (between one and 24, coded according to the average number of subjects taken), sex, and the age of the students between 18 and 26 years old.
The problem addressed by the study concerns the detection of the causes of university desertion; previous works have considered [
53,
54] desertion to constitute the failure of a student in a consecutive period. For example, in the case of the LMS data, the BI required access to all the records of the activities carried out by the professors and the students that are usually stored in MySQL. All the data obtained from the different sources went through a processing and transformation phase so that clean data could be obtained, and these were loaded into a data repository generated in SQL. From here, the data-mining algorithms were applied according to the analysis carried out in the method, where the operation and the expected results are indicated.
4.1. Data Mining
The selection of the data was based on the study variables; these variables were chosen according to the Bean model [
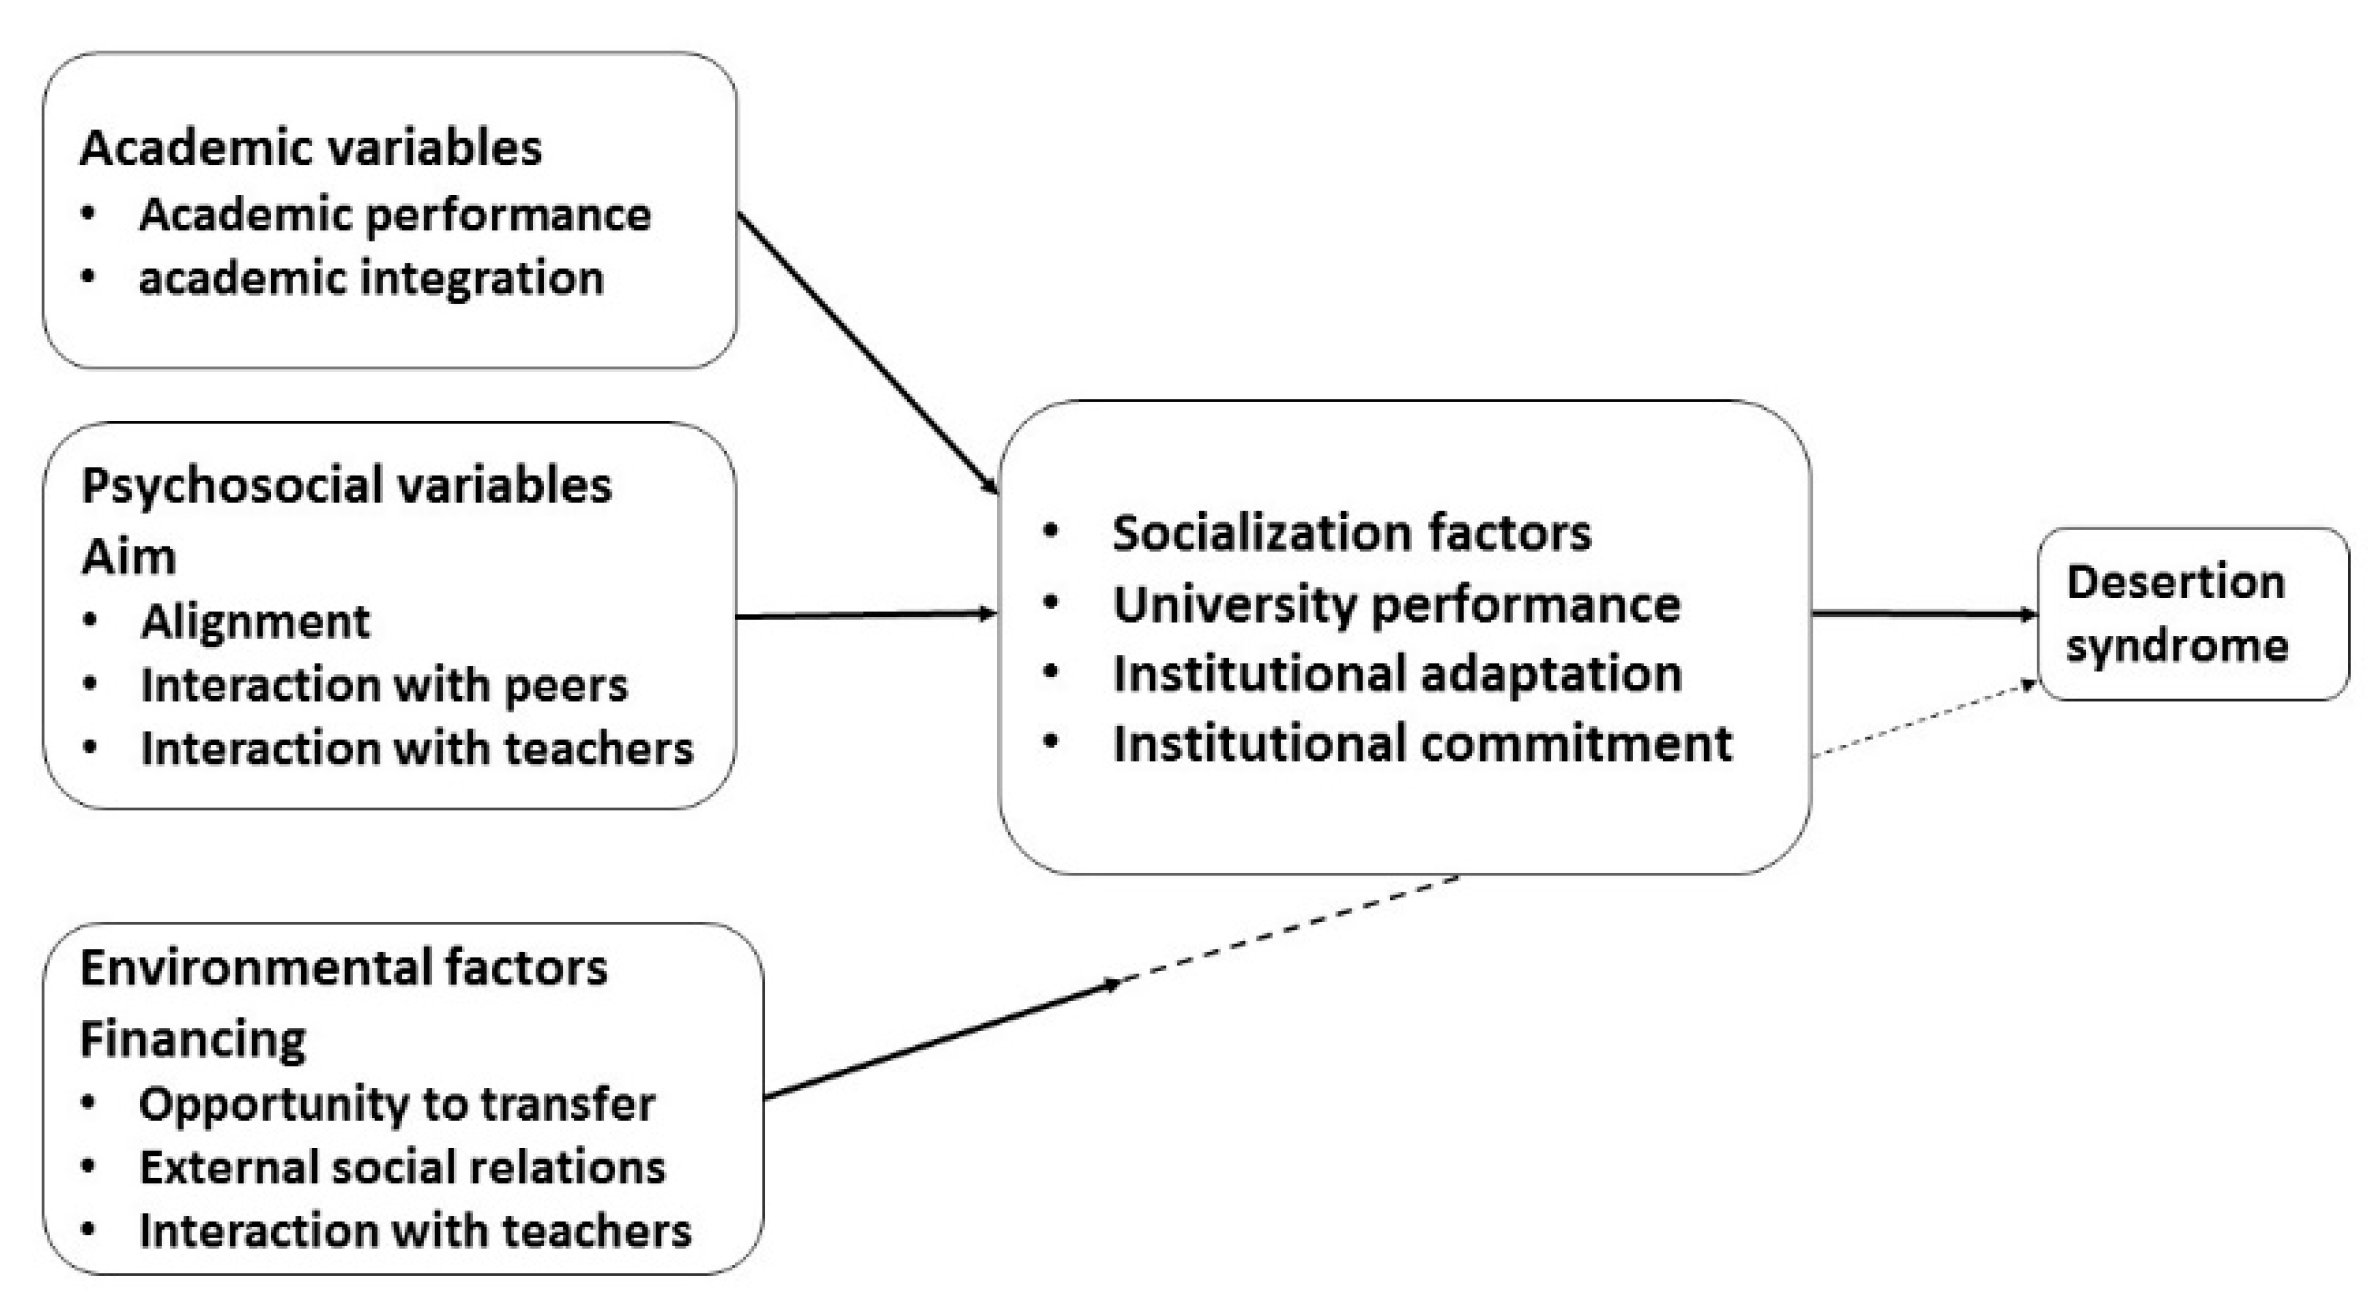
55]. This model identifies the academic, psychosocial and environmental variables that lead to desertion syndrome. As
Figure 6 details, each of the variables is constituted by a field that serves as a guide for the extraction of data from the different repositories belonging to the educational institution. For the academic variables, the performance and the integration of the student were considered; the common repositories that store this information are the academic records systems. Psychosocial variables included objectives, alignment, peer interaction and interaction with teachers. The variables that manage the interaction with peers in the Bean model were supplanted by interaction with the LMS. Environmental variables were parameterized according to funding, external social relations, transfer opportunities and interaction with teachers who, as in the previous point, change the parameter through interaction with the LMS and the use of ICT.
The percentage value of the general average of secondary studies is 70 %, which is registered in two categories: the number of enrollments in the university, and the number of repeated subjects, defined as the numerical value corresponding to the number of times a student takes a subject. Another variable is the recorded age at university entry, from 18 years [
56]. The population considered were studying via the modality of distance learning; specifically, within the administration and communication program.
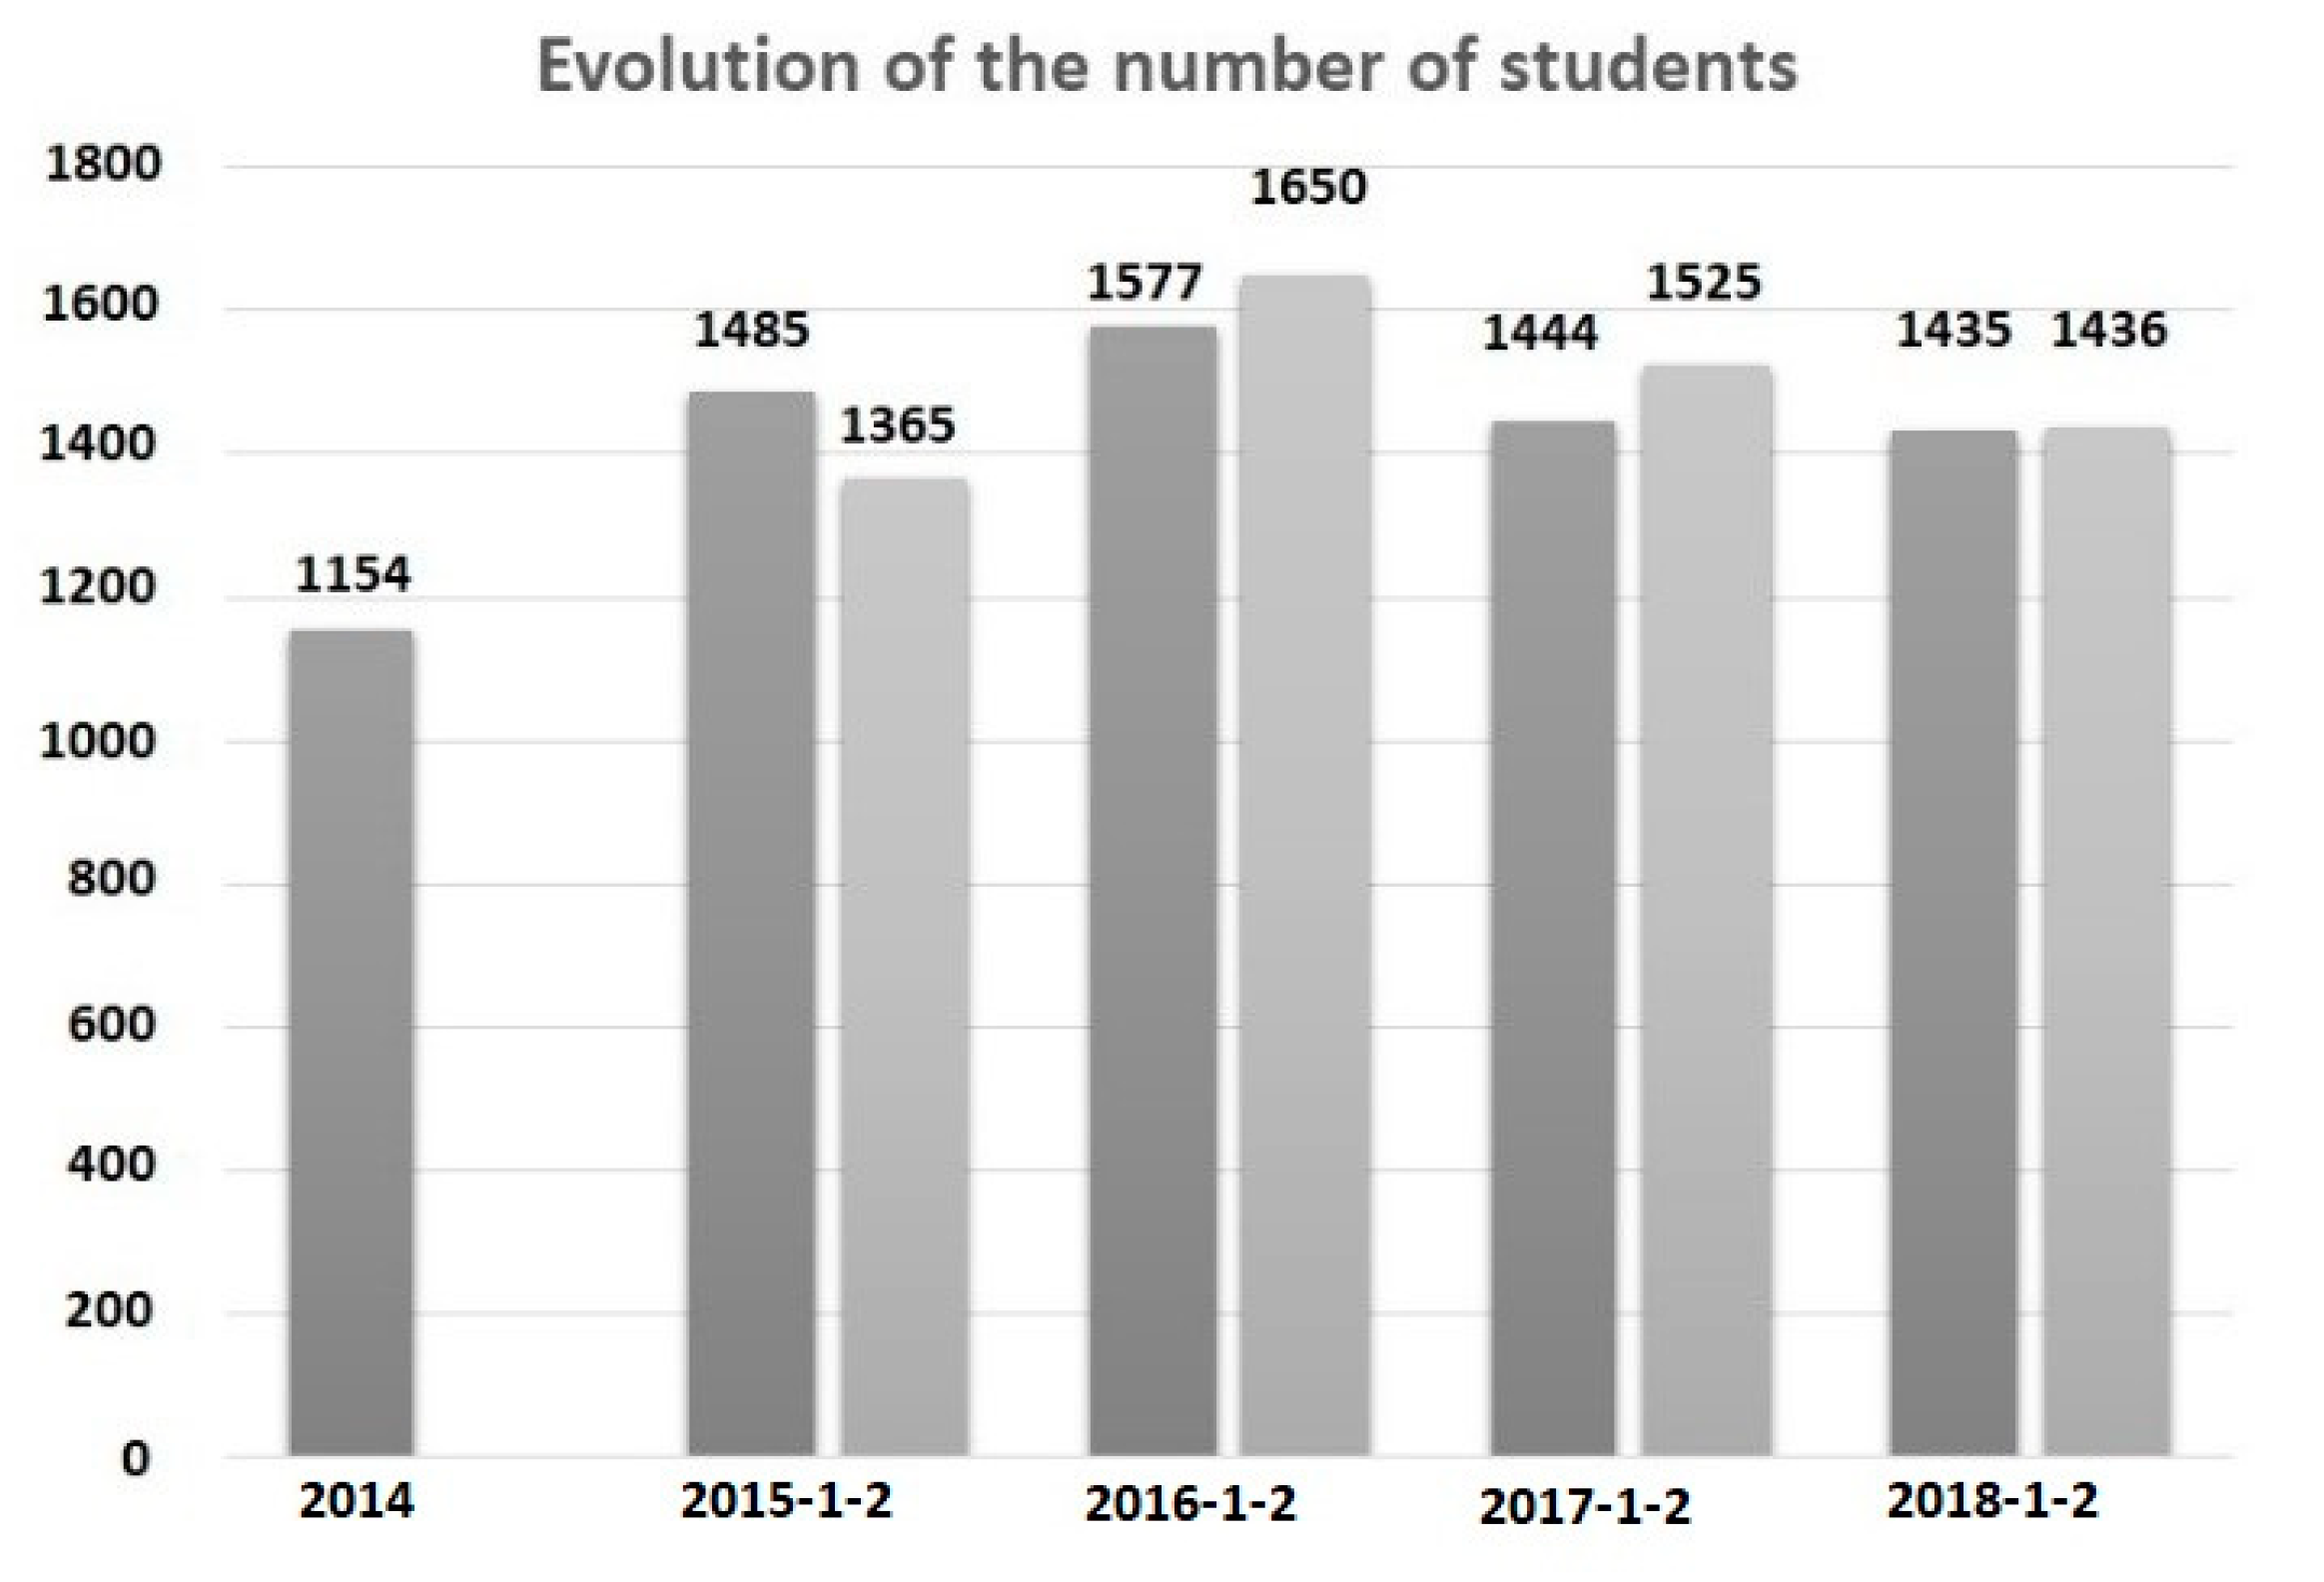
Figure 7 shows the evolution of the number of students from 2014 to 2018; the graph shows data for two semesters per year, except for 2014. The data for the period September 2014–January 2015 was not considered because the cohort of that period corresponds to the year 2014. Another consideration is that the information corresponds only to active students. However, it serves as a reference for the verification phase of the results.
4.2. Identification of Necessities
The university emphasizes the evaluation of learning, the retention of students and the continuous improvement of educational quality. These factors are the main problems to which institutions seek a solution based on the analysis of the educational data held by the systems responsible for learning management.
The student retention rate is given by the following equation:
SRR: student retention rate.
NSEA: number of students enrolled during the regular academic period in which the evaluation of the institution takes place, who were admitted two years before.
TNSA: total number of students admitted to academic programs in institutes of higher education two years before.
The retention rate is a result of good practices in the training process. According to the national regulations of Ecuador and its bodies, it is expected that 80% of students will continue their studies in higher education institutes [
57].
4.3. Data Preprocessing
Data cleaning was performed predominantly through the ETL, which has certain advantages, such as the ability to perform an action on an entire table or column according to the need. In this phase, it was perceived that certain columns with important information on the students were scattered in the data sources and contained values that had to be modified. These values were fields with ‘NULL’ that needed to be replaced with ‘0’ values. This process was achieved with the use of data conversion actions. The data belonged to a single table in the DW, so a combination of the columns in the assigned table within the repository were created and loaded.
The tables, fields and identifiers were designed to cover the largest number of variables, since one of the objectives of the work was to present solutions to the greatest number of critical areas of the university. One common source of data duplication is the excessive number of databases that such an institution manages; the result is that the same student sometimes presents different information [
41]. As part of the data preprocessing, both the repositories and the selection of data were reviewed exhaustively.
The ETL chosen for this work was Microsoft’s SQL integration service, which possesses several useful tools for processing that facilitate the extraction of data from a source, the transformation and the load. On the other hand, there were data fields that needed to be filtered using another method, such as in the case of missing data. Solutions for the problem of missing data include manually filling in the missing values and filling them in automatically with the word ‘unknown’. Data duplication is a major problem in data mining because it often causes time to be lost and it can make the verification of a result difficult. The common problems found in cases of data duplication include several periods being assigned to the same student. In this situation, the ETL detects these cases and displays them with a notification [
58].
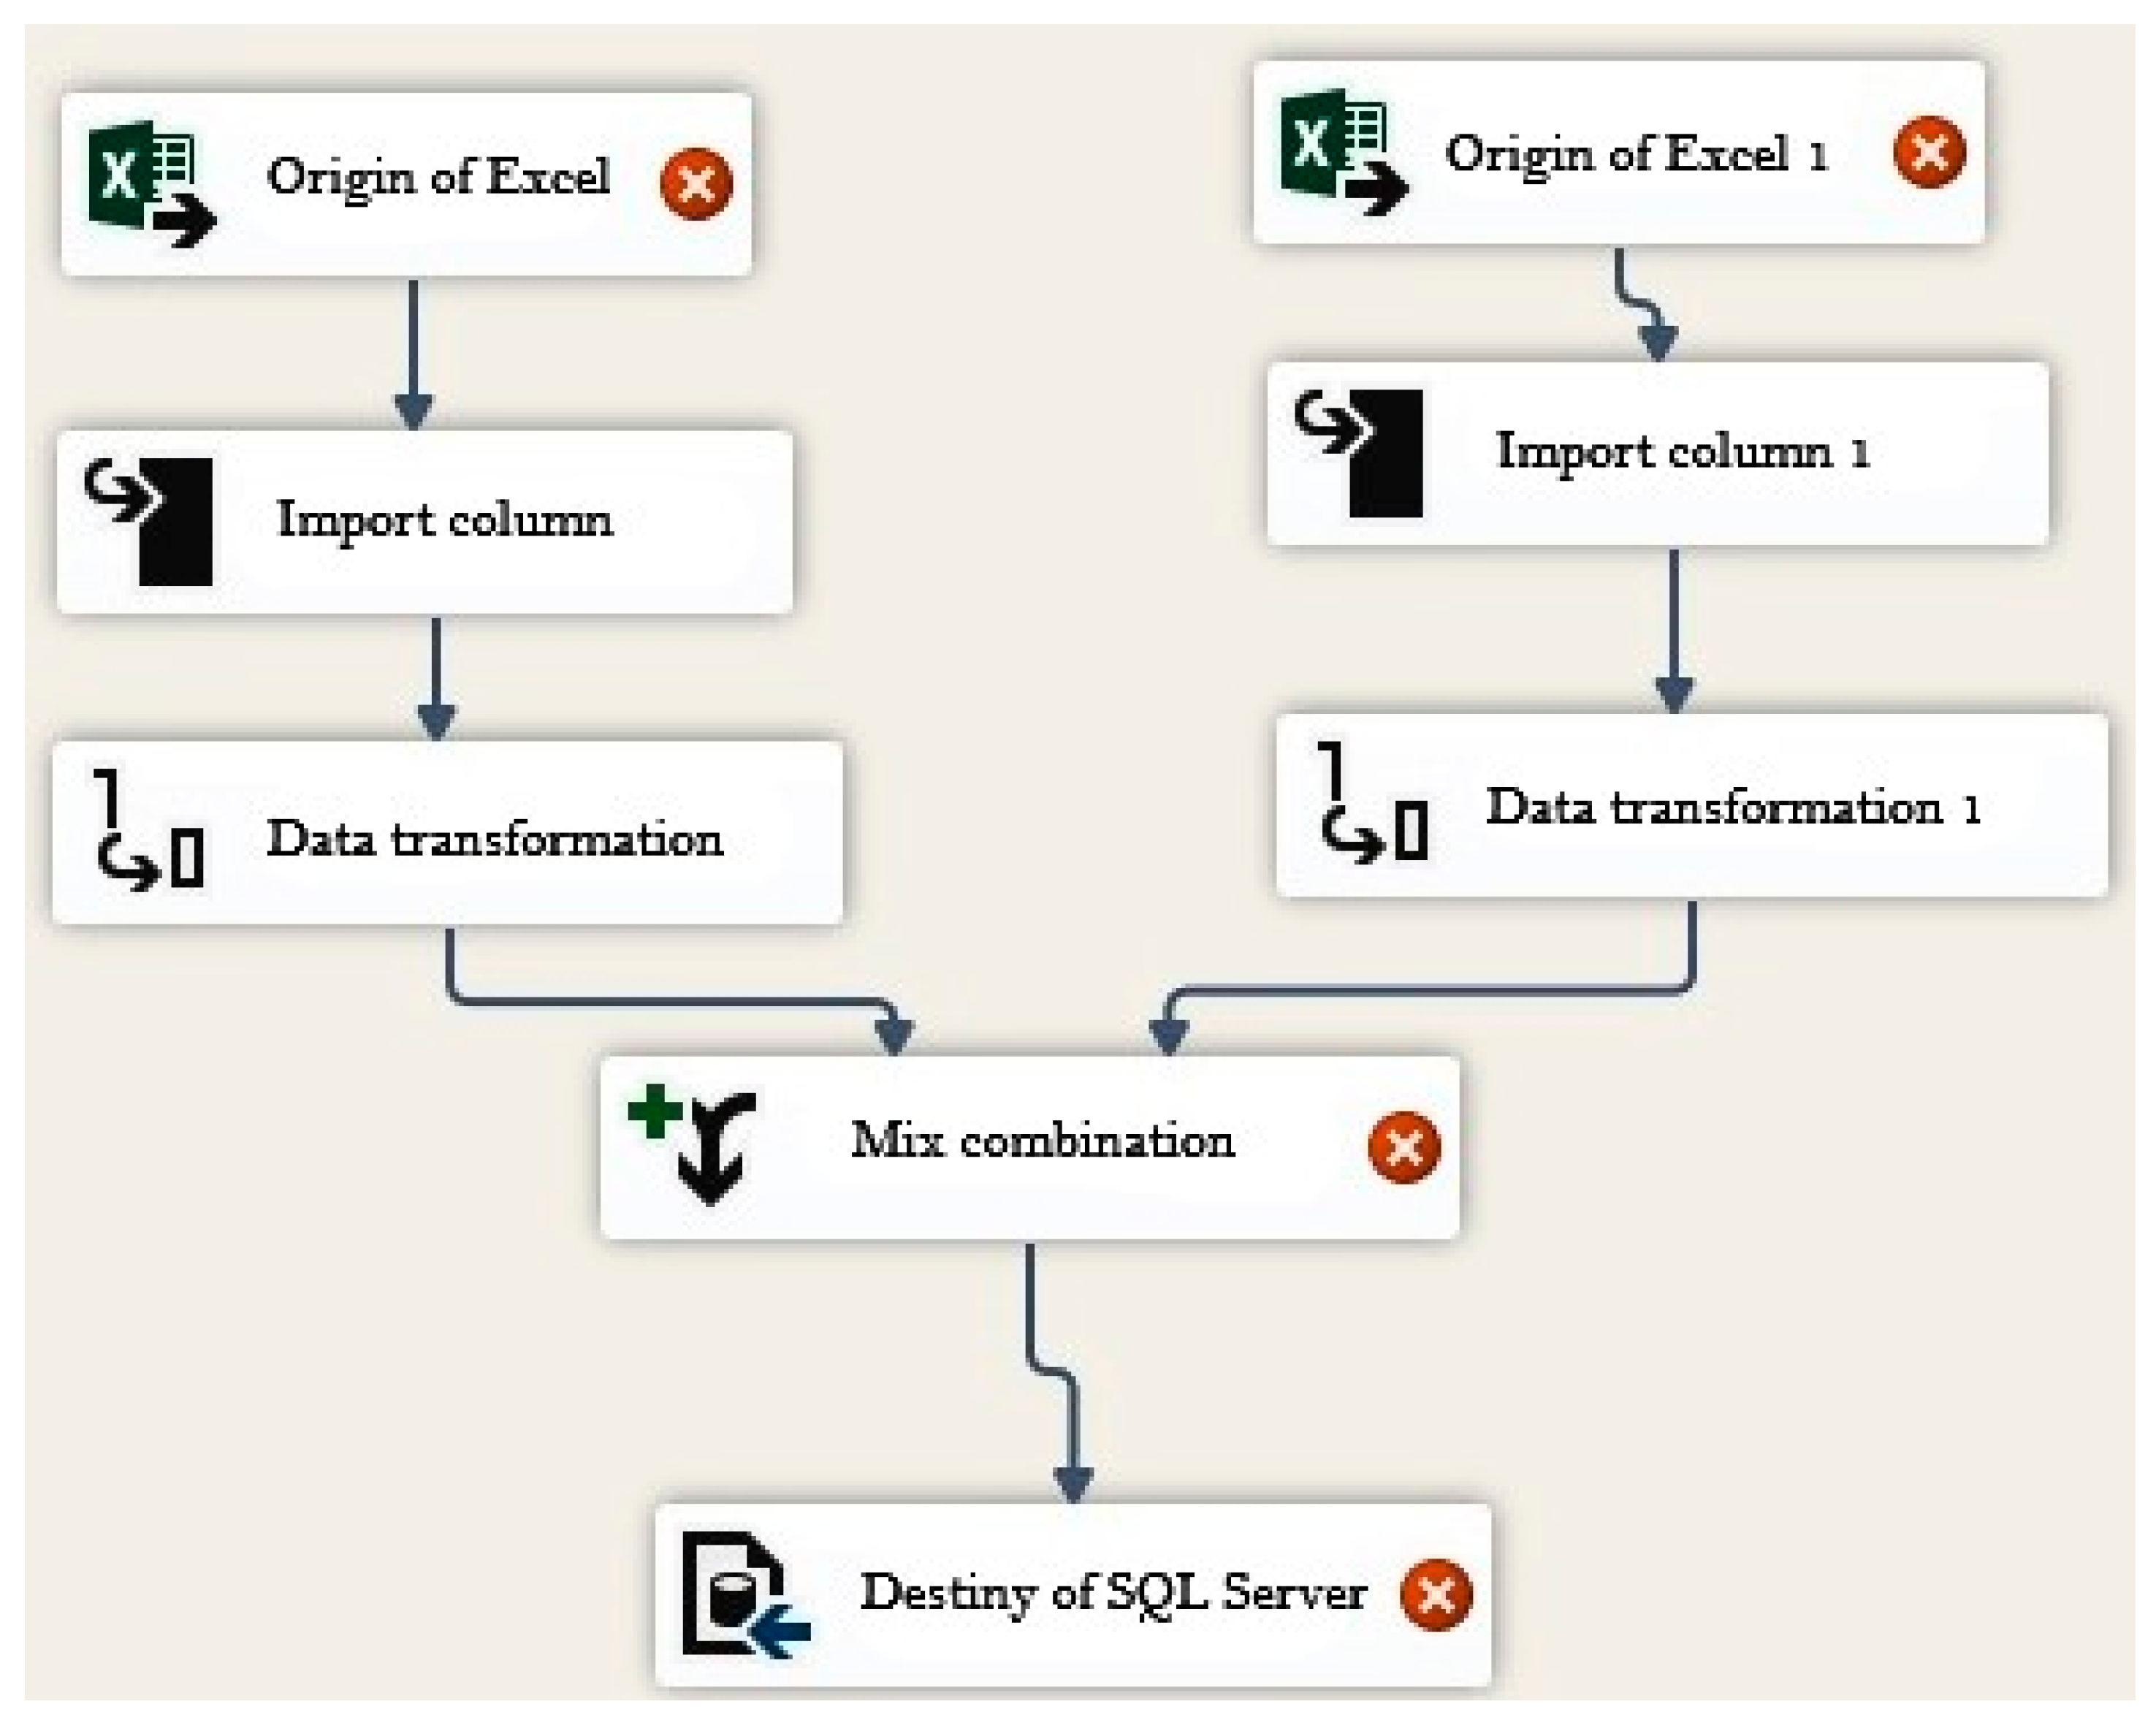
Figure 8 presents a capture of the ETL that is responsible for the treatment of the data that are deposited in the DW, where blank, null and repeated cells, etc. are eliminated. The clean data is then combined, and the destination that is the DW is chosen.
4.4. Algorithm for Data Analysis
The software available for the application of data mining is varied. The choice depends on the type of results that are expected to be obtained, the profile of the analysts interpreting the results and the economic capabilities of the institution, since there are open source tools available. In this study, greater importance has been given to the results obtained when applying the different algorithms using the WEKA software [
59].
This work seeks to establish the independent variables determining student desertion, for which the algorithm J48 (which belongs to the decision tree group) was applied. The J48 algorithm is an implementation of the algorithm C4.5, one of the most commonly used data-mining algorithms. It is a refinement of the model generated with OneR; it presents a moderate improvement in benefits, and may achieve a probability of success slightly higher than the previous classifier [
1].
For the connection between the repository and WEKA, an SQL query is generated considering all the fields that need to be analyzed, and it is pasted in the ‘Query’ section in the interface. Once the WEKA query is executed, it performs an attribute comparison. If necessary, the fields and attributes can be modified to navigate between the information added to the tool. For example, attribute comparisons can be made between students and the selection of activities. WEKA starts the analysis and identifies the patterns and presents them in a matrix that compares all the selected attributes.
For the analysis, a tree of size 44 with 25 levels was considered; the reliability value was 92.7885%.
Table 4 presents the information concerning the data from the generated tree, where the error values and the instances for the analysis are established.
An application of the data-mining algorithm does not always include all the variables of the database; the process is improved by selecting the tables that provide information to the hypothesis of the analysis. In order to identify the variables that directly affect the graduation rate (dominant factors), an analysis process was established using, as in the case of desertion, the J48 algorithm. For validation, the data provided by WEKA was verified manually; its efficiency was proven to be 92.7%.
The evaluation of the results acquired from the data-mining algorithms was based on the evaluation of experimental results. To create and evaluate the classification model, we measured its efficiency; that is, the possibility that the classifier correctly classifies numerous samples from the test data set. For the evaluation of the classification precision, the cross-validation method was used. The study and evaluation process were repeated k times, always using a subset as the test set. The estimation of the prediction precision by cross-validation is a random number that depends on the distribution of samples to subsets.
Various metrics were used in this investigation to evaluate the performance of the algorithms. The classifier performance implies precision, error rate, recall and F-Measure.
Table 5 presents the detailed precision data by class.
The measurement of the ROC area is one of the most important values of the WEKA output. The optimal classifier has ROC area values close to 1, with 0.5 being comparable to random guessing. Unbalanced data sets in which a disproportionately large number of instances belong to a certain class can lead to high accuracy rates, although the classifier is not necessarily excellent.
4.5. Analysis of Results
For the identification of the independent variables, several tests were performed; the objective was to determine the percentage of incidence of each attempt with the dependent variable. With this information, the variables that contribute least to the study could be discarded. Another variable considered for the validation of the model was the confusion matrix.
The matrix visualizes the distribution of the records in terms of real classes and predicted classes. This indicates the quality of the current model.
Table 6 presents the data of the confusion matrix where, according to the horizontal reading of the table, there are 1,139 items classified in the ‘NO’ class:
Of these, 1056 were correctly classified in the ‘NO’ class;
83 of the elements were incorrectly classified in the ‘YES’ class.
There are 872 elements in the ‘YES’ class:
Of the sample, 29 items are classified as ‘NO’.
843 of these elements are correctly classified in the ‘YES’ class.
The analysis considers, as independent variables, whether the student remains in the institution or not.
Table 7 presents a part of the tree and the levels whereby the interpretations of the results are centered on the students’ status in each school. This status can describe active, passive, graduate and retired students. The levels are chosen for a student that is passive and withdrawn, which directly affects their risk of desertion.
The passive state is considered the first level of the tree; the second level takes into account the student’s enrollment. When the number of enrollments to the course is less than or equal to four, there are 848 cases in which the student left; in the following case, if the interactions are less than or equal to five, the result indicates that 24 students withdrew. In the third case, students who are enrolled in the fifth semester only have 15 students who dropped out.
The objective was to identify those students who do not work and to assess their academic performance. As a result, it was found that 37% of students work and pass all courses without any problems, and the other 63% experience some complication. The analysis conducted shows that 63% of students need at least 19 hours of LMS use to become familiar with their management.
5. Conclusions
This paper presented a method for the implementation of a BI framework that covers the treatment, analysis and presentation of data that can respond to any problem generated in an educational institution. Our framework offers a practical means for universities to begin their journey towards the implementation of BI by crystallizing their most important processes and defining the necessary information to support these processes.
In developing this work, several clarifications were obtained about the use of data mining in the databases that handle students’ socioeconomic and academic information. It should be emphasized that, using ICT, the current momentum in education has allowed the creation of modalities that allow students to manage the convergence between work and educational activities. For this reason, the use of ICT should be supported as a mandatory component in virtual education or distance learning.
When applying the EDM models, as shown in the case study examined in this document, we can affirm that technical improvements could be made in terms of their implementation. One improvement that is being worked on is the optimization of infrastructure resources. This allows us to improve the response times in each process; thus, the results of the analysis would appear in real time.
With the analysis of the data, an overview of the behavior of a group of students is formed; the levels of depth depend on the independent variables and their percentage of influence. Some of the results obtained may be obvious; for example, if a student fulfills all the tasks and devotes an appropriate amount of time to self-directed work, he will pass the course without any problem. In the opposite case, it is important to know the causes that lead a student to fail a course, with the aim of recommending a group of activities that can be adjusted to the needs of each student.
As future work, the integration of a system of recommendations of activities in the BI is proposed, in order to create an autonomous system that is capable of making decisions. The process would cover the phase of the processing and analysis of data through the extraction of data. The results obtained would then be sent to an expert system. The expert system would evaluate the factors that influence desertion, academic effectiveness, or any other type of eventuality that may be the object of study. With this knowledge, the system could recommend a group of activities that meet the needs of students in such a way that learning is active and personalized, creating a platform like the one indicated within a university, with the capacity to provide academic, financial, administrative management and marketing solutions. In addition to the possibility that this management is carried out by an expert system, it would undoubtedly help in decision-making and enable the automation of learning processes at a high level of quality.


