Article

The Multi-State Maritime Transportation System Risk Assessment and Safety Analysis

School of Naval Architecture, Ocean & Civil Engineering, Shanghai Jiaotong University, Shanghai 200240, China
*
Author to whom correspondence should be addressed.
Sustainability 2020, 12(14), 5728; https://doi.org/10.3390/su12145728
Submission received: 8 June 2020 / Revised: 11 July 2020 / Accepted: 13 July 2020 / Published: 16 July 2020
(This article belongs to the Section Sustainable Transportation)

Abstract

:
Maritime transportation has a pivotal role in the foreign trade and hence, the world’s economic growth. It augments the realization of “Maritime Silk Road” strategy. However, the catastrophic nature of the maritime accidents has posed a serious threat to life, property, and environment. Maritime transportation safety is a complex system and is prone to human, equipment, and environment-based risks. In the existing literature, the risk assessment studies aimed at the analysis of maritime traffic safety usually consider the state of system as two ultimate states—one is the normal state and the other is the complete failure state. In contrast to the conventional approaches, this study incorporates a multistate criterion for system state giving consideration to the near or partial failures also. A Markov Chain-based methodology was adopted to determine the variations in state system and define the instant at which a low probability incident transforms into a high-risk intolerable event. The analysis imparts critical time nodes that could be utilized to reduce the risk and evade accidents. This study holds practical vitality for the concerned departments to circumvent the potential dangers and devise systematic preemptive procedures before the accident takes place. The results of this study could be employed to augment safety and sustainability of maritime traffic and decrease the associated pollution.

1. Introduction

Maritime transportation facilitates more than two-thirds of the world’s trade, even though currently it is experiencing an extended downfall [1]. The proposal of “Maritime Silk Road” is acknowledged as a revitalization of the Chinese ports and maritime industry. Development of the maritime transportation augments realization of the “Maritime Silk Road” strategy. However, an increase in the maritime traffic upheaves the accident chances and hence success of the 21st century Maritime Silk Road heavily relies on the traffic safety.
The increase in maritime traffic and operational frequency of ships has enhanced the accident risk. Maritime accidents are considered to have catastrophic consequences in terms of life and property losses along pollution [2]. Attributed to such manifold devastating consequences, the risk of maritime accidents has been extensively investigated in the literature [3]. Generally, and in concurrence to the framework of the formal safety assessment (FSA) set by the international maritime organization (IMO), risk is defined as the product of occurrence frequency and the consequence severity [4].
Evaluation of the accident reports confirms that human, ship, and environment are amongst the most prominent causation factors. Though the maritime transportation and its associated safety are intricate systems, however, they are believed to revolve broadly around the human, ship, and environment domains [5,6]. Each of these factors requires a deeper and extensive classification and understanding in terms of determining their involvement in the causation of an accident. Yet, the majority of the studies in the maritime risk assessment literature confines the factors involvement and overall situation to a binary system. The two states defined are normal, and a total failure. In such analysis, scenarios with partial failures or situations in which at least one of the failure causation factors is initiated but the accident does not occur, are ignored. Such analysis are believed to impart huge differences in their quantitative assessment of the risks and the real situation at hand [7].
Moreover, risk assessment and safety evaluation approaches for maritime transportation system determine its ability to circumvent accidents. Therefore, a more holistic and practical approach shall be devised to analyze the system imparting it the ability to capture the diverse nature and initiation stages of the accident causation factors. The multi-state system for safety risk analysis can meritoriously capture and analyze the partial and subsystem performances and failures in a system under consideration. The multi-state system has been extensively used in the port oil piping transportation system and technical systems of the ferries and other port operations, producing reliable and efficient results [8]. Despite its popularity and efficacy in the risk assessment domain, the use of multi-state system in the maritime transportation is still in its infancy [9].
In this study, failures of the maritime transportation system have been classified into multi-states as “Normal state”, “Safe failure state”, and “Dangerous failure state”. It is in contrast to the conventional approaches where the two states considered are “Normal” and “Failure”. To augment its reliability, this study utilizes the real data of past accidents. Data from 263 Chinese inland waterways accident reports from 2000-2016 were organized into a range of variables and states in concurrence to the most profound and widely acknowledged human, ship, and environment systems. Markov models were adopted to determine the specific timings for the system risk encroachment from low to the medium and high-risk categories, respectively. Moreover, the time at which the high-risk state crosses the acceptable or tolerable probability limits were also determined.
This study holds prominent vitality for the crews, ship owners, and government to comprehend the risks concomitant to the inland maritime transportation system and devise effective measures accordingly to evade the accidents. Moreover, this study imparts a practical approach to assess the dynamic risk associated with inland waterways traffic. The results of this study could be utilized as a guide for devising safety systems, policies, and rules that would ensure a safer inland waterways transportation system and in turn augment the economic conditions of the concerned companies and authorities. It could help in developing a safer and greener transportation system devoid of pollution, life, and monetary losses.
The next section provides a detailed literature review, while Section 3 provides the details of the adopted methodology. Section 4 contains application of the developed methodology to the Chinese inland waterways transportation system case study. Meanwhile, Section 5 provides a conclusion of this study.

2. Literature Review

With the manifold increase in maritime traffic, the accident risk associated with it has also increased. Minimizing the risk and evading the accidents have remained a point of focus for the scholars, maritime industry, governments, and international organizations. Maritime transportation has a complex operational and safety system. The majority of the accidents taking place are attributed to the flaws in human, ship, and environment systems [5,6]. These accidents can be classified into collision, grounding, sinking, fire and explosions, and various other categories. Similarly, scholars have adopted a range of methods and approaches to analyze and study these accidents and the causation factors.
These approaches have been broadly classified as qualitative and quantitative methods. A study aimed at the estimation of ship collision frequency developed a quantitative risk assessment (QRA) model based on the event tree analysis (ETA) [10]. This study analyzed the ship accident frequency and consequences under the effect of various factors considering several accident scenarios. Similarly, in another study, Bayesian networks (BNs) have been used in conjunction with fault tree analysis (FTA) to analyze the ship collision scenarios in open waters under the combined effect of human and organizational factors [2]. Bayesian networks have been acknowledged as an effective and reliable tool in the maritime accident risk analysis, and extensively used in the literature. Moreover, BNs have been used extensively to analyze the crash frequencies and their corresponding consequences incorporating real time past accidents data [11,12,13,14]. BNs have also been employed to conduct a quantitative risk assessment of the tankers collision and associated oil spill [15].
Risk assessment and safety analysis in the maritime transport holds significant prominence and has a long history. In the conventional risk assessment methods, the system is analyzed for only two states as “normal” and “failure” [7]. However, from a practical perspective, the different components of the system at the time of an accident or an undesired event are not all in the same state. Some of the components may experience a total failure, while other may exhibit smaller discrepancies or function normally. In concurrence to this practical scenario, the binary state system can be regarded as a special case of the much-needed multi-state system. An overview of the literature suggests that scholars have been opting and preferring the multi-state system over the conventional binary state system, as the multi-state system integrates a multidimensional influence of various practical scenarios and hence imparts a more holistic view of the accidents [16,17,18].
An analysis of the available literature indicates that the multi-state system has been employed in the ETA and FTA approaches. However, attributed to unavailability of sufficient data, it is regarded much more intricate and challenging to reliably forecast the failure frequency and accident probability. To overcome this constraint, a fuzzy set theory-based FTA approach was proposed to analyze the spread mooring system [19]. However, another issue reported in this regard is the exponential increase in the computational dimensions of ETA and FTA with increase of the states [20]. Another contribution in this domain was the introduction of an algorithm with the capability to map the multi-state fault tree to a BN model. It imparted the capability to obtain the probability distribution of each system state and their role towards the likelihood of failure [21]. BNs facilitated with multi-states have also been incorporated to analyze the multi-state degradation system and the braking system of a maglev train [7,8,9,10,11,12,13,14,15,16,17,18,19,20]. Attributed to its ability of capturing the probability change with the passage of time, the multi-state approach has been extensively utilized in the reliability analysis and risk management domains.
Therefore, analyzing the dynamic change in the states of a system holds significant practical vitality [22]. Various studies have been conducted in this regard including the analysis of cargo loading system [23], utilization of the Semi-Markov model being optimized by the linear programming to assess the bulk cargo transportation [24], and the analysis of port grain transportation system employing the Semi-Markov model [25]. The multi-state approach in conjunction with the dynamic BN theory have also been employed to analyze the mechanical hydraulic lifting system [26]. Similarly, the multi-state system in amalgamation with the Semi-Markov model have been utilized to evaluate the complexities of container gantry crane system [27]. Therefore, in concurrence to the existing literature, it can be concluded that multi-state approach has been employed extensively and in veracity in diverse systems and has been reported as consistent, reliable, and accurate based on the results.
Furthermore, the diverse characteristics of a system are reported to change over time, subject to different reasons. It has been regarded as a more practical demonstration of the nature of dynamic cause–consequence scenarios. Therefore, it is recommended to consider the system as dynamic and due consideration be given to various stages involved in a complex system failure [28]. In this regard, Markov modelling and the Markov Chain Monte Carlo (MCMC) simulations have been found to be reliable and efficient in forecasting the accident risk probabilities of the real-world complex maritime transportation system [29].
This study is aimed to integrate the multi-state approach with the Markov model and develop a methodology that successfully captures the dynamic nature of the complex system failure. The different states considered for the system are “normal”, “safety failure”, and “dangerous failure”. The failure system will be analyzed on the basis of these states as a function of the effect initiated by variations in the human, ship, and environment related factors. Each of these factors have been classified to sub factors and the risk fluctuation, its probability, and system reliability will be analyzed as a function of the different failure levels of these factors and sub factors.

3. Methodology

The adopted methodology integrating the polymorphic approach and Markov model and its application in the multi-state inland waterway transportation system risk analysis have been elaborated in detail in the following subsections.

3.1. Maritime Transportation Polymorphic System

3.1.1. Maritime Transportation System Scheme

Marine transportation system safety is subject to various factors including human error, environmental conditions, along with conditions of ships [5,6]. From the maritime traffic engineering perspective, the maritime transportation system S is composed of the human subsystem S 1 , the ship subsystem S 2 , and the environment subsystem S 3 , which are interrelated and have a profound influence on the system safety properties [30,31,32].
In the maritime transport system, based on the Formal Safety Assessment (FSA), ship accident analysis usually considers ship condition, organizational management, human operation, and hardware [33]. The accident information including ship names, accident dates, accident types, consequences, locations, ship types and gross tonnages, and causes are determined based on accident reports of 263 Chinese inland waterway ship accidents with detailed information according to the Lloyd’s Maritime Intelligence Unit and the IMO [33]. Based on the ⟪International Regulation for the preventing Collision at Sea⟫ and the rules of the People’s Republic of China for the prevention of river vessel collisions, the accident causes and the specific definitions are identified.
Human factors have always remained the main causation factors of maritime traffic accidents. According to the international ship safety operation and pollution prevention management rules (ISM rules) of International Maritime Organization (IMO), about 80% of maritime traffic accidents are attributed to human factors [34,35]. Human system factors refer to those influences initiated by human behavior or decisions affecting the whole system. The failure mode and causes determined are Management, Sailor, Navigation rules, Watch, Danger recognition, and measures.
For ships and ship equipment with low reliability, technical transformation must be carried out to make them compatible with human subjectivity. Concurring to the analysis of accident reports, the factors affecting the ship subsystem mainly include: Vessel age, Equipment, and Stability.
The environment system refers to the specific working conditions for the coexistence of people and ships, including the natural environment such as wind, current, and wave. The channel environment stands for domains such as the depth and navigable width of the channel, while, the traffic environment such as the type, size, quantity, and dynamics of other ships in the navigable waters. Unsatisfied shipping environment will lead to bad psychological state, reducing the reliability of human behavior and initiating various accidents. The environmental subsystem mainly includes four factors: Visibility, Navigation condition, Seasonality, and Wind, which are classified according to their failure modes.
Overall, the system and subsystem scheme are shown in Figure 1.
Failure mode describes how the component fails leading to the top undesired event [36] (p. 2.12). The failure mode and causes of maritime transportation system factors are as shown in Table 1.

3.1.2. The Maritime Transportation System Reliability and Risk

In the system safety risk assessment methodologies, it is assumed that a system S consists of n components E i ( i = 1 , 2 , , n ). The state condition of component E i ( i = 1 , 2 , , n ) at time t   ( t T ) is f i ( t ) { 0 , 1 , 2 , , k 1 } , which indicates the normal state to the complete failure state from 0 to k 1 , where 0 represents the perfect state and k 1 represents the complete failure state, while the others are degradation states. G ( i ) is the set of all possible states of component i so f i ( t ) G ( i ) . Based on this, vector F ( t ) = ( f 1 ( t ) , f 2 ( t ) , , f n ( t ) ) is used to describe the state of system and the function of system state at time t is developed as K ( t ) :
K ( t ) = K ( F ( t ) ) = K ( f 1 ( t ) , f 2 ( t ) , , f n ( t ) )
The multi-state reliability function of a component ( i = 1 , 2 , , n ) is the probability that the component E i ( i = 1 , 2 , , n ) in the reliability state subset z { 0 , 1 , 2 , , k 1 } at time t   ( t T ) is:
R i   ( t , · ) = [ R i   ( t , 0 ) , R i   ( t , 1 ) , , R i   ( t , z ) ]
where
R i   ( t , u ) = P ( f i ( t ) > u | f i ( 0 ) = z )
referring to the probability that the component E i in the reliability state subset { u , u + 1 , , z } at the time t   ( t T ) while it was in the reliability state z at the moment t = 0.
In this study, the following three states of the subsystems are distinguished and defined:
  • State 0—Normal state: The subsystem is fully safe;
  • State 1—Safe failure state: The subsystem is less safe, but it still works;
  • State 2—Dangerous failure state: The subsystem is dangerous;
The risk of the system is defined as R , so the risk of the system R ( k ( t ) ) can be evaluated as:
R ( k ( t ) ) = r ( P A ( K ( t ) , S A ( K ( t ) )
where A is the set of all possible accidents when the system state is K ( t ) . P A ( K ( t ) ) is the probability of accidents. S A ( K ( t ) ) represents the severity of accident consequence.
In this study, the system risk state R ( k ( t ) ) is divided into low, medium, and high levels. According to this, system state G n includes low-risk state collection G L R , medium-risk state collection G M R , and high-risk state collection G H R . It is obvious that G L R   G M R   G H R = G n and G L R   G M R = G L R   G H R = G M R   G H R = . The equations attained are:
G L R = { K ( t ) | R ( K ( t ) ) R L , K ( t ) G n ,   t T }
G M R = { K ( t ) | R ( K ( t ) ) R M , K ( t ) G n ,   t T }
G H R = { K ( t ) | R ( K ( t ) ) R H , K ( t ) G n ,   t T }
There are three subsystems, and every subsystem has 3 states, thus the maritime transportation system can be divided into the following 27 states according to the subsystem states. Based on the causes of ship accident from the report, the result of allocating the 27 states of the polymorphic inland waterway transportation system risk state to the low-risk, medium-risk, and high-risk state system is depicted in Figure 2.

3.2. The Markov Model of Maritime Transportation System

Maritime Transportation System is very complex, and it is difficult to analyze its reliability, availability, and safety.

3.2.1. The Markov Model of Maritime Transportation System

The state of the system risk in low, medium, and high-risk state is dynamic. For example, the system is in safe condition at the initial time. However, with the passage of operating time, components are likely to lose efficacy. At the same time, the system risk gradually increases from low risk to medium risk, and then to high risk. The low-risk state will become medium-risk or high-risk state with their own transfer paths to change.
The transitions between the components’ safety states are assumed possible only from better to worse [7]. At a certain time, the inland waterway transportation system state belongs to one of the low, medium, and high-risk states. Then, starting from the current risk state, it goes through a one-step transition to reach a new low, medium, and high-risk state. The transition process can be described as Figure 3.
Due to the dynamic changes in safety levels of maritime transportation systems, a Markov model is established to analyze the change of system state, as shown in Figure 4.

3.2.2. The Occurrence of Markov Model

In a Markov model, each occurrence between different risk states is characterized by an occurrence rate λ k l , where k and l indicate the start and end states, respectively [37].
The definition of Markov Model transfer process is provided in Table 2. Based on the ⟪Method for classification and statistics of waterway traffic accidents⟫ published by the China Ministry of transportation in 2014, the collected accident sample reports are classified as slight, general, and serious accident according to the casualties, monetary losses, and environmental pollution.
The method proposed by Faghih-Roohi is used to calculate the initial system state transition matrix in Markov model [29]. It was proved to be applicable to any type of marine accident when only a limited amount of information is available. In the three-state Markov model, it is assumed that the occurrence of states can be calculated with λ k l in matrix G through Equation (8), and the state transition matrix can be described through Equation (9).
G = [ ( λ 01 + λ 02 ) λ 01 λ 02 0 λ 12 λ 12 0 0 0 ]
P = [ π 01 ( t ) = e ( λ 01 + λ 02 ) t π 02 ( t ) = λ 01 e λ 12 t ( 1 e ( λ 01 + λ 02 λ 12 ) t ( λ 01 + λ 02 λ 12 ) 1 π 01 ( t ) π 02 ( t ) 0 e λ 12 t 1 e λ 12 t 0 0 1 ]
where π l k ( t ) is equal to the occurrence probability from state k to l at time t .
To calculate the probability that the system risk state is in low, medium, or high-risk state, the steps are as follows:
Step 1. Determine the system state K ( t ) at the initial time, indicating that the system is in low, medium, or high-risk state, respectively with (1, 0, 0), (0, 1, 0), and (0, 0, 1).
Step 2. Determine the state transition matrix P under the current system risk state.
Step 3. Calculate the probability that the system is in a low, medium, and high-risk state R ( k ( t ) ) · P ( n ) after n -step transitions.
Step 4. Estimate the time when the high-risk state reaches the unacceptable level and the time when the system transfers to the high-risk state.
Following these steps, maritime transportation system risk can be estimated based on the current system state and the occurrence probabilities of the Markov model.

4. Case Study

4.1. Data Resources

Maritime traffic safety and risk analysis is a comprehensive and complex domain, which requires methods, qualitative analysis and quantitative calculation, and the combination of data, expert judgment, and simulation. On the basis of the collected data from reports of inland waterway accidents in China, the system risk assessment of this study adopts the quantitative assessment method to evaluate the maritime transportation system state, and constructs the Markov model to analyze the change of system state.
Initial data were collected from ⟪Compilation of inland river ship accidents⟫ compiled by China Strategy Institute of Ocean Engineering. A total of 263 inland waterway ship accident reports with complete and available information in concurrence to the common criteria set for it, over the 17-year period from 2000 to 2016 were obtained. Although these accidents took place in China, but they have significant association to the maritime traffic safety. Chinese inland waterway traffic accidents occurrences are shown in Table 3.
The breakdown of accidents on the basis of involved ship type, accident types, consequences type, and gross tonnage is illustrated in Figure 5. The available material and data indicate that accidents have happened more often on cargo ships with the gross tonnage between 300–1000(t) throughout the history of Chinese inland waterways shipping. Collision has remained the most frequent accident during the last 17 years.

4.2. Calculation Results

Failure occurrence rate is the probability that the component experiences a failure during T, necessarily for the first time, given no failure at time zero [36] (p. 2.8). Based on the accident data mentioned above, the failure occurrence rate λ k l is calculated by the number of collisions N and the time of accident occurrence [38]. The result of the occurrence rate of slight, general, and serious accident is shown in Table 4 based on Equation (10).
λ k l = N 365 24 T
According to Equations (6) and (7), for one hour as a unit time, the initial system state transition matrix is:
P = [ 1 6.65 × 10 4 3.36 × 10 4 3.29 × 10 4 0 1 1.10 × 10 3 1.10 × 10 3 0 0 1 ]
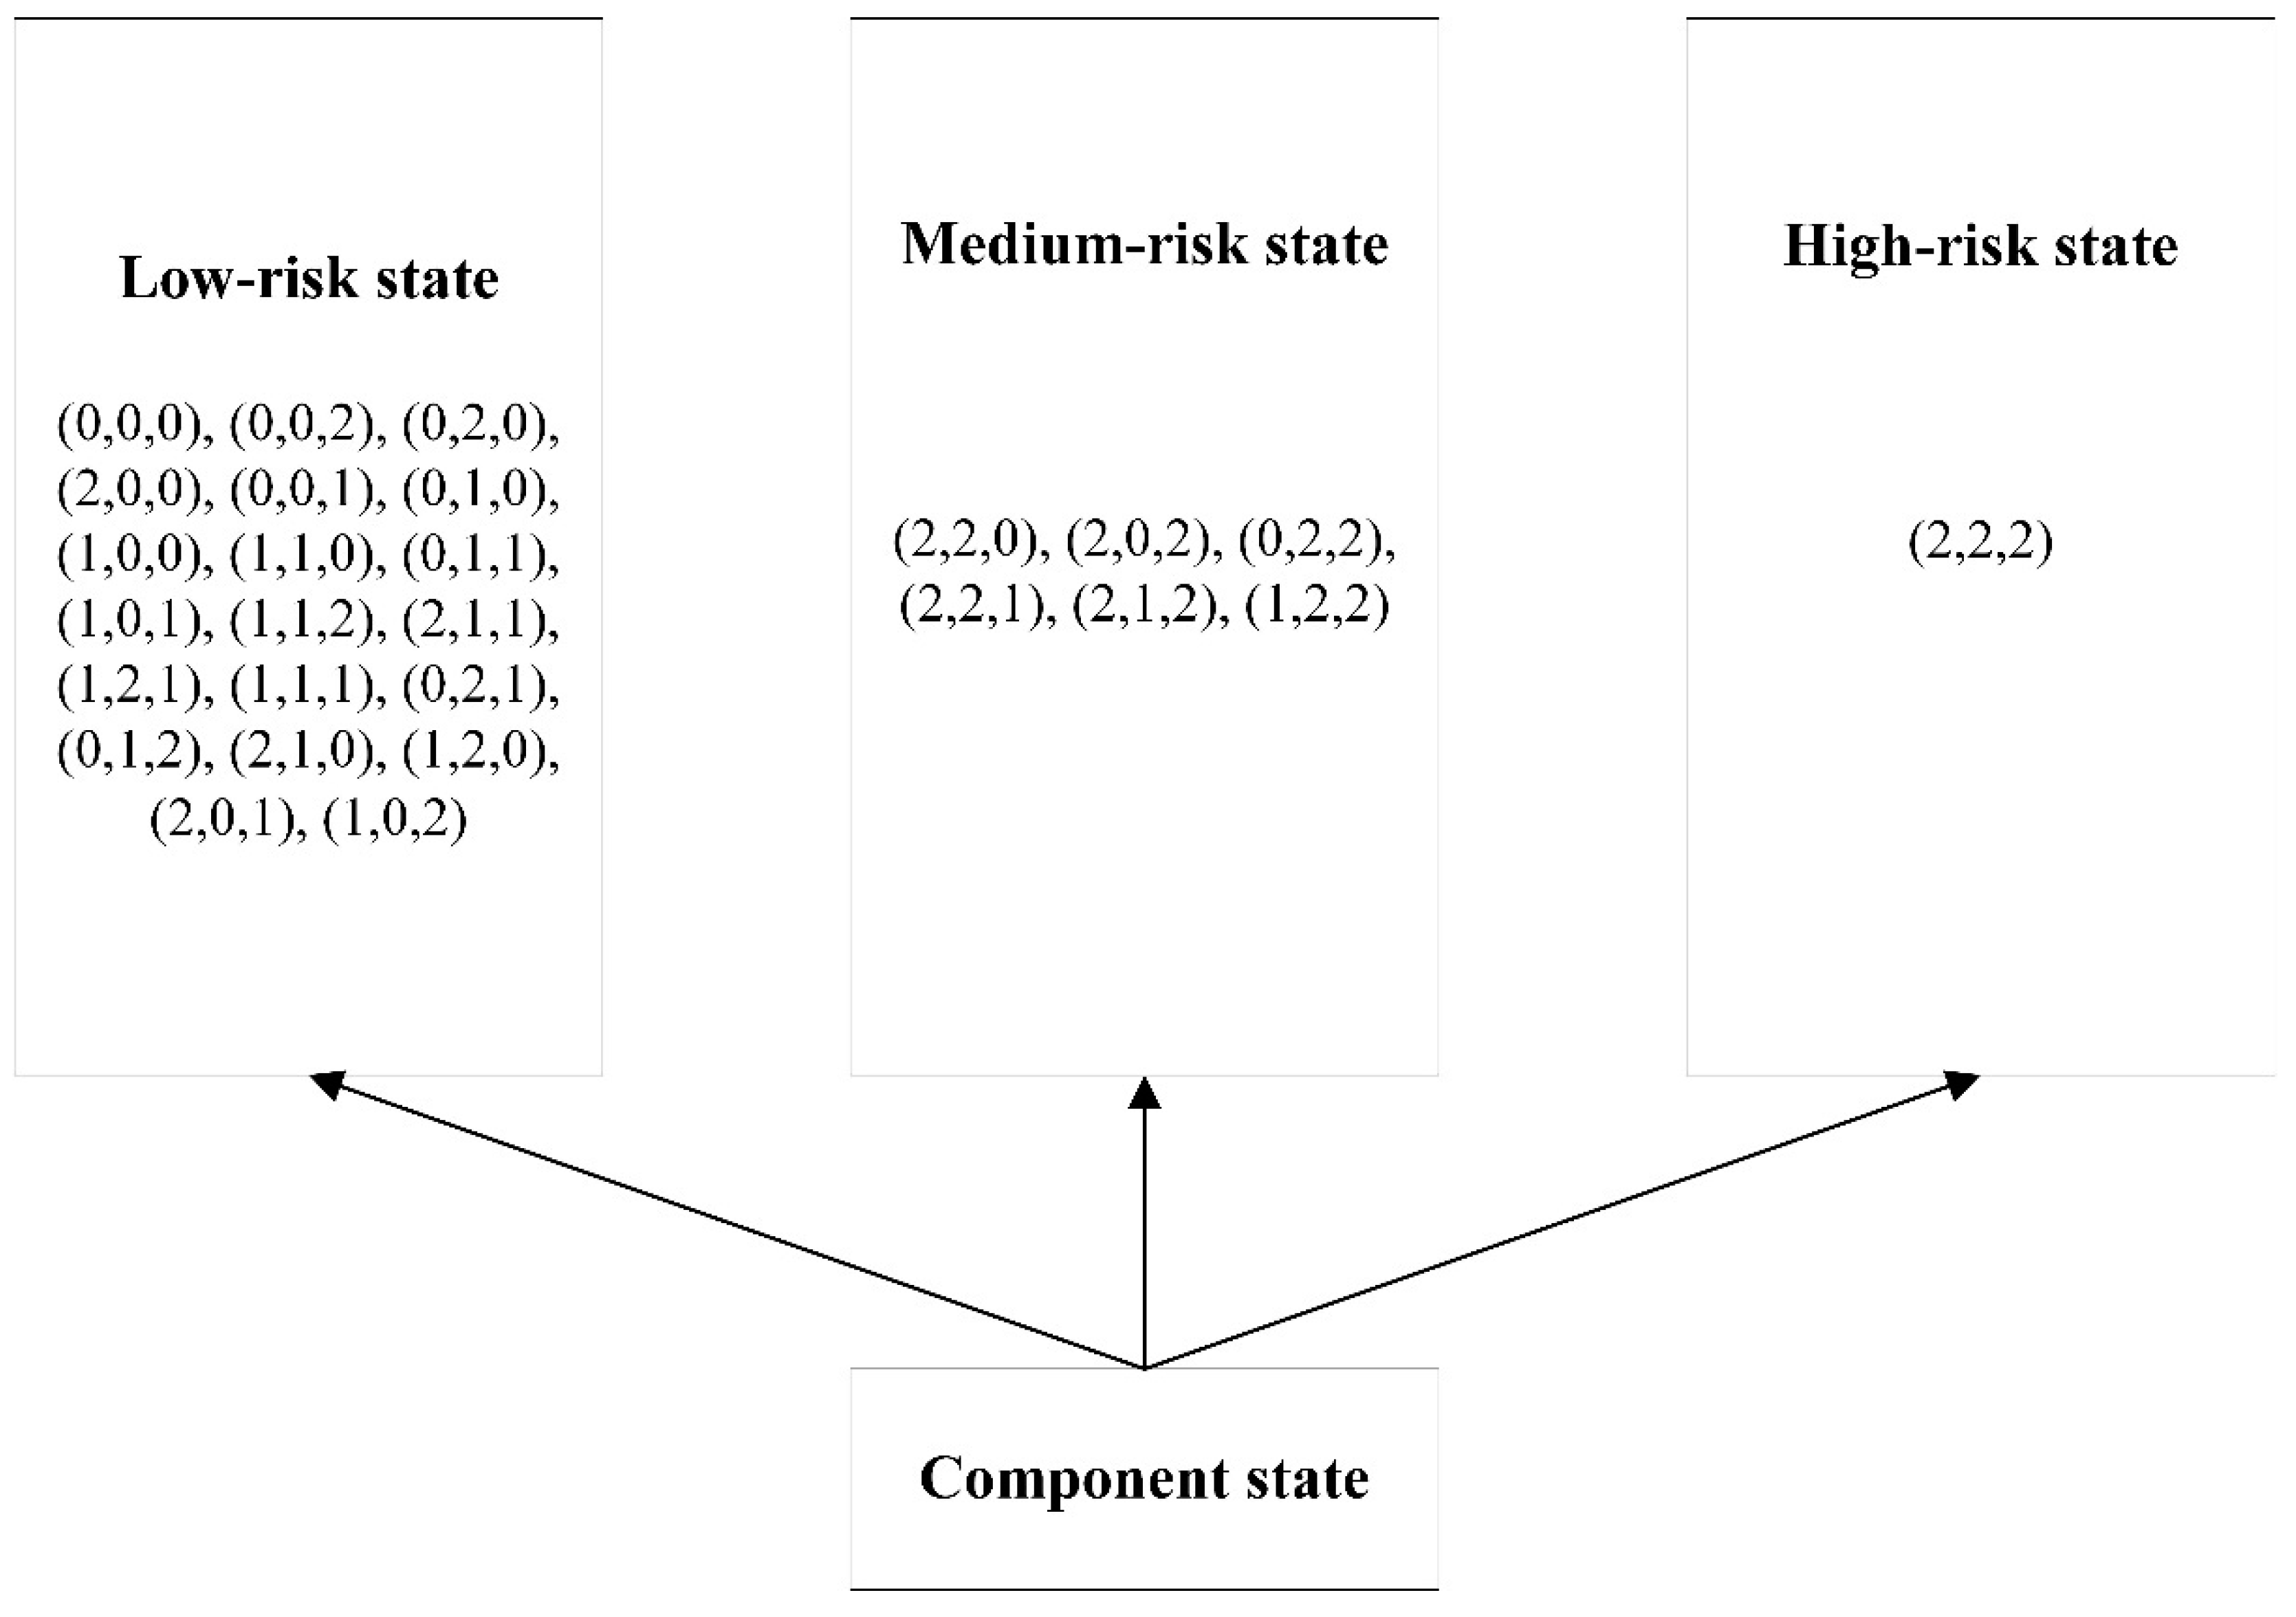
Assuming the system risk state R ( k ( t ) ) at the initial time is in medium-risk state, the system risk state was calculated based on the system state transition matrix. The change of probability of the system in low, medium, and high-risk state during 10 hours after the system starts to operate from the current risk state is shown in Figure 6. From the obtained results, it is obvious that the probability of high-risk state increases and the probability of medium-risk state decreases with the passage of time.
In order to ensure safety, the system operation requires to avoid reaching the high-risk state or keep the probability of being in the high-risk state as low as possible. So, the high-risk state is a state that needs to be focused on. The arrival time of high-risk state refers to the time when the system reaches high-risk state. Scientific and reasonable estimation of it can guide vessel operators to take control measures in time, reducing accidents, and ensuring system safety. This approach is suitable and expedient to estimate the time when the high-risk state reaches the unacceptable level, and the time when the system transfers to the high-risk state.
In order to assess the system risk, appropriate risk acceptance criteria should be established [39]. The maximum tolerable risk for crew members is set as 10 3 annually. For passengers, the criterion is stricter and about 10 4 [33]. Vanem [39] proposed individual risk acceptance criteria for LNG crew to be 10 6 10 3 in concurrence to the As Low As Reasonably Practicable (ALARP) principle. In this study, due to the larger effect of crew members over the risk and the in-time information sharing of the risk, the unacceptable probability of high-risk state is set as p 1 = 10 3 . The time t for the system to reach the unacceptable probability of high-risk state can be obtained.
In addition, to see the change of probability of medium and high-risk state, the time to reach the p 2 = 10 1 , p 3 = 0.5 , p 4 = 0.9 ,   p 5 = 1 can be employed as depiction to ship owner that if actions are not been taken in time, the probability of reaching high-risk state will increase and accidents will occur ultimately. The results in Table 5 show that the time corresponding to the unacceptable probability of the system is t 1 = 1 , t 2 = 96 , t 3 = 630 , t 4 = 2093 , t 5 = 13,183 hours, after the system starts to operate from the current medium-risk state.
In the same way, assume the system risk state R ( k ( t ) ) at the initial time is in low-risk state. The change of probability of the system in low, medium, and high-risk state during 10 hours after the system starts to operate from the low-risk state is shown in Figure 7.
The results in Table 6 show that the time corresponding to the unacceptable probability of the system is t 1 = 4 , t 2 = 291 , t 3 = 1520 , t 4 = 4214 , t 5 = 22,671 hours after the system starts to operate from the current low-risk state.
When the current maritime system is in the low-risk state, the probability of high-risk state will reach 10 3 after operating the ship for 4 hours. Similarly, if the current maritime system is in the medium-risk state, more attention should be paid to take actions as it will escalate to high risk in one hour. In order to provide control options to shipowners and ship crew for improving safety, this study analyzed the factors that are related to the system reliability and risk and hence highlighted accident causes.

4.3. System Reliability

From the results of the time to reach unacceptable probability of low, medium, and high-risk state in Section 4.2, the change of probability of the system state can be seen. Moreover, the safety of inland water transportation system S is related to various factors. According to Section 3.1.2, human subsystem S1 is composed of five components, ship subsystem S 2 is composed of three components, while the environment subsystem S 3 is composed of four components. Due to the different failure modes and failure occurrence rate of these parameters, the reliability and risk fluctuation of different subsystem are analyzed in this section.
Reliability is the probability that the component experiences no failure during the time interval (0, t), given that the component was as good as new at time zero. Reliability is sometimes also called probability of survival [36] (p. 2.10). Based on the accident data mentioned in Section 4.1, the failure occurrence rate is calculated by the number of occurrence and the time of accident occurrence. According to Equation (10), the system failure mode and failure occurrence rate can be obtained in Table 7.
According to the definition in Section 3.2.2, the component E 1 i of human subsystem S 1 having reliability functions as:
R i   ( t , 1 ) = e x p ( λ i 1 ( 1 ) t )
R i   ( t , 2 ) = e x p ( λ i 1 ( 2 ) t )
R i   ( t , 3 ) = e x p ( λ i 1 ( 3 ) t )
From the above, the element of Management having reliability functions as R 1   ( t , 1 ) = e x p ( 0.000449 t ) ;   R 1   ( t , 2 ) = e x p ( 0.000128 t ) ;   R 1   ( t , 3 ) = e x p ( 0.000235 t )   .
For the same reason, the element of Sailor having reliability functions as R 2   ( t , 1 ) = e x p ( 0.001013 t ) ;   R 2   ( t , 2 ) = e x p ( 9.28 E 05 t ) ;   R 2   ( t , 3 ) = e x p ( 0.000121 t )   .
The element of Navigation rules having reliability functions as R 3   ( t , 1 ) = e x p ( 0.000778 t ) ;
The element of Watch having reliability functions as R 4   ( t , 1 ) = e x p ( 0.000999 t ) ;
The element of Danger recognition and measures having reliability functions as R 5   ( t , 1 ) = e x p ( 0.000157 t ) ;
Taking the human subsystem as an example: The reliability function of human subsystem S 1 is defined according to Equation (3):
R 1   ( t , 1 ) = 1 i = 1 3 R i 1 ( t , 1 ) = 1 e x p ( 1 i = 1 3 λ i 1 ( 1 ) t )
The risk function of the system is:
r i ( t ) = 1 R i   ( t , 3 ) = e x p ( 1 i = 1 3 λ i 1 ( 3 ) t )
From the above equation, we can get the reliability function of human subsystem as
R 1   ( t , 1 ) = 1 { 1 e x p [ ( λ 1 1 ( 1 ) + λ 2 1 ( 1 ) + λ 3 1 ( 1 ) + λ 4 1 ( 1 ) + λ 5 1 ( 1 ) ] t ] } = e x p ( 0.003396 x )
R 1   ( t , 2 ) = 1 { 1 e x p [ ( λ 1 1 ( 2 ) + λ 2 1 ( 2 ) + λ 3 1 ( 2 ) + λ 4 1 ( 2 ) + λ 5 1 ( 2 ) ] t ] } = e x p ( 0.000221 x )
R 1   ( t , 3 ) = 1 { 1 e x p [ ( λ 1 1 ( 3 ) + λ 2 1 ( 3 ) + λ 3 1 ( 3 ) + λ 4 1 ( 3 ) + λ 5 1 ( 3 ) ] t ] } = e x p ( 0.000357 x )
r 1 ( t ) = 1 R 1   ( t , 3 ) = 1 e x p ( 0.000357 x )
For the same reason, the reliability function of ship system S 2 is:
R 2   ( t , 1 ) = 1 { 1 e x p [ ( λ 1 2 ( 1 ) + λ 2 2 ( 1 ) + λ 3 2 ( 1 ) ] t ] } = e x p ( 0.000635 x )
R 2   ( t , 2 ) = 1 { 1 e x p [ ( λ 1 2 ( 2 ) + λ 2 2 ( 2 ) + λ 3 2 ( 2 ) ] t ] } = e x p ( 9.275 e 05 x )
R 2   ( t , 3 ) = 1 { 1 e x p [ ( λ 1 2 ( 3 ) + λ 2 2 ( 3 ) + λ 3 2 ( 3 ) ] t ] } = e x p ( 2.854 e 05 x )
r 2 ( t ) = 1 R 1   ( t , 3 ) = 1 e x p ( 2.854 e 05 x )
Furthermore, the reliability function of environment system S 3 is:
R 3   ( t , 1 ) = 1 { 1 e x p [ ( λ 1 3 ( 1 ) + λ 2 3 ( 1 ) + λ 3 3 ( 1 ) + λ 4 3 ( 1 ) ] t ] } = e x p ( 0.002276 x )
R 3   ( t , 2 ) = 1 { 1 e x p [ ( λ 1 3 ( 2 ) + λ 2 3 ( 2 ) + λ 3 3 ( 2 ) + λ 4 3 ( 2 ) ] t ] } = e x p ( 0.001605 x )
r 3 ( t ) = 1 R 1   ( t , 3 ) = 1 e x p ( 0.001605 x )
The graph of the human, ship, and environment subsystem reliability and risk function are shown in Figure 8. From results of the three subsystems, the relationship between the system reliability and the accident occurrence rate can be seen. With regards to the failure, the ship owner’s responsibilities and crew duties including low quality of sailor, violation of the navigation rules, negligence of watch, and improper situation or risk recognition and delayed action and control measures have a higher occurrence rate and effect than the ship and environment factors. In Figure 8a, the reliability of human subsystem decreased much faster than environment and ship subsystem. In addition, the bad visibility and the ship density in navigation environment have a high occurrence rate and influence in the accident causation. Figure 8c shows the importance of the environment subsystem with respect to the appearance of failure mode 2. For failure mode 3, management and sailor have a higher failure rate than the equipment factor. Figure 8e shows that the reliability of human subsystem descends to a larger extent than the ship subsystem.
With regard to the risk function, the risk of the ship system increased slower, as the failure rate of vessel age, equipment, and stability have a low frequency of occurrence. As a result, more attention should be paid to human and environment subsystems. It is meaningful to analyze the causes of accident in the safety analysis and assessment of maritime transportation system based on the real-time data from accident reports. The most prominent contribution of this study is that it lists some methods aimed at the control of some prominent causes of accidents, hence providing means to control the maritime transportation system risk.
  • Methods for Human System
The results show that one of the main reasons for accident is the lack of crew’s sense of responsibility, which highlighted the importance of the strategy of training of the crews aimed at risk reduction. It is vital to check the qualification of crew and increase the awareness of the importance to obey the international conventions. Referring to the delayed action and measures and the improper danger recognition, if these issues and flaws are rectified, it can certainly reduce the losses of accident and save more people. Strengthening the crew training and enabling and preparing them to take effective and timely actions to sudden and rare severe weather environments or unsatisfactory condition of ship equipment are the key factors in human system resilience.
  • Methods for Ship System
Even though the ship equipment shortage and failure have low occurrence, more attention should be paid to keep the ship in good stability. Furthermore, much more importance must be given to safety equipment, especially lifeboats, fire extinguishers, and so on, which certainly enhance the chances of survival for those onboard.
  • Methods for Environment System
As the environmental factors like visibility and navigation environment have a higher influence on the reliability of the system, the local government shall record the geographical condition and mark the dangerous points on the map to provide guidance for ships on prominent and busy channels. Ships can get these records from government or associated organizations to make decisions when the shipping conditions are complicated.

5. Conclusions

In this study, a risk state-based probability model was developed for the maritime traffic safety utilizing the multi-state system concept. The methodology adopted was an amalgamation of the Markov and multi-state system approaches. The developed model and methodology were applied to a case study of Chinese inland waterways ship accidents analyzing the potential risks and possible safety improvements. From the study, useful insights are obtained as follows:
  • The model developed in this study not only forecast the time at which the system crosses the defined tolerable probability limit, but also determines the time at which system reaches the high-risk state. Also, this model provides reliable basis for the effective prediction and monitoring of the system risks.
  • Attributed to its ability to forecast the future safety state of the maritime traffic system, this study provides a solid theoretical background to develop and devise a holistic safety management system and policy for the maritime traffic safety.
  • Moreover, considering the intricate multidimensional interconnectivity and association between the factors affecting the maritime traffic safety system, a rigorous analysis of the human, ship, and environment factors was conducted. These factors are considered most prominent in the maritime traffic safety domain and plays a critical role in averting the risk and evading the accidents.
The results obtained can serve as an effective starting point for a more comprehensive and holistic future investigation and analysis of the Chinese inland waterways traffic system. However, the study still has some limitations. First of all, the data of incidents are not 100% observable; some accidents that have minor consequence may not be recorded. Due to the limited amount of ship accident data, the failure occurrence rate needs to be further verified in future studies. In addition, the time scale that this model applied can make a prediction only for a very short time horizon as the ship status, environmental, as well as human situation would change due to the ship movement and the change in weather and navigational conditions. As a follow-up study, an analysis will be useful to measure the degree of importance of the influencing factors. For example, risk analysis approach based on Bayesian networks have been proposed to evaluate the range of change of accident consequences according to the parameters and their conditions [40,41]. Bing Wu et al. [42] have developed sensitivity analysis to analyze the level of safety variations in terms of traffic flow. Future research can be conducted to better understand the relationship between the system reliability and the factors like visibility and traffic density.
Overall, this study can be used as an effective guideline to reduce the environmental pollution caused by oil spills and leakages, fires, and blasts concomitant to the ship accidents. It also has profound monetary and social vitality ensuring green and safer maritime traffic. Moreover, a further development of the recommended methods can produce fecund results not only in the maritime transportation sector but can also be applied to other complex systems.

Author Contributions

Methodology, S.W.; software, S.W.; supervision, J.Y.; writing—original draft, S.W.; writing—review and editing, J.Y. and R.U.K. All authors have read and agreed to the published version of the manuscript.

Funding

This research received no external funding.

Acknowledgments

This research’s initial data was supported by the ⟪Compilation of inland river ship accidents⟫ compiled by China Strategy Institute of Ocean Engineering.

Conflicts of Interest

The authors declare no conflict of interest.

References

  1. Ronald, H.; Lucie, K.; Olaf, M.; Luis, M. Decarbonization pathways for international maritime transport: A model-based policy impact assessment. Sustainability 2018, 10, 2243. [Google Scholar]
  2. Trucco, P.; Cagno, E.; Ruggeri, F.; Grande, O. A Bayesian belief network modelling of organisational factors in risk analysis: A case study in maritime transportation. Reliab. Eng. Syst. Saf. 2008, 93, 845–856. [Google Scholar] [CrossRef]
  3. Li, K.X.; Yin, J.; Fan, L. Ship safety index. Transp. Res. Part A 2014, 66, 75–87. [Google Scholar] [CrossRef]
  4. Montewka, J.; Goerlandt, F.; Kujala, P. On a systematic perspective on risk for formal safety assessment (FSA). Reliab. Eng. Syst. Saf. 2014, 127, 77–85. [Google Scholar] [CrossRef]
  5. Khan, R.U.; Yin, J.; Mustafa, F.S.; Liu, H. Risk assessment and decision support for sustainable traffic safety in Hong Kong waters. IEEE Access 2020, 8, 72893–72909. [Google Scholar] [CrossRef]
  6. Celik, M.; Lavasani, S.M.; Jin, W. A risk-based modelling approach to enhance shipping accident investigation. Saf. Sci. 2010, 48, 18–27. [Google Scholar] [CrossRef]
  7. Qiu, G.Q.; Huang, S.; Zhu, L.L.; Su, X.H.; Chen, Y. Risk assessment of multi-state bayesian network in an oil gathering and transferring system. Procedia Eng. 2015, 130, 1514–1523. [Google Scholar] [CrossRef] [Green Version]
  8. Koowrocki, K.; Soszyńska-Budny, J. Reliability and Safety of Complex Technical Systems and Processes; Springer: London, UK, 2011. [Google Scholar]
  9. Li, S.; Meng, Q.; Qu, X. An overview of maritime waterway quantitative risk assessment models. Risk Anal. 2011, 32, 496–512. [Google Scholar] [CrossRef] [Green Version]
  10. Chai, T.; Weng, J.; Xiong, D.Q. Development of a quantitative risk assessment model for ship collisions in fairways. Saf. Sci. 2017, 91, 71–83. [Google Scholar] [CrossRef]
  11. Mazaheri, A.; Montewka, J.; Kujala, P. Towards an evidence-based probabilistic risk model for ship-grounding accidents. Saf. Sci. 2016, 86, 195–210. [Google Scholar] [CrossRef]
  12. Akhtar, M.J.; Utne, I.B. Human fatigue’s effect on the risk of maritime groundings—A Bayesian network modeling approach. Saf. Sci. 2014, 62, 427–440. [Google Scholar] [CrossRef]
  13. Haenninen, M. Bayesian networks for maritime traffic accident prevention: Benefits and challenges. Accid. Anal. Prev. 2014, 73, 305–312. [Google Scholar] [CrossRef] [PubMed]
  14. Haenmnen, M.; Banda, O.A.V.; Kujala, P. Bayesian network model of maritime safety management. Expert Syst. Appl. 2014, 41, 7837–7846. [Google Scholar] [CrossRef]
  15. Goerlandt, F.; Montewka, J. A framework for risk analysis of maritime transportation systems: A case study for oil spill from tankers in a ship-ship collision. Saf. Sci. 2015, 76, 42–66. [Google Scholar] [CrossRef]
  16. Natvig, B.; Huseby, A.B.; Reistadbakk, M.O. Measures of component importance in repairable multistate systems—A numerical study. Reliab. Eng. Syst. Safe. 2011, 96, 1680–1690. [Google Scholar] [CrossRef] [Green Version]
  17. Xue, J.; Yang, K. Dynamic reliability analysis of coherent multistate systems. Reliab. IEEE Trans. 1995, 44, 683–688. [Google Scholar]
  18. Agnieszka, B.R.; Bozena, K.S.; Joanna, S.B. Reliability and risk improvement of the maritime ferry technical system. In Proceedings of the International Conference on Information & Digital Technologies, Rzeszow, Poland, 5–7 July 2016. [Google Scholar]
  19. Mentes, A.; Helvacioglu, I.H. An application of fuzzy fault tree analysis for spread mooring systems. Ocean Eng. 2011, 38, 285–294. [Google Scholar] [CrossRef]
  20. Long, Z.Q.; Wang, X.W.; Fan, C.X. Braking system multi-state analysis of maglev train based on Bayesian networks. In Proceedings of the 2017 Prognostics and System Health Management Conference (PHM-Harbin), Harbin, China, 9–12 July 2017; pp. 26–33. [Google Scholar]
  21. Jie, C.; Yin, B.; Lu, X. Probabilistic risk assessment of multi-state systems based on Bayesian networks. In Proceedings of the 2016 18th International Conference on Advanced Communication Technology (ICACT), Pyeongchang, Korea, 31 January–3 February 2016. [Google Scholar]
  22. Xiao, H.; Roohi, S.F.; Ng, K.M.; Habibullah, M.S. A risk management-based decision model for a type of dynamic multi-state systems with application on maritime transportation. In Proceedings of the IEEE International Conference on Management of Innovation & Technology, Singapore, 2–5 June 2010. [Google Scholar]
  23. Agnieszka, B.R.; Bozena, K.S. Reliability analysis of the bulk cargo transportation system with independent and dependent redundancy of its components. In Proceedings of the International Conference on Information & Digital Technologies, Rzeszow, Poland, 5–7 July 2016. [Google Scholar]
  24. Kolowrocki, K.; Kwiatuszewska-Sarnecka, B.; Soszynska-Budny, J. Reliability and risk optimization of multistate systems with application to port transportation system. Radio Electron. Comput. 2016, 2, 110–118. [Google Scholar] [CrossRef] [Green Version]
  25. Kolowrocki, K.; Soszynska, J. Reliability and availability analysis of complex port transportation systems. Qual. Reliab. Eng. Int. 2006, 22, 79–99. [Google Scholar] [CrossRef]
  26. Su, C.; Lin, N.; Fu, Y. Multi-state reliability assessment for hydraulic lifting system based on the theory of dynamic Bayesian networks. Proc. Inst. Mech. Eng. Part O J. Risk Reliab. 2016, 230, 533–544. [Google Scholar] [CrossRef]
  27. Kolowrocki, K.; Soszynska-Budny, J. Reliability optimization of complex technical systems and its application to port terminal transportation system. In Proceedings of the 2012 International Conference on Quality, Reliability, Risk, Maintenance, and Safety Engineering, Chengdu, China, 15–18 June 2012. [Google Scholar]
  28. Faghih-Roohi, S.; Xie, M.; Ng, K.M.; Yam, R.C.M. Dynamic availability assessment and optimal component design of multi-state weighted k-out-of-n systems. Reliab. Eng. Syst. Saf. 2014, 123, 57–62. [Google Scholar] [CrossRef]
  29. Faghih-Roohi, S.; Xie, M.; Ng, K.M. Accident risk assessment in marine transportation via Markov modelling and Markov Chain Monte Carlo simulation. Ocean Eng. 2014, 91, 363–370. [Google Scholar] [CrossRef]
  30. Gucma, S. Optimization of sea waterway system parameters in marine traffic engineering. J. Konbin 2013, 26, 51–60. [Google Scholar] [CrossRef] [Green Version]
  31. Wang, H.; Hui, J.; Liang, Y. Cause mechanism of the human factors in maritime accidents based on complex system brittleness. In Proceedings of the Second International Conference on Transportation Information and Safety, Wuhan, China, 29 June–2 July 2013. [Google Scholar]
  32. Xu, Q.Y.; Meng, X.Y.; Wang, N. Intelligent evaluation system of ship management. Int. J. Marine Navig. Saf. Sea Transp. 2009, 4. [Google Scholar] [CrossRef]
  33. Soares, C.G.; Teixeira, A.P. Risk assessment in maritime transportation. Reliab. Eng. Syst. Saf. 2001, 74, 299–309. [Google Scholar] [CrossRef]
  34. Li-Na, L.I.; Yang, S.H.; Cao, B.G.; Zi-Fu, L.I. A summary of studies on the automation of ship collision avoidance intelligence. J. Jimei Univ. 2006, 11, 188–192. [Google Scholar]
  35. Xu, Q.; Zhang, C.; Ning, W. Multiobjective optimization based vessel collision avoidance strategy optimization. Math. Probl. Eng. 2014, 2014, 9. [Google Scholar] [CrossRef] [Green Version]
  36. Disasters, C.F.O. Methods for determining and processing probabilities. TNO CPRE 1997. [Google Scholar] [CrossRef]
  37. Thedéen, T. Risk Analysis; Springer: Berlin/Heidelberg, Germany, 2010. [Google Scholar]
  38. Zaman, B.M.; Kobayashi, K.; Wakabayashi, N.; Maimun, A. Risk of navigation for marine traffic in the malacca strait using AIS. Proc. Earth Planet. Sci. 2015, 14, 33–40. [Google Scholar] [CrossRef] [Green Version]
  39. Vanem, E.; Antão, P.; Stvik, I.; Comas, F.D.C.D. Analysing the risk of LNG carrier operations. Reliab. Eng. Syst. Saf. 2008, 93, 1328–1344. [Google Scholar] [CrossRef]
  40. Likun, W.; Zaili, Y. Bayesian network modelling and analysis of accident severity in waterborne transportation: A case study in China. Reliab. Eng. Syst. Saf. 2018, 180, 277–289. [Google Scholar]
  41. Zhang, D.; Yan, X.P.; Yang, Z.L.; Wall, A.; Wang, J. Incorporation of formal safety assessment and Bayesian network in navigational risk estimation of the Yangtze River. Reliab. Eng. Syst. Saf. 2013, 118, 93–105. [Google Scholar] [CrossRef]
  42. Wu, B.; Wang, Y.; Zhang, J.; Savan, E.E.; Yan, X. Effectiveness of maritime safety control in different navigation zones using a spatial sequential DEA model: Yangtze River case. Accid. Anal. Prev. 2015, 81, 232–242. [Google Scholar] [CrossRef] [PubMed]
Figure 1. The general scheme of the inland waterway transportation system S .
Sustainability 12 05728 g001
Figure 2. Risk state collection distribution based on the polymorphic system risk state.
Sustainability 12 05728 g002
Figure 3. The transition process of system risk state.
Sustainability 12 05728 g003
Figure 4. Markov model of maritime system.
Sustainability 12 05728 g004
Figure 5. The distribution over (a) Ship types, (b) Gross tonnage(t), (c) Accident type, (d) Accident consequence.
Sustainability 12 05728 g005
Figure 6. The change of probability of the system.
Sustainability 12 05728 g006
Figure 7. The change of probability of the system.
Sustainability 12 05728 g007
Figure 8. The reliability function of (a). state 1 (c). state 2 (e). state 3 and the risk function of (b). human system (d). ship system (f). environment system.
Sustainability 12 05728 g008
Table 1. The Failure mode and Causes of Maritime Transportation System Factors.
SystemElementFactorsFailure ModeCauses
S1 (Human)E1Management1Shipowner’s irresponsibility
2Management failure
3Both
E2Sailor1Inadequate Training and education of Sailor
2Insufficient staff
3Both
E3Navigation rules1Violation of Navigation rules
S14Watch1Negligence
S15Danger recognition and measures1Delayed action
S2 (Ship)S21Vessel age1Old
S22Equipment1Equipment shortage
2Equipment failure
3Both
S23Stability1Lack of stability
S3 (Environment)S31Visibility1Moderate
2Bad
S32Navigation environment1Moderate ship density
2High ship density
S33Seasonality1Dry season
S34Wind14–7
2> 7
Table 2. Markov Model transfer process.
ProcessCategoryPersonnel Death/InjuryCost and Equipment Damage (CNY)Environmental Impact
λ 01 normal state →safety failure stateSlight accidentNo injuryloss of less than 20 thousandNo Impact
λ 02 normal state →dangerous failureGeneral accidentInjuriesloss of 20–50 thousandSlight impact
λ 12 safety failure state →dangerous failure stateSerious accidentFatalitiesloss of more than 50 thousand
Table 3. China inland waterway traffic accidents occurrences from 2000 to 2016.
200020012002200320042005200620072008
Slight002001318
General010024632
Serious233796101711
Total24571111192121
20092010201120122013201420152016Total
Slight3349583050
General3444376049
Serious1610820201552164
Total221716332830142263
Table 4. The occurrence rate of the Markov Model.
λ 01 λ 02 λ 12
Occurrence typeSlight accidentGeneral accidentSerious accident
Occurrence5049164
Occurrence rate 3.36 × 10 4 3.29 × 10 4 1.10 × 10 3
Table 5. Time to reach unacceptable probability of medium and high-risk state.
p = 10 3 p = 10 1 p = 0.5 p = 0.9 p = 1
medium-risk state62772093630860
high-risk state196630209313,183
Table 6. Time to reach unacceptable probability of low, medium, and high-risk state.
p = 10 3 p = 10 1 p = 0.5 p = 0.9 p = 1
low-risk state10,385346210421590
medium-risk state3437
high-risk state42911520421422671
Table 7. China inland waterway traffic system failure mode and failure occurrence rate.
ElementsComponent0Failure Occurrence Rate1Failure Occurrence Rate2Failure Occurrence Rate3Failure Occurrence Rate
Management E 11 1490.001063630.000449180.000128330.000235
Sailor E 12 910.0006491420.001013139.28E-05170.000121
Navigation rules E 13 1540.0010991090.0007780000
Watch E 14 1230.0008781400.0009990000
Danger recognition and measures E 15 2410.001719220.0001570000
Vessel age E 21 2550.00181985.71E-050000
Vessel device E 22 2240.001598220.000157139.28E-0542.85E-05
Stability E 23 2040.001455590.0004210000
Visibility E 31 430.000307710.0005071490.00106300
Navigation condition E 32 890.0006351220.00087520.00037100
Seasonality E 33 1850.00132780.0005570000
Wind E 34 1910.001363480.000342240.00017100

