Article

Improved Multi-Objective Optimization Model for Policy Design of Rental Housing Market

1
School of Management, Xi’an University of Architecture and Technology, Xi’an 710055, China
2
Department of Engineering, University of Cambridge, Cambridge CB3 0FA, UK
3
Department of Technology, Illinois State University, Turner Hall, Normal, IL 61761, USA
*
Author to whom correspondence should be addressed.
Sustainability 2020, 12(14), 5710; https://doi.org/10.3390/su12145710
Submission received: 13 June 2020 / Revised: 12 July 2020 / Accepted: 14 July 2020 / Published: 16 July 2020
(This article belongs to the Section Sustainable Urban and Rural Development)

Abstract

:
Renting is, like owning a house, a way to realize residence rights, playing an important role in maintaining the equilibrium of the housing market. The lack of attention paid to policy design of the rental housing market causes low effectiveness in the housing resource flow and allocation at both local and national levels. Thus, we propose a novel design framework and process of public policy, in particular the development policy for the rental housing market. This innovative approach abstracts the policy design process into a solution-formation process for a high-dimensional and multi-objective optimization problem. First, based on opinion mining, using co-occurrence networks, text mining and other methods, in addition to authoritative literature and expert opinions from the Chinese Social Sciences Citation Index (CSSCI) as data sources, the objective function and the constraint function coefficients were determined to construct a multi-objective function of rental housing market policy. Second, this paper proposes a two-stage evolutionary high-dimensional multi-objective optimization algorithm based on the Pareto dominance relationship to solve high-dimensional multi-objective functions. Finally, we designed a rental housing policy tool-mix selection system-modeling process and obtained six sets of feasible solutions and objectives after 300,000 simulations. Therefore, the policy tool-mix selection system presented in this study effectively supports the policymaking process.

1. Introduction

When decision-makers scrutinize reports or learn from other people’s experiences, they often wonder if the findings or conclusions are applicable to their own situation. The term “policy design” implies a knowledge-based process in which policymakers choose means or mechanisms to achieve certain goals. Such a learning or cognitive framework (or Tool-Technology) is an indivisible component of the basic theory system of public policy, which also includes social constructionism, unbalanced policy responsiveness, and actor–network theory. The lack of effectiveness in cognitive frameworks causes societal problems (e.g., public policies fail to adjust or regulate the high housing prices in a market). Market-based rental housing has an increasingly important role in the system, especially in large cities [1]. However, it is complicated to choose appropriate tools or policies and prevent speculative investment for the purpose of supporting the development of the rental housing market. One cause of the complexity is that there are thousands of policy documents issued by governments to promote the healthy and efficient development of a rental housing market. Some of them might contradict each other. For example, the market-cultivation policy for rental housing is a critical starting point for development. It encourages multiple market-suppliers of rental housing, guides the housing consumption habit of renting before buying, and normalizes trading behaviors. Nevertheless, this type of policy still has the problems of excessive use of environmental policy tools, unbalanced structures of supply policy tools, and insufficient use of demand policies [2]. Unsuitable policies on the development of the rental housing market have caused successive problems, such as rapid rent increases and land waste [3]. The negative intervention affects and may even undermine the market development and government credibility, which could completely jeopardize a primary-stage market. One main reason for the problems is that the insufficiency of theoretical research, such as the initial conditions, fundamental characteristics, development principles, and core issues of the markets. Therefore, an intelligent learning tool for policy design is urgently required.
The design methods of public-policy design are mainly qualitative (such as interview study, observation, and content analysis). There are also combinations of qualitative methods and quantitative experiments (i.e., simulations to test method effectiveness). For example, the knowledge transfer chain for designing communication strategies among researchers and extension officers has been suggested [4]. Other examples include the improvement of ecological redline policy and institutional reforms based on the correlation between payments for ecosystem services and supply–demand coupling mechanisms [5], as well as the establishment of an agricultural policy framework by integrating the intersubjective nature of knowledge into the management of agricultural systems [6]. Nevertheless, researchers have not paid enough attention to quantitative-analysis tools. For example, 111 bibliometric policy design publications were analyzed and it was found that only 38% of the publications contained a partial quantitative analysis. The quantitative methods are always used to build a policy operation scenario and simulate and test specific policy tools in the simulation operating system, such as evaluating the effectiveness of subsidy policies for green building promotion and assessing effectiveness of propaganda policies on increasing manufacturers’ acceptance of new technologies for cleaner production [7]. In particular, the macro-level of policy analysis usually determines the overall strategy and goals with subjective comparisons, which destabilizes rigorous outcomes from meso-level determinations of specific policy tools and micro-level corrections of policy-tool decisions [8]. Throughout the relevant literature on public policies, few use quantitative methods thoroughly to design the overall policy documents. Moreover, the essence of public-policy formulation is the selection and combination of policy tools [9]. Hence, the length of policy documents and the combination of policy tools affect the execution efficiency and effects, because if a public policy contains multiple policy goals and has a tremendous length, it is difficult to find the optimal solution set of policy tools for the multiple objectives at the same time [10]. A multi-objective optimization (MOO) problem generally has more than four objectives. This research attempts to explore a more precise public-policy design by using a quantitative MOO approach.
Since the reform and opening up, China’s housing rental system has experienced rapid development and changes. The previous rental housing supply system was a “dual system”, in which the number of welfare housing rentals is much higher than that of informal rental housing such as “urban villages” (Chengzhongcun). The current housing rental supply system is a “triple system”, in which the number of market-based rental housing is much higher than that of informal rental housing and affordable rental housing. For most Chinese residents, renting is only a temporary way to realize housing rights. The focus of supply-side reform in rental housing market is how to turn renting a house into public’s accustomed lifestyle. Developing rental housing market has the following three important significances for social and economic development: first is correcting the excessive tendency of “encouraging purchase and ignoring rent” housing system, second is suppress the real estate market bubble caused by high housing price expectations and real estate speculation, and the third is breaking down the barriers of floating population to stay in large and medium cities. However, there are few academic discussions on the policy of China’s housing rental market, and there is also a lack of quantitative research on policy design.
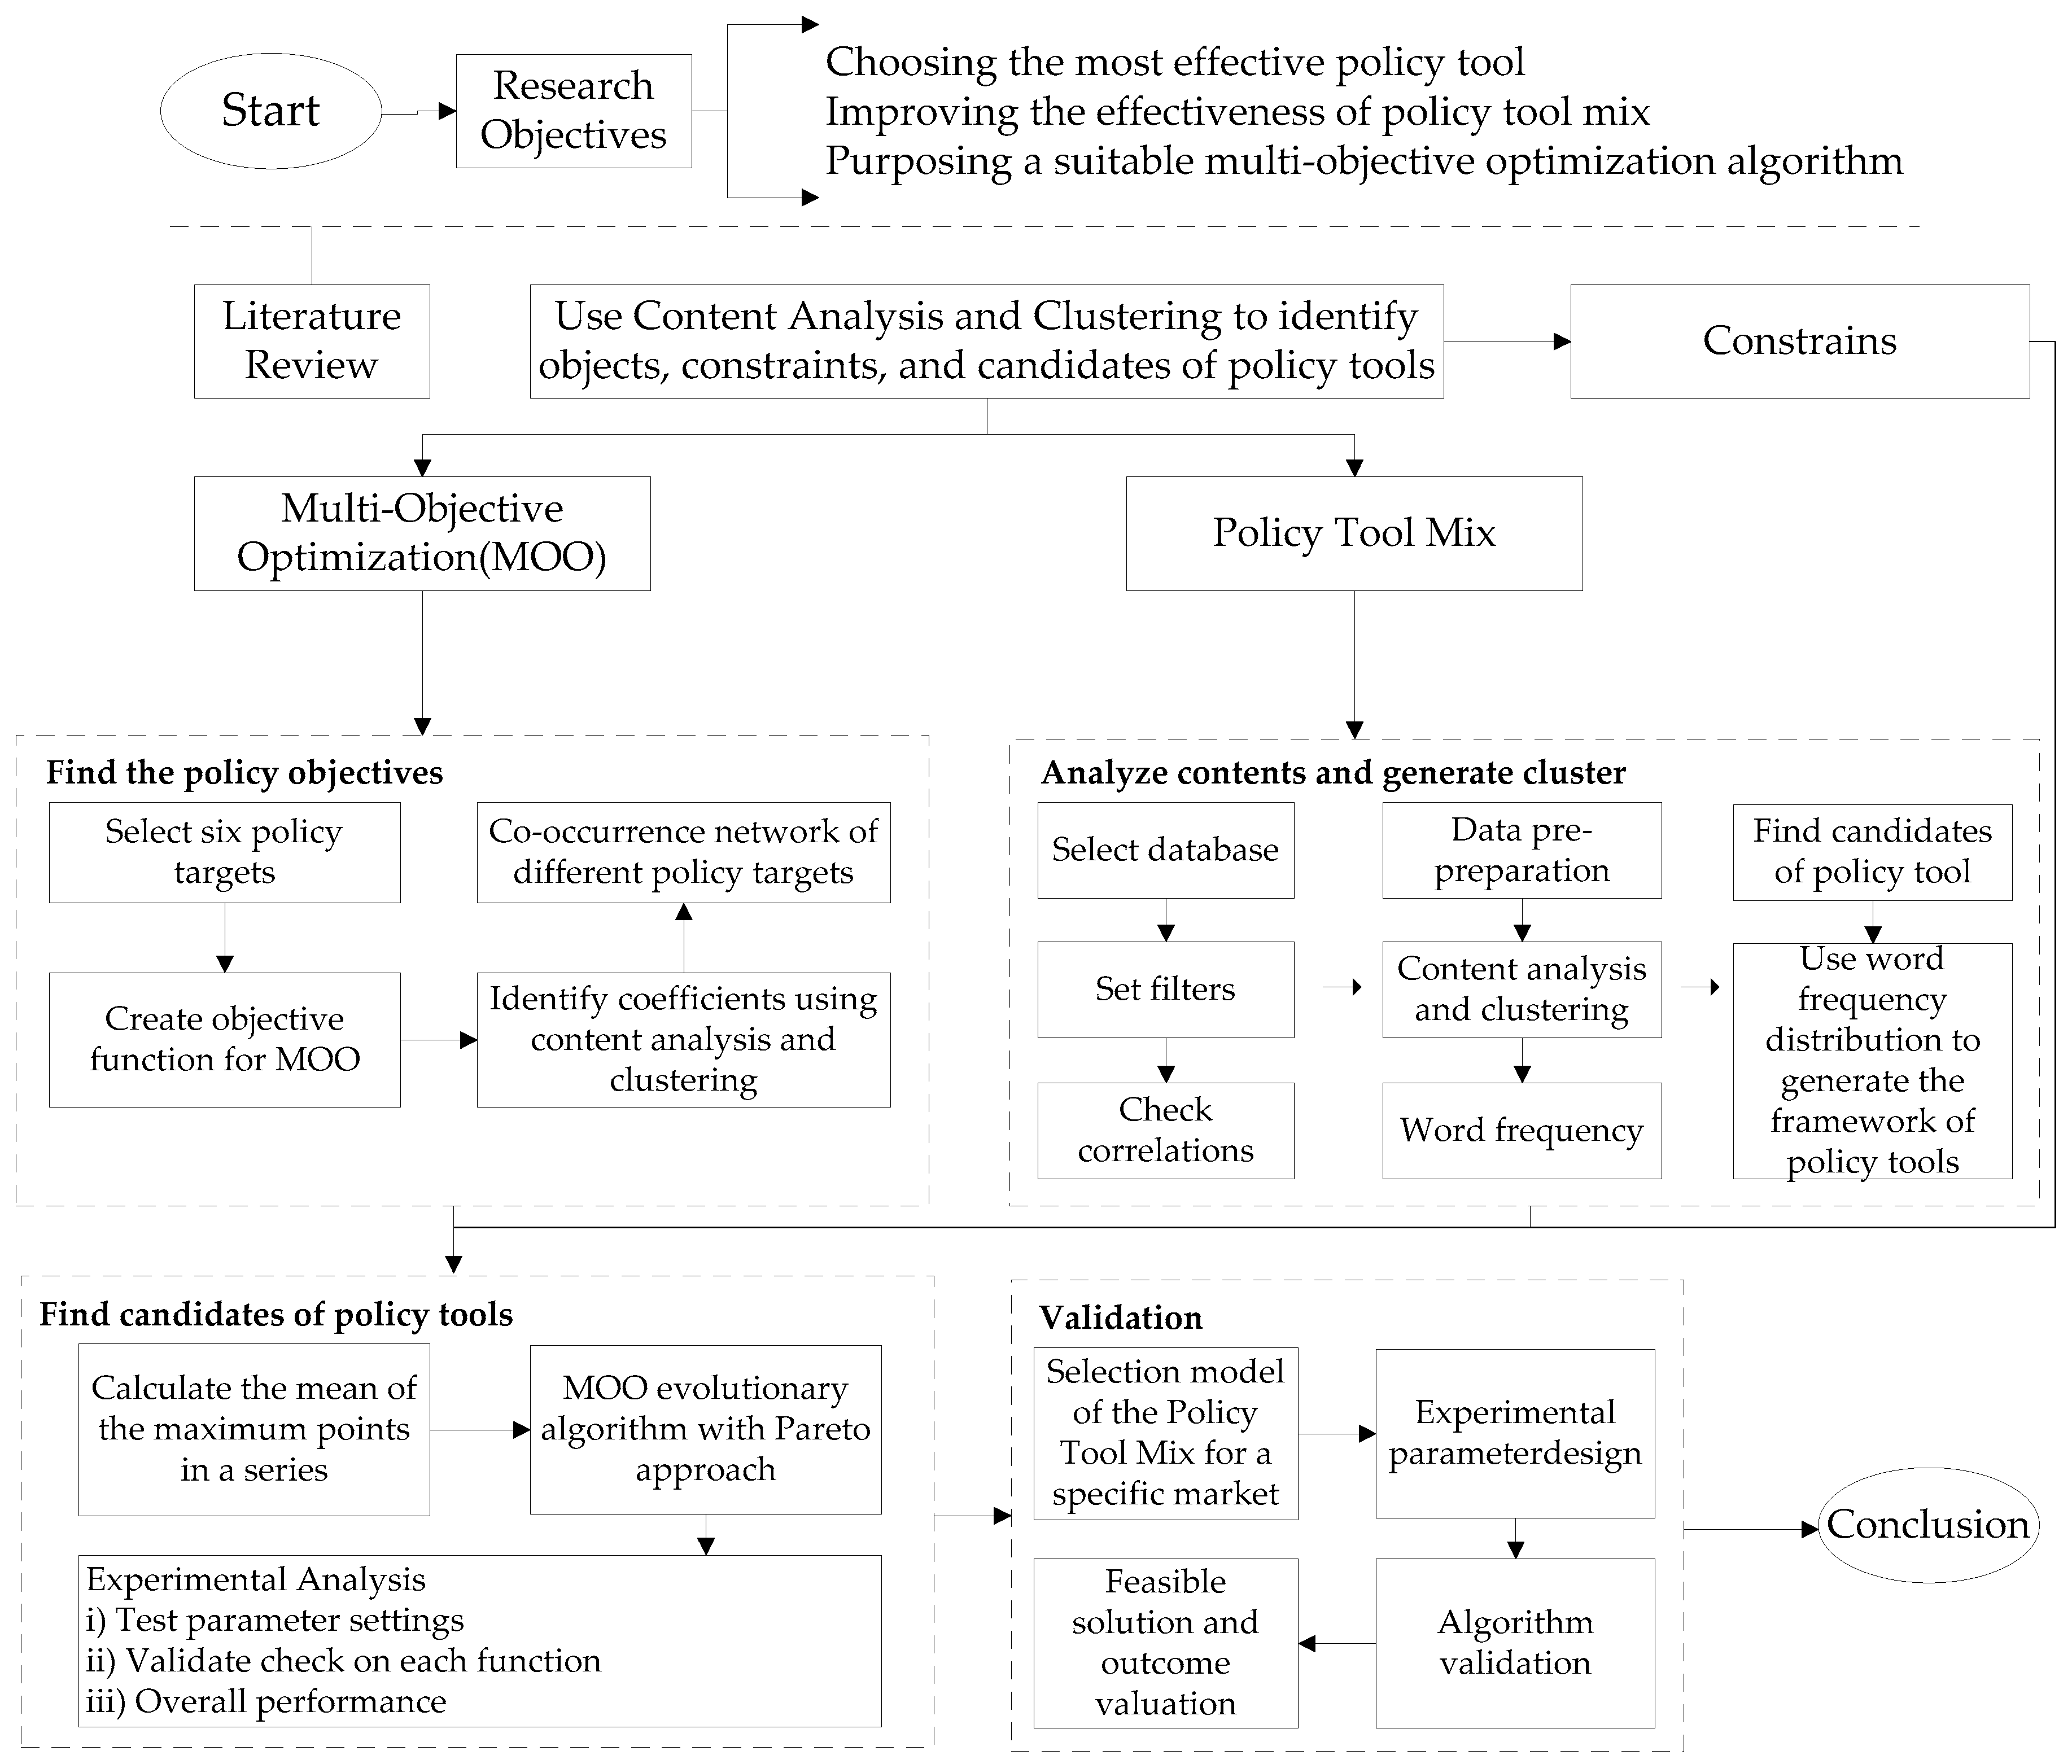
Hence, this research has the following objectives: (1) to choose the most effective policy tool for rental housing market, (2) to improve the effectiveness of policy tool mix and (3) to propose a multi-objective optimization algorithm suitable for policy tool mix optimization problem. The research is beneficial to the development of quantitative methods for public policy design and can provide a scientific decision system for policymakers to combine policy tools precisely in different policy areas. The first step of the research design is to examine the challenges of policy design when measuring the weights of multiple different sub-goals and combining them into one overall goal. Next, this research evaluates several practical algorithms of MOO and proposes an integrated content analysis and clustering method to build the quantitative policy-design framework. The framework construction starts with the recognition of objective functions and constraint functions using the integrated method on a selected database. The framework then uses the integrated method to improve the functions and obtains a Pareto solution set, which converges to the real Pareto front and is evenly distributed as much as possible. This feature indicates that the Pareto solution set is optimized. The research continues with a practical example to analyze and verify the optimization functions. Specifically, we implement a framework for a specific rental housing market and establish an optimized combination of policy tools (i.e., the model). The model has six objectives, which should be maximized at the same time. We apply the integrated method to the model and solve the high-dimensional, multi-objective optimization problem. The result is a policy toolset that can remedy the defects of the existing policies for the rental housing market. We also adjust the algorithm parameters to improve the solution of the established policy set. The outcomes (algorithm parameters, inputs, and outputs) are validated by comparing the realization degrees of policy objectives corresponding to the optimal solution set and the actual policy effects. This comparison proves the effectiveness of the proposed model.
Section 2 summarizes literature related to this research, including policy design and multi-objective optimization algorithms. Section 3 summarizes the related theories and methods of multi-objective optimization functions and algorithms. Section 4 analyzes the goals of cultivation policies on rental housing markets, refines the main policy aims to form an objective function, and establishes constraint functions (for the supply side, demand side, external environment, and combinations). Section 5 creates a two-phase MOO algorithm based on the Pareto dominance relationship. 
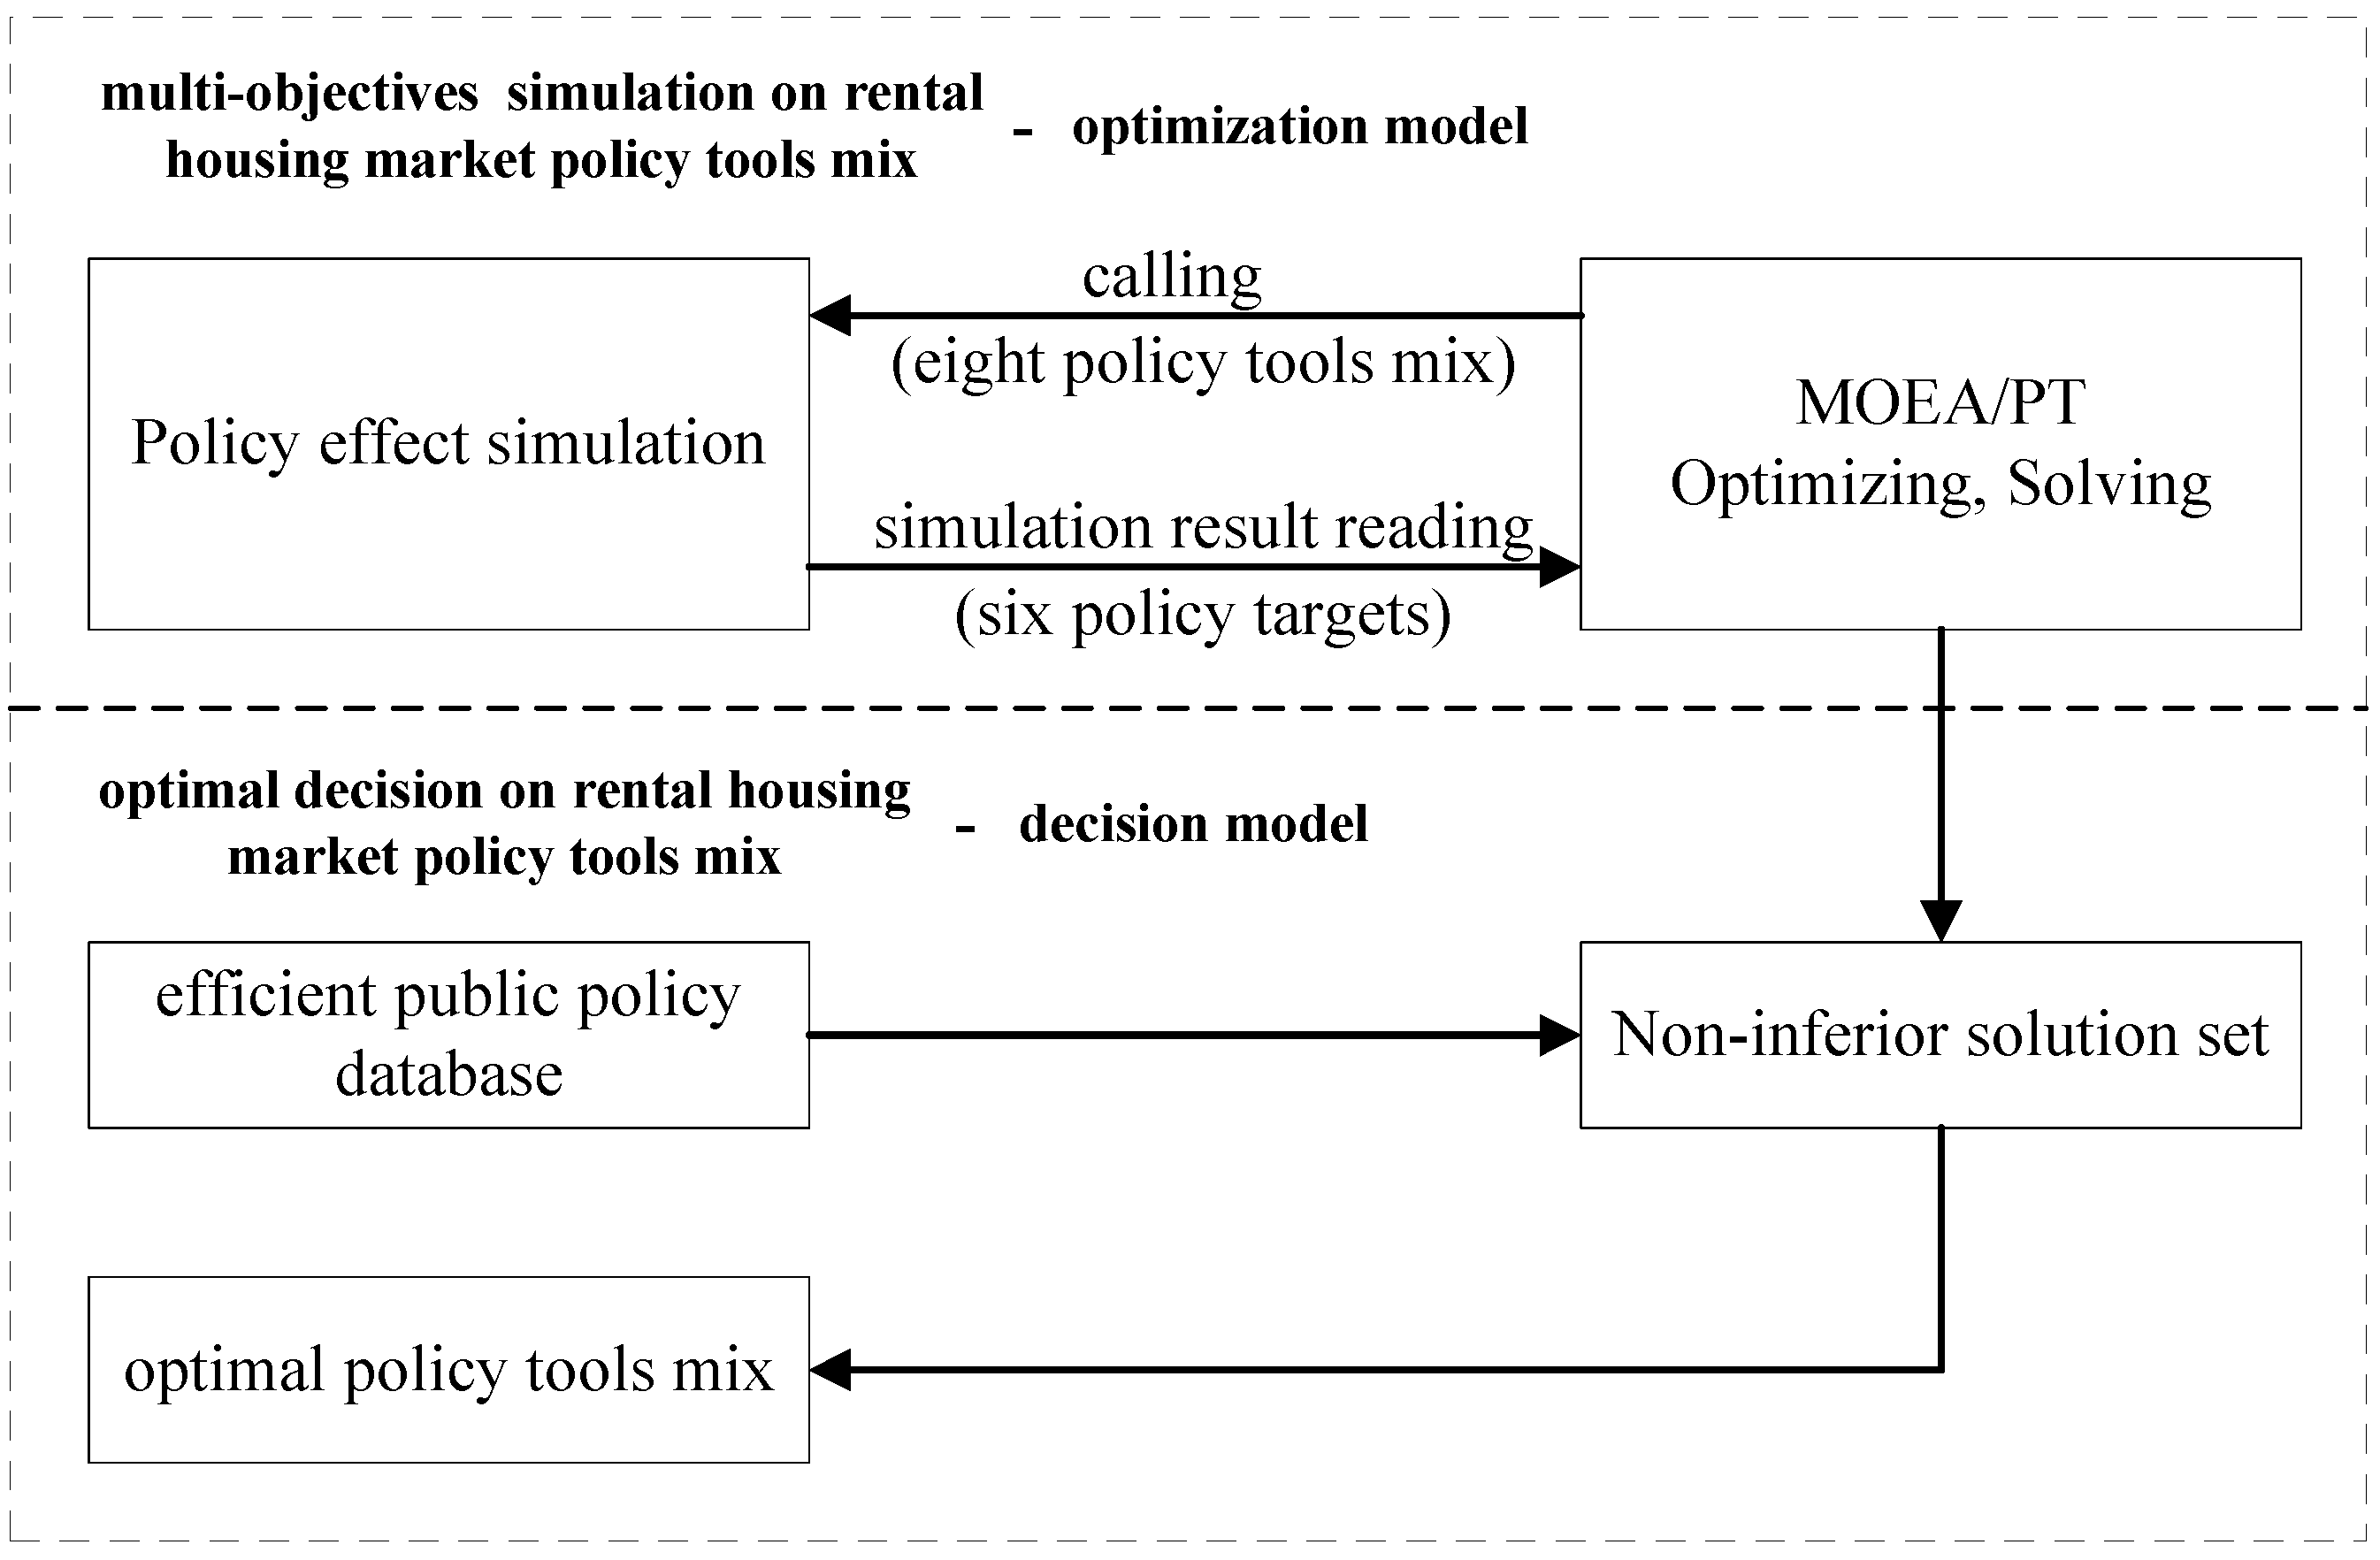
Section 6 explains a solution of policy tool mix for a rental housing market using a multi-objective-optimization evolutionary algorithm with the Pareto approach (MOEA/PT). The last section contains conclusions from the results and sets out proposed directions for future research.

2. Literature Review

“Policy design” implies a knowledge-based process in which the choice of means or mechanisms through which policy goals are given effect follows a logical process of inference from known or learned relationships between means and outcomes [11]. The basic theoretical system of public policy includes a “Tool-Technology” cognitive framework, social constructionism, unbalanced policy responsiveness, and actor–network theory. The systematic research on the rental housing market in China has only just begun, and there is less research on China’s rental housing market policy than others. Studies are mostly about urban rent characteristics, for example, influencing factors on the rent–income ratio [12], spatial distribution of urban housing rent [13], and so on. In the field of housing policy design, mostly publications are qualitative research which can be divided into three classification: (i) Housing provision system. Deng (2011) examined how the emerging housing policy framework in China works and whether it has been effective in achieving its policy objectives and improved the structure of the urban housing system [14]. Ye (2008) evaluated policy targets, preliminary policy effects, and possible policy deficiencies of the Chinese urban housing market and policies from 1998 to 2007, and put forward an optimization plan of the proportion of government supply and market supply [15]. (ii) Urban affordable housing policy. Zhang (2016) analyzes the intermediary role of the provincial government of Shandong in implementing centrally initiated government policies in urban China [16]. Wei (2017) examines the transferability of Singapore’s public housing policy to Chinese cities in terms of the policy environment, including government structure, funding mechanism, and land acquisition [17]. Dinzey-Flores (2007) details the design process of the public housing policy in Puerto Rico and explores the consequences of such interventions [18]. (iii) Real estate regulation policy. Duan (2019) employs a spatial dynamic panel method to quantify effects of macroeconomic policy interventions on spatially interdependent real estate markets and proposes an optimization of real-estate intervention policy [19]. Zou (2019) investigates the net impact of short-term rentals (STRs) on single-family property prices through a series of hedonic analyses and proposes a real-estate policy to weaken the inequitable effect of STRs on low-income homebuyers [20].
A multi-objective optimization algorithm is a hot research issue in the field of system management, which generally refers to an optimization problem with a target number greater than four. Its research aim is to solve a set of Pareto solution sets that converge to the real Pareto front and are evenly distributed as much as possible [21]. Scholars have developed the multi-objective optimization algorithm to solve practical engineering problems such as allocation of wireless bus charging stations [22] and allocation of hybrid renewable energy systems [23]. Due to the complexity of multi-objective optimization problems in decision spaces, scholars continue to improve the algorithm to enhance its effectiveness in various functional modules. For example, an evolutionary algorithm based on the Minkowski distance [24], reference points and an intuitionistic fuzzy dominance-based particle swarm algorithm [25], and a particle swarm optimization (PSO) algorithm based on the unary epsilon indicator and direction vectors (IDMOPSO) [26]. Quantitative policy tools are precise, efficient, and reliable. Nevertheless, the literature review still shows that there is a lack of quantitative public policy design methods to calculate the optimal solution sets of policy tools. The design of a rental housing policy needs more efficient policy documents to achieve optimized development in the market.

3. Theoretical Background

3.1. Multi-Objective Optimization

Multi-objective optimization is used to discover the optimal solution for multiple objectives. Furthermore, a high-dimensional, multi-objective problem has four or more objectives in simultaneous optimization. Sometimes, the multiple constraints of a single-objective optimization problem can be transformed into objectives. It then becomes a high-dimensional, multi-objective, and unconstrained optimization problem [27]. Without loss of generality, the following minimization problem (Equation (1)) is a multi-objective optimization with n decision variables and m objective functions.
minimize F ( x ) = ( f 1 ( x ) , . , f m ( x ) ) T subject to x Ω ,
where, x Ω is the decision vector, Ω is the decision space, { F ( x ) | x Ω } is the feasible objective set, R m is the objectives’ space, F : Ω R m consists of m actual value objective function, u , v R m for the random i { 1 , , m } , and u i v i . There is at least one objective satisfying u j < v j , j { 1 , , m } , which means u dominates v. No other solutions can dominate if a solution in a set S is a non-dominated solution. In addition, if x * Ω , the F ( x * ) is non-dominated in the relevant objective sets. If a solution set is similar to x * , it is called the Pareto optimization solution (POS). The corresponding F ( x * ) is called the Pareto front (PF) [28]. Table 1 lists three definitions used in a POS.
Housing-policy research frequently considers multiple objectives, which include stabilizing commercial housing price [29], achieving ethnic integration, poverty decentralization, and homeownership [30]. A rental housing system has a supervisory side (i.e., governments), a supply side (i.e., different entities in an industrial chain), and a demand side. The demand side includes individual tenants and scale tenants (e.g., the employee apartments rented by entrepreneurs). The production process has three important entities: rental housing companies, real estate agencies, and individual renters. Hence, these sides and entities bring challenges fraught with the conventional MOO algorithm when dealing with high-dimensional multi-objective optimization problems (MOPs). The difficulties could be summarized and manifested as convergence and diversity. The convergence is reflected by the loss of selection pressure, which refers to the pressure converged by the population on a real PF. In a high-dimensional target space, most solutions are non-dominated [31]. Therefore, the strategy of employing the dominance relations between solutions to select solutions might be trapped in a loss of selection pressure. Figure 1 gives an example that shows that most solutions tend to be non-dominated when the number of objectives increases.
Another difficulty in solving a MOP is to maintain solution diversity [32]. Generally, the PFs of most continuous MOPs are sectionally continuous, leading to impossible optimization solutions. Practically, the simulation of PF during an algorithm design can generate a representative set of solutions, which is evenly distributed. When there are two or three objectives, the PF is a one-dimensional curve or a two-dimensional curved surface. Its diversity can be maintained intuitively. A diversity-maintaining strategy is generally used in a low-dimensional space when implementing a high-dimensional MOO algorithm. As the dimensions of an objective space expand, the finite solutions become sparsely distributed. It causes the diversity-maintaining strategy to fail. For example, Deb et al. (2002) proposed a crowded distance sequence in the classical multi-objective optimization algorithm, called the nondominated sorting genetic algorithm II (NSGA-II) [33]. However, it was unsatisfactory in solving epistatic or exponential-growth problems. In addition, policy design is a continuous operation process to deal with practical problems. The continuous changes of the objective function and the constraint function coefficients make the MOO problem of policy design a real-time optimization problem and require superior performance. Thus, possible improvements to the NSGA-II should consider how to avoid premature convergence, improve the search capability of the algorithm, and speed up the search progress.
General indicators of public-policy evaluation include effect, efficiency, adequacy, fairness, responsiveness, and appropriateness [34]. A rental housing policy has three attributes: (1) the macro-policy attribute, which is to realize the goal of “encouraging both purchases and rentals” in a housing system; (2) the industrial-policy attribute, which involves the establishment and improvement of the rental housing industry chain; and (3) the micro-policy attribute, which is to guide the behavior from urgent or prompt purchase to the gradient consumption concept of rent. Additionally, there are five general evaluation standards (macro, industrial, micro, reform, and social) established for a rental housing policy [35]. Considering that the rental housing market is at an early stage, the policy objectives (or different dimensions) should focus on building a propulsion mechanism for the policy targets. Hence, the general policy targets in the rental housing policy area are determined to be strategic (at macro level), forward-looking (at industrial level), and participatory (at micro level). These targets are part of the objective functions of the proposed MOO model in this research.

3.2. Policy Tool Mix

The current policy tools have the capabilities of feature definition, classification, selection, evaluation, and innovation. For example, the social construction theory is a policy-design tool to implement rewards or penalties on a target group to solve a public problem [36]. This research focuses on the selection tools, which are the basis for an efficient combination of policies. There are four selection patterns (routinization, hybridization, stratification, and contamination) according to the legitimacy–instrumental analysis framework [37]. The selection tools can be grouped by governance characteristics, governed object characteristics, and policy-implementation environment. One drawback of this classification is the superabundant divisions. For example, 64 kinds of general policy tools in economic policy for different policy fields and organization structures were proposed [38]. Five kinds of general policy tools based on behavior guidance for governed objects (authoritative, inducement, ability training, persuasiveness, and learning) were suggested [39]. Generally, the classification of policy tools was improved and divided into legislative-regulatory, economic-financial, agreement-oriented versus stimulus-oriented incentives, and information-oriented versus communication-oriented groups [40]. Although the growth of policy-design methods provides ample options, it still causes confusion and even delays in policy selection and adoption due to the inefficiency of policy-tool selection.
The reality of the multiplicity of policy objectives and the compactness of policy tools make it necessary to carry out research on the coordination and connection between different policy tools. From the traditional perspective of structural function, the shift from single policy-tool research to policy-tool mix research is naturally driven by administrative practice. However, the policy-tool mix research based on typology seems difficult to be tolerated by the logic of government interventionism. In the intervention tradition, each policy tool is a special strategy based on specific requirements, and neither a method of checking one by one nor a combination plan is required. However, on the basis of clearly dividing policy-tool types, it is always an ideal way to promote the solution of policy problems by integrating these tools, and it is also an important contribution to the tradition of structural functionalism. According to the different scopes and fields of policy implementation, researchers have summarized different tool combinations in government management practices. Some scholars have mixed policy tools in different dimensions of public management, and try to provide a toolbox that can be casually matched by decision-makers according to objectives and environmental requirements. However, more researchers tend to combine the pros and cons of contradiction to achieve unification of methodology, and it divides policy tools into four patterns, including market dominance and individual participation pattern, macro command and micro-operation pattern, administrative intervention and rational choice pattern, and admission control and financial support pattern.
It is necessary to identify the main problems and contradictions in the current rental housing markets when formulating development targets. For example, the shortcomings of housing supply preference selling and neglecting the rental market still exist [41]. In addition, the diversity of rental housing providers has not yet formed. Another barrier is the housing consumption concept of residents, who much prefer purchase to rental. Thus, rental demand has not been effectively released. The third constraint of the rental housing market is its chaotic situation. The disparity between landlords and tenants is remarkable. Real-estate agencies may frequently conduct illegal operations. From the perspective of the participants in a rental housing system, the policies should raise the rental housing ratio, increase the market share of specialized rental enterprises, and improve the operating efficiency of the rental housing market.

4. Mix of Policy Tools for Rental Housing Market

4.1. Text Data Collection and China’s Rental Housing Market

For a long time, in the context of encouraging homeownership, central government and local government ignored the system establishment and policy issue of the rental housing market. However, in recent years, the inflow population in large and medium cities and commercial housing price have increased rapidly; more and more people find it difficult to own a home instead of renting one. There are three main problems in China’s rental housing market now. First, in the first-tier cities of Beijing, Shanghai, Shenzhen, and Guangzhou, as well as some second-tier cities such as Chengdu and Hangzhou, the rental housing market is in short supply. Second, the supply of rental housing for single occupants and small families is inadequate, which causes low-living shared-room status. Third, the professional and centralized housing rental agencies are lacking, and it is difficult for tenants to find good residential services. Thus, we chose the policy design of China’s rental housing market as a case study.
In this paper, we completed a two-stage data collection. (i) In the first stage of data collection, we established an efficient policy-tool database from different policy areas (Database I, DBI), and our purpose was to choose the most appropriate policy tool in DB I. The data collection details are as follows: From 1 January 2017 to 31 July 2019, there were 123 published journal articles (core collection), which were obtained from the Chinese Social Sciences Citation Index (CSSCI) when using “policy tool” to search. After the correlation check on these articles, the core collection was reduced to 60 highly relevant papers on the practice of policy-tool design. Based on the text contents of Chinese word segmentation, 474 policy tools were summarized from the 60 articles. However, there was a lot of repetition due to inconsistency in the technical expressions of the policy tools. A corpus of the policy tools was established using the data-mining method of comparison, cleaning, and deduplication. (ii) In the second stage of data collection, we established a high-level public-policy database (Database II, DBII) to set the parameters in the multi-objective functions. The steps to establish a high-level public policy database were as follows: First, using “policy evaluation” and “policy effect” as keyword retrieval, 1037 articles were searched in the CSSCI database. Second, the relevance of publications was judged, that is, the relevant publications referring to the research object being a complete issued policy, rather than partial documents or abstract strategy. Third, the first screening was carried out based on the research results clearly indicating that the policy had significant effectiveness as the criterion; the second screening was artificial screening by authors, and a high-level policy database containing 30 policy documents was established.
Figure 2 shows the three phases of the research methodology: (1) MOO, (2) improvement of tool mix, and (3) implementation.

4.2. Selection of Policy Tools and Targets

Based on the content-analysis method, we obtained 30 types of policy tool from DBI. To further explore the characteristics of these policy tools and explain how to use them in different policy areas, this research implements spectral clustering (SC) (Algorithm 1) to divide the weighted undirected graph that is composed of “policy area-policy tool” nodes. Figure 3 shows the scope (360 nodes) defined by the word frequencies the policy tools using the SC algorithm. The frequency of node words in the lower-left corner of the graph is higher, and the frequency in the upper-right corner is lower. From left to right and from bottom to top, there is a discrete distribution that is monotone and decreasing in the graph.
Algorithm 1: Spectral Clustering Pseudocode
Input: Sample point X = { x 1 , x 2 , , x n } ; Cluster Number k ; n = 360 ; k = 3
Output: Cluster A 1 , A 2 , A 3
    step1: similarity matrix W   =   [ s i j ] n × n ; s i j = s ( x i , x j ) = i = 1 , j = 1 n exp x i x j 2 δ 2
       degree diagonal matrix D   =   [ d i ] n × n ; d i = j = 1 n w i j
       Laplacian matrix L = D W
       calculate eigenvalue of matrix L ; eigenvector u 1 , u 2 , , u k
        U = { u 1 , u 2 , , u k } , U R n k
       Let y i R k be the vector of the i-th row of matrix U
    step2: clustering new sample points Y = { y 1 , y 2 , , y n } into cluster C 1 , C 2 , , C k
    step2-1: def calcluate_distance(core: tuple, dot: tuple)
    return dist
    step2-2: def calculate_cluster(dot: tuple, cores: list)
    distance_list = []
    for core in cores
          min_dist = min(distance_list)
          put_to_index = distance_list.index(min_dist)
          return put_to_index
    step2-3: def put_dot_into_clusters(row_data: list, k: int, cores: list)
          clusters = []
          for each in range(k)
          for every_data in row_data
          return clusters
    step2-4: def re_calculate_core(cluster: set)
          all_x = []
          all_y = []
          for each_dot in cluster
          new_core = (round(avg_x, 2), round(avg_y, 2))
          return new_core
    step2-5: for num in range(10)
          data_list.append(adot)s
    step3: output cluster A 1 , A 2 , A k , A i = { j | y j C i }
The Spectral Clustering (SC) algorithm can divide the weighted undirected graph nodes. The results should be two or more optimal sub-graphs so that the internals of sub-graphs are as similar as possible, and the distance between sub-graphs is as far as possible to achieve the purpose of clustering. The SC Algorithm has two main steps as follows: The first step is to map the data in the high-dimensional space to the low-dimensional space. The second step is to use other clustering algorithms (such as Min Cut, Ratio Cut and so on) to obtain n clusters in the low-dimensional space. We used “usage frequency of a policy tool in a policy field” as a node, and arranged the samples in DBI according to usage frequency to a [ 12 × 30 ] matrix. Observing the basic characteristics of the matrix, it can be seen that the node size varies greatly. Thus, we used Ratio Cut to cluster the matrix by considering minimizing the edge weights between different clusters and maximizing the node number in each cluster. Based on the node strengths, the SC algorithm divides the 360 nodes into 3 clusters (Figure 3). Cluster I has 44 nodes whose overall word frequency accounts for nearly 50% of the total frequency. The technology policy (TECH), industrial policy (IND), social security policy (SOC SECUR), and education policy (EDU) clusters have obvious preferences for 11 types of policy tools, including tax and interest subsidy, government service, and financial instruments. Among them, the technology-policy cluster has the strongest preferences for four policy tools, including encouragement and support, government’s purchases of services, laws and management regulations, and financing subsidy. These four tools account for 43% of the total frequency of technology policy tools. Cluster II contains 76 nodes whose word frequency accounts for nearly 26% of the total frequency. The “environmental policy-financing subsidy” and “education policy-market cultivation” are the two nodes with the highest word frequency. Cluster III contains 228 nodes and has almost the same word frequency ratio as Cluster II. The highest frequency is 10, which is the “education policy-authority adjustment” node. There are 121 nodes with a frequency of 0, accounting for 53% of the total number of nodes in Cluster III.
The combination of the word frequencies and co-occurrence degrees of the above 30 policy tools reveals that tax and interest subsidy, financing subsidy, law and management regulation, encouragement-and-support, financial instrument, and government’s purchase of service account for a relatively large number of policy tools. Meanwhile, the policies of “financing subsidy, laws, and management regulations”, “target planning on encouragement and support”, and “target planning on tax and interest subsidy” have obvious co-occurrences. In the areas of social security and urban development that are closely related to the development policy of the rental housing market, financing subsidy, encouragement-and-support, regulation, education and training, government’s purchases of services and tax and interest subsidy are used more frequently than the rest. Based on the comprehensive consideration of the word frequency distributions, the policy tools co-occurrence network, and the efficient policy tools in related fields, there are eight policy tools determined (Table 2). The type distribution and connotation of various policy tools were shown in Table 2. It is worth noting that each policy tool contains a variety of specific measures based on different policy targets and the environment in which policy documents are drafted. Thus, it will be more diverse and practical, and we only discussed the general situation in this paper.
In this section, we need to further explain the eight selected policy tools. Tax and interest subsidy has direct impact on social production, distribution, exchange and consumption, and it can achieve social or economic targets by intervening market operation mechanism. The subcategory of financing subsidy contains income distribution, financial investment, direct subsidy, national debt and so on. Laws and management regulation contains laws, administrative regulations, judicial interpretation, local regulations, departmental rules and other regulatory documents. Encouragement and support refer to policy measures that guide the related subjects to perform certain behaviors expected by the policy makers. The purpose of education and training is to achieve the corresponding policy targets by enhancing the capabilities of staff or other related personnel. The operation process of financial instrument is that the central bank regulates currency supply in the national economy through the financial system and financial market to affect economic activities such as investment, eventually achieve certain policy targets. Target planning refers to a series of quantitative or qualitative targets set by policy makers, which need to be achieved after a period of policy implementation. Government service is provided by governments at all levels, and it can bring business convenience to both the supply side and the demand side of the market.

4.3. Objective Function

The framework (Table 2) reveals eight policy tools for rental housing markets. The literature review indicates that a MOO model usually evaluates six targets in policy research. Hence, the proposed MOO model has six objective functions for the eight policy tools. Furthermore, the MOO model uses web-crawling and text-mining technologies to mine the co-occurrence intensities to recognize the six objectives from the relevant policy documents. It uses the same approach to define the corresponding coefficients. Equation (2) shows the construction of the objective functions, which include the following steps. (1) Using “policy design”, “policy formulation”, “policy evaluation”, and “policy mix” as keywords to search for highly relevant and high-level publications in the CSSCI database. Outcomes from the first step include 153 articles related to Target 1, 105 articles related to Target 2, and 44 articles related to Target 3. (2) Learning from the ideas and methods using opinion mining. The associations between the eight policy tools and Targets 1, 2, and 3 are mined to determine the coefficients of objective functions. In Equation (2), Targets 1, 2, and 3 are general in the policy design process. Targets 4, 5, and 6 calculate precise values to describe the development policies of the rental housing market. (3) Establishing the databases of publications, authoritative comments, and media interviews by experts. The keywords of the databases are “rental housing market”, “rental housing policy”, “urban housing provision system”, “multi-suppliers”, “housing system encouraging both housing purchases and rentals”, and “housing is for living in, not speculation”. (4) The theme words become the keywords to search for highly relevant data on the China National Knowledge Infrastructure (CNKI) database, and Baidu, Weibo, and WeChat public platforms. The outcomes include 77 academic articles and 38 authoritative comments. (5) We feed these outcomes into the content and use co-word analysis methods to examine the opinions mined in the publications and comments of the database and platforms. (6) We then use Bibexcel and UCINET software to calculate the co-occurrence network parameters of the eight policy tools under six policy targets.
Figure 4 explains the co-occurrence network. The six objectives are (1) government service, (2) financing subsidy, (3) education and training, (4) financing subsidy, (5) financial instrument, and (6) laws and management regulations. The combinations with the highest link strength are tax and interest subsidy—financing subsidy, financing subsidy—financial instrument, government service—education and training, tax and interest subsidy (financing subsidy and financial instrument), and government services (laws and management regulations). It is consistent with the coefficient weights of the objective function (Equation (2)). The consistency further verifies the rationality of the established objective function [42]. The node sizes of Figure 4 refer to the adoption frequencies of policy instruments. The edge widths correspond to the co-occurrence frequencies of the pairs of the policy instruments. FS refers to financing subsidy; GS refers to government service; TA refers to tax and interest subsidy; TP refers to target planning; MM refers to financial instruments; ES refers to encouragement and support; LR refers to laws, standards, and management regulations; ET refers to education and training.
{ max f 1 ( x ) = 0.1401 x 1 + 0.1362 x 2 + 0.1362 x 3 + 0.0885 x 4 + 0.1306 x 5 + 0.1178 x 6 + 0.1315 x 7 + 0.1192 x 8 max f 2 ( x ) = 0.1271 x 1 + 0.1186 x 2 + 0.1315 x 3 + 0.1032 x 4 + 0.1260 x 5 + 0.1143 x 6 + 0.1239 x 7 + 0.1555 x 8 max f 3 ( x ) = 0.1094 x 1 + 0.1552 x 2 + 0.1064 x 3 + 0.1543 x 4 + 0.1337 x 5 + 0.0647 x 6 + 0.1058 x 7 + 0.1705 x 8 max f 4 ( x ) = 0.1714 x 1 + 0.1604 x 2 + 0.1528 x 3 + 0.1767 x 4 + 0.1693 x 6 + 0.0531 x 7 + 0.1163 x 8 max f 5 ( x ) = 0.1975 x 1 + 0.1061 x 2 + 0.1434 x 3 + 0.1917 x 4 + 0.0210 x 5 + 0.1864 x 6 + 0.0480 x 7 + 0.1059 x 8 max f 6 ( x ) = 0.1367 x 1 + 0.0272 x 2 + 0.1884 x 3 + 0.0272 x 4 + 0.1103 x 5 + 0.0622 x 6 + 0.0622 x 7 + 0.3858 x 8

4.4. Optimization Function

After obtaining the entropy weights and the frequency ratios of policy tools, Equation (3) was used to determine the comprehensive weights and improve the accuracy of the coefficients. This optimization function of the MOO model has multiple objective functions, f k ( x ) , { k = 1 , 2 , 3 , 4 , 5 , 6 } , including the maximization of (1) policy strategic, (2) policy forward-looking, (3) policy participation, (4) rental housing ratio, (5) the market share of specialized rental enterprises, and (6) the operating-efficiency of the rental housing market. g i ( x ) and h j ( x ) are constraint functions. x = { x 1 , x 2 , , x 8 } T are 8-dimensional design variables of the policy tools in Table 2.
{ max f 1 ( x ) = i = 1 8 a i x i , max f 2 ( x ) = i = 1 8 b i x i max f 3 ( x ) = i = 1 8 c i x i , max f 4 ( x ) = i = 1 8 d i x i max f 5 ( x ) = i = 1 8 e i x i , max f 6 ( x ) = i = 1 8 f i x i s . t . g i ( x ) 0 , i = 1 , 2 , , p h j ( x ) 0 , j = 1 , 2 , , p

4.5. Constraint Function

Based on DBII, we used NVivo software to encode the policy documents, a distribution of eight policy tools in each policy documents was counted. Because regional medium- and long-term planning documents involve more participants and behaviors than other types of policies, and various policy tools are used frequently, the total length of each policy document was different. For example, the full text of “13th Five-Year Plan for Environment Protection of Shaanxi Province” was up to 34,650 words, whereas the full text of “Notice on the Pilot Policy for the Individual Income Tax on Equity Incentives in the Construction of the National Independent Innovation Demonstration Zone of Zhongguancun Science Park” was only 832 words. Therefore, “the ratio of each policy tool’s occurrence frequency in the total amount of eight policy tools in the same document” was used as the statistical sample. Dispersion degree of the samples is acceptable. To avoid the unreasonable constraint interval caused by outliers, such as maximum and minimum values. The first quartile of policy-tool ratio was taken as lower bound, and the second quartile was taken as upper bound.
Figure 5 shows the distribution of policy tools in three clusters. The maximum node value is “FS-P11”, which is 100%. There are 22 minimum value nodes, such as, “TP-P3” “GS-P9” and so on, which are all 0%. In order to further analyze the difference in node values, we use quartile statistics to simply cluster these nodes. According to the quartile statistical method, we should have obtained four clusters as follows: (i) Cluster A (nodes value are between 0% and 25%) contains 209 nodes, accounting for 87.1% of number of all nodes. (ii) Cluster B (nodes value are between 26% and 50%) contains 24 nodes, accounting for 10% of number of all nodes. (iii) Cluster C (nodes value are between 51% and 75%) contains 24 nodes, accounting for 10% of number of all nodes. iv) Cluster D (nodes value are between 76% and 100%) contains four nodes, accounting for 1.7% of number of all nodes. Since cluster B, cluster C and cluster D contain very few nodes, and the clustering analysis has low differentiation. Nodes with values between 26% and 100% are clustered again according to the difference scale of nodes value. We arranged the nodes with values between 26% and 100% in order of size, and the difference between the two nodes “ES-P2” and “GS-P8” is 13.9%, which is the largest difference. Finally, nodes in DBII is divided into cluster I (nodes value are between 0% and 25%), cluster II (nodes value are between 26% and 65%) and cluster III (nodes value are between 66% and 100%).
The intervals of Clusters 1, 2, and 3 are 0 to 25%, 25% to 65%, and 65% to 100%, respectively. Most nodes (83.75%) are in Cluster 1. Cluster 2 is mainly composed of the encouraging and supporting nodes, indicating their effectiveness. Specifically, the standard deviation of financing subsidy (0.183) is the largest among the eight policy tools using variance analysis. On the contrary, the standard deviation of target planning (0.055) is the smallest. The cluster ranges are the constraint functions (Equation (4)).
{ 0.0321 x 1 0.1466 , 0.0674 x 2 0.1756 0 x 3 0.1150 , 0.2542 x 4 0.4679 0 x 5 0.1356 , 0 x 6 0.1326 0 x 7 0.0769 , 0.0042 x 8 0.1538 i = 1 8 x i = 1

5. Improvement of Tool Mix

5.1. Algorithm Detail

The improvement of the tool mix includes three stages following the evolutionary algorithm with the Pareto approach (Equation (5)). The nadir-point search (NPS) algorithms detect the nadir points of optimization problems by boundary solutions [43]. Moreover, the self-adapting NPS technique searches for the nadir point of optimization with a certain maximum rate-of-change of the boundary solutions [44]. This research determines that Equation (5) has the most efficient performance at once per 200-times iteration and the phase is ended adaptively if the maximum rate of change is less than the scheduled threshold (0.001) after iterative calculations. Figure 6 is the MOEA/PT algorithm. Supplementary S.1 explains the details of the algorithm.
Δ g = max i { 1 , , m } | B i g B i g 200 B i g 200 |

5.2. Imprement Analysis

The improvement analysis is designed to (1) test the parameter settings, (2) validity check of the functions, and (3) check the overall performance verification of the MOEA/PT algorithm. Supplementary S2–S4 contains a detailed explanation of the calculation and analysis of the evolutionary computation. The improvement deploys the DTLZ7 problem set in the evolutionary computation field, which is the mainstream high-dimensional multi-objective test set. The objective numbers are set to 4, 5, 6, and 8. The number of the decision variables is n = m + r 1 ; r is set to 5, 10 and 20 in DTLZ1, DTLZ2-6, and DTLZ7, respectively. The Inverted Generational Distance (IGD) algorithm is one of the popular evolutionary computation methods and calculates the performance measurement index [45] in this research. The IGD computes the average of the minimum distances between the points on the real PFs and the points on the approximate PFs. Equation (6) compares P* (the real PF) and P (the approximate PF):
I G D ( P , P * ) = 1 | P * | v P * d i s t ( v , P )
where I G D ( P , P * ) = 1 | P * | v P * d i s t ( v , P ) is the Euclidean distance from v to the closet solution in P. The IGD decreases when the difference between the approximate PF and the real PF decreases and the difference distribution spreads evenly.
After determining the parameter settings, the next step is to verify the NPS technique of the MOEA/PT algorithm and its diversity-maintenance mechanism based on the dynamic minimum distance. Table 3 shows the comparison results, which indicate that MOEA/PT is capable of obtaining the optimal solution on every test problem. It is a diverse, effective, and dynamic algorithm for the overall population. The third step is to verify the overall performance of the MOEA/PT. The improvement data shows that the MOEA/PT can produce the optimal IGD values with more robustness than other selected MOO algorithms.

6. Implementation, Verification, and Discussion

6.1. Rental Housing Policy Tool Mix Selection System Modeling Process

Based on the improved model of policy-tool mix generated from the previous section, the implementation of this MOO model demonstrates how to select the effective policies for Pareto optimization using a MATLAB platform. First, we quantified the effectiveness of various policy tools based on many related studies. Secondly, we entered the obtained six policy targets and eight policy tools into the MATLAB platform to build the MOEA/PT optimization. Thirdly, we solved the model and created the non-inferior solution set. Finally, we used the efficient public-policy database identified in Section 3 to compare the solutions in the non-inferior set and selected the optimal solutions. Figure 7 shows the specific implementation process.

6.2. Experimental Parameters Design

The empirical implementation includes eight objectives, six of which are policy targets obtained in Section 2. The other two objects were converted from the constraint functions. The MOEA/PT algorithm has a constraint that limits the value range of decision variables to be between 0 and 1. Thus, we used mapping relationship transforming decision variables x1, …, x8 to z1(x1), …, z8(x8) (shown in Equation (7)). Then, we obtained the new objective functions and constraint functions (Equation (8)).
z 1 = 8.7336 x 1 0.2803 z 2 = 9.2421 x 2 0.6229 z 3 = 8.6957 x 3 z 4 = 4.6795 x 4 1.1895 z 5 = 7.3746 x 5 z 6 = 7.5415 x 6 z 7 = 13.0039 x 7 z 8 = 6.6845 x 8 0.0281
{ max g 1 ( z ) = 0.0160 z 1 + 0.0147 z 2 + 0.0157 z 3 + 0.0189 z 4 + 0.0177 z 5 + 0.0156 z 6 + 0.0101 z 7 + 0.0178 z 8 + 0.0064 max g 2 ( z ) = 0.0146 z 1 + 0.0128 z 2 + 0.0151 z 3 + 0.0221 z 4 + 0.0171 z 5 + 0.0152 z 6 + 0.0095 z 7 + 0.0233 z 8 + 0.0070 max g 3 ( z ) = 0.0125 z 1 + 0.0168 z 2 + 0.0122 z 3 + 0.0330 z 4 + 0.0181 z 5 + 0.0086 z 6 + 0.0081 z 7 + 0.0255 z 8 + 0.0100 max g 4 ( z ) = 0.0196 z 1 + 0.0174 z 2 + 0.0176 z 3 + 0.0378 z 4 + 0.0224 z 6 + 0.0041 z 7 + 0.0174 z 8 + 0.0115 max g 5 ( z ) = 0.0226 z 1 + 0.0115 z 2 + 0.0165 z 3 + 0.0410 z 4 + 0.0028 z 5 + 0.0247 z 6 + 0.0037 z 7 + 0.0158 z 8 + 0.0120 max g 6 ( z ) = 0.0157 z 1 + 0.0029 z 2 + 0.0217 z 3 + 0.0058 z 4 + 0.0150 z 5 + 0.0082 z 6 + 0.0048 z 7 + 0.0577 z 8 + 0.0024 s . t .   0 z i 1 , i = 1 , , 8
Because the MOEA/PT method solves a minimization better than a maximation problem in MOO, we transformed the optimization problem of the policy tools mix for the rental housing market from maximization to minimization. Usually, we could convert constraints into new objectives. Equation (9) converts the constraints ( i = 1 8 z i 1 ) into Objectives 7 and 8 with the ideal values close to 1 infinitely. We also transformed the constraints ( i = 1 8 z i ) to an objective function ( i = 1 8 z i = 1 ). The decision variable z refers to the proportion of a policy instrument versus the various instruments in the same policy document. Therefore, the sum of z’s should be 1. The heuristic search algorithm is a kind of approximation algorithm. Hence, we set i = 1 8 z i to a value close to 1 infinitely on the left. For a genetic algorithm, the bigger the population size, the higher the number of genetic algebras. The optimization results become more accurate as well. However, the drawback is the increased calculation cost. Considering the calculation accuracy and efficiency, we set the population size to 300 and the genetic algebras to 2000 for the evolutionary simulation.
{ min h 1 ( z ) = 1 ( 0.0160 z 1 + 0.0147 z 2 + 0.0157 z 3 + 0.0189 z 4 + 0.0177 z 5 + 0.0156 z 6 + 0.0101 z 7 + 0.0178 z 8 + 0.0064 ) min h 2 ( z ) = 1 ( 0.0146 z 1 + 0.0128 z 2 + 0.0151 z 3 + 0.0221 z 4 + 0.0171 z 5 + 0.0152 z 6 + 0.0095 z 7 + 0.0233 z 8 + 0.0070 ) min h 3 ( z ) = 1 ( 0.0125 z 1 + 0.0168 z 2 + 0.0122 z 3 + 0.0330 z 4 + 0.0181 z 5 + 0.0086 z 6 + 0.0081 z 7 + 0.0255 z 8 + 0.0100 ) min h 4 ( z ) = 1 ( 0.0196 z 1 + 0.0174 z 2 + 0.0176 z 3 + 0.0378 z 4 + 0.0224 z 6 + 0.0041 z 7 + 0.0174 z 8 + 0.0115 ) min h 5 ( z ) = 1 ( 0.0226 z 1 + 0.0115 z 2 + 0.0165 z 3 + 0.0410 z 4 + 0.0028 z 5 + 0.0247 z 6 + 0.0037 z 7 + 0.0158 z 8 + 0.0120 ) min h 6 ( z ) = 1 ( 0.0157 z 1 + 0.0029 z 2 + 0.0217 z 3 + 0.0058 z 4 + 0.0150 z 5 + 0.0082 z 6 + 0.0048 z 7 + 0.0577 z 8 + 0.0024 ) min h 7 ( z ) = 0.1145 z 1 + 0.1082 z 2 + 0.115 z 3 + 0.2137 z 4 + 0.1356 z 5 + 0.1326 z 6 + 0.0769 z 7 + 0.1496 z 8 + | 0.6421 0.1145 z 1 0.1082 z 2 0.115 z 3 0.2137 z 4 0.1356 z 5 0.1326 z 6 0.0769 z 7 0.1496 z 8 | min h 8 ( z ) = | 0.6421 0.1145 z 1 0.1082 z 2 0.115 z 3 0.2137 z 4 0.1356 z 5 0.1326 z 6 0.0769 z 7 0.1496 z 8 | s . t .   0 z i 1 , i = 1 , , 8

6.3. Algorithm Validation

We validated the MOEA/PT algorithm and found that all the objectives converged correspondingly. For example, Figure 8a shows the convergence curve of Objective 7, which indicates that the MOEA/PT algorithm is effective. Figure 8b demonstrates the convergence curve of Objective 8. We used the average value under constraint for simplicity. The h8(z) solution should have a target value greater than 0. The average value changes at every 20th generation. The convergences indicate that the algorithm is effective.

6.4. Feasible Solution and Outcome Valuation

Table 4 shows feasible solutions after the execution of the MOEA/PT in Section 5.2. Only six solutions of the 300 populations are feasible. Hence, we calculated the standard deviation of the six feasible solution sets to compare them and the similar policy documents that were issued. We defined the solutions that deviated from the mean value by two or three standard deviations as outliers. After eliminating the outliers, we calculated the average of the six generated solution sets to obtain a comprehensive optimal solution set that contained the eight variables. Then, we compared the six objective function values of the comprehensive optimal solution set with the aforementioned six feasible solution sets and found that the comprehensive set was better (Table 5).
The comprehensive optimal solution set we obtained in this section can help Chinese government to issue the efficient development policy of rental housing market. Promoting the supply-side structural reform of the housing rental market is the main development direction of China’s housing rental market [46]. For China’s large and medium-sized cities with large population inflows and strong rental housing demand, on the one hand, rental housing supply should be increased steadily, on the other hand, government should build housing cost-price rental housing, a kind of housing that obtains policy support, accepts safety supervision and tenancy supervision, and its rent price is close to the comprehensive cost. The specific policy support for developing cost-price rental housing contain land policy, finance policy, tax policy and other aspect. Land policies contain supplying “only rent not sell” construction land, exploring land annual rent system and using collective-owned construction land to reduce the construction cost of rental housing [47]. Finance policies contain providing low-interest loans to professional housing rental enterprises, issuing specific bond and promoting REITs (Real Estate Investment Trusts) to reduce the operating cost of rental housing. Tax policies contain property tax, business tax and other related taxes.
The contribution of this research lies in the establishment of a quantitative MOO model for the rental housing market. The MOEA/PT algorithm enhances the effectiveness of the existing MOO methods by iterative Pareto evolution. For example, we collected 11 representative policy documents of the Chinese rental housing markets. They were issued by the central government (five items) and pilot cities (six items). There were two items from Chengdu, one item from Hangzhou, one item from Shenzhen, one item from Jinan, and one item from Changchun. We used the content analysis method to mine the 11 policy documents and obtained the proportions of different policy tools in one policy as the decision variables of the MOO function. Then, we used the established optimization functions in Section 3 to get the 11 sets of objective function results (Figure 9). The red nodes represent the comprehensive solution set of feasible solutions discussed in this section. The other colored nodes represent the contributions of 11 representative policies to the six objectives. Figure 9 shows that the contribution of the comprehensive feasible solutions to the six objectives is greater than the issued 11 policies. It indicates that the policy tool combination optimization function and MOO algorithm proposed in this paper are effective.

7. Conclusions

The theoretical implications of this research are promoting quantitative research in the field of public-policy design and solving the urgent problems in the rental housing market. First, there are many targets in designing public policy. Policymakers can use this MOEA/PT model to achieve the optimal combination of various policy tools when multiple targets need to be maximized simultaneously. Secondly, this novel approach of MOEA/PT sheds light on the development of a new MOO algorithm to solve the problems of missing the convergence pressure when the diversity metric of crowding distance is not fine enough. Without the convergence pressure, policymakers may face a selection dilemma of two or more conflicts. Meanwhile, rough or unbalanced policy criteria or measures could discourage or damage the growth of a rental housing market. Specifically, the framework of choosing the key policy tools and constructing MOO functions includes the following main functions: (i) building a policy database through literature data mining; (ii) analyzing word-frequency distribution and co-occurrence networks of various policy tools; (iii) considering the efficient policy tools already used in related sectors; (iv) identifying key policy targets through analysis of key contradictions in a specific sector and the general principles of public-policy design; (v) establishing the multi-objective functions and constraint functions for policy design through opinion mining and content analysis of the literature and policy databases.
Strengthening the development of the rental housing market is the key point to realize the current primary strategy of China’s housing supply “housing is for living in, not speculation”. The efficient and reasonable cultivation policy can promote the development of the rental housing market. Tax and interest subsidy, financing subsidy, laws and management regulations, encouragement and support, education and training, financial instrument, target planning, government service were obtained as the key policy tools for the housing rental market. Through the analysis of key contradictions in the rental housing market and general principles of public policy design, we draw six key policy target for rental housing market, which are policy strategic maximization, policy forward-looking maximization, policy participation maximization, housing rental ratio maximization, market share of specialized rental enterprises maximization and operating efficiency of the rental housing market maximization. The original intention of developing large-scale housing rental enterprises is to encourage social investment on rental housing industry and improve the supply and quality of rental housing. However, in developing cities with large floating populations, large-scale rental enterprises will increase the market monopoly and increase price coercion. Due to its large market share, it may drive rent price to rise, and the government should implement regulatory intervention to prevent price coercion caused by monopolies in the rental housing market. This proposed quantitative policy design framework achieves Pareto optimization on multiple objectives and comprehensively obtains an optimized combination of eight policy tools. The comparison of the feasible solution set and 11 related real-world policies shows that the policy effects of the optimized feasible-solution set are better than those of the issued policies. Hence, the proposed model is effective and practical in policy optimization. Our research provides a quantitative process for governments to formulate public policies, which can promote their accuracy and effectiveness.
The policy method we proposed in this research has some practical implications. Our method can help policy makers to issue precise policies which can identify more precision in the weighting of a set of policy tools, and in the case study of this paper, efficient and reasonable promotion policy can promote the development of the rental housing market. From the perspective of the supply side, the policy tools mix we proposed can increase the number of specialized rental enterprises participating in the supply of high-quality, good-service rental housing. From the perspective of the demand side, the policy tools mix can improve the rationality of residents’ housing consumption, in terms of tenure choice according to housing affordability and actual demand, and make the group who choose to rent a house obtain the same life quality and public service rights as buying a house. In this paper, we use the content analysis of existing expert opinions to determine the parameters of the objective function and the constraint function. The research and discussion on the housing rental market are constantly increasing, and the parameters need to be continuously optimized. Thus, in future research, we plan to use other quantization methods, such as questionnaires and machine learning, to improve the accuracy of the parameters of objective function and constraint functions. Additionally, we will focus on the classification of policy tools, especially the research on policy tools for the development policy of rental housing market, and obtain a more scientific classification method that is as independent as possible and has clear boundaries.

Supplementary Materials

The following are available online at https://www.mdpi.com/2071-1050/12/14/5710/s1.

Author Contributions

Conceptualization, funding acquisition, project administration, resources, data curation, conceptualization, methodology, writing—review and editing, X.G.; Writing—original draft preparation, L.L.; Writing—review and editing, supervision, validation, and verification, H.X.; Writing—review and editing, supervision, W.S. All authors have read and agreed to the published version of the manuscript.

Funding

This research received support from the National Key R&D Program of China (No. 2018YFD1100202); the Ministry of Education Humanistic and Social Science Program of China (No. 19YJC630080); the General Project of Shaanxi Province Soft Science Research Program (No. 2019KRM197); the Philosophy and Social Science Research Program of Education Department of Shaanxi Province (No.12JK0070); and the Shaanxi Key Research Base of Co-construction and Sharing for Human Settlement Environment and Good Life of the New Era.

Conflicts of Interest

The authors declare no conflict of interest.

Appendix A

Table A1. Symbols of 30 policy tools in Figure 3.
SymbolFull NameSymbolFull Name
T1Encouragement and SupportT16system construction
T2Government’s Purchases of ServiceT17Authority adjustment
T3Laws and Management RegulationT18standard and norm
T4Financing SubsidyT19pilot demonstration
T5tax and interest subsidyT20public engagement
T6government serviceT21penalty
T7financial instrumentT22reward
T8infrastructureT23Price adjustment
T9regulateT24supervision
T10target planningT25Credit support
T11Education and trainingT26platform building
T12Social organizationT27admonishing
T13administrationT28Expert participation
T14Market CultivationT29State-Owned Enterprise
T15propaganda and leadingT30administrative payment

References

  1. Li, H.; Wei, Y.D.; Wu, Y.Y. Analyzing the private rental housing market in Shanghai with open data. Land Use Policy 2019, 85, 271–284. [Google Scholar] [CrossRef]
  2. Li, L.Y.; Chen, S.Q. An analysis of the policy structure of cultivating and developing the housing Market—Based on Dual Perspectives of Policy Tools and Industrial Chain. Fujian Trib. 2018, 8, 28–37. (In Chinese) [Google Scholar]
  3. Cui, N.N.; Gu, H.Y.; Shen, T.Y.; Feng, C.C. The Impact of Micro-Level Influencing Factors on Home Value: A Housing Price-Rent Comparison. Sustainability 2018, 10, 4343. [Google Scholar] [CrossRef] [Green Version]
  4. Concu, G.B.; Atzeni, G.; Meleddu, M.; Vannini, M. Policy design for climate change mitigation and adaptation in sheep farming: Insights from a study of the knowledge transfer chain. Environ. Sci. Policy 2020, 107, 99–113. [Google Scholar] [CrossRef]
  5. Jiang, B.; Chen, Y.Y.; Bai, Y.; Xu, X.B. Supply-demand coupling mechanisms for policy design. Sustainability 2019, 11, 5760. [Google Scholar] [CrossRef] [Green Version]
  6. Rivera-Ferre, M.G.; Atzeni, G.; Meleddu, M.; Vannini, M. Rethinking study and management of agricultural systems for policy design. Sustainability 2013, 5, 3858–3875. [Google Scholar] [CrossRef] [Green Version]
  7. Pierce, J.J.; Siddiki, S.; Jones, M.D.; Schumacher, K.; Pattison, A.; Peterson, H. Social construction and policy design: A review of past applications. Policy Stud. J. 2014, 42, 1–29. [Google Scholar] [CrossRef]
  8. Howlett, M. Governance Modes, Policy Regimes and Operational Plans: A multi-level nested model of policy instrument choice and policy design. Policy Sci. 2009, 42, 73–89. [Google Scholar] [CrossRef]
  9. Weimer, D.L. The current state of design craft: Borrowing, tinkering, and problem solving. Public Admin. Rev. 1993, 53, 110–120. [Google Scholar] [CrossRef]
  10. Hou, C.; Fu, H.; Liu, X.; Wen, Y. The Effect of Recycled Water Information Disclosure on Public Acceptance of Recycled Water—Evidence from residents of Xi’an, China. Sustain. Cities Soc. 2020, 102351. [Google Scholar] [CrossRef]
  11. Howlett, M.P.; Mukherjee, I. Policy design and non-design: Towards a spectrum of policy formulation types. Policy Gov. 2014, 2, 57–71. [Google Scholar]
  12. Zheng, S.Q.; Cheng, Y.; Ju, Y.J. Understanding the intention and behavior of renting houses among the young generation: Evidence from Jinan, China. Sustainability 2019, 11, 1507. [Google Scholar] [CrossRef] [Green Version]
  13. Hu, L.; He, S.; Han, Z.; Xiao, H.; Su, S.; Weng, M.; Cai, Z. Monitoring housing rental prices based on social media: An integrated approach of machine-learning algorithms and hedonic modeling to inform equitable housing policies. Land Use Policy 2019, 82, 657–673. [Google Scholar] [CrossRef]
  14. Deng, L.; Shen, Q.; Wang, L. The emerging housing policy framework in China. J. Plan. Lit. 2011, 26, 168–183. [Google Scholar] [CrossRef]
  15. Ye, J.P.; Wu, Z.H. Urban housing policy in China in the macro-regulation period 2004–2007. Urban Policy Res. 2008, 26, 283–295. [Google Scholar] [CrossRef]
  16. Zhang, M.; Rasiah, R. Localization of state policy: Shandong’s experience in financing Cheap Rental Housing in urban China. Habitat Int. 2016, 56, 1–10. [Google Scholar] [CrossRef]
  17. Wei, Z.; Chen, T.; Chiu, R.L.; Chan, E.H. Policy transferability on public housing at the city level: Singapore to Guangzhou in China. J. Urban Plan. Dev. 2017, 143, 05017010. [Google Scholar] [CrossRef]
  18. Dinzey-Flores, Z.Z. Temporary housing, permanent communities-public housing policy and design in Puerto Rico. J. Urban Hist. 2007, 33, 467–492. [Google Scholar] [CrossRef]
  19. Duan, K.; Mishra, T.; Parhi, M.; Wolfe, S. How effective are policy interventions in a spatially-embedded international real estate market? J. Real Estate Financ. Econ. 2019, 58, 596–637. [Google Scholar] [CrossRef] [Green Version]
  20. Zou, Z.P. Examining the impact of short-term rentals on housing prices in Washington, DC: Implications for housing policy and equity. Hous. Policy Debate 2020, 30, 269–290. [Google Scholar] [CrossRef]
  21. Nahum, O.E.; Hadas, Y. Multi-objective optimal allocation of wireless bus charging stations considering costs and the environmental impact. Sustainability 2020, 12, 2318. [Google Scholar] [CrossRef] [Green Version]
  22. Mohamed, A.A.; Ali, S.; Alkhalaf, S.; Senjyu, T.; Hemeida, A.M. Optimal allocation of hybrid renewable energy system by multi-objective water cycle algorithm. Sustainability 2019, 11, 6550. [Google Scholar] [CrossRef] [Green Version]
  23. Mandade, P.; Shastri, Y. Multi-objective optimization of lignocellulosic feedstock selection for ethanol production in India. J. Clean. Prod. 2019, 231, 1226–1234. [Google Scholar] [CrossRef]
  24. Xu, H.; Zeng, W.; Zeng, X.; Yen, G.G. An evolutionary algorithm based on Minkowski distance for many-objective optimization. IEEE Trans. Cybern. 2019, 49, 3968–3979. [Google Scholar] [CrossRef]
  25. Yang, W.S.; Chen, L.; Wang, Y.; Zhang, M.S. A reference points and intuitionistic fuzzy dominance based particle swarm algorithm for multi/many-objective optimization. Appl. Intell. 2020, 50, 1133–1154. [Google Scholar] [CrossRef]
  26. Luo, J.; Huang, X.; Yang, Y.; Li, X.; Wang, Z.; Feng, J. A many-objective particle swarm optimizer based on indicator and direction vectors for many-objective optimization. Inf. Sci. 2020, 50, 1133–1154. [Google Scholar] [CrossRef]
  27. Zhou, J.J.; Gao, L.; Yao, X.F.; Zhang, C.J.; Chan, F.T.S.; Lin, Y.Z. Evolutionary many-objective assembly of cloud services via angle and adversarial direction driven search. Inf. Sci. 2020, 513, 143–167. [Google Scholar] [CrossRef]
  28. Wang, Z.K.; Ong, Y.S.; Sun, J.Y.; Gupta, A.; Zhang, Q.F. A Generator for Multiobjective Test Problems With Difficult-to-Approximate Pareto Front Boundaries. IEEE Trans. Evol. Comput. 2019, 23, 556–571. [Google Scholar] [CrossRef]
  29. Chica-Olmo, J.; Cano-Guervos, R.; Chica-Rivas, M. Estimation of housing price variations using spatio-temporal data. Sustainability 2019, 11, 1551. [Google Scholar] [CrossRef] [Green Version]
  30. Wen, C.; Wallace, J.L. Toward human-centered urbanization? housing ownership and access to social insurance among migrant households in China. Sustainability 2019, 11, 3567. [Google Scholar] [CrossRef] [Green Version]
  31. Li, B.; Li, J.; Tang, K.; Yao, X. Many-objective evolutionary algorithms: A survey. ACM Comput. Surv. 2015, 48, 1–35. [Google Scholar] [CrossRef] [Green Version]
  32. Fu, H.; Wang, M.; Li, P.; Jiang, S.; Hu, W.; Guo, X.; Cao, M. Tracing Knowledge Development Trajectories of the Internet of Things Domain: A main path analysis. IEEE Trans. Ind. Inform. 2019, 15, 6531–6540. [Google Scholar] [CrossRef]
  33. Deb, K.; Pratap, A.; Agarwal, S.; Meyarivan, T. A fast and elitist multiobjective genetic algorithm: NSGA-II. IEEE Trans. Evol. Comput. 2002, 6, 182–197. [Google Scholar] [CrossRef] [Green Version]
  34. Dunn, W.N. Public Policy Analysis: An Introduction; Prentice-Hall: Upper Saddle River, NJ, USA, 1981. [Google Scholar]
  35. Li, Q.; Wang, X.J.; Wu, J.J. Principles, criteria and keys of public policy evaluation in the new era of China. J. Arid Land Resour. Environ. 2019, 33, 1–8. (In Chinese) [Google Scholar]
  36. Schneider, A.; Ingram, H. Systematically Pinching Ideas: A comparative approach to policy design. J. Public Policy 1988, 8, 61–80. [Google Scholar] [CrossRef] [Green Version]
  37. Capano, G.; Lippi, A. How policy instruments are chosen: Patterns of decision makers’ choices. Policy Sci. 2017, 50, 1–25. [Google Scholar] [CrossRef]
  38. Krischen, E.S. Economic Policy in Our Time; Holland Pub.: Amsterdam, The Netherlands, 1964. [Google Scholar]
  39. Schneider, A.; Ingram, H. Behavioral assumptions of policy tools. J. Politics 1990, 52, 510–529. [Google Scholar] [CrossRef] [Green Version]
  40. Lascoumes, P.; Gales, P. Introduction: Understanding public policy through its instruments from the nature of instruments to the sociology of public policy instrumentation. Governance 2007, 20, 1–21. [Google Scholar] [CrossRef]
  41. Zhai, D.; Shang, Y.S.; Wen, H.Z.; Ye, J.B. Housing Price, Housing Rent, and Rent-Price Ratio: Evidence from 30 Cities in China. J. Urban Plan. Dev. 2018, 144, 04017026. [Google Scholar] [CrossRef]
  42. Li, L.; Feng, L.; Guo, X.; Xie, H.; Shi, W. Complex Network Analysis of Transmission Mechanism for Sustainable Incentive Policies. Sustainability 2020, 12, 745. [Google Scholar] [CrossRef] [Green Version]
  43. He, Z.; Yen, G.G. Many objective evolutionary algorithm: Objective space reduction and diversity improvement. IEEE Trans. Evol. Comput. 2015, 20, 145–160. [Google Scholar] [CrossRef]
  44. Zhu, C.; Cai, X.; Fan, Z.; Sulaman, M. A two-phase many-objective evolutionary algorithm with penalty based adjustment for reference lines. IEEE Congr. Evol. Comput. 2016, 2161–2168. [Google Scholar] [CrossRef]
  45. Ishibuchi, H.; Imada, R.; Setoguchi, Y.; Nojima, Y. Reference point specification in inverted generational distance for triangular linear Pareto front. IEEE Trans. Evol. Comput. 2018, 22, 961–975. [Google Scholar] [CrossRef]
  46. Liu, W.; Li, J.; Ren, L.; Xu, J.; Li, C.; Li, S. Exploring Livelihood Resilience and Its Impact on Livelihood Strategy in Rural China. Soc. Indic. Res. 2020. [Google Scholar] [CrossRef]
  47. Wu, Z.; Yu, A.T.W.; Wang, H.; Wei, Y.; Huo, X. Driving factors for construction waste minimization: Empirical studies in Hong Kong and Shenzhen. J. Green Build. 2019, 14, 155–167. [Google Scholar] [CrossRef]
Figure 1. The proportions of the non-dominated solutions to the initial solutions in various objectives.
Sustainability 12 05710 g001
Figure 2. Research Methodology.
Sustainability 12 05710 g002
Figure 3. Word Frequency Distribution of 30 Main Policy Tools in Different Policy Area. The specific policy tool names from T1 to T30 are shown in Appendix A Table A1.
Sustainability 12 05710 g003
Figure 4. Policy instrument co-occurrence network of six different policy target.
Sustainability 12 05710 g004
Figure 5. Cluster of policy instrument adoption frequency in high-level public policy database.
Sustainability 12 05710 g005
Figure 6. Flowchart of the MOEA/PT Algorithm.
Sustainability 12 05710 g006
Figure 7. Multi-objective optimization decision flowchart of rental housing market policy tools mix.
Sustainability 12 05710 g007
Figure 8. (a) Convergence curve of objective 7; (b) Convergence curve of objective 8.
Sustainability 12 05710 g008
Figure 9. Comparison on target values of issued policy tool mix and comprehensive feasible solution.
Sustainability 12 05710 g009
Table 1. Definitions.
DefinitionExplanation
Ideal point ( Z * ) (Definition I) Z i * = min x P S f i ( x ) , i { 1 , , m }
Pareto extreme point (B) (Definition II) B i = max x P S f i ( x ) , i { 1 , , m }
Boundary Solution (Definition III)A solution which can minimize k objectives as well as maximize other all objectives for the multi-objective optimization problem with m objectives and Pareto optimization solution set.
Table 2. Framework of policy tools for rental housing market.
#Policy ToolsTool TypeTool Connotation
1tax and interest subsidysupply/demand-incentive-special region (i) reduce tax burden on rental housing enterprise.
(ii) real estate vacancy tax on homeowner.
(iii) reduce contract record fee on tenants.
2financing subsidysupply-regulation-sub regional(i) direct subsidies on rental housing enterprise.
3laws and management regulationsenvironmental-regulation-nationwide(i) formulate conduct code for landlords and tenants.
(ii) clarify the legal liability of landlords and tenants.
4encouragement and supportsupply/demand-social-special region(i) encourage real estate developers to transform into professional and large-scale rental housing enterprises.
(ii) encourage residents to form housing gradient consumption concept of “rent first, then buy”.
5education and trainingsupply-regulation-sub regional(i) carry out vocational qualifications training and evaluation of rental housing industry.
6financial instrumentsupply/demand-incentive-nationwide(i) financial institutions grant long-term low-interest loans to asset- heavy rental enterprises.
(ii) rental enterprises issue REITs.
(iii) banks develop personal loan on rental housing.
7target planningEnvironmental-incentive/social-nationwide(i) formulate a five-year plan for rental housing market.
8government serviceEnvironmental-regulation-sub regional(i) construct a service platform.
Table 3. Comparison results of algorithms in 8-objectives.
Test ProblemObjectivesMOEA/PTMOEA/PT-1NSGA-II
DTLZ180.13770.193948.6018
DTLZ280.36330.44441.9791
DTLZ380.37090.4424485.9812
DTLZ480.39210.51592.1941
DTLZ680.00400.00449.0290
DTLZ780.58070.77991.0053
Table 4. Six sets of feasible solution and objective.
Set ISet IISet III
solutionobjectivesolutionobjectivesolutionobjective
0.1312070.1157610.1381410.1163480.1112340.114430
0.1538300.1201470.1452210.1212550.1707280.117843
0.0890590.1402900.0975520.1371160.0992700.141467
0.3463810.1418380.3222390.1494100.4201020.148824
0.0966550.1421340.0569170.1498470.0572240.147995
0.0192370.1126940.0727000.1204410.0045890.090563
0.022509 0.008719 0.056808
0.132494 0.153244 0.078936
Set IVSet VSet VI
solutionobjectivesolutionobjectivesolutionobjective
0.1296020.1145210.1050310.1147400.0942180.115343
0.1615110.1180490.1702960.1181110.1642610.120571
0.1017040.1363900.0924750.1418800.1097100.137214
0.3908520.1575770.4044970.1433480.3460820.154292
0.0164120.1575770.0957080.1430170.0101500.151929
0.0734910.0959010.0028680.0927880.0858320.113736
0.031175 0.043623 0.038055
0.092480 0.082751 0.148990
Table 5. Comprehensive and optimized solution set and objective values.
X1X2X3X4X5X6X7X8
Mean0.118240.160980.098300.371690.055510.043120.033480.11482
Standard deviation0.015780.009060.006620.035420.033910.034870.015310.03102
Solution number with error less than δ 43442342
Comprehensive Optimal Solution Set and Objective Values
X1X2X3X4X5X6X7X8
solution set0.119270.159870.097750.371950.057070.055140.033840.11249
Obj1Obj2Obj3Obj4Obj5Obj6
objective values0.116520.120540.139610.150960.150850.10441

