Article

Wind Dynamic Environment and Wind Tunnel Simulation Experiment of Bridge Sand Damage in Xierong Section of Lhasa–Linzhi Railway

1
Key Laboratory of Desert and Desertification, Northwest Institute of Eco-Environment and Resources, Chinese Academy of Sciences, Lanzhou 730000, China
2
Dunhuang Gobi and Desert Research Station, Northwest Institute of Eco-Environment and Resources, Chinese Academy of Sciences, Dunhuang 736200, China
3
Institute of Desertification Studies, Chinese Academy of Forestry, Beijing 100091, China
*
Author to whom correspondence should be addressed.
Sustainability 2020, 12(14), 5689; https://doi.org/10.3390/su12145689
Submission received: 27 May 2020 / Revised: 10 July 2020 / Accepted: 13 July 2020 / Published: 15 July 2020

Abstract

:
The Lhasa–Linzhi Railway is located in the sandy area of the South Tibet valley, with high elevation and cold temperature. The Xierong section is a bridge section where blown sand hazards are severe. However, the disaster-causing mechanism of blown sand hazards in this section is currently unclear, thereby hindering targeted sand prevention and control. To address this problem, the wind dynamic environment of and causes of sand damage in this section are investigated through the field observation of the locale and a wind tunnel simulation experiment. Results show that the dominant sand-moving wind direction in the Xierong section is SSE. The wind speed, frequency of sand-moving wind, sand drift potential (DP), and maximum possible sand transport quantity (Q) in this section are relatively high during spring (March to May) and low during other seasons. The yearly resultant sand transport direction (RDD, RA) is SW. The angle between the route trend of this section and the sand transportation direction is 30°–45°, and the sand source is located in the east side of the railway. During spring, sand materials are blown up by the wind, forming blown sand flow and movement from the NE to SW direction. Increased wind speed area is formed between the top of the slope shoulder of the windward side of the bridge and the downwind direction of 3H, causing blown sand erosion. Meanwhile, weakened wind speed areas are formed within the distance of -3H at the upwind direction and from the downwind direction of the 3H to 20H of the bridge. These areas accumulate sand materials at the upwind and downwind directions of the bridge, thereby resulting in blown sand hazards. This research provides a scientific basis for the prevention and control of sand damage in the locale.

1. Introduction

The Lhasa–Linzhi Railway passes southeast of the Qinghai–Tibet Plateau, the middle reaches of the Yalu Tsangpo River and its two tributary valleys of the Lhasa River and the Nyang River, and the railway west from Lhasa City, which is the terminus of the Qinghai–Tibet Railway. This railway is also along the Lhasa River down to Xierong, crossing the rest of the Gangdisi Mountain to the south, entering the Yalu Tsangpo River valley, and then turning to the east at Konggar County, following the Yalu Tsangpo River downstream. The Lhasa–Linzhi Railway also line strides the Yalu Tsangpo River 16 times; passes Zhanang County, Shannan City, Sangri County, Gyaca County, Nang County, and Mainling County; traces the Nyang River upstream after these counties; and finally arrives in Linzhi City, which is an important city in the southeast of Tibet (Figure 1). The total length of the Lhasa–Linzhi Railway is 436 km. The construction of this railway started in December 2014 and is expected to be completed and opened to traffic by the end of 2020. The land desertification along the Lhasa–Linzhi Railway is severe because of several factors, such as the dry and windy climate, the rich source of sandy materials, the sparse and low vegetation, the short growing season, and intensive human activities [1]. Large areas with moving dunes and semifixed sandy lands are distributed on the valley bottom, the valley slope, and the neck, especially in the broad river valley [2,3,4]. The ecological environment is fragile, and the blown wind activities are strong. These dunes/sandy lands not only have a complex and diverse morphology, but are also large in scale (with widths up to 1000–2000 m) and have a high distribution (a relative height difference of up to 600–700 m) and fast-moving speed (1–5 m·a−1) [5]. Meanwhile, owing to the unique blown sand environment with high elevation and cold temperature of the Qinghai–Tibet Plateau [6,7], the matter and energy balance of the system would be altered by any small disturbance [8,9,10]. The construction process of railways inevitably destroys the native sparse vegetation and the fragile ecological environment to a certain extent and exacerbates the surface blown sand activities along the railway [11,12]. The original, relatively stable dynamic balance of the blown sand movement of the plateau is particularly disturbed in the space domain with the appearance of the railway roadbed. Moreover, the moving path and intensity of the blown sand flow near the surface are altered. Consequently, blown sand hazards become prominent. Surveys and statistics indicate that the Lhasa–Linzhi Railway currently has 12 blown sand sections with a total length of 12.35 km [5]. These sections are mainly distributed in the river broad valley sections, such as Xierong, Shannan, and Mainling (Figure 1). Among them, the blown sand hazards in the Xierong section are severe. However, the dynamic environment of blown sand in this section is currently unclear, and the cause of blown sand hazards has not been reported, hindering targeted sand prevention and control. Therefore, through the field observation of the locale and a wind tunnel simulation experiment, the authors attempt to ascertain the characteristics of the blown sand dynamic environment and reveal the formation mechanism of sand damage in this section to provide a scientific basis for the prevention and control of sand damage in the locale.

2. Methods

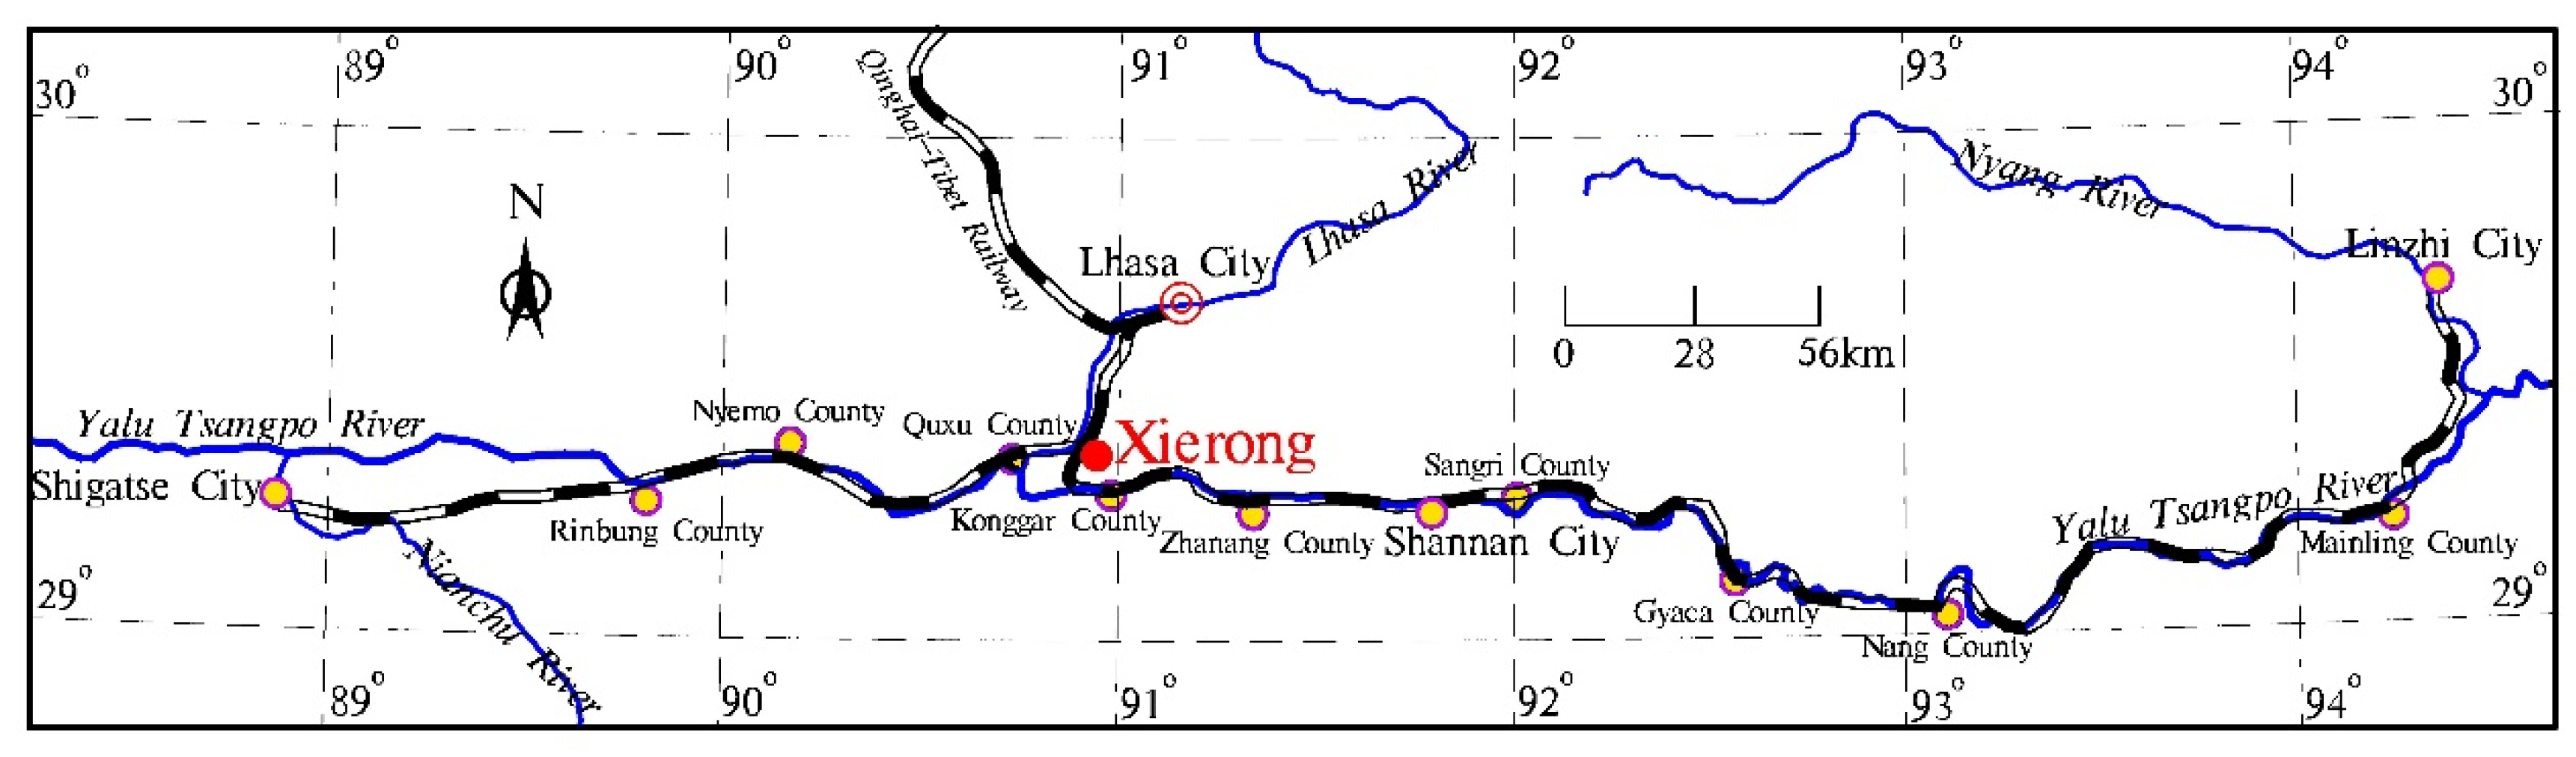
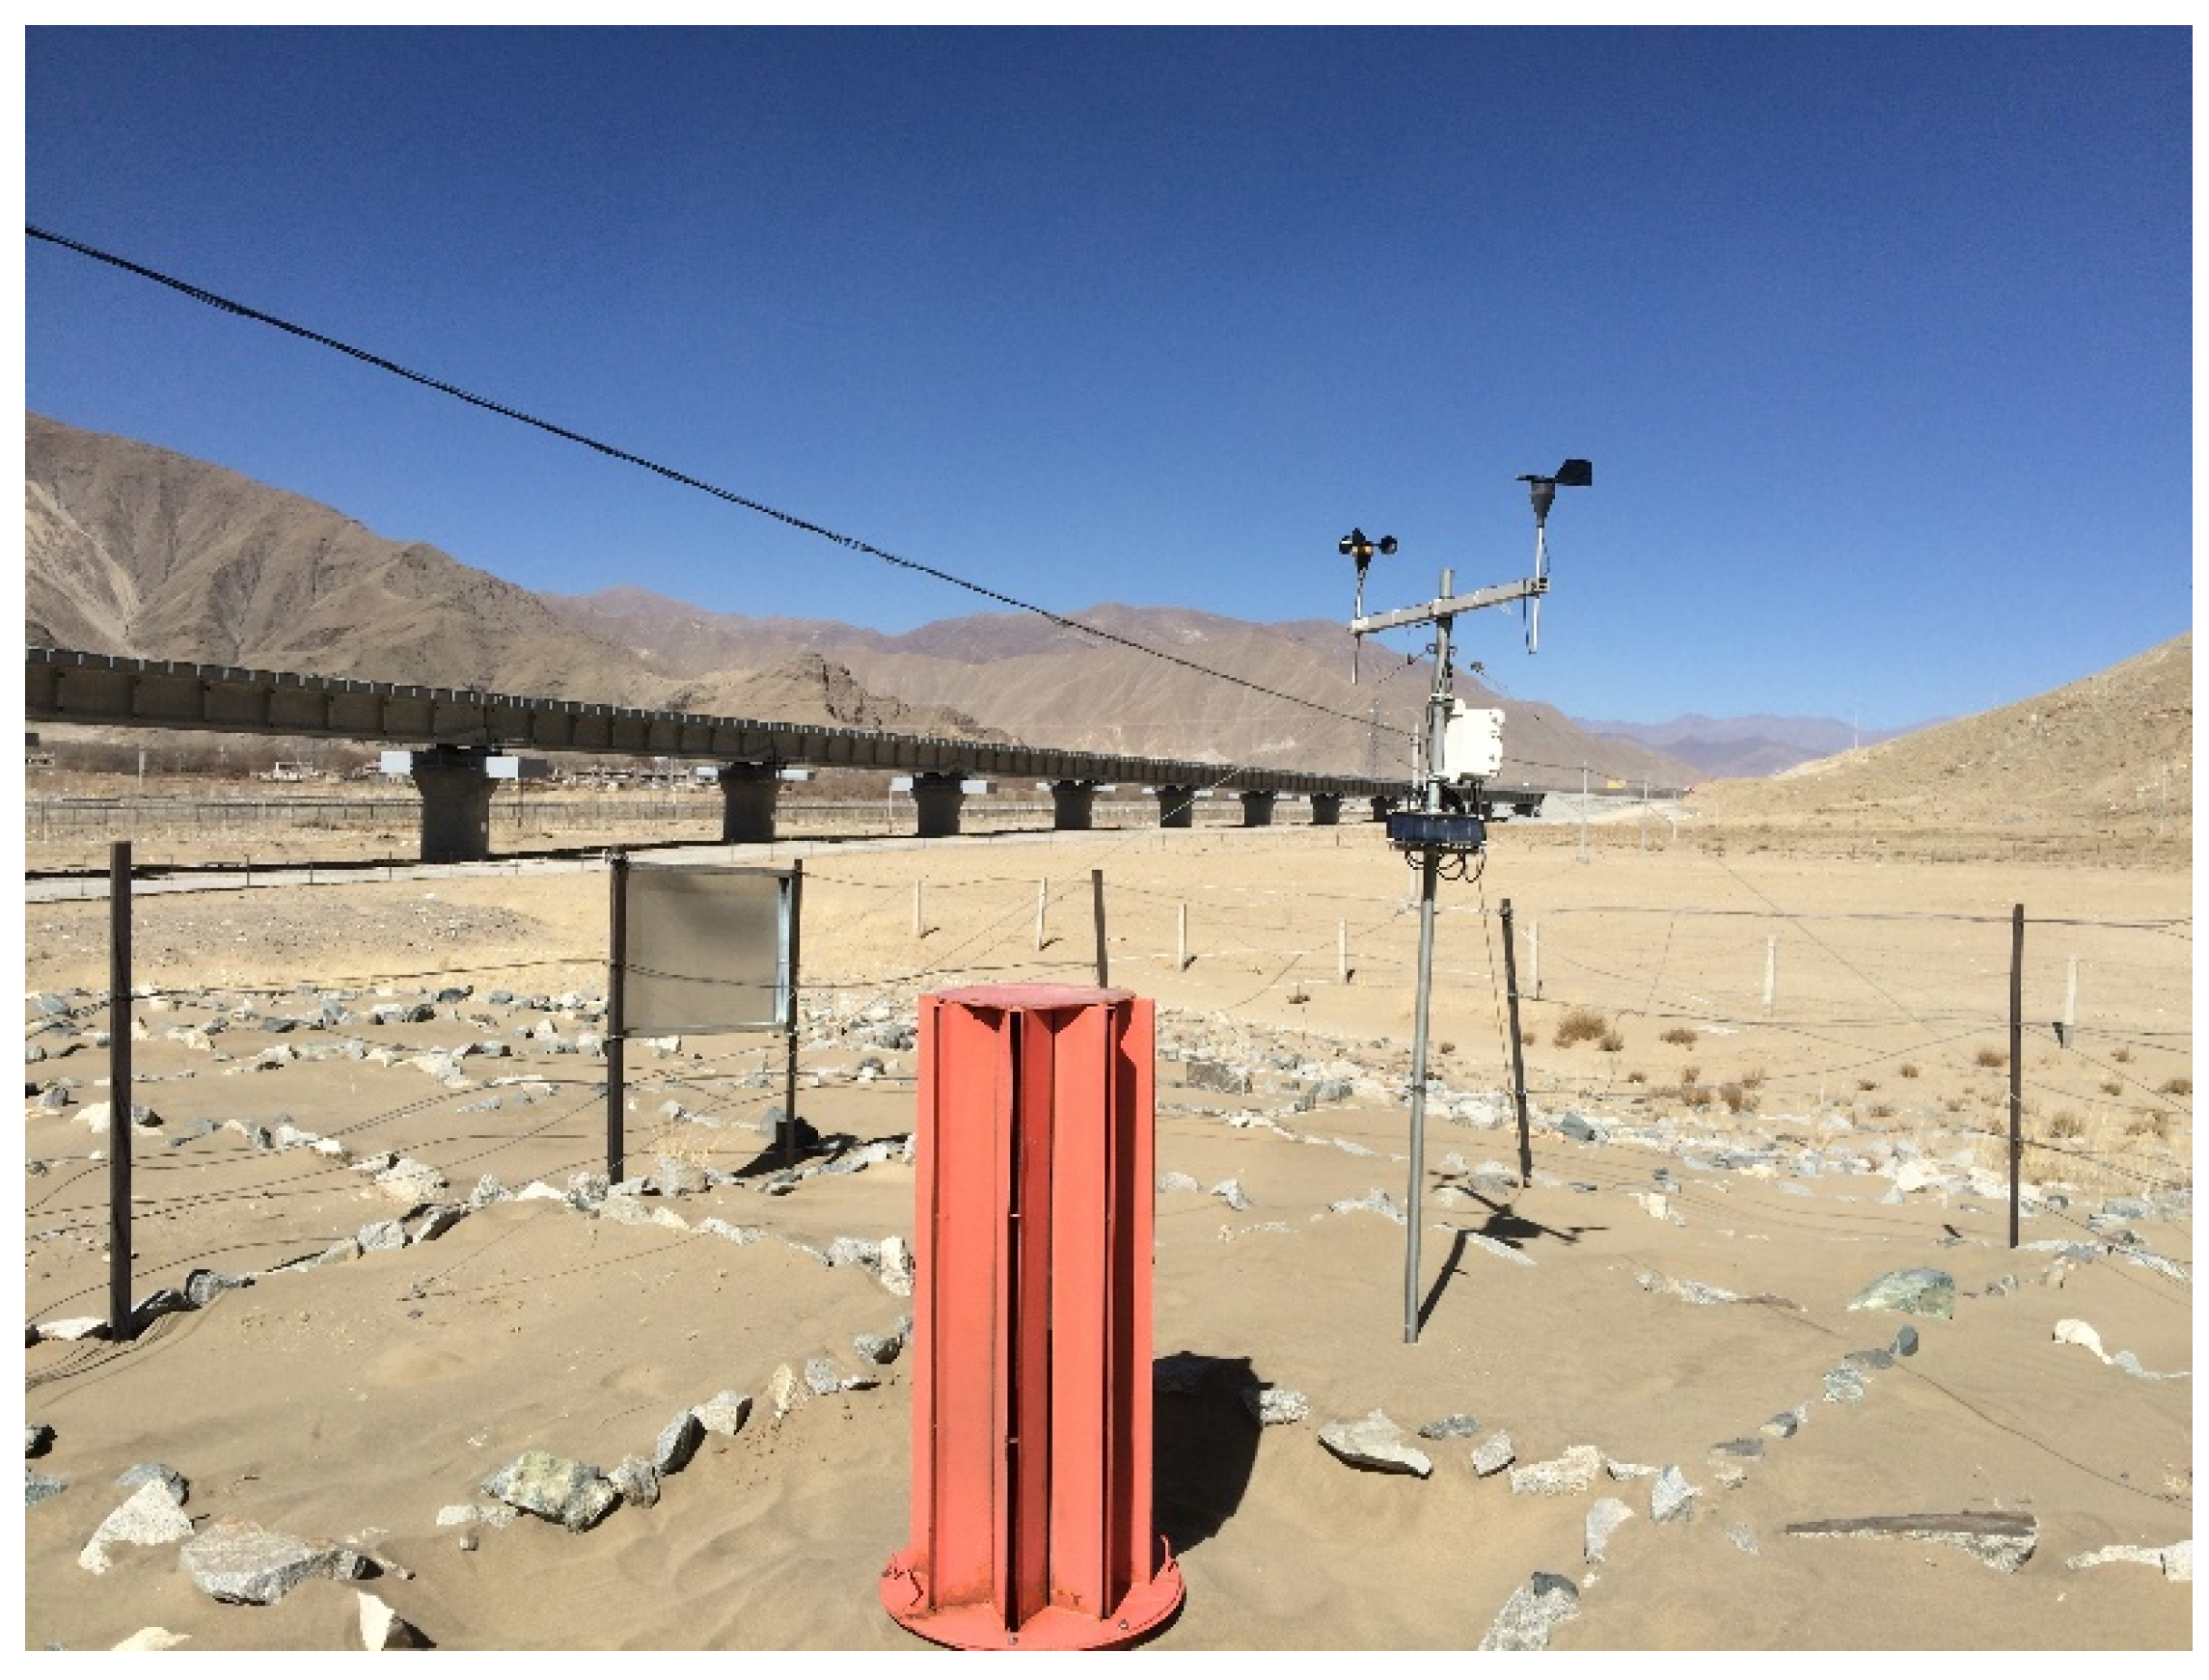
2.1. Field Observation

Blown sand hazards cover 1.2 km of the Xierong section of the Lhasa–Linzhi Railway, which experiences serious blown sand hazards. The subgrade form of this section is all bridges, and the characteristics of the bridges are shown in Table 1. This section is located in the sandy area of the South Tibet valley with a high elevation and cold temperatures, and whose main landform types include plain sand land, Gobi, and climbing and falling dunes [13,14]. The observation site is located in the sand source area of the east side of this section (Figure 2), with geographic coordinates of 29° 22′45″ N, 90° 54′33″ E and an altitude of 3612 m. Meteorological sensors were installed at a surface height of 2 m to record the wind speed and direction in the locale every 5 min from September 2017 to August 2018. The collected observation data were used to statistically analyze the average wind speed and sand-moving wind conditions in this section. Afterward, the sand drift potential (DP), the resultant drift potential (RDP), and the resultant drift direction (RDD) were calculated according to a method proposed in the literature [15].
DP = 8.95 × V 2 ( V V t ) t
where DP is the sand drift potential expressed in vector units (VU), V is the wind speed higher than the sand-moving wind (m·s−1), Vt is the sand-moving wind speed (m·s−1), and t is the time affected by the sand-moving wind and is expressed in frequency. The RDP (VU) and the RDD (°) were obtained by synthesizing the sand DP based on the vector synthesis rule, and the index of directional wind variability is the ratio of the RDP to the DP (RDP/DP). The sand DP reflects the potential sand transport capacity in a certain direction during a period of time.
The maximum possible sand transport quantity (Q), resultant quantity (RQ), and resultant angle (RA) of the maximum possible sand transport were calculated according to a method proposed in the literature [16,17].
Q = 8.95 × 10 1 ( V V t ) × T
where Q is the maximum possible sand transport quantity (kg·m−1·a−1), V is the wind speed greater than the sand-moving wind (m·s−1), Vt is the sand-moving wind speed (m·s−1), and T is the cumulative duration of wind speed with different ranges. In the calculation, the statistics of the frequency or time of different wind speed ranges at each direction were first obtained based on 16 directions. Then, the Q values in the 16 directions were calculated under different wind speed ranges to obtain the Q of each direction. The sum of the Q values in the 16 directions is the total Q (kg·m−1·a−1). Finally, the RQ (kg·m−1·a−1) and the RA (°) of the maximum possible sand transport were obtained by synthesizing Q in 16 directions based on the vector synthesis rule. The maximum possible sand transport quantity (Q) directly reflects the spatial distribution conditions of sand quantity, which refers to the maximum possible transport capacity of air flow for sandy materials when the sand source is sufficient, the sand surface is flat, bare, loose, and dry, and the air flow functioning on the surface of the drift sand is fully saturated. The maximum possible sand transport quantity is the theoretical limit value of sand transport quantity.

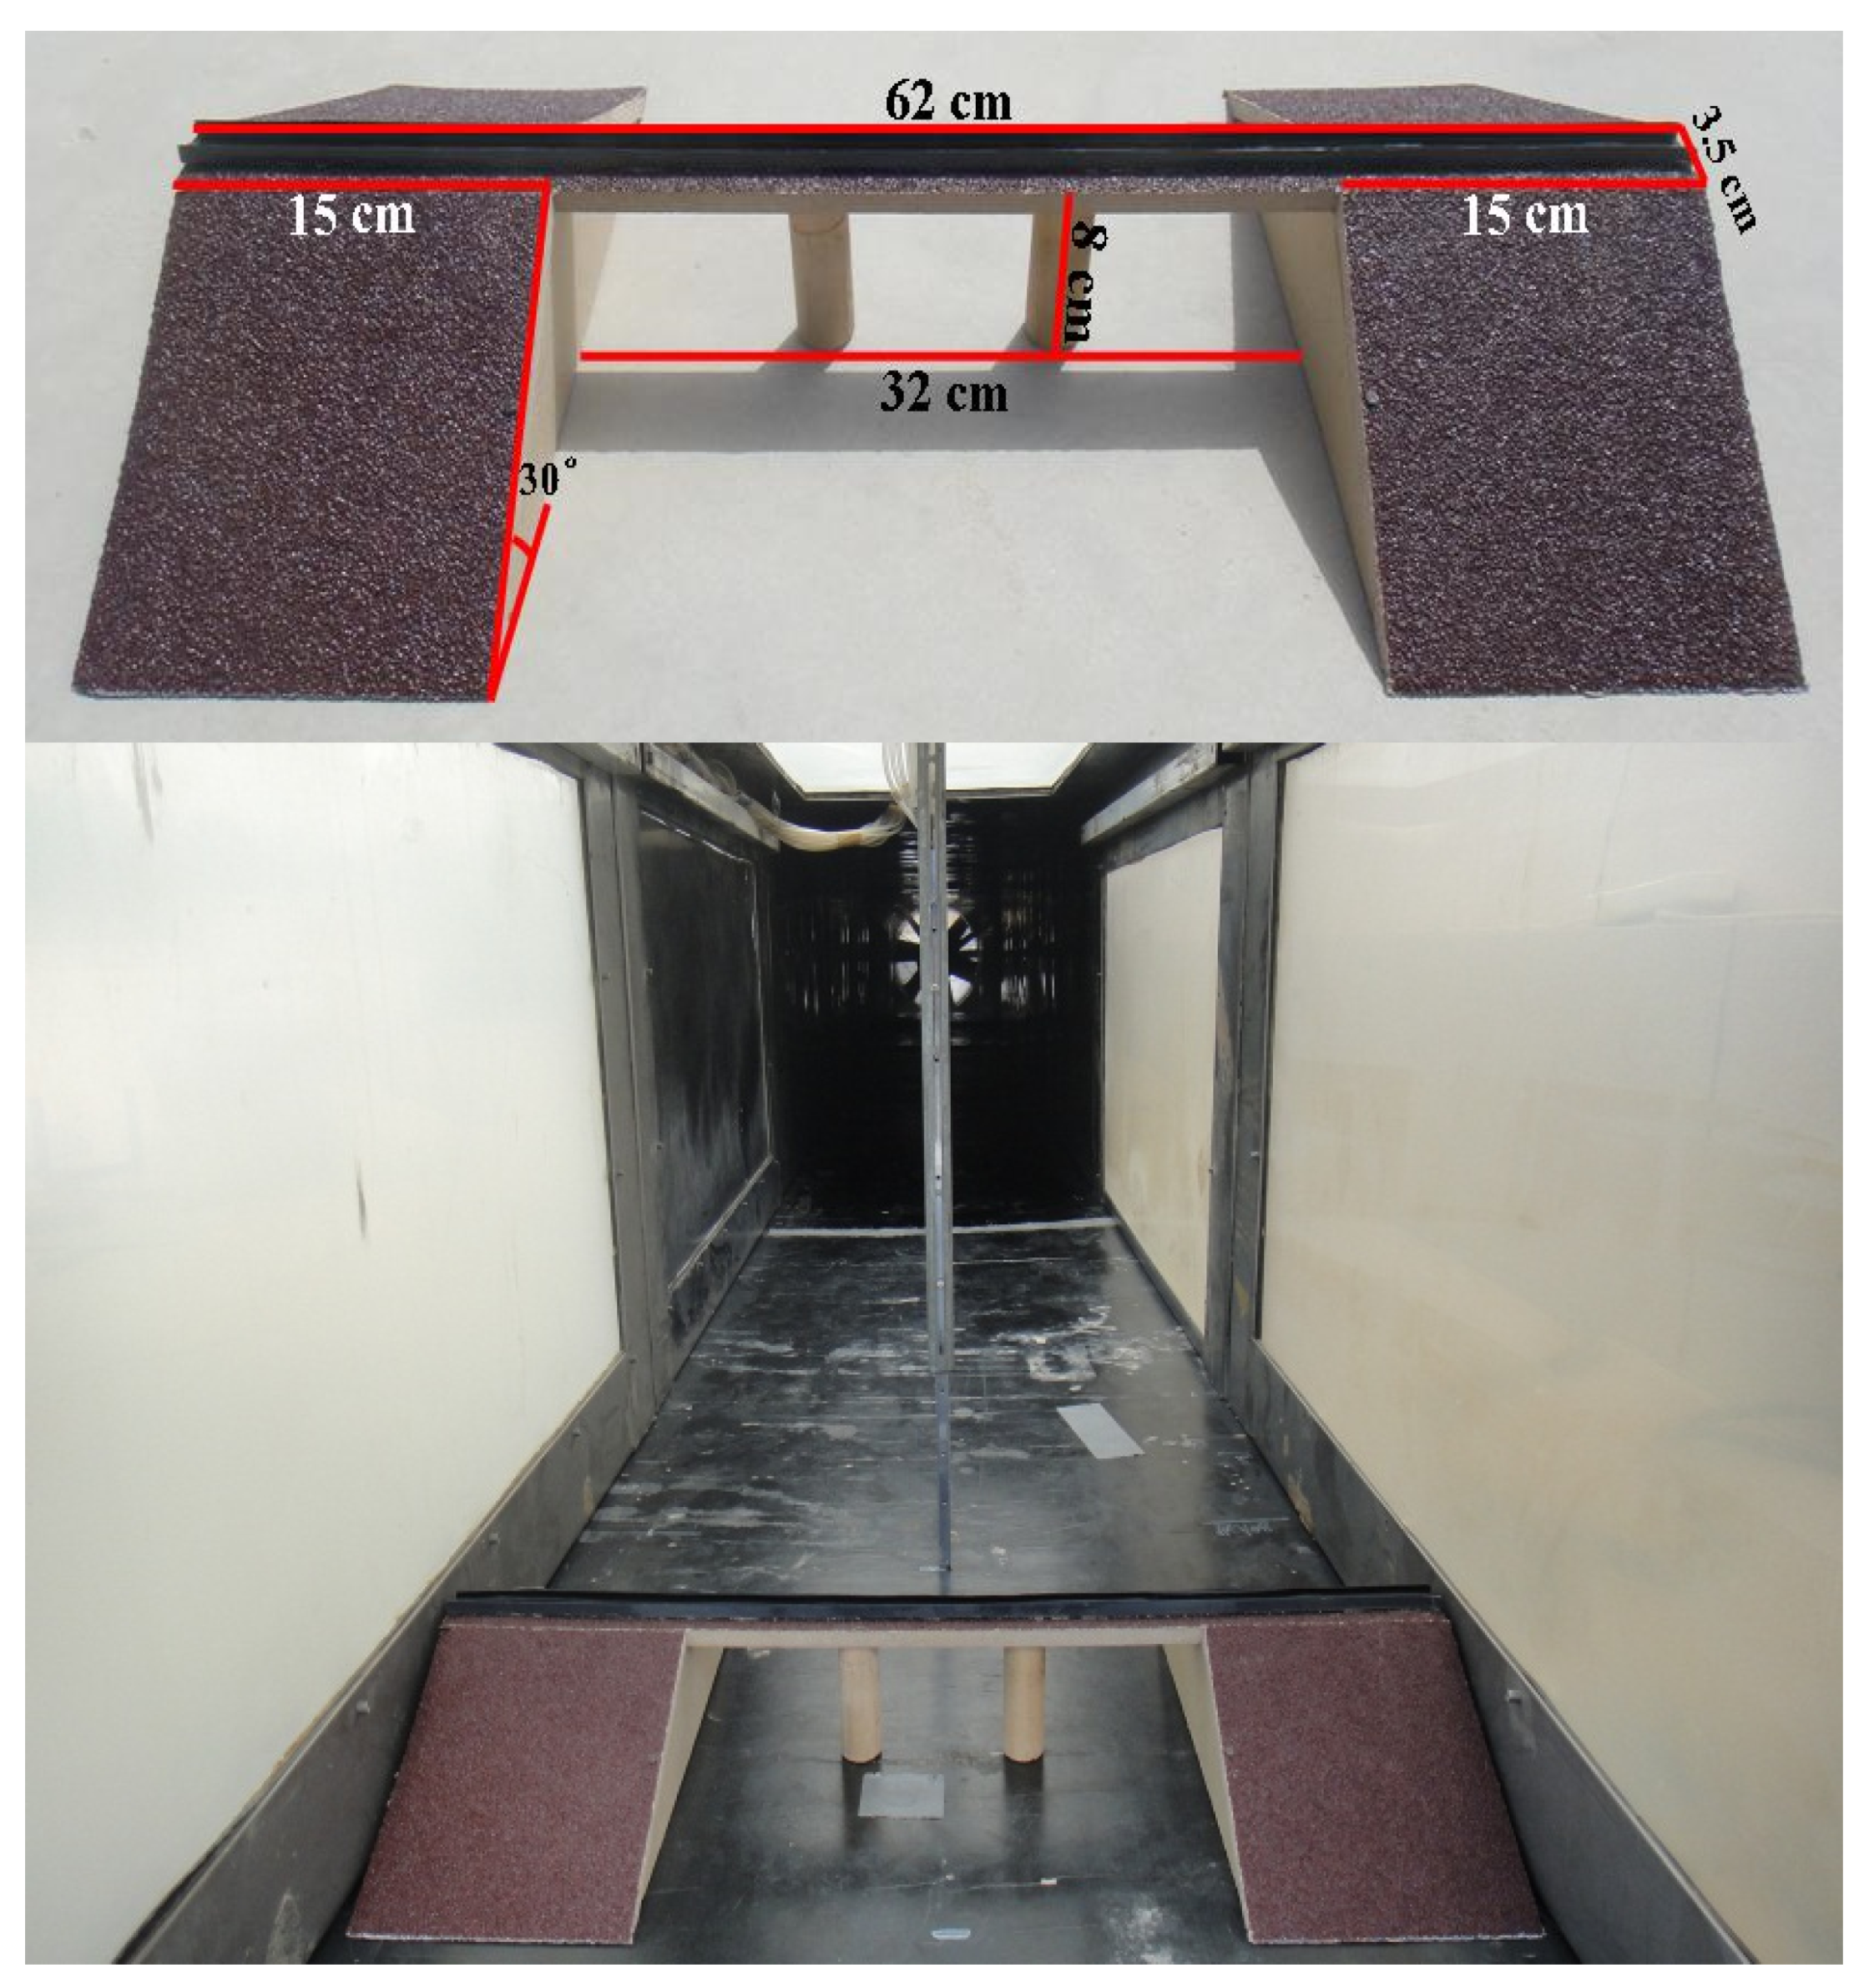
2.2. Wind Tunnel Simulation Experiment

Experiments were conducted in the wind tunnel of the Key Laboratory of Desert and Desertification, Chinese Academy of Sciences. The wind tunnel has a test section that is 6 m in length and has a 0.63 m × 0.63 m cross-section, and the boundary layer thickness is 12–15 cm. This tunnel is a direct current closed-blowing wind tunnel, and the wind speed could be continuously adjusted within the range of 0–20 m·s−1. The Lhasa–Linzhi Railway is a class I single-track heavy railway; the top and bottom widths of the subgrade are 3.5 and 31.5 m, respectively; and the slope ratio is 1:1.75 (i.e., the slope is 30°) based on the Design Specifications for Railway Subgrade (TB10001-2005, China). The bridge model of the wind tunnel experiment was in 1:100 scale (Figure 3); the height and length of the model are 8 and 62 cm, respectively.
Ten observation positions, namely, −30H, −25H, −20H, −15H, −10H, −5H, −3H, −1H, −0.5H, and −0H, were set at the upwind direction of the bridge. H represents the height of the bridge model, − indicates the upwind direction, + indicates the downwind direction, and -0H indicates the slope foot of the windward side of the bridge. Five observation positions, namely, the bottom of the slope middle of the windward side, the bottom of the slope shoulder of the windward side, the center of the bottom of the bridge, the bottom of the slope shoulder of the leeward side, and the bottom of the slope middle of the leeward side, were set beneath the bridge. Twelve observation positions, namely, 0H (representing the slope foot of the leeward side of the bridge), 0.5H, 1H, 3H, 5H, 10H, 15H, 20H, 25H, 30H, 35H, and 40H, were set at the downwind direction of the bridge (Figure 4). A pitot tube was set at the bottom center of the wind tunnel to measure the wind speed in each observation position at 10 different heights, namely, 0.6, 0.8, 1.3, 2.1, 8.3, 12.2, 16.4, 20.2, 24.2, and 28 cm. The wind speed was measured once every 2 s for 1 min (30 times) after the experimental wind speed stabilized, and the average value was taken as the result. The wind speed at the center of the entrance of the wind tunnel experimental section was taken as the experimental wind speed. Given the sand-moving wind speed of 5.0 m·s−1 in the Xierong section [18,19], the experimental wind speeds of the five groups were set to 6, 9, 12, 15, and 18 m s−1. The initial wind speed profile at the middle of the wind tunnel’s experimental section, which conforms to the logarithmic distribution law of wind speed with height (below 8.3 cm height) in nature, was measured under the five groups of experimental wind speeds without the bridge model before starting the bridge wind tunnel experiment (Figure 5). Afterward, the initial sand transport rate in the outlet of the wind tunnel experimental section was measured under the same experimental wind speeds without the bridge model (Figure 13).
Wind tunnel experiments have many requirements on similarity, such as geometric, dynamic, and kinematic similarities. However, these similarity requirements are rarely satisfied simultaneously, and some compromises must be adopted [20]. The models in this study were of 1:100 geometric scale, so attaining a strict Reynolds number scaling for dynamic similarity was impossible. Nonetheless, we attempted to generally meet the requirements of “Reynolds number independence” recommended by White for solid models [21]. Five wind velocities were investigated (i.e., 6, 9, 12, 15, and 18 m·s−1) so that the flow Reynolds numbers based on the thickness of the boundary layer (Re = Uδ/υ, where Re is the flow Reynolds number, U is the free-stream wind velocity, δ is the thickness of the boundary layer, and υ is the kinematic viscosity of air) ranged from 6.31 × 10⁴ to 1.89 × 10⁵. In addition, the Reynolds number calculated using the height of bridge model (8 cm) ranged from 3.37 × 10⁴ to 1.01 × 10⁵. Under these conditions, Reynolds number independence was essentially attained for the solid models used in this study [21,22,23].

3. Results and Analysis

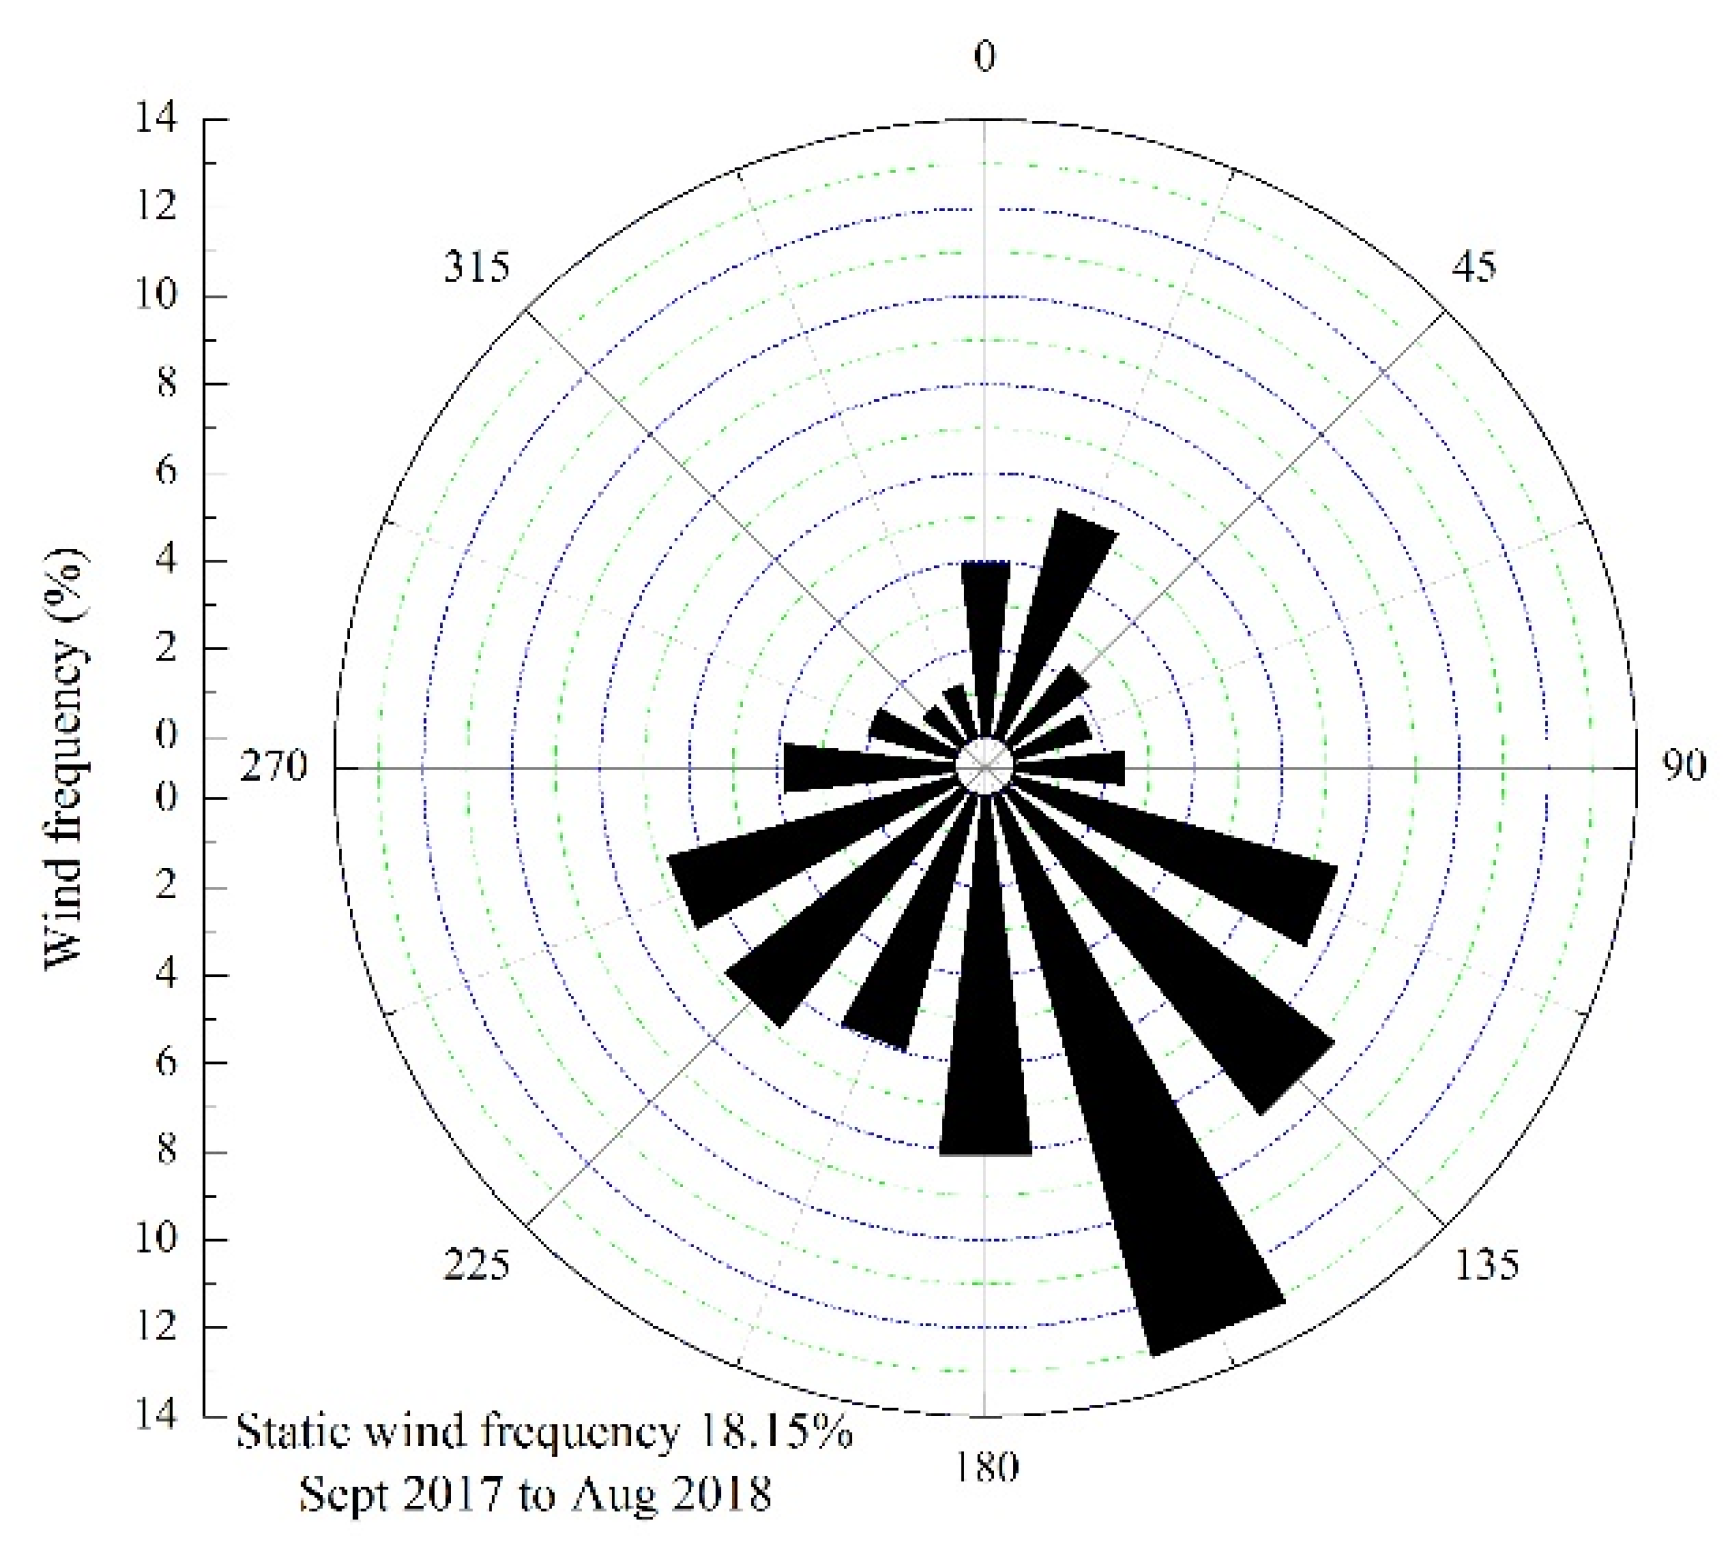
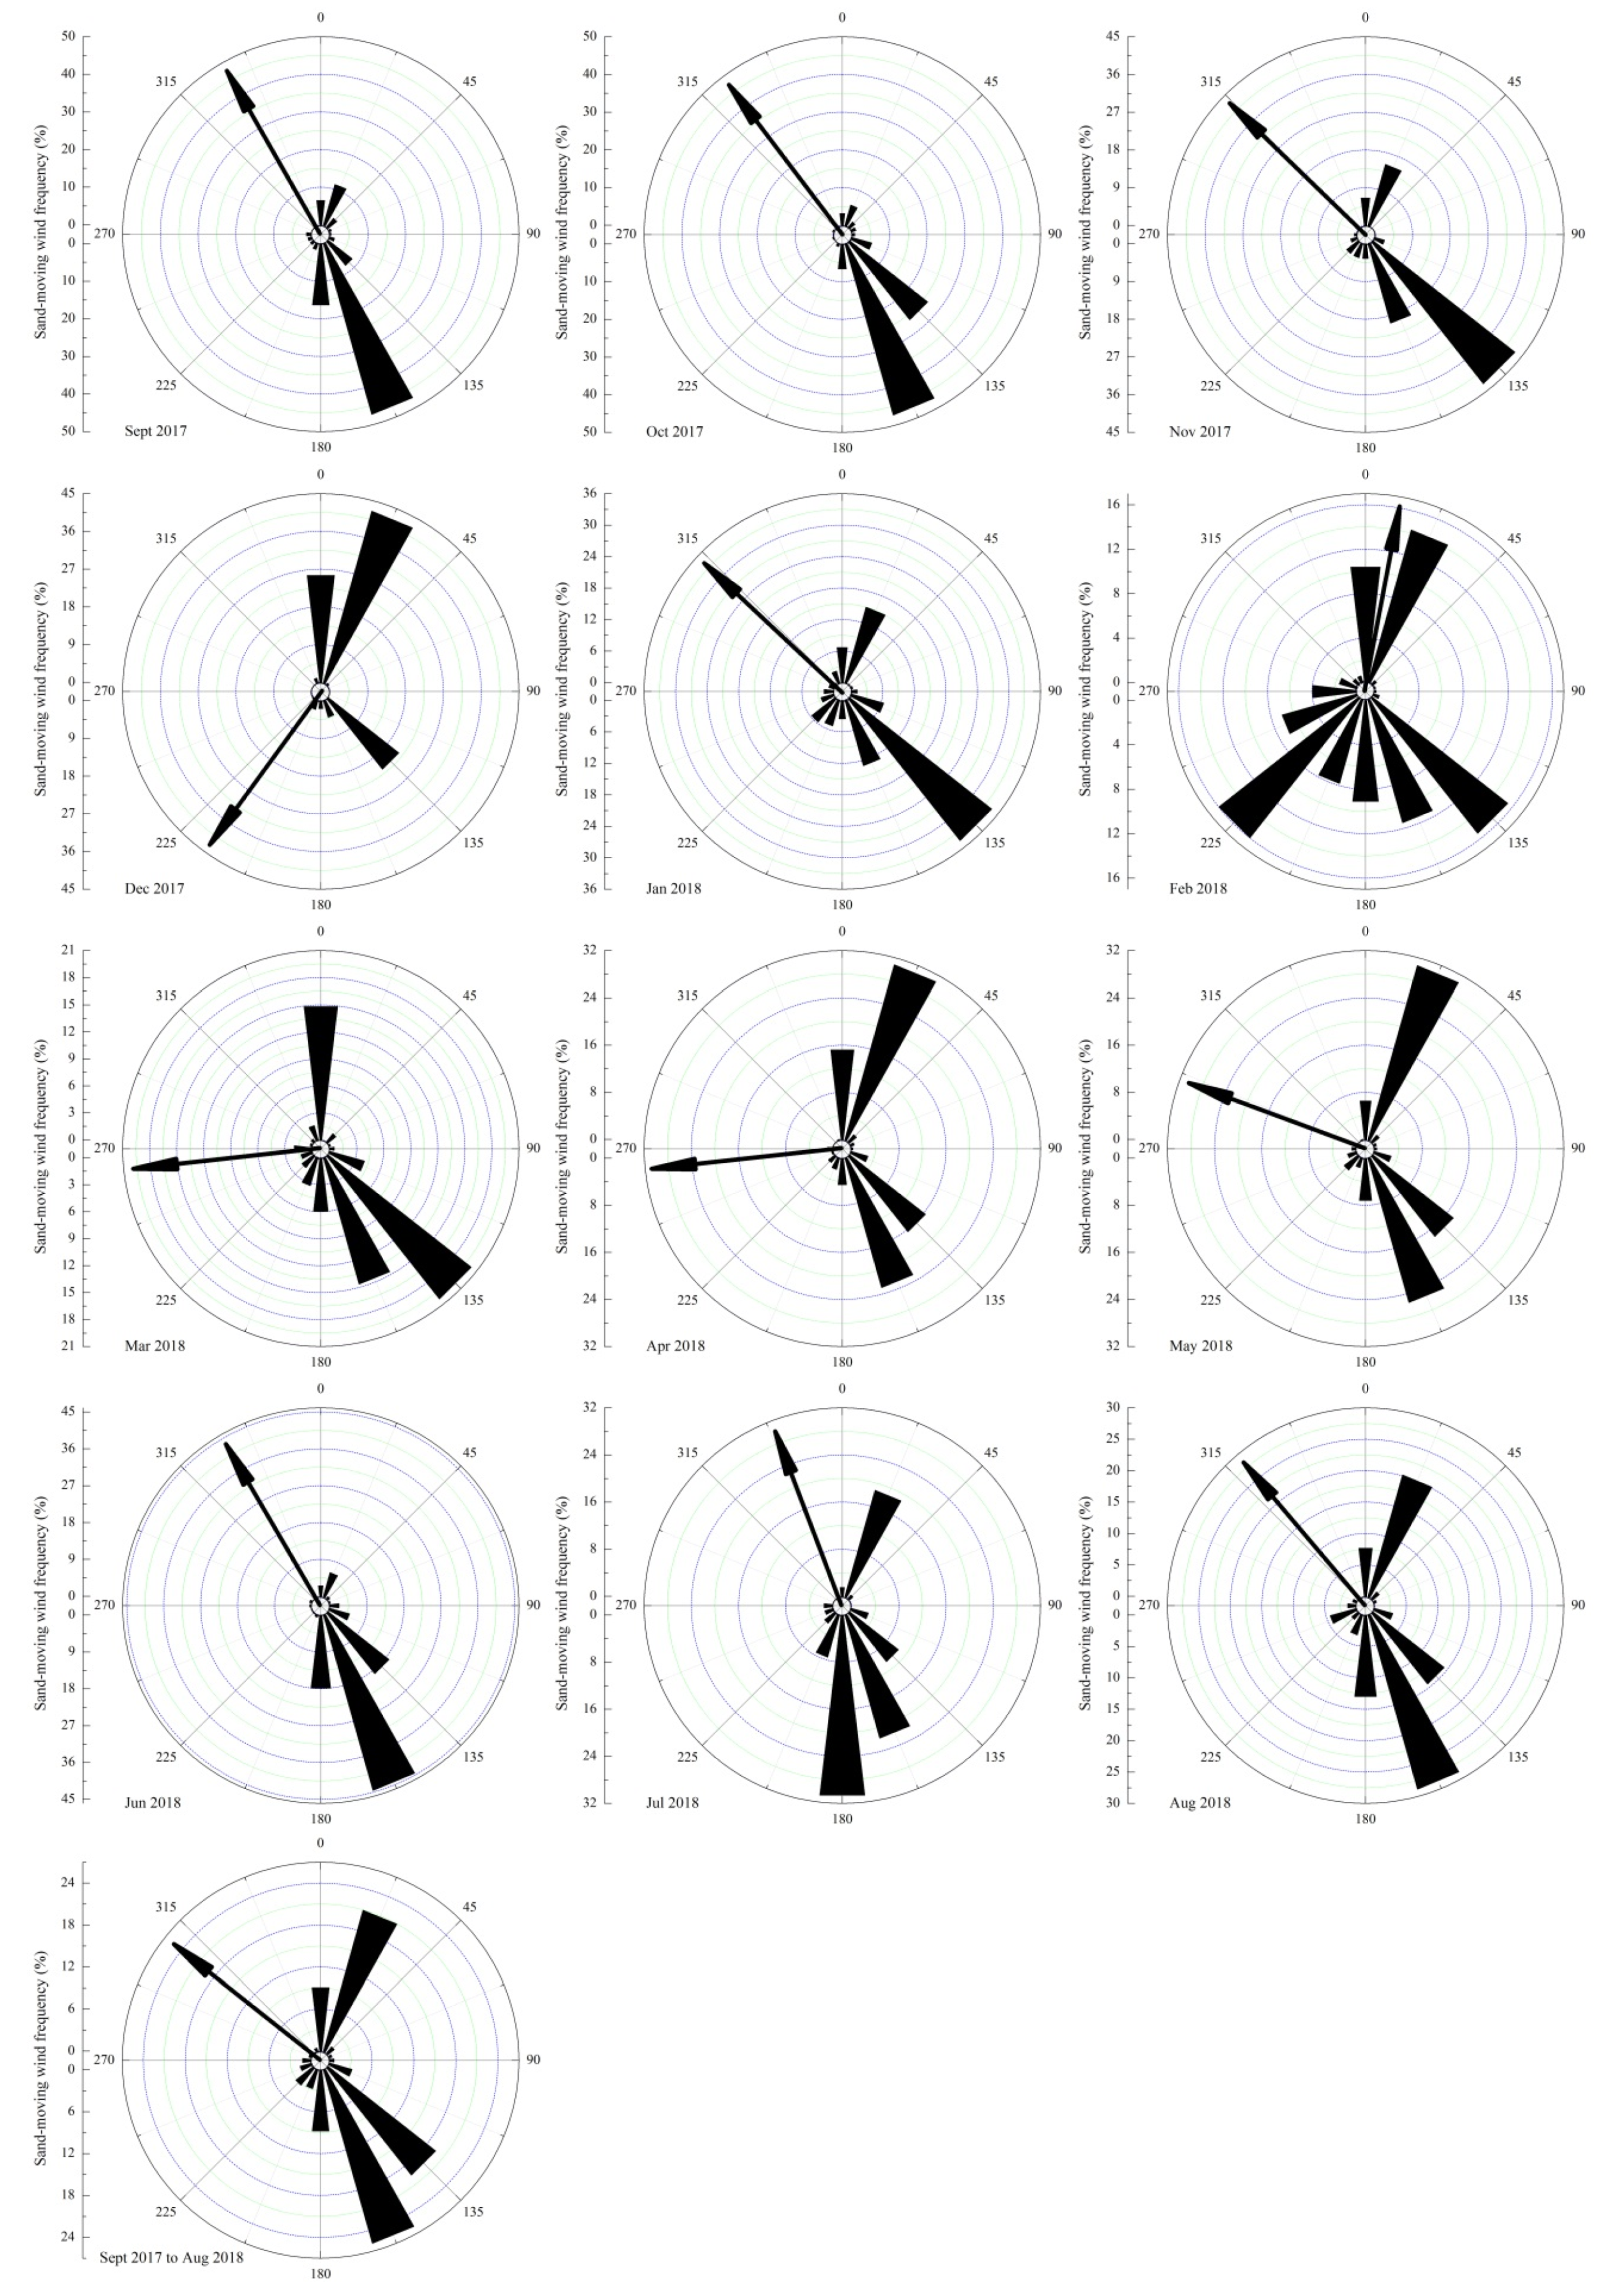
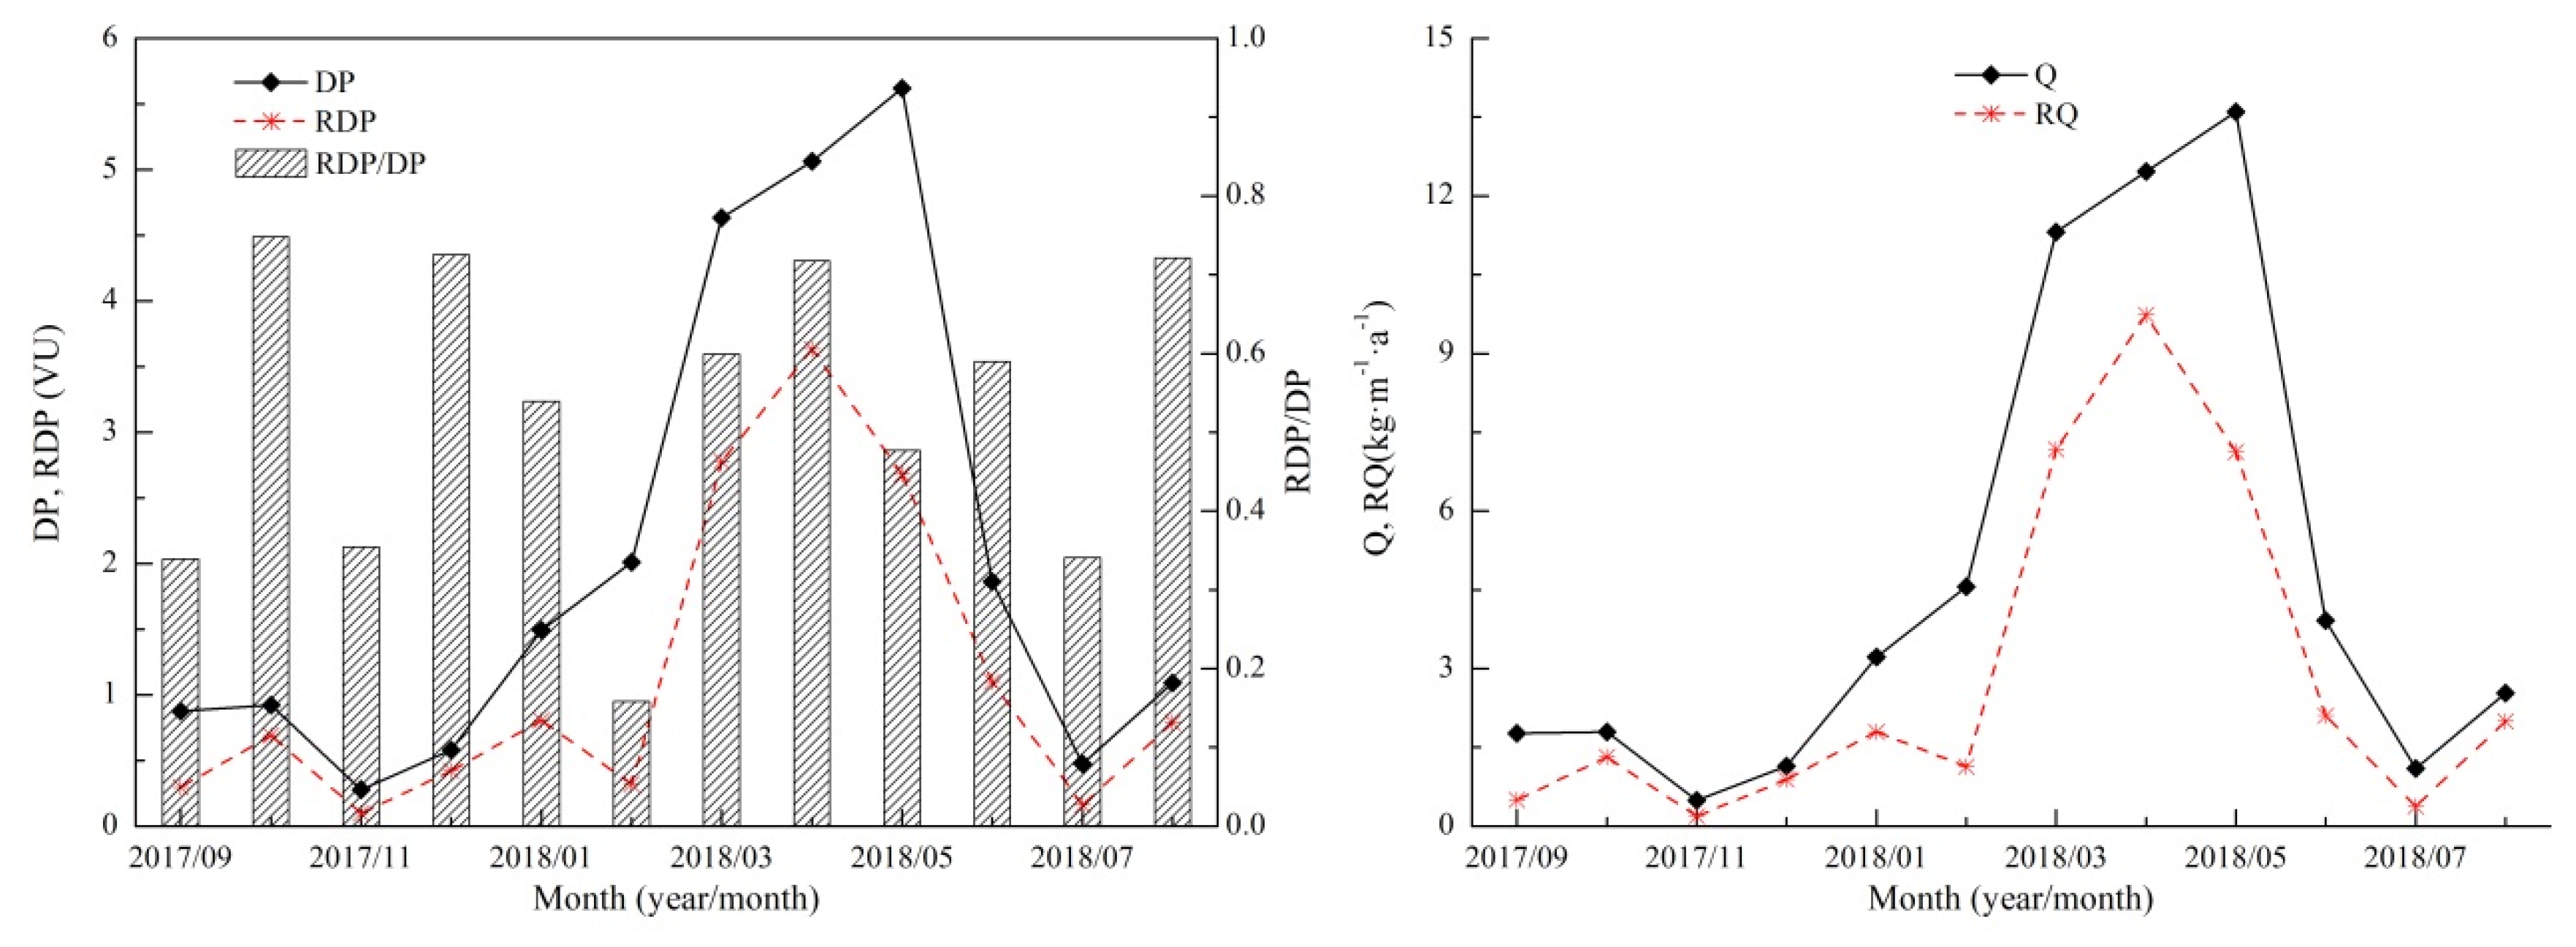
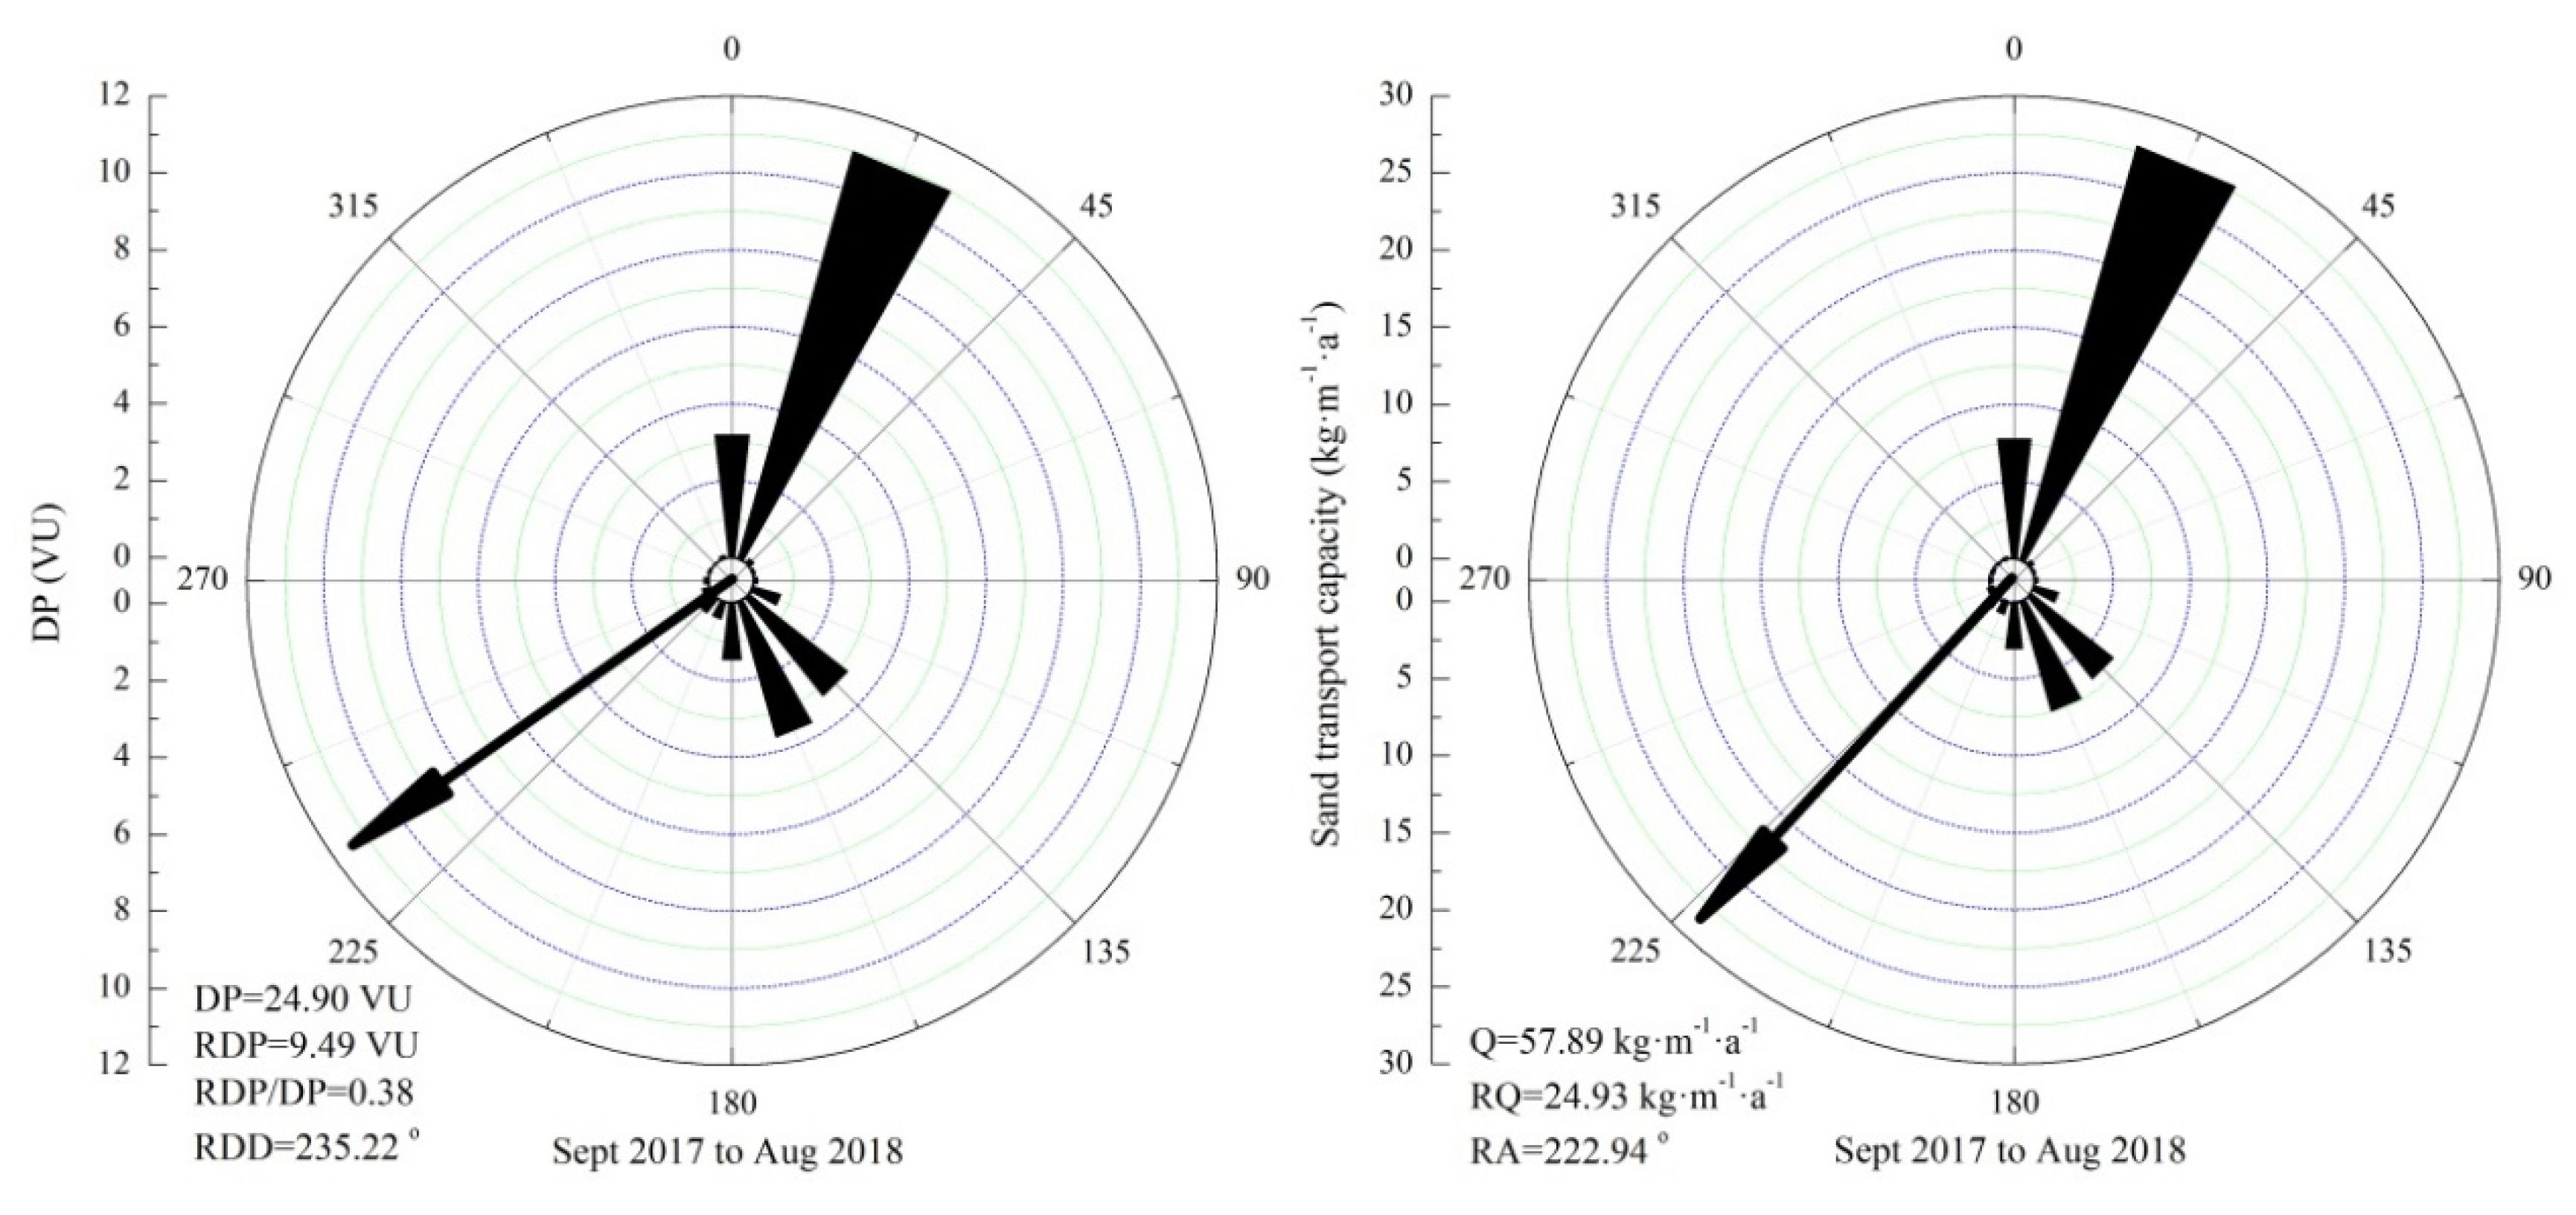
3.1. Blown Sand Dynamic Environment

The average wind speed of observation time in the Xierong section is 1.93 m·s−1, the instantaneous maximum wind speed is 24.93 m·s−1, and the 5-min average maximum wind speed is 13.60 m·s−1. The average wind speed is high in May and low in December, and the other months are between them (Figure 6). The yearly wind rose diagram of the Xierong section shows the dominance of the SSE wind direction, which accounts for 13.16% of the yearly total, and the frequency of static wind is 18.15% (Figure 7). The frequency of the yearly sand-moving wind is 6.69%, the frequency of sand-moving wind is high in May and low in December, and the other months are between them (Figure 6).
The rose diagrams of the monthly sand-moving wind in the Xierong section reveal that the SE wind direction dominates in most months of the year (including the three directions: ESE, SE, and SSE) (Figure 8). The yearly sand-moving wind is dominated by the SSE wind, which accounts for 25.91% of the yearly total, followed by the NNE wind, which accounts for 20.97% of the yearly total, and the SE wind takes the third place, accounting for 19.61% of the yearly total. The yearly synthetic direction of the sand-moving wind is 128.05°, which indicates the SE direction (Figure 8).
According to the DP and Q calculation results, the DP, RDP, Q, and RQ in the Xierong section are relatively high during spring (March to May) and low during the other seasons (Figure 9). The resultant sand transport direction (RDD, RA) is dispersed (Table 2).
The yearly DP of the Xierong section is 24.90 VU, the yearly RDP is 9.49 VU, the yearly direction variability index (RDP/DP) is 0.38, and the yearly RDD is 235.22°, which indicates the SW direction (Figure 10). The yearly Q is 57.89 kg·m−1·a−1. The wind speed range with the maximum contribution is distributed between 7 and 8 m·s−1 (Table 3). The yearly RQ is 24.93 kg·m−1·a−1, and the yearly RA is 222.94°, which suggests a SW direction (Figure 10).

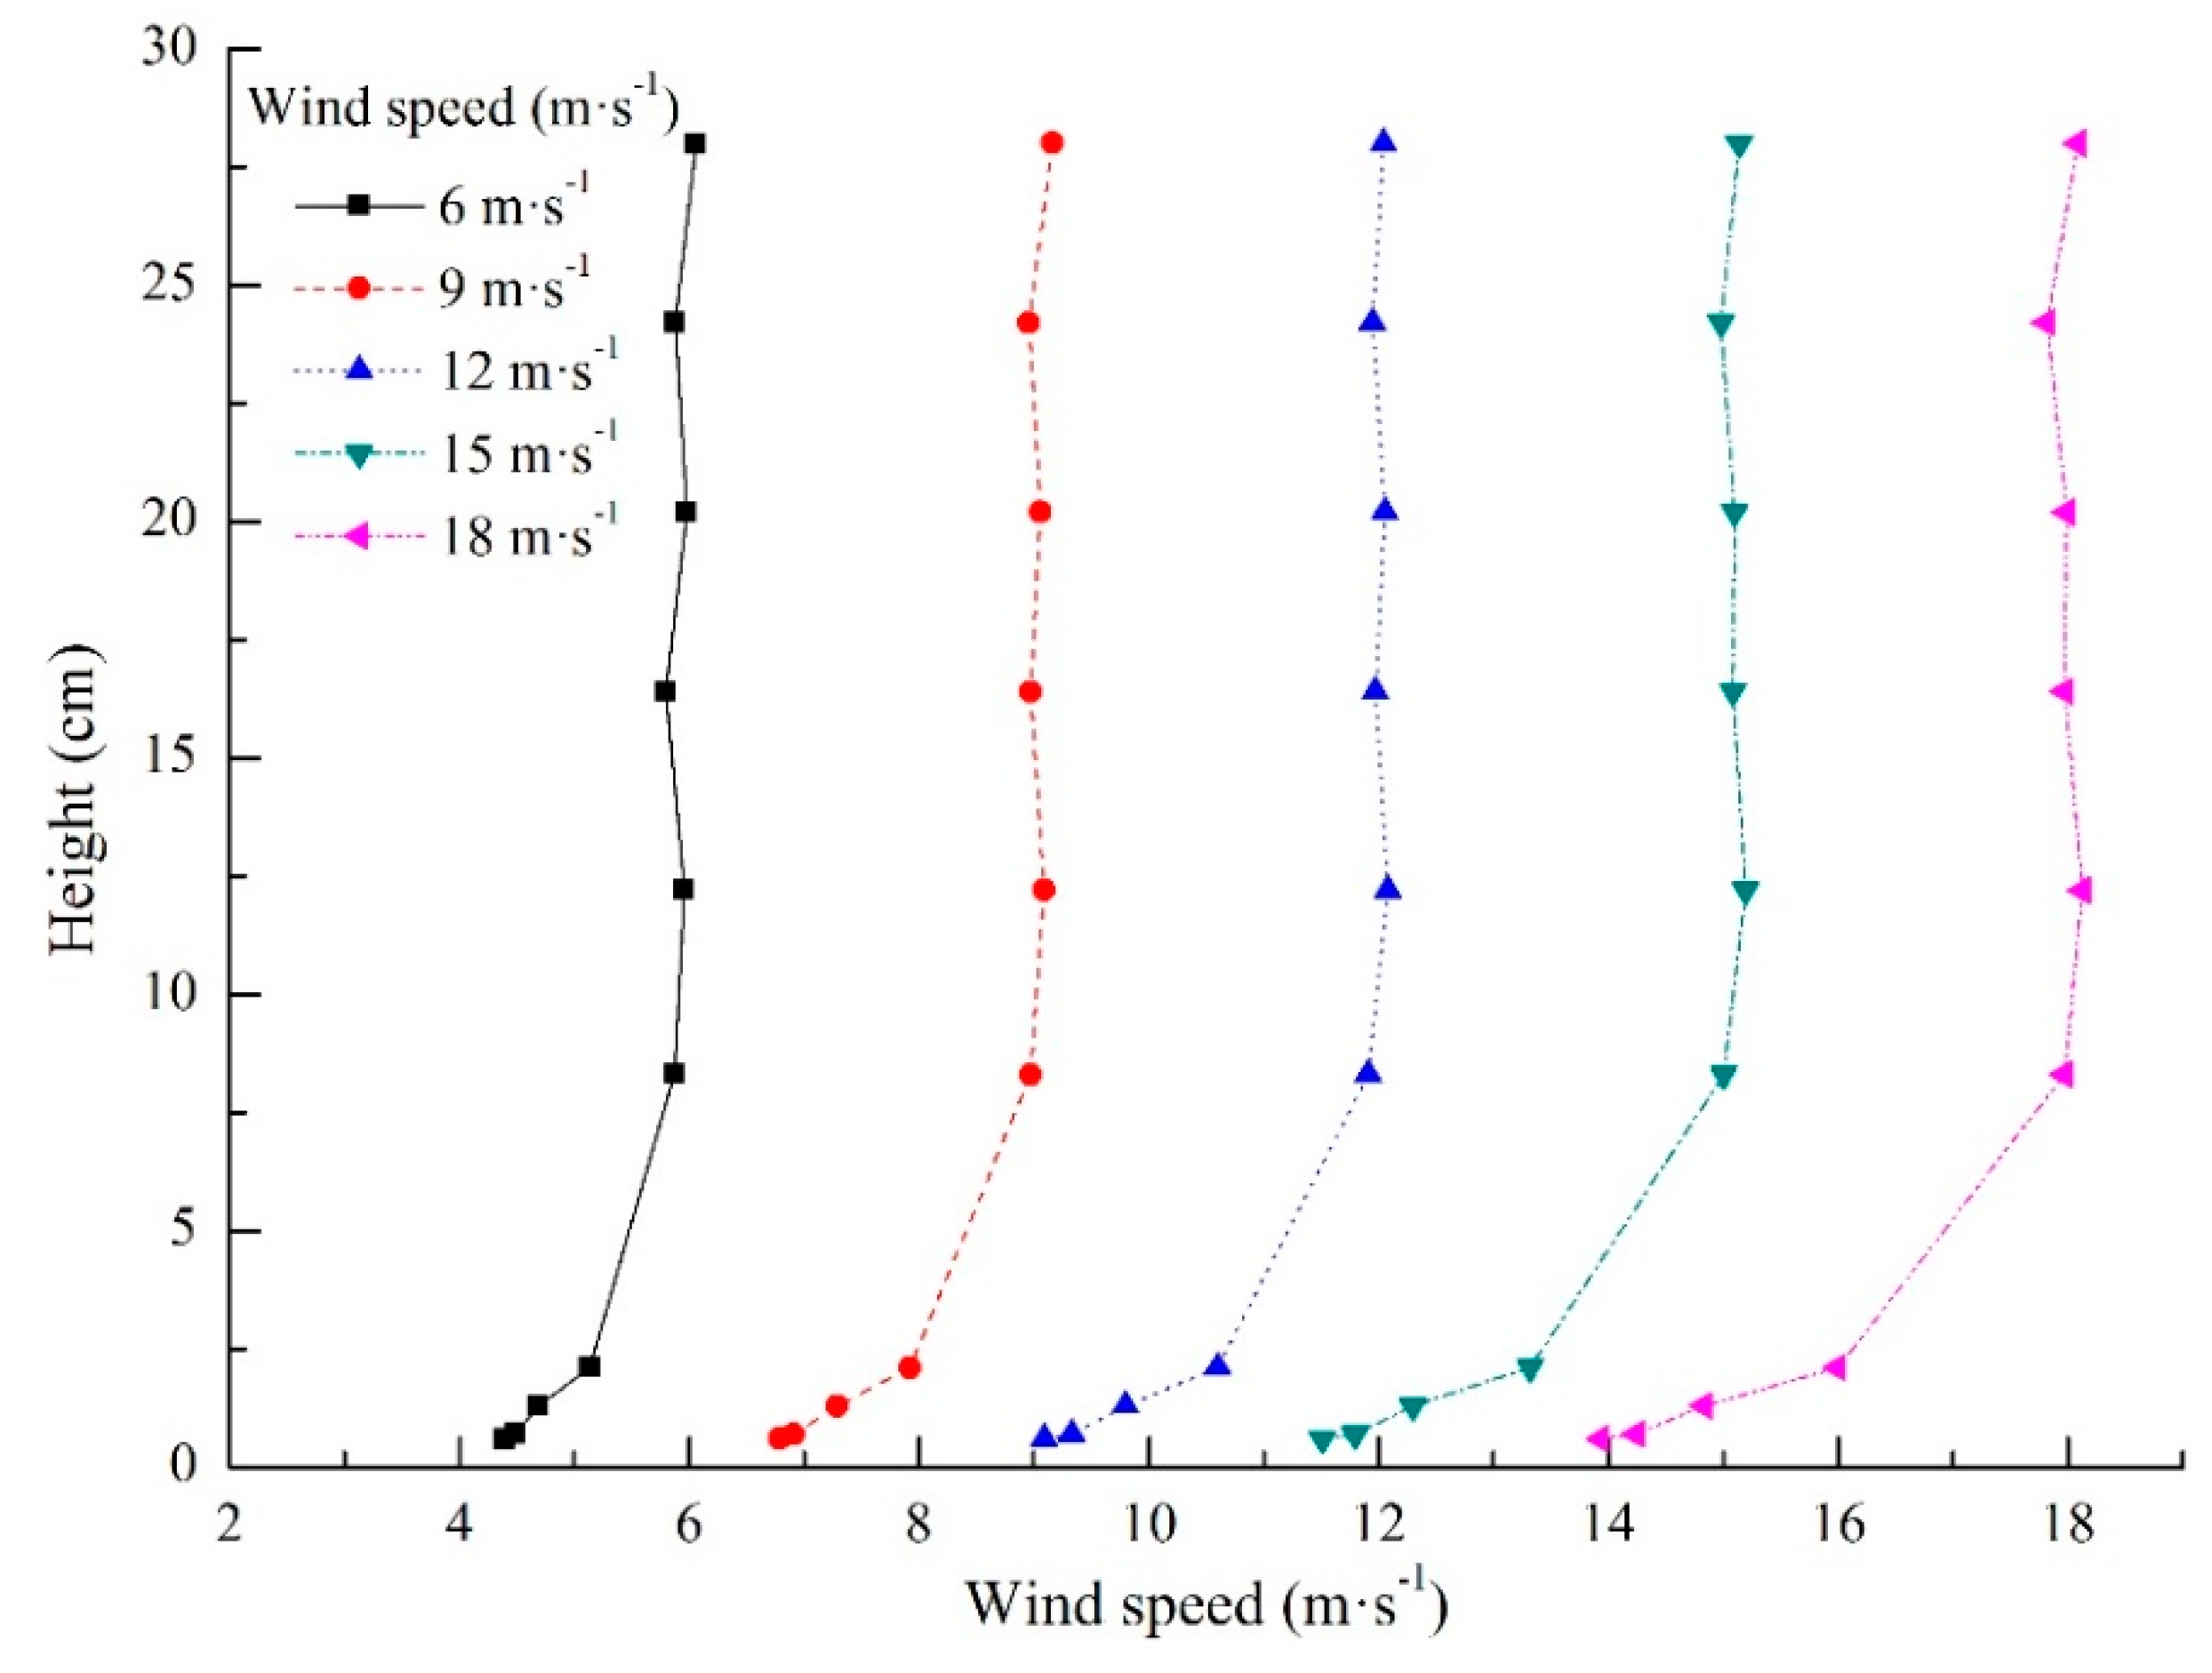
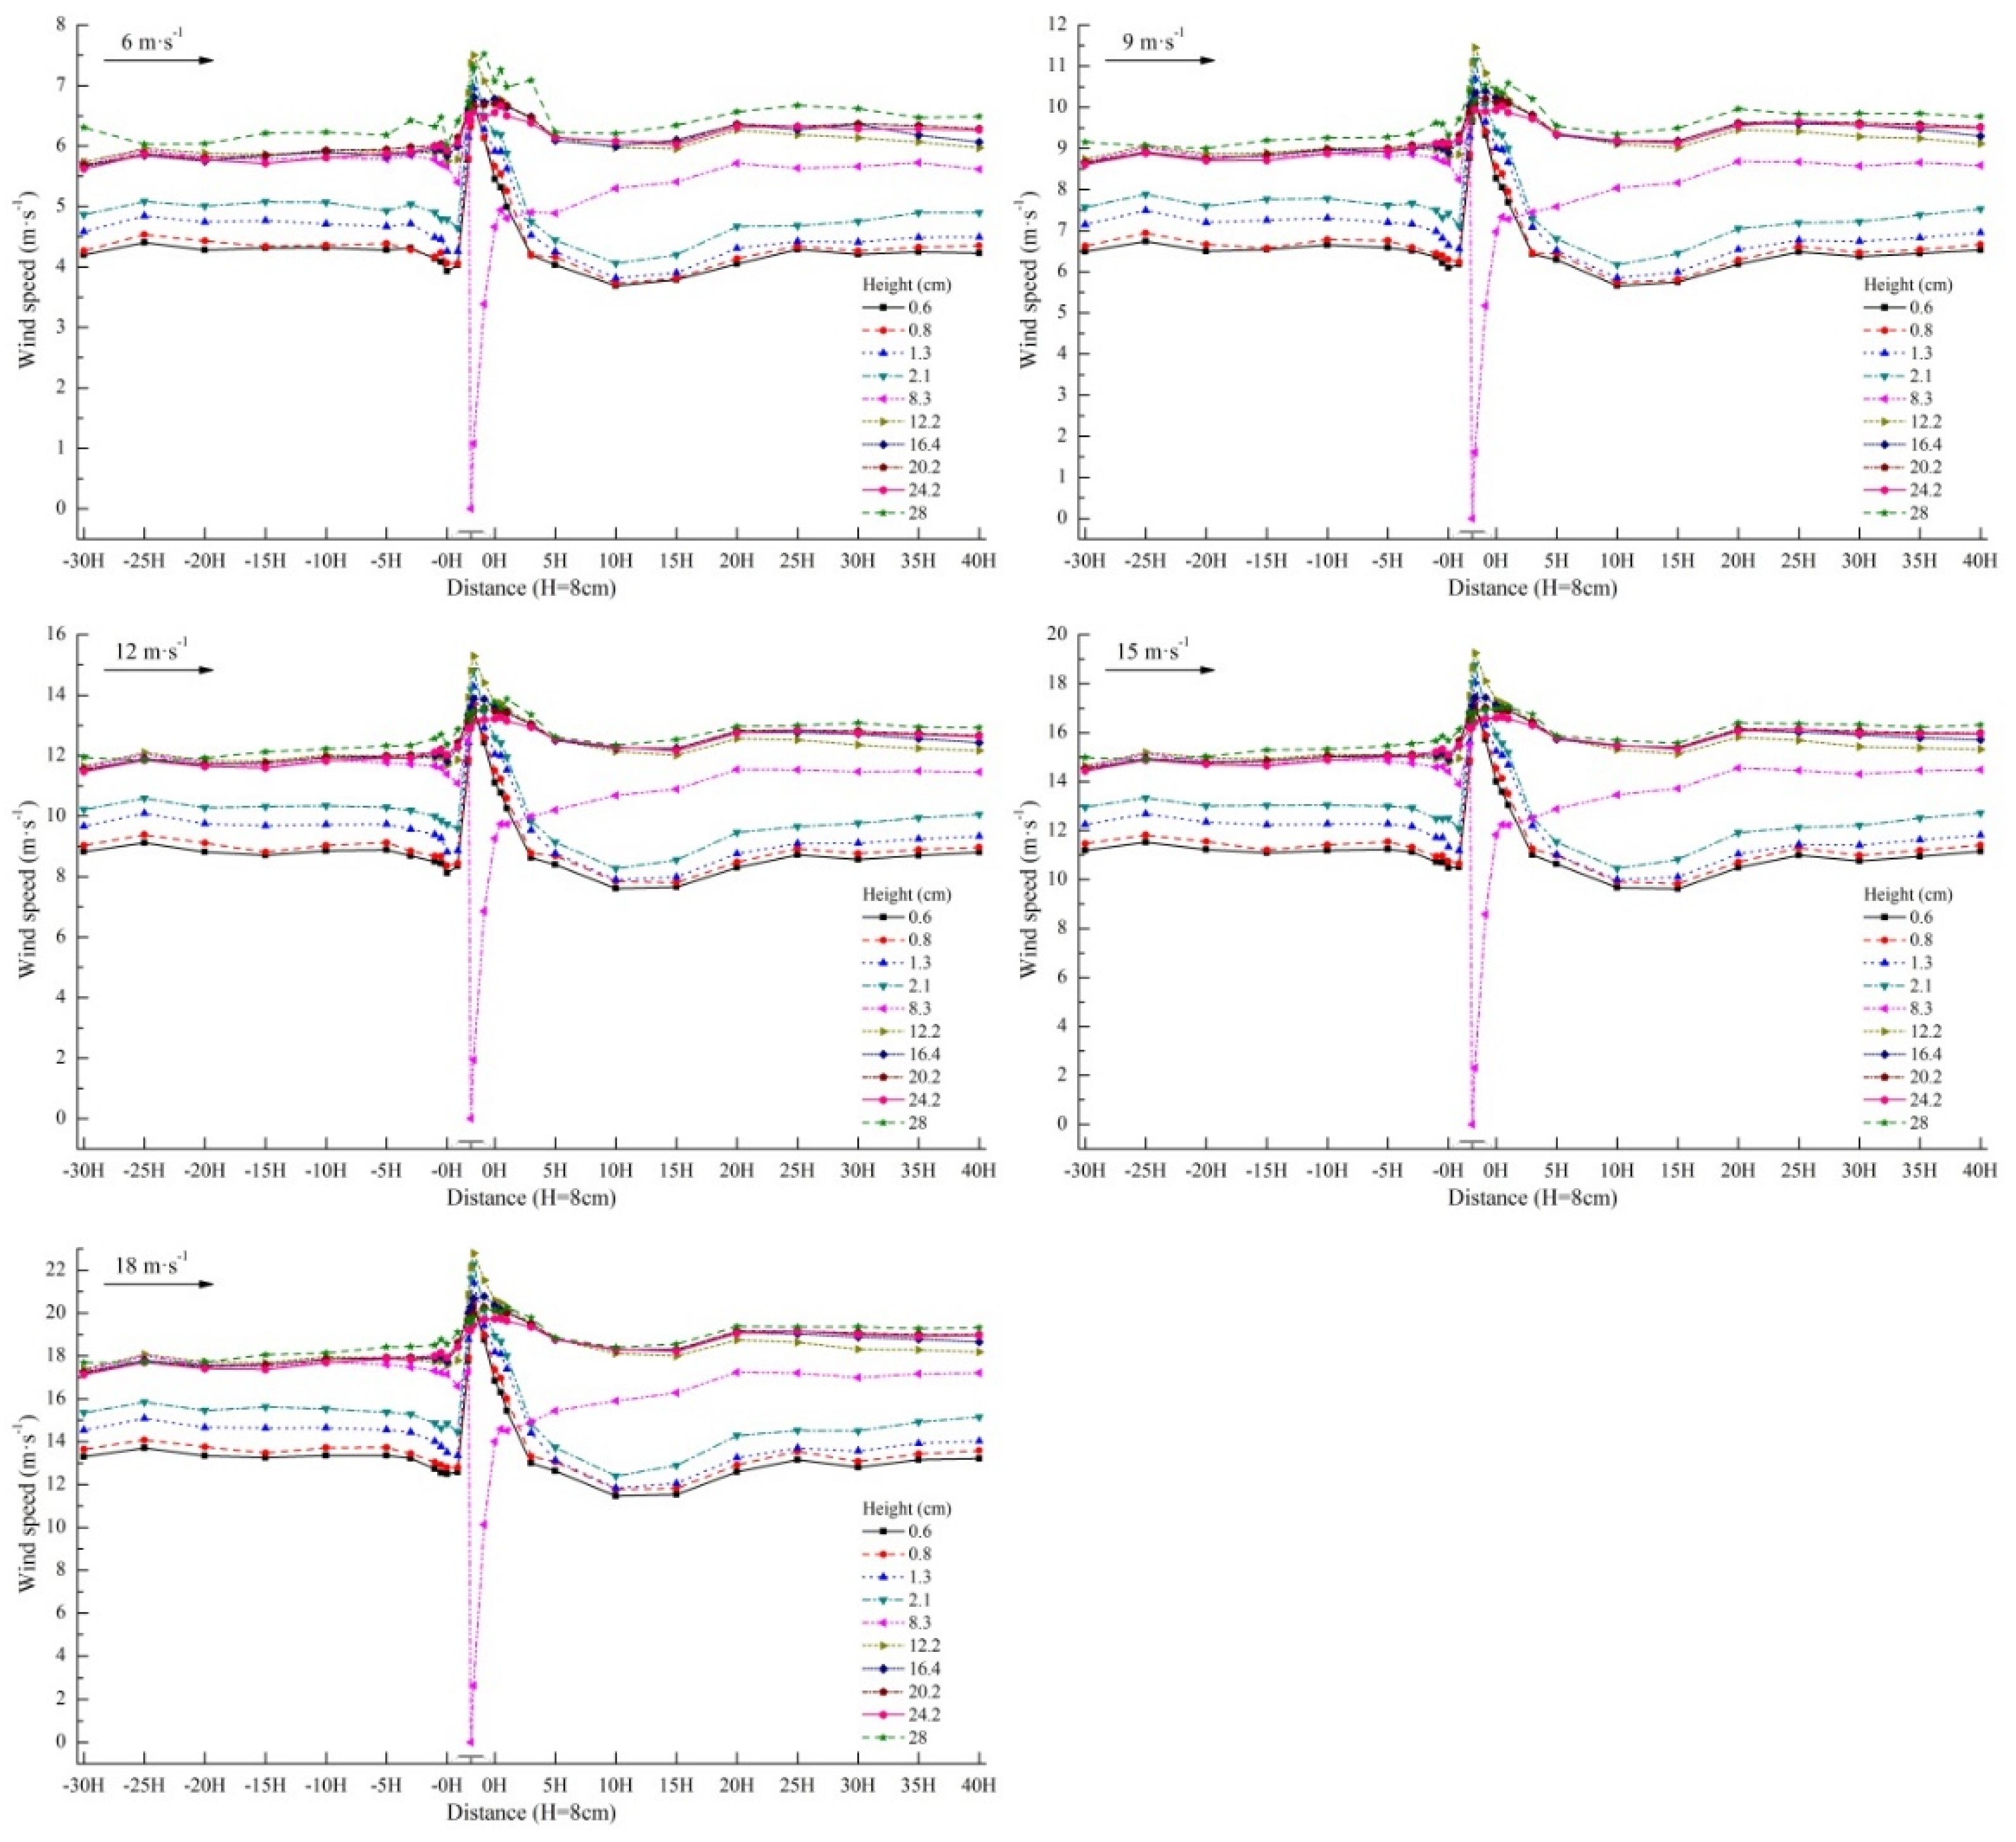
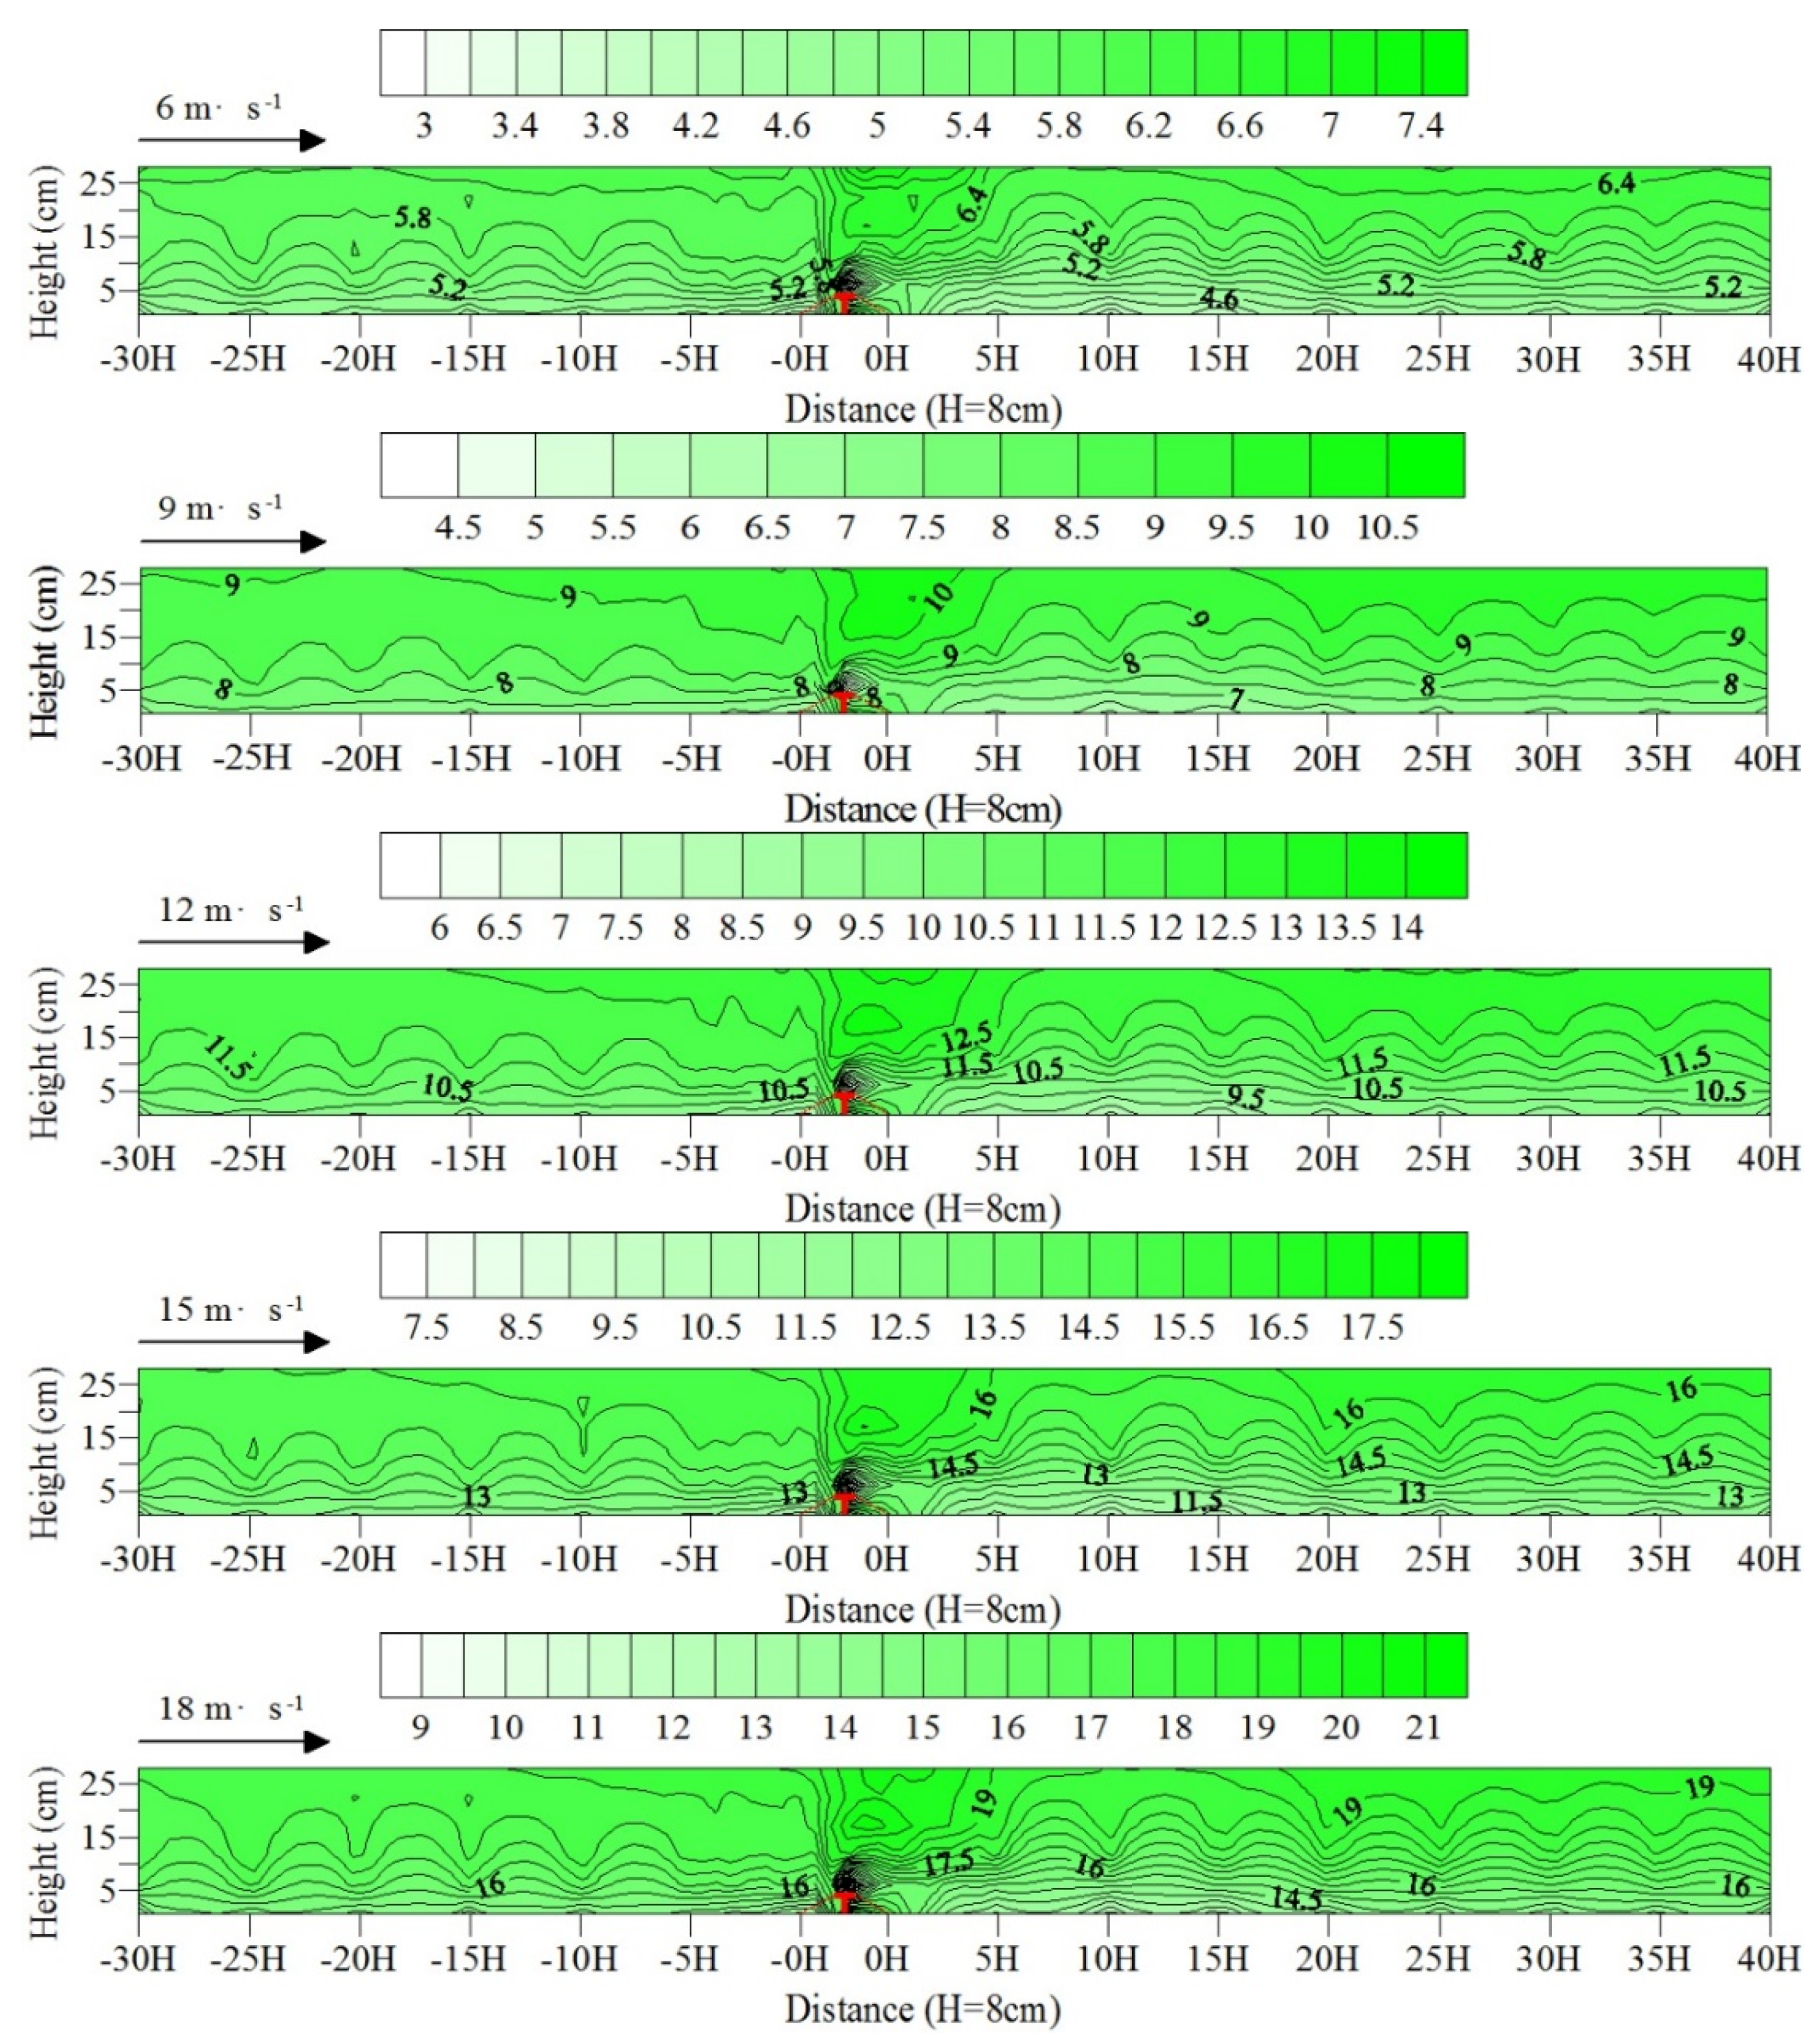
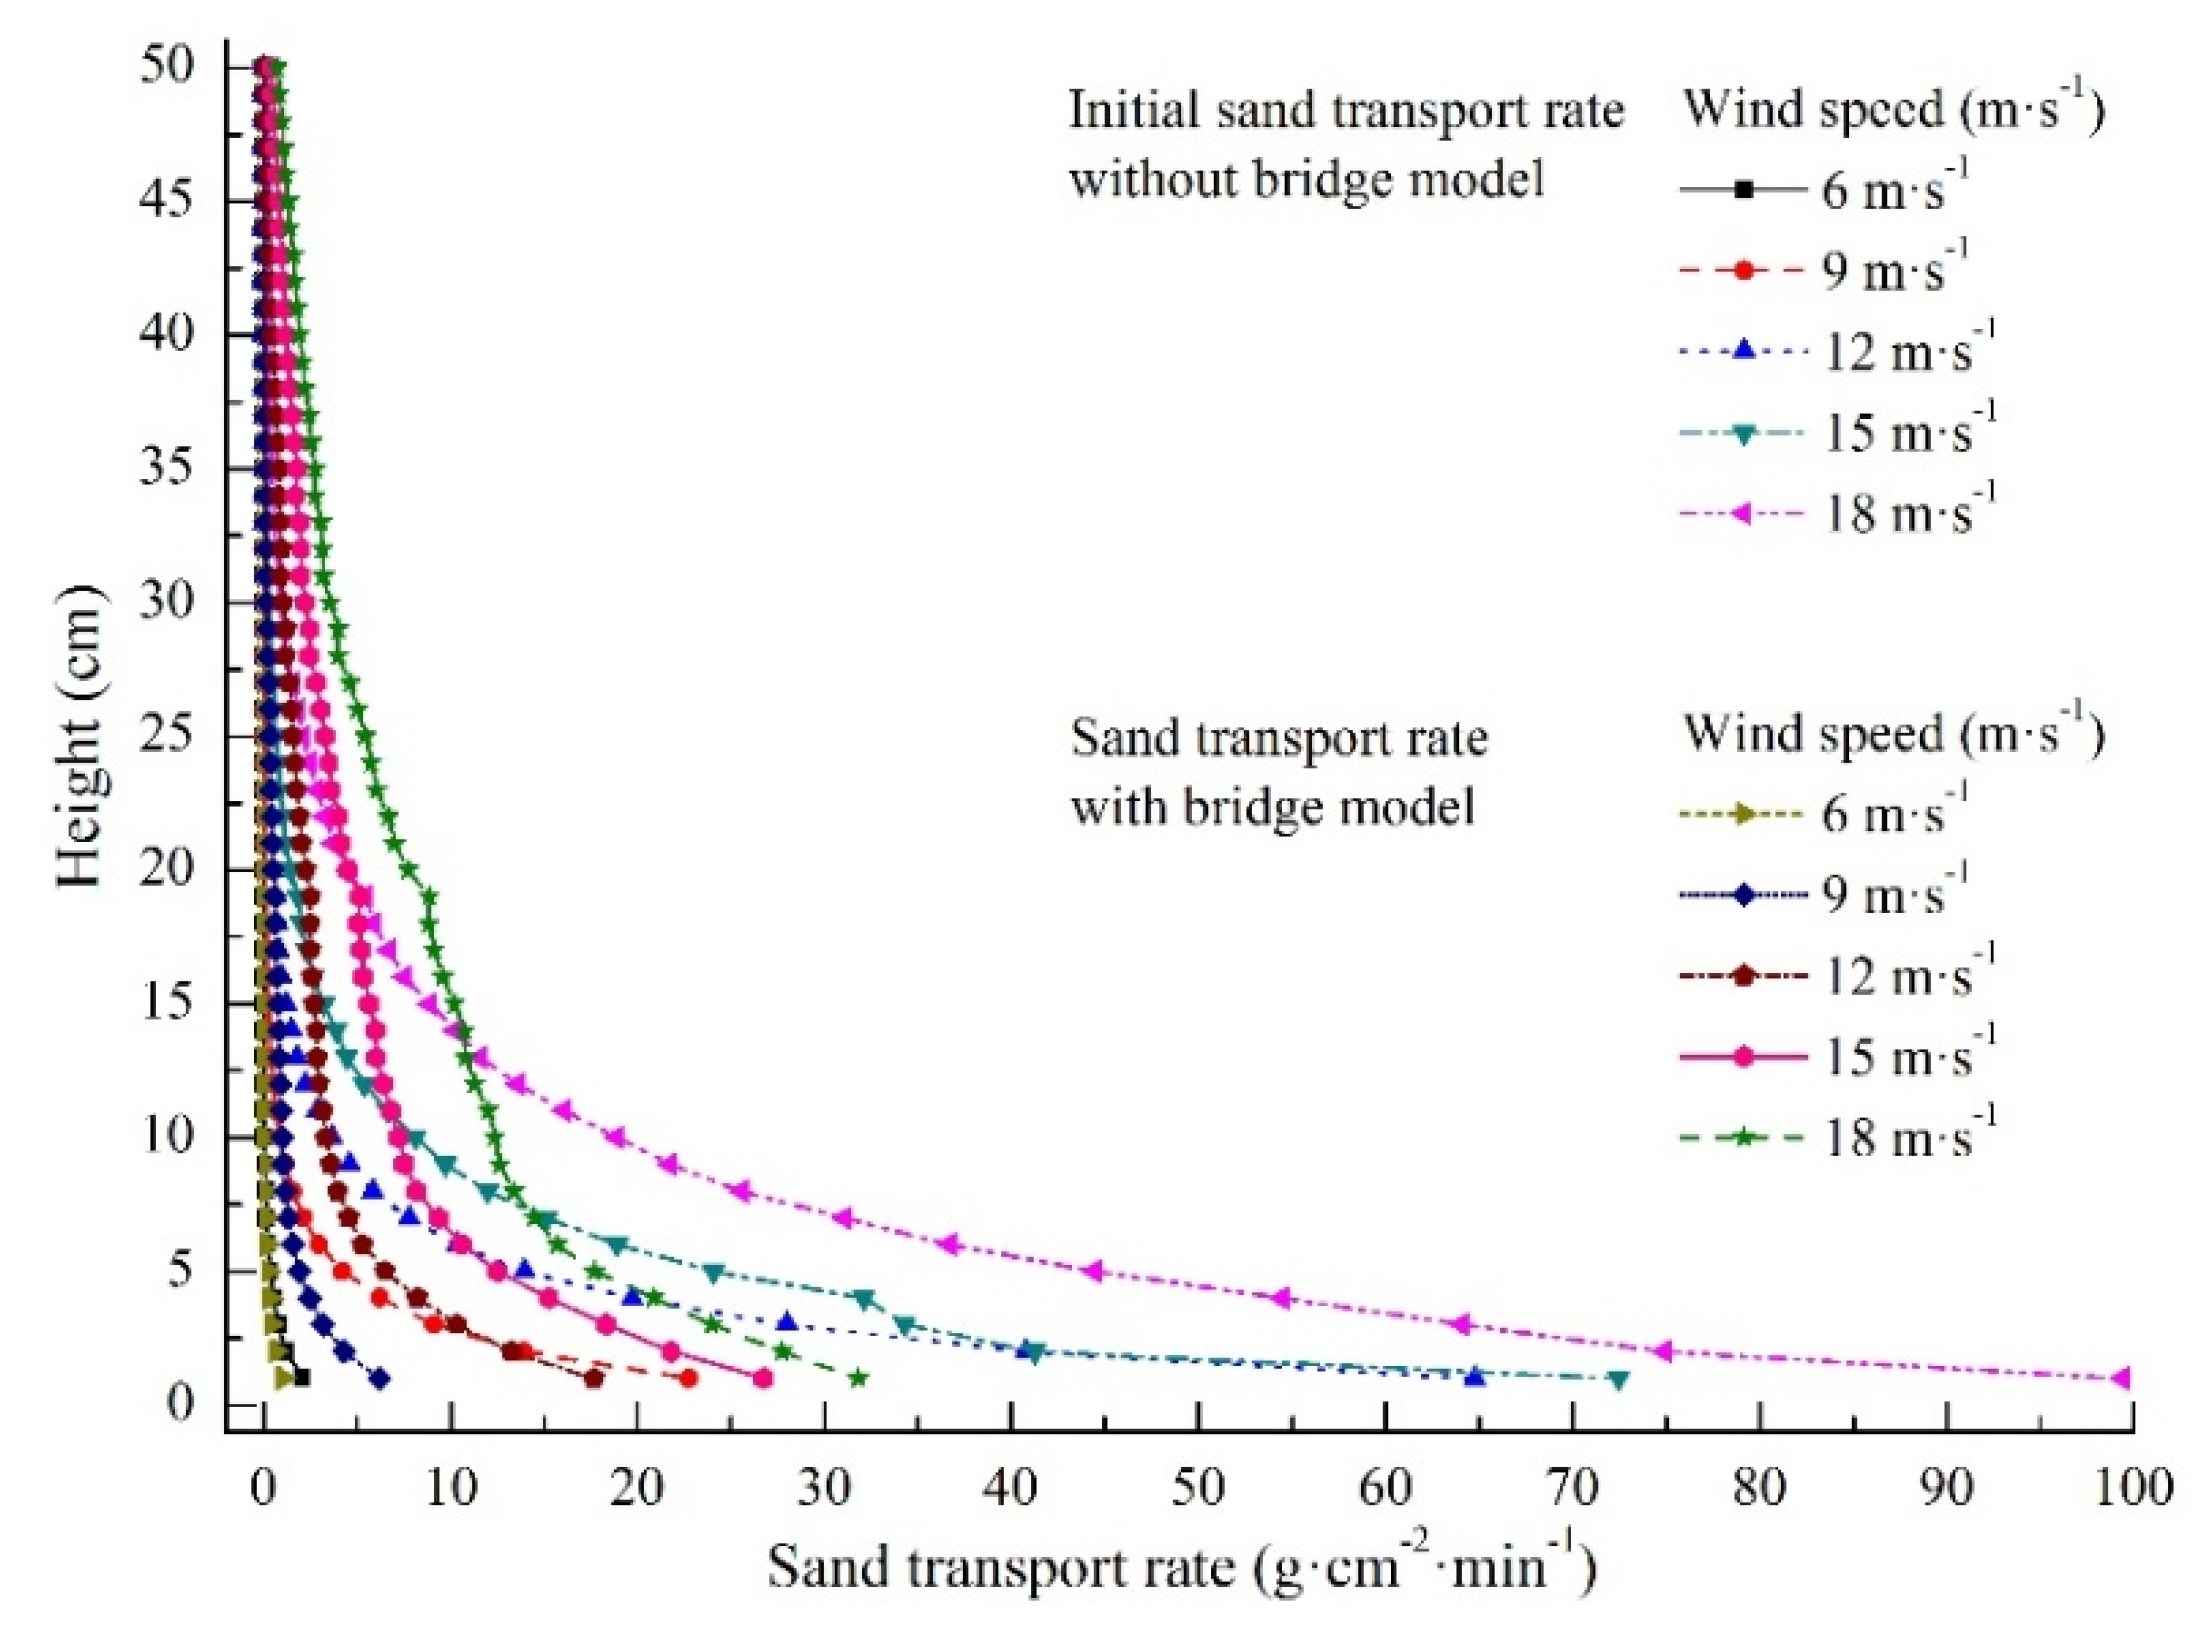
3.2. Influence of Railway Bridge on Wind Speed and Flow Field

According to the aforementioned wind tunnel experiment layout, the wind speeds of each observation position are shown in Figure 11. Taking the fifth height of 8.3 cm as the boundary, when the height is lower than 8.3 cm, the near-surface wind speed (i.e., wind speed at a height of less than 8.3 cm) significantly decreases from the -3H distance at the upwind direction of the bridge to the minimum upwind direction between the -0H (the slope foot of the windward side of the bridge) and the bottom of the slope middle of the windward side of the bridge. The near-surface wind speed rapidly increases after entering the bridge and reaches its maximum at the bottom of the slope shoulder of the leeward side of the bridge. After exiting the bridge, the near-surface wind speed drops quickly and drops to the lowest value at the 10H distance away from the downwind direction. The wind speed then slowly increases and is restored at the 25H distance away from the downwind direction of the bridge. When the height exceeds 8.3 cm, the wind speed at a height of greater than 8.3 cm significantly increases between the top of the slope shoulder of the windward side of the bridge and the downwind direction of 3H, slightly decreases from the downwind direction of 3H to 20H, and basically recovers after 20H distance away from the downwind direction of the bridge. In addition, the variation amplitude of the near-surface wind speed (at a height of less than 8.3 cm) is higher than that of the wind speed at a height greater than 8.3 cm.
When the height of the wind speed observation point is 8.3 cm, the wind speed varies dramatically because it is situated on the surface of the bridge pavement (the height of the bridge model is 8 cm). The wind speed is at its maximum at the slope shoulder of the windward side of the bridge and suddenly drops to the minimum (0 m·s−1) at the center of the bridge pavement. The wind speed at the slope shoulder of the leeward side of the bridge is also very low (near 0 m·s−1). The wind speed rapidly increases after passing through the bridge to the downwind direction of 0H (the slope foot of the leeward side of the bridge), slowly increases from the downwind direction of 0H to 20H, and basically recovers after 20H distance away from the downwind direction of the bridge.
The diagram of the wind flow field of the bridge and its upwind and downwind directions (Figure 12) indicates a significant increase in the wind speed area between the top of the slope shoulder of the windward side of the bridge and the downwind direction of 3H. Significantly weakened wind speed areas exist within the distance of -3H at the upwind direction of the bridge and from the downwind direction of 3H to 20H of the bridge. The latter weakened area shows a greater reduction in wind speed scope and degree than the former, indicating that the influence of the bridge on wind speed at the downwind direction is more significant than that at the upwind direction.

4. Discussion

The wind tunnel simulation experiment has many similarity requirements, and meeting all the similar conditions in the simulation process is difficult [24]. In this wind tunnel experiment, the bridge model was placed within the boundary layer of the wind tunnel test section, and the pitot tube was set at the bottom center of the wind tunnel test section. The measured initial wind speed profile is consistent with the natural distribution law. These conditions meet the requirements of the model blown sand environment experiments conducted within the wind tunnel and are consistent with the experiment arrangement of the wind tunnel simulation in most relevant investigations [25,26]. Generally, the greater the angle between the railway line and the resultant wind direction is, the more serious the blown sand hazards will be [27,28]. Given that this wind tunnel simulation experiment is mainly used to demonstrate the formation mechanism of bridge blown sand damage, the angle between the bridge model and the wind direction is set to 90° to make the problem clearer and highlight the damage of blown sand to the bridge model. Most of the relevant investigations are also set in this manner [29,30,31]. The route trend of the Xierong section is roughly toward the north–south direction (Figure 1). The dominant wind direction is SSE, and the resultant sand transport direction (RDD, RA) is SW. The angle between the railway trend (refers to the direction in which the railway line is present) and the dominant wind direction is approximately 60°, and the angle between the railway trend and the resultant sand transport direction is 30°–45°. A difference exists between the dominant wind and resultant sand transport directions, mainly because of the higher speed of the NNE wind. Although the proportion of the NNE wind is not the highest among the sand-moving wind directions (only ranking second, accounting for 20.97% of the yearly total), it plays a leading role in sand transport. Meanwhile, the proportion of SSE wind is the highest (25.91%), but it does not play a leading role in sand transport. These results can be confirmed by the direction variability index (RDP/DP). The direction variability index (RDP/DP) of the Xierong section is 0.38. According to the classification standards of the direction variability index [32], the direction variability index (RDP/DP) of this section belongs to the intermediate ratio (0.3–0.8) and the near low ratio (≤0.3), thereby suggesting a relatively dispersed wind direction. At least two blown sands of the NNE and SSE directions transport to the bridge of this section, further aggravating the blown sand hazards. In addition to the wind speed and direction, the actual sand transport capacity is also affected by environmental conditions, especially those closely related to the local conditions of sand sources. When the blown sand flow moves near the railway, its structure form and energy distribution vary because of the influence of the bridge, which is consistent with relevant research results [33,34,35,36]. Meanwhile, the bridge will also affect the process of transportation, accumulation, and erosion of blown sand flow near the ground surface, thereby accumulating sand materials in the weakened wind speed areas within the distance of -3H at the upwind direction of the bridge and from the downwind direction of 3H to 20H of the bridge. Consequently, blown sand erosion occurs in the increased wind speed area between the top of the slope shoulder of the windward side of the bridge and the downwind direction of 3H, thereby resulting in blown sand hazards. In particular, the sand source of this section is located in the east side of the railway, the flow field structure of blown sand flow and its transportation and accumulation conditions change because of the bridge, and the sand accumulation in the east side of the bridge is serious. The results of this bridge wind tunnel simulation experiment indicate that most of the sand materials accumulate in the east side of the bridge because the wind speed starts to decrease at the -3H distance away from the upwind direction of the bridge, and only a few accumulate in the west side through the bridge bottom. Under the bridge, the wind speed increases because of the “narrow pipe effect,” and most of the surface will not accumulate sand. However, the flow field of blown sand flow is adjusted by the terrain variation, and the sand material through the bridge bottom decreases with the thickening of sand accumulation in the east side of the bridge. When the thickness of sand accumulation in the east side exceeds the height of the bottom of the bridge, the sand material will jump onto the bridge abutment and deposit on the track bed, threatening railway safety. In addition, according to the experiment results of the wind tunnel simulation, the higher the bridge is, the weaker the influence on the blown sand movement will be. The bridge has no influence on the blown sand movement when the headroom reaches a certain height. Therefore, the bridge height can be increased to avoid the blown sand hazards in similar sandy regions, such as the South Tibet Alpine Valley, the Qinghai–Tibet Engineering Corridor, and the Hexi Corridor, which also has an important significance to the survey, design, and construction of traffic line projects in these similar sandy regions.
In addition, the measurement results of the sand transport rate of this wind tunnel experiment indicate that the initial sand transport rates measured under the five groups of experimental wind speed without the bridge model are 5.76, 68.37, 215.80, 311.52, and 588.25 g·cm−2·min−1, while the sand transport rates measured with the bridge model are 4.17, 36.40, 129.38, 250.25, and 381.13 g·cm−2·min−1. The latter measurements are obviously lower than the former measurements (Figure 13), indicating that the passing rate of blown sand flow decreased after the bridge appeared, and the transport of blown sand is partially blocked by the bridge, thereby leading to the accumulation of sand materials near the bridge.

5. Conclusions

The sand-moving wind direction is dominated by the SSE wind in the Xierong section. The wind speed, the frequency of sand-moving wind, the DP, the RDP, the Q, and the RQ are relatively high during spring (March to May) and low during other seasons. The yearly DP, RDP, Q and RQ are 24.90 VU, 9.49 VU, 57.89 kg·m−1·a−1, and 24.93 kg·m−1·a−1, respectively. The yearly resultant sand transport direction (RDD, RA) is SW.
The angle between the route trend in the Xierong section and the sand transportation direction is 30°–45°, and the sand source is located in the east side of the railway. During spring (March to May), sand materials are blown up by the wind, forming blown sand flow and movement from the NE to SW direction. The near-surface wind speed, the flow field of blown sand flow and its transportation, and the accumulation conditions are altered because of the bridge. Increased wind speed area is formed between the top of the slope shoulder of the windward side of the bridge and the downwind direction of 3H, causing blown sand erosion. Meanwhile, weakened wind speed areas are formed within the distance of -3H at the upwind direction and from the downwind direction of 3H to 20H of the bridge. These areas accumulate sand materials at the upwind and downwind directions of the bridge, thereby resulting in blown sand hazards.

Author Contributions

S.X. designed the study and wrote the manuscript, J.Q. analyzed the data and reviewed the manuscript, Q.H. and Y.P. participated in the experiment. All authors discussed the results and contributed to the manuscript. All authors have read and agreed to the published version of the manuscript.

Funding

This research project was funded by the National Natural Science Foundation of China (grant no. 41877530), the Youth Innovation Promotion Association CAS (member certification no. 2018459), the National Natural Science Foundation of China (grant no. 41771010).

Acknowledgments

The authors would like to thank the three anonymous reviewers’ useful comments and the editor’s valuable suggestions for improving this manuscript.

Conflicts of Interest

The authors declare that they have no conflict of interest.

References

  1. Dong, G.R.; Dong, Y.X.; Li, S.; Jin, J.; Jin, H.L.; Liu, Y.Z. The causes and developmental trend of desertification in the middle reaches of the Yarlung Zangbo River and its two tributaries in Xizang. Chin. Geogr. Sci. 1995, 5, 355–364. [Google Scholar] [CrossRef]
  2. Li, S.; Dong, G.R.; Shen, J.Y.; Yang, P.; Liu, X.W.; Wang, Y.; Jin, H.L.; Wang, Q. Formation mechanism and development pattern of aeolian sand landform in Yarlung Zangbo River valley. Sci. China 1999, 42, 272–284. [Google Scholar] [CrossRef]
  3. Liu, Z.M.; Zhao, W.Z. Shifting sand control in central Tibet. Ambio 2001, 30, 376–380. [Google Scholar] [PubMed]
  4. Liu, Y.; Wang, Y.S.; Shen, T. Spatial distribution and formation mechanism of aeolian sand in the middle reaches of the Yarlung Zangbo River. J. Mt. Sci. 2019, 16, 1987–2000. [Google Scholar] [CrossRef]
  5. Zou, C. Exploration on the engineering geological problems of the new Lhasa-Linzhi railway. J. Railw. Eng. Soc. 2016, 33, 26–30, (In Chinese with English Abstract). [Google Scholar]
  6. Yang, M.X.; Yao, T.D.; Gou, X.H.; Hirose, N.; Fujii, H.Y.; Hao, L.S.; Levia, D.F. Diurnal freeze/thaw cycles of the ground surface on the Tibetan Plateau. Chin. Sci. Bull. 2007, 52, 136–139. [Google Scholar] [CrossRef]
  7. Zhu, C.X.; Fan, X.; Bai, Z.K. Spatiotemporal pattern of wind erosion on unprotected topsoil replacement sites in mainland China. Sustainability 2020, 12, 3237. [Google Scholar] [CrossRef] [Green Version]
  8. Cheng, H.; Liu, C.C.; Li, J.F.; Zou, X.Y.; Liu, B.; Kang, L.Q.; Fang, Y. Wind erosion mass variability with sand bed in a wind tunnel. Soil Tillage Res. 2017, 165, 181–189. [Google Scholar] [CrossRef]
  9. Xie, S.B.; Qu, J.J.; Xu, X.T.; Pang, Y.J. Interactions between freeze-thaw actions, wind erosion desertification, and permafrost in the Qinghai-Tibet Plateau. Nat. Hazards 2017, 85, 829–850. [Google Scholar] [CrossRef]
  10. Xie, S.B.; Qu, J.J.; Zhang, K.C.; Mu, Y.H.; Xu, X.T.; Pang, Y.J.; Wang, T. Hydrothermal variation and its influence on the desertified ground surface of Qinghai-Tibet Plateau. Appl. Therm. Eng. 2018, 131, 201–208. [Google Scholar] [CrossRef]
  11. Zou, X.Y.; Li, S.; Zhang, C.L.; Dong, G.R.; Dong, Y.X.; Yan, P. Desertification and control plan in the Tibet Autonomous Region of China. J. Arid Environ. 2002, 51, 183–198. [Google Scholar]
  12. Zhang, C.L.; Zou, X.Y.; Yang, P.; Dong, Y.X.; Li, S.; Wei, X.H.; Yang, S.; Pan, X.H. Wind tunnel test and 137Cs tracing study on wind erosion of several soils in Tibet. Soil Tillage Res. 2007, 94, 269–282. [Google Scholar] [CrossRef]
  13. Dong, M.; Yan, P.; Liu, B.L.; Wu, W.; Meng, X.N.; Ji, X.R.; Wang, Y.; Wang, Y.J. Distribution patterns and morphological classification of climbing dunes in the Qinghai-Tibet Plateau. Aeolian Res. 2018, 35, 58–68. [Google Scholar] [CrossRef]
  14. Zhang, J.Q.; Zhang, C.L.; Li, Q.; Pan, X.H. Grain-size distribution of surface sediments of climbing and falling dunes in the Zedang valley of the Yarlung Zangbo River, southern Tibetan plateau. J. Earth Syst. Sci. 2019, 128, 11. [Google Scholar] [CrossRef] [Green Version]
  15. Bagnold, R.A. The Physics of Blown Sand and Desert Dunes; Dover Publications Inc.: Mineola, NY, USA, 2005; pp. 57–76. [Google Scholar]
  16. Ling, Y.Q. Engineering calculation of maximum possible sand transporting quantity. J. Desert Res. 1997, 17, 362–368, (In Chinese with English Abstract). [Google Scholar]
  17. Ling, Y.Q. The distributive heterogencity of sand-transporting quantity (rate) along horizontal direction. J. Exp. Mech. 1994, 9, 352–356, (In Chinese with English Abstract). [Google Scholar]
  18. Han, Q.J.; Qu, J.J.; Dong, Z.B.; Zhang, K.C.; Zu, R.P. Air density effects on aeolian sand movement: Implications for sediment transport and sand control in regions with extreme altitudes or temperatures. Sedimentology 2015, 62, 1024–1038. [Google Scholar] [CrossRef]
  19. Han, Q.J.; Qu, J.J.; Dong, Z.B.; Zu, R.P.; Zhang, K.C.; Wang, H.T.; Xie, S.B. The effect of air density on sand transport structures and the adobe abrasion profile: A field wind-tunnel experiment over a wide range of altitude. Bound. Layer Meteorol. 2014, 150, 299–317. [Google Scholar] [CrossRef]
  20. Musick, H.B.; Trujillo, S.M.; Truman, C.R. Wind-tunnel modelling of the influence of vegetation structure on saltation threshold. Earth Surf. Process. Landf. 1996, 21, 589–605. [Google Scholar] [CrossRef]
  21. White, B.R. Laboratory simulation of aeolian sand transport and physical modeling of flow around dunes. Ann. Arid Zone 1996, 35, 187–213. [Google Scholar]
  22. Snyder, W.H. Similarity criteria for the application of fluid models to the study of air pollution meteorology. Bound. Layer Meteorol. 1972, 3, 113–134. [Google Scholar] [CrossRef]
  23. Dong, Z.B.; Qinan, G.Q.; Lu, P.; Luo, W.Y.; Wang, H.T. Turbulence fields in the lee of two-dimensional transverse dunes simulated in a wind tunnel. Earth Surf. Process. Landf. 2009, 34, 204–216. [Google Scholar] [CrossRef]
  24. Xin, G.W.; Huang, N.; Zhang, J. Wind-tunnel experiment on sand deposition mechanism and optimal measures of wind-break wall along railway in strong wind area. Chin. J. Theor. Appl. Mech. 2020, 52, 635–644, (In Chinese with English Abstract). [Google Scholar]
  25. Bruno, L.; Horvat, M.; Raffaele, L. Windblown sand along railway infrastructures: A review of challenges and mitigation measures. J. Wind Eng. Ind. Aerodyn. 2018, 177, 340–365. [Google Scholar] [CrossRef]
  26. Yan, M.; Wang, H.B.; Zuo, H.J.; Li, G.T. Wind tunnel simulation of an opencut tunnel airflow field along the Linhe-Ceke Railway, China. Aeolian Res. 2019, 39, 66–76. [Google Scholar] [CrossRef]
  27. Wang, X.M.; Chen, G.T. Efficiencies and reasonable width for the mechanical sand-prevention system along the Tarim desert highway. J. Arid Land Resour. Environ. 1997, 11, 28–35, (In Chinese with English Abstract). [Google Scholar]
  28. Li, S.Y.; Wang, D.; Lei, J.Q. Spatial distribution of sand drift disasters on road surface in the hinterland of the Taklimakan Desert. Arid Land Geogr. 2005, 28, 93–97, (In Chinese with English Abstract). [Google Scholar]
  29. Zhang, K.C.; Qu, J.J.; Han, Q.J.; Xie, S.B.; Kai, K.; Niu, Q.H.; An, Z.S. Wind tunnel simulation of windblown sand along China’s Qinghai–Tibet Railway. Land Degrad. Dev. 2014, 25, 244–250. [Google Scholar] [CrossRef]
  30. Xiao, J.H.; Yao, Z.Y.; Qu, J.J. Influence of Golmud–Lhasa section of Qinghai–Tibet Railway on blown sand transport. Chin. Geogr. Sci. 2015, 25, 39–50. [Google Scholar] [CrossRef]
  31. Xie, S.B.; Qu, J.J.; Han, Q.J.; Pang, Y.J. Experimental definition and its significance on the minimum safe distance of blown sand between the proposed Qinghai–Tibet Expressway and the existing Qinghai–Tibet Railway. Sci. CHINA Technol. Sci. 2020, 63. [Google Scholar] [CrossRef]
  32. Fryberger, S.G.; Dean, G. Dune forms and wind regime. In A Study of Global Sand Seas; U.S. Geological Survey Professional Papers 1052; Mckee, E.D., Ed.; University Press of the Pacific: Honolulu, HI, USA, 1979; pp. 137–169. [Google Scholar]
  33. Cornells, W.M.; Gabriels, D. Optimal windbreak design for wind-erosion control. J. Arid Environ. 2005, 61, 315–332. [Google Scholar] [CrossRef]
  34. Dong, Z.B.; Luo, W.Y.; Qian, G.Q.; Lv, P.; Wang, H.T. A wind tunnel simulation of the turbulence fields behind upright porous wind fences. J. Arid Environ. 2010, 74, 193–207. [Google Scholar] [CrossRef]
  35. He, W.; Huang, N.; Xu, B.; Wang, W.B. Numerical simulation of wind-sand movement in the reversed flow region of a sand dune with a bridge built downstream. Eur. Phys. J. E 2018, 41, 53. [Google Scholar] [CrossRef] [PubMed]
  36. Huang, N.; Gong, K.; Xu, B.; Zhao, J.; Dun, H.C.; He, W.; Xin, G.W. Investigations into the law of sand particle accumulation over railway subgrade with wind-break wall. Eur. Phys. J. E 2019, 42, 145. [Google Scholar] [CrossRef] [PubMed]
Figure 1. Sketch map of the Lhasa–Linzhi Railway and Xierong section.
Sustainability 12 05689 g001
Figure 2. Blown sand observation site in the Xierong section.
Sustainability 12 05689 g002
Figure 3. Railway bridge model used in the wind tunnel experiment.
Sustainability 12 05689 g003
Figure 4. Layout of the bridge wind tunnel experiment.
Sustainability 12 05689 g004
Figure 5. Initial wind speed profile of the wind tunnel experiment.
Sustainability 12 05689 g005
Figure 6. Monthly variations of the average wind speed and sand-moving wind frequency in the Xierong section.
Sustainability 12 05689 g006
Figure 7. Yearly wind rose of the Xierong section.
Sustainability 12 05689 g007
Figure 8. Monthly and yearly rose diagrams of sand-moving wind in the Xierong section.
Sustainability 12 05689 g008
Figure 9. Monthly variations of the drift potential (DP) and Q in the Xierong section.
Sustainability 12 05689 g009
Figure 10. Yearly rose diagrams of the DP and Q in the Xierong section.
Sustainability 12 05689 g010
Figure 11. Wind speed at each observation point of the bridge and its upwind and downwind directions.
Sustainability 12 05689 g011
Figure 12. Wind flow field of the bridge and its upwind and downwind directions.
Sustainability 12 05689 g012
Figure 13. Sand transport rate measured of the wind tunnel experiment with and without the bridge model.
Sustainability 12 05689 g013
Table 1. Characteristics of the bridge in the Xierong section.
Xierong Grand BridgeLength (m)Width (m)Average Height (m)Number of Piers
11923.9836
Table 2. Monthly variations of the resultant sand transport directions in the Xierong section.
Month (Year/Month)RDD (°)DirectionRA (°)Direction
2017/09318.85NW312.79NW
2017/10321.34NW320.20NW
2017/11266.64W243.04WSW
2017/12204.63SSW203.19SSW
2018/01304.84NW303.22WNW
2018/0210.89N3.87N
2018/03210.57SSW208.91SSW
2018/04206.24SSW203.80SSW
2018/05226.30SW221.33SW
2018/06318.72NW312.99NW
2018/07291.90WNW278.85W
2018/08330.61NNW332.11NNW
Table 3. The Q of each wind speed range in the Xierong section.
Wind Speed Range (m·s−1)5–66–77–88–99–1010–1111–1212–1313–14
Sept 2017 to Aug 2018 Q (kg·m−1·a−1)3.4511.9215.3710.147.265.252.361.380.75

