Economic Complexity of the City Cluster in Guangdong–Hong Kong–Macao Greater Bay Area, China
Abstract
1. Introduction
1.1. Revealed Symmetric Comparative Advantage
1.2. Economic Complexity
2. Data Collection
Economic Complexity in the Pearl River Delta Region
3. Discussion
4. Conclusions
Author Contributions
Funding
Conflicts of Interest
References
- Shi, S.; Wall, R.; Pain, K. Exploring the significance of domestic investment for foreign direct investment in China: A city-network approach. Urban Stud. 2019, 56, 2447–2464. [Google Scholar] [CrossRef]
- Ren, X. Urban China; John Wiley & Sons: Hoboken, NJ, USA, 2013. [Google Scholar]
- Zhao, M.; Liu, X.; Derudder, B.; Zhong, Y.; Shen, W. Mapping producer services networks in mainland Chinese cities. Urban Stud. 2015, 52, 3018–3034. [Google Scholar] [CrossRef]
- Lu, R.; Ruan, M.; Reve, T. Cluster and co-located cluster effects: An empirical study of six Chinese city regions. Res. Policy 2016, 45, 1984–1995. [Google Scholar] [CrossRef]
- Liu, L.; Zhang, M. High-speed rail impacts on travel times, accessibility, and economic productivity: A benchmarking analysis in city-cluster regions of China. J. Transp. Geogr. 2018, 73, 25–40. [Google Scholar] [CrossRef]
- Liu, X.; Derudder, B.; Wu, K. Measuring polycentric urban development in China: An intercity transportation network perspective. Reg.Stud. 2016, 50, 1302–1315. [Google Scholar] [CrossRef]
- Chen, C.L.; Vickerman, R. Can transport infrastructure change regions’ economic fortunes? Some evidence from Europe and China. Reg. Stud. 2017, 51, 144–160. [Google Scholar] [CrossRef]
- Lao, X.; Zhang, X.; Shen, T.; Skitmore, M. Comparing China’s city transportation and economic networks. Cities 2016, 53, 43–50. [Google Scholar] [CrossRef]
- Caprotti, F. Critical research on eco-cities? A walk through the Sino-Singapore Tianjin Eco-City, China. Cities 2014, 36, 10–17. [Google Scholar] [CrossRef]
- Liu, Y.; Hong, Y.; Fan, Q.; Wang, X.; Chan, P.; Chen, X.; Lai, A.; Wang, M.; Chen, X. Source-receptor relationships for PM2.5 during typical pollution episodes in the Pearl River Delta city cluster, China. Sci. Total Environ. 2017, 596–597, 194–206. [Google Scholar] [CrossRef]
- Xu, J. Environmental discourses in China’s urban planning system: A scaled discourse-analytical perspective. Urban Stud. 2016, 53, 978–999. [Google Scholar] [CrossRef]
- Zhou, S.; Xie, M.; Kwan, M.P. Ageing in place and ageing with migration in the transitional context of urban China: A case study of ageing communities in Guangzhou. Habitat Int. 2015, 49, 177–186. [Google Scholar] [CrossRef]
- Hidalgo, C.A.; Hausmann, R. The building blocks of economic complexity. Proc. Natl. Acad. Sci. USA 2009, 106, 10570–10575. [Google Scholar] [CrossRef] [PubMed]
- Hausmann, R.; Hidalgo, C.A.; Bustos, S.; Coscia, M.; Chung, S.; Jimenez, J.; Simoes, A.; Yıldırım, M.A. The Atlas of Economic Complexity: Mapping Paths to Prosperity. The Observatory of Economic Complexity; Harvard HKS/CDIMIT Media Lab: Cambridge, MA, USA, 2008. [Google Scholar]
- Reynolds, C.; Agrawal, M.; Lee, I.; Zhan, C.; Li, J.; Taylor, P.; Mares, T.; Morison, J.; Angelakis, N.; Roos, G. A sub-national economic complexity analysis of Australia’s states and territories. Reg. Stud. 2018, 52, 715–726. [Google Scholar] [CrossRef]
- Operti, F.G.; Pugliese, E., Jr.; Andrade, J.S.; Pietronero, L.; Gabrielli, A. Dynamics in the fitness-income plane: Brazilian states vs. world countries. PLoS ONE 2018, 13, e0197616. [Google Scholar]
- Castaneda, G.; Romero-Padilla, J. Subnational analysis of economic fitness and income dynamic: The case of Mexican states. Entropy 2018, 20, 841. [Google Scholar] [CrossRef]
- Lee, I.; Tie, Y. Fitness and research complexity among research-active universities in the world. Ieee Trans. Emerg. Top. Comput. 2018. [Google Scholar] [CrossRef]
- Guevara, M.R.; Hartmann, D.; Aristaran, M.; Mendoza, M.; Hidalgo, C.A. The research space: Using career paths to predict the evolution of the research output of individuals, institutions, and nations. Scientometrics 2016, 109, 1695–1709. [Google Scholar] [CrossRef]
- Guo, Q.; He, C.; Li, D. Entrepreneurship in China: The role of localisation and urbanisation economies. Urban Stud. 2016, 53, 2584–2606. [Google Scholar] [CrossRef]
- Balassa, B. Trade liberalisation and “revealed” comparative advantage. Manchester School 1965, 33, 99–123. [Google Scholar] [CrossRef]
- Laursen, K. Revealed comparative advantage and the alternatives as measures of international specialization. Eurasian Bus. Rev. 2015, 5, 99–115. [Google Scholar] [CrossRef]
- Yeh, A.G.; Yang, F.F.; Wang, J. Producer service linkages and city connectivity in the mega-city region of China: A case study of the Pearl River Delta. Urban Stud. 2015, 52, 2458–2482. [Google Scholar] [CrossRef]
- Schiller, D.; Burger, M.J.; Karreman, B. The functional and sectoral division of labour between Hong Kong and the Pearl River Delta: From complementarities in production to competition in producer services? Environ. Plan. A 2015, 47, 188–208. [Google Scholar] [CrossRef]
- Wang, J.; Zhang, X.; Yeh, A.G.O. Spatial proximity and location dynamics of knowledge-intensive business service in the Pearl River Delta, China. Habitat Int. 2016, 53, 390–402. [Google Scholar] [CrossRef]
- Liu, X.; Wang, M. How polycentric is urban China and why? A case study of 318 cities. Landsc. Urban Plan. 2016, 151, 10–20. [Google Scholar] [CrossRef]
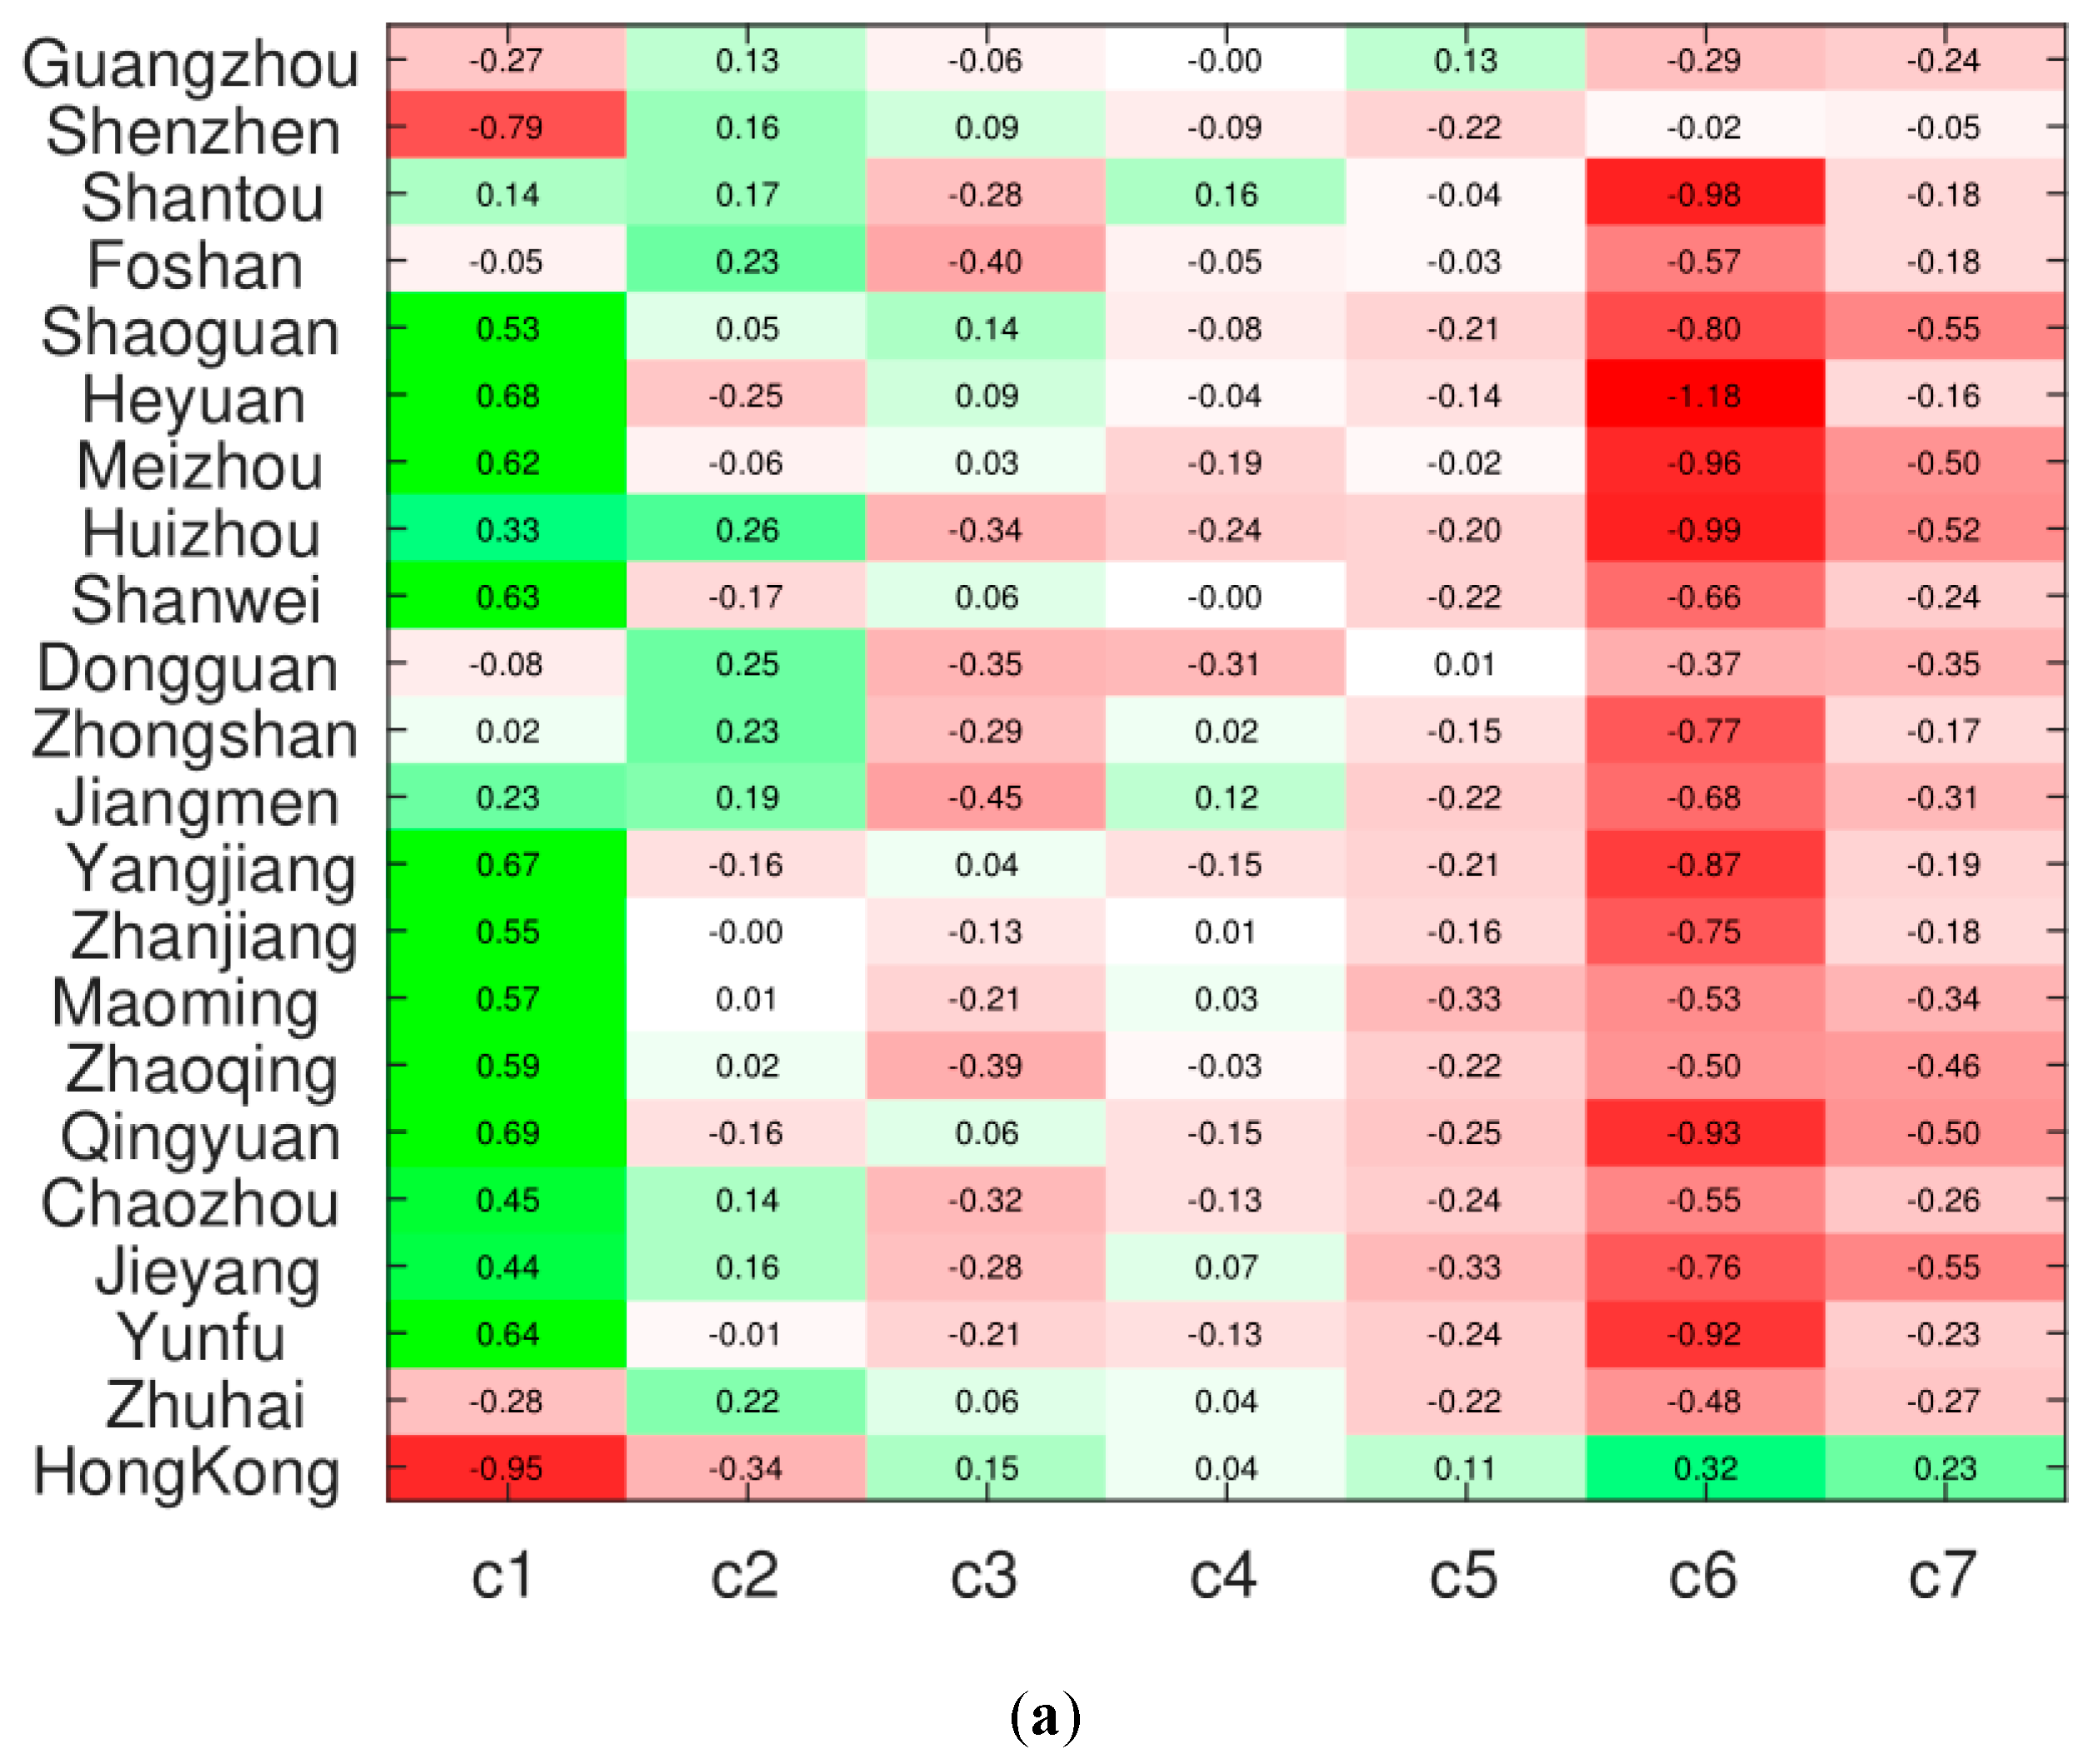
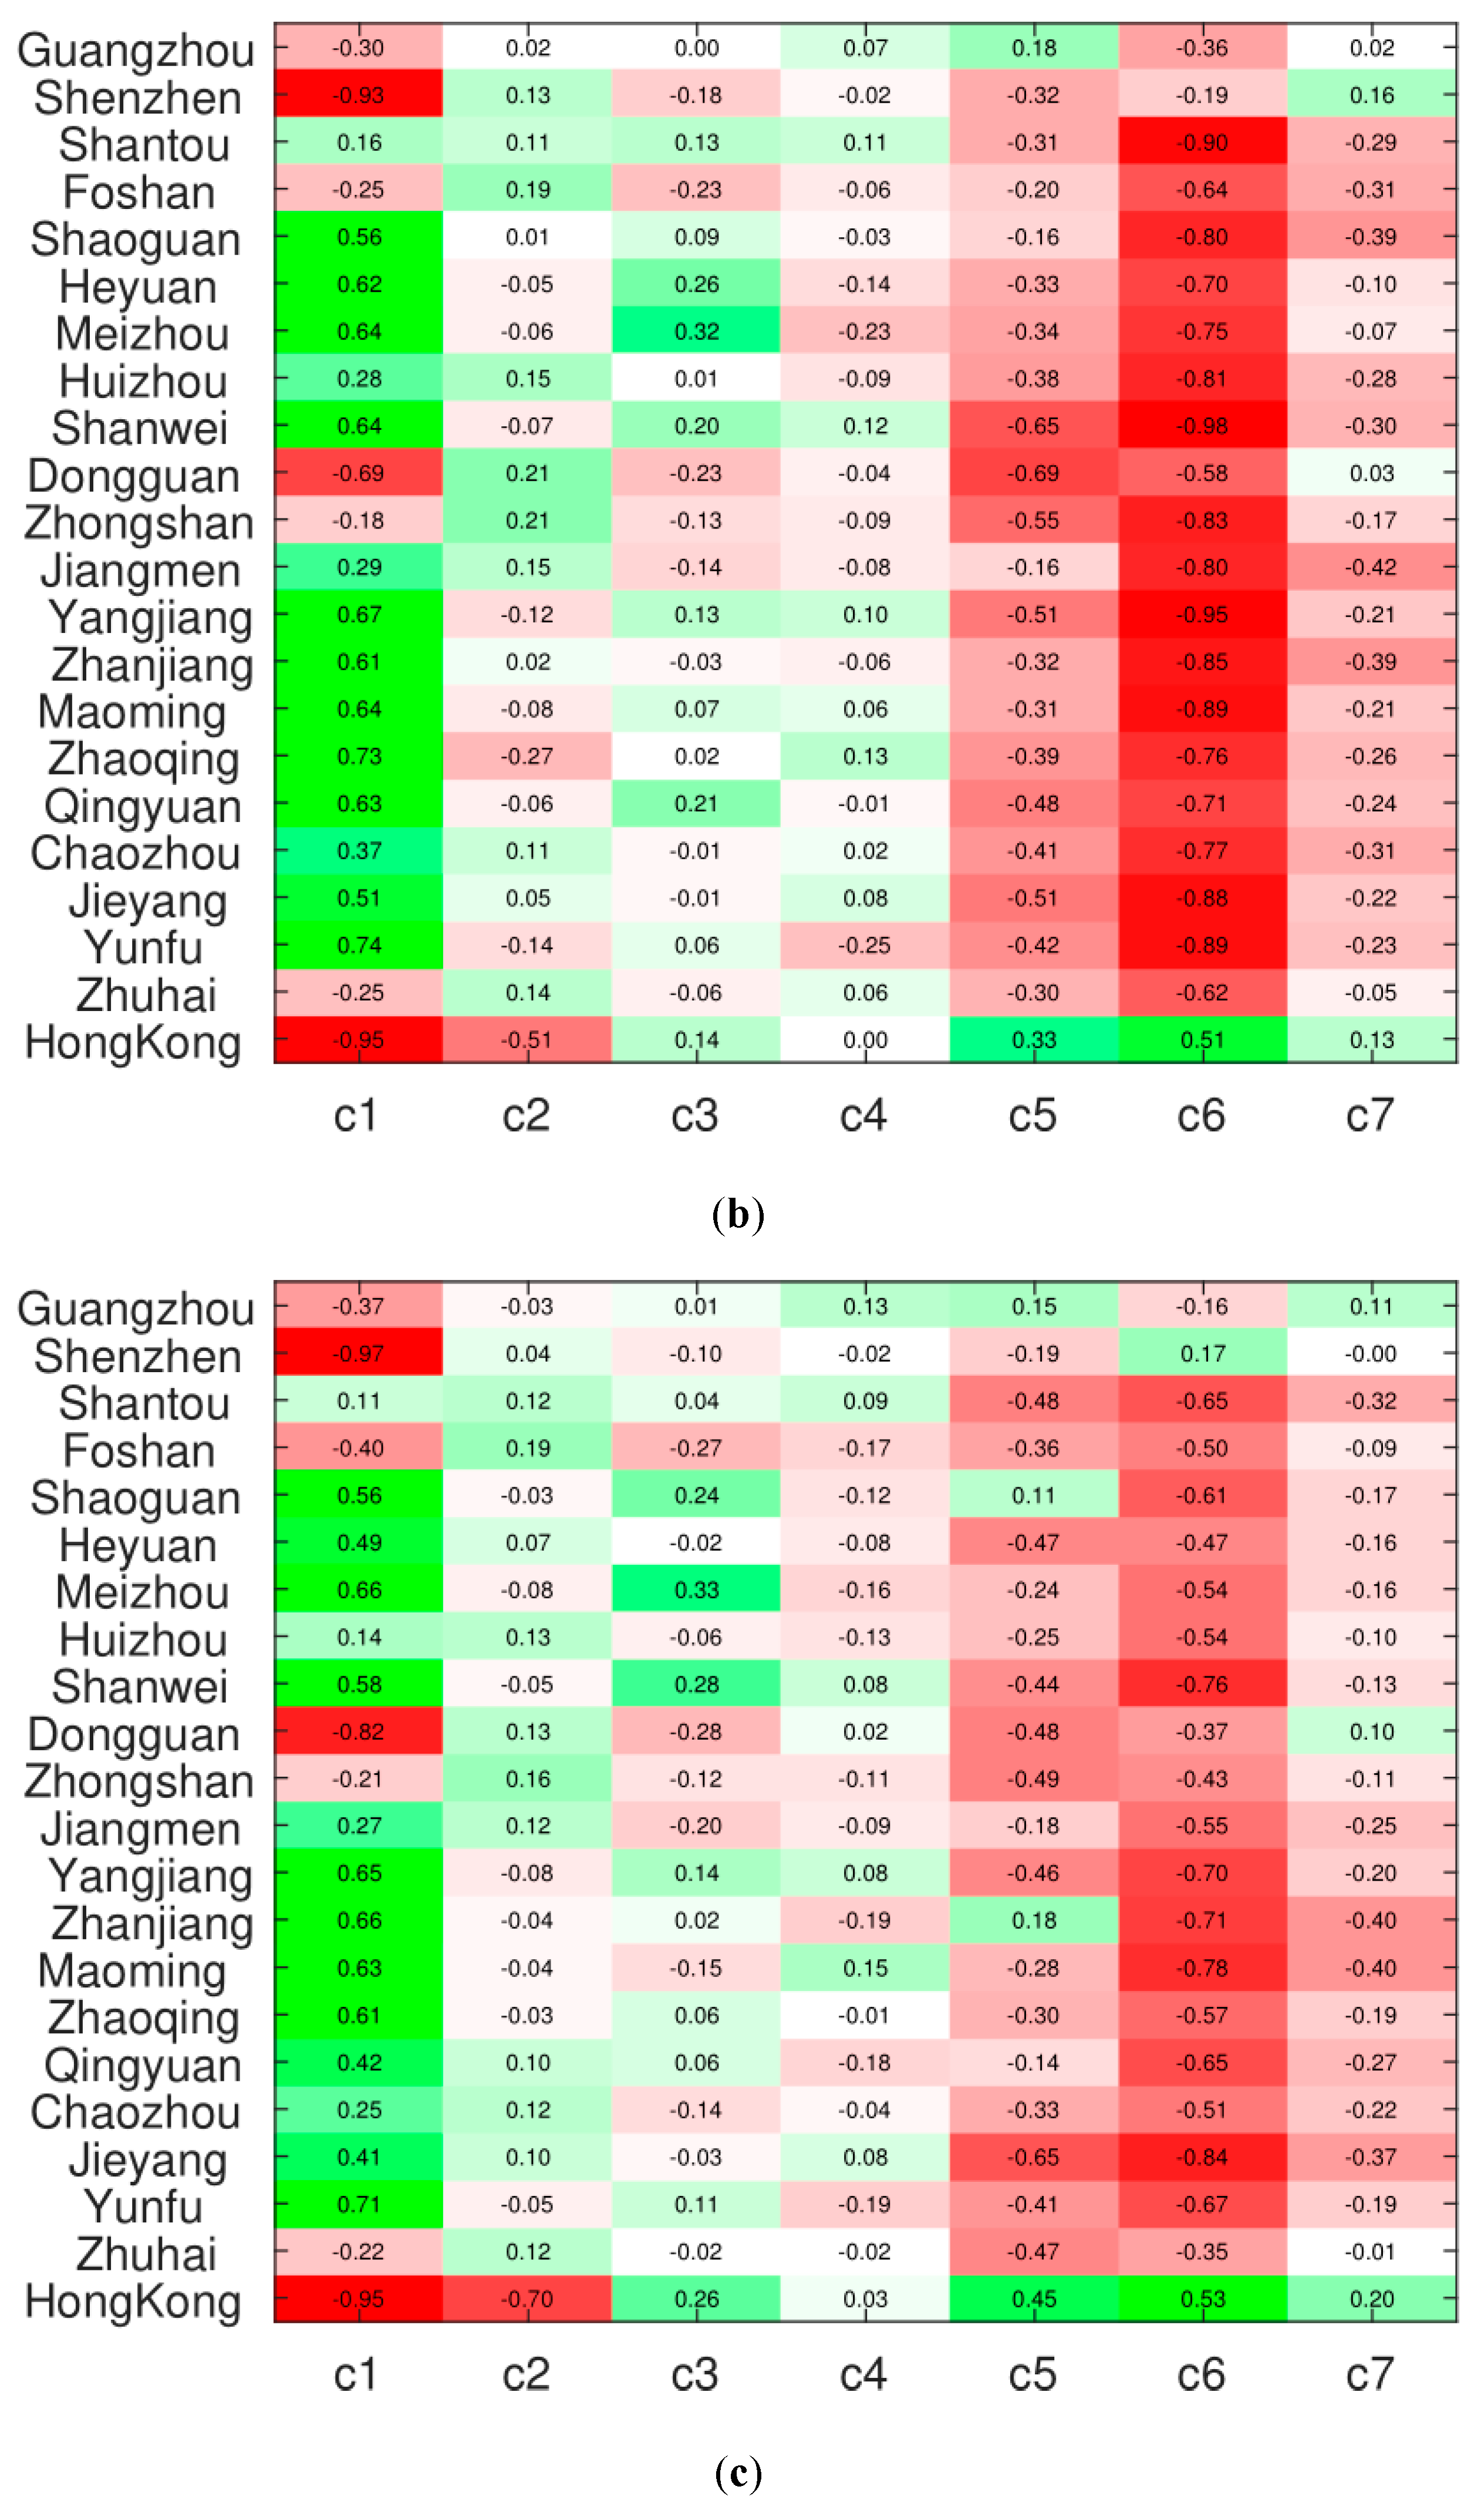
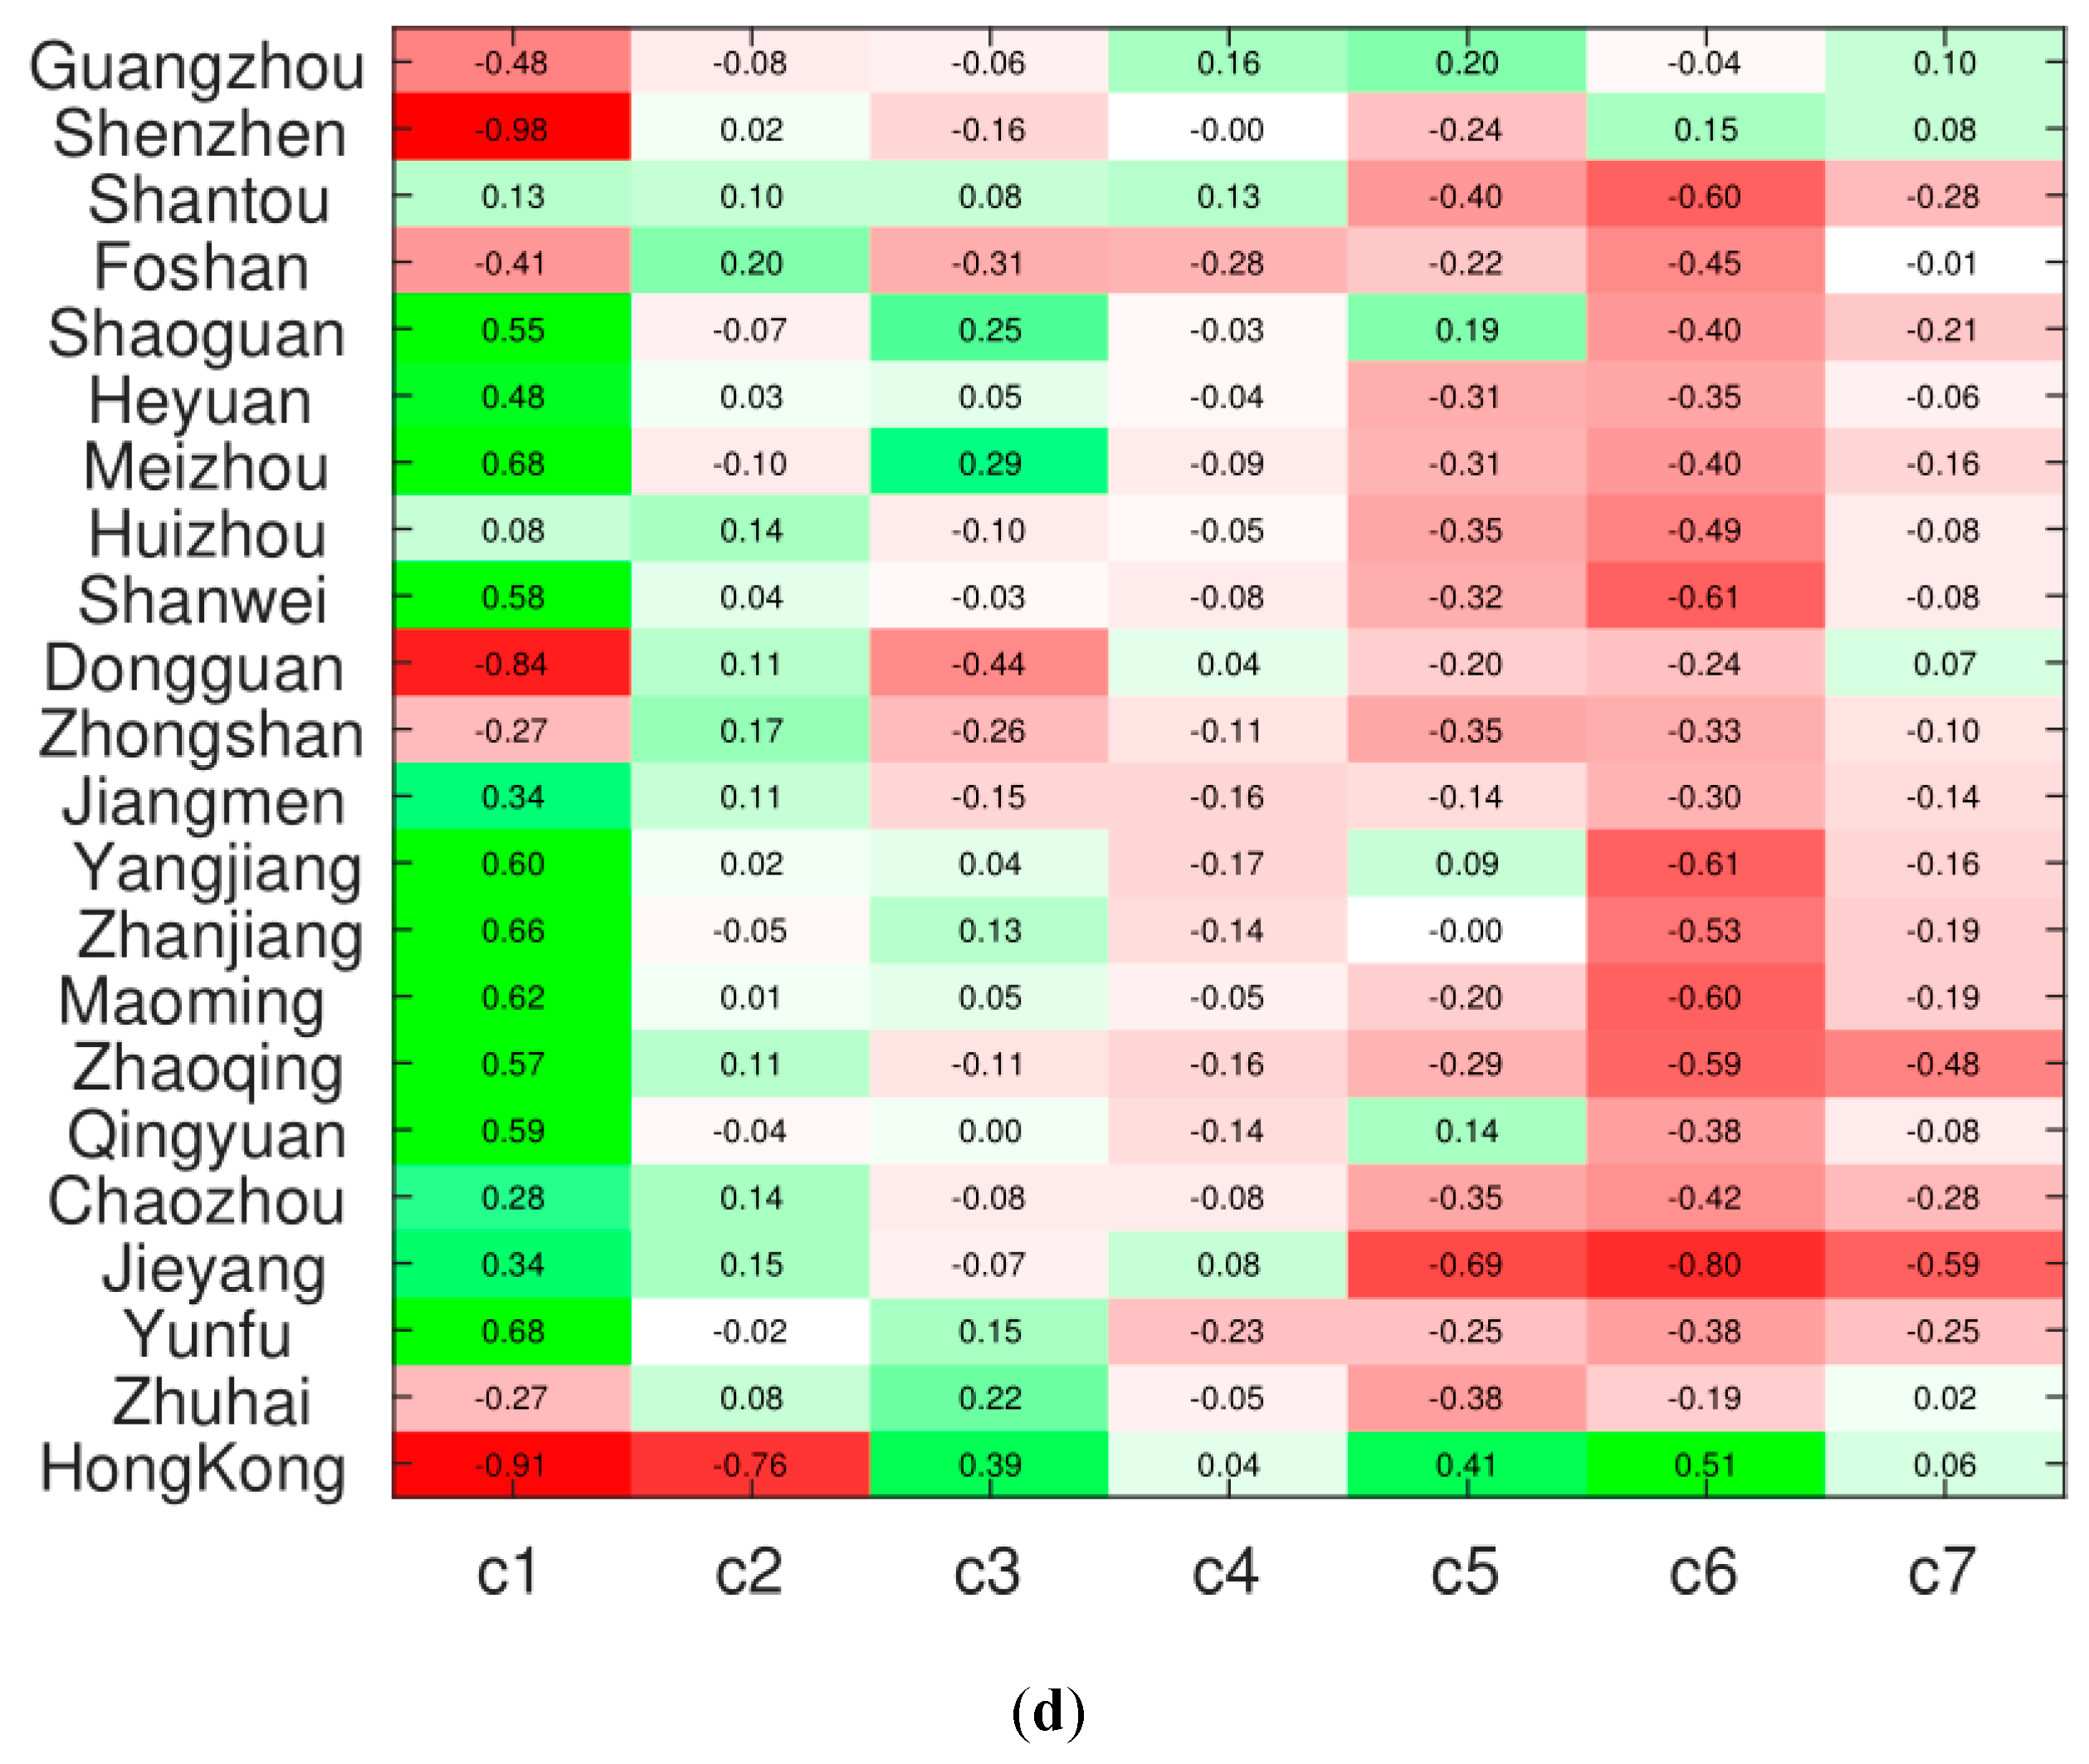
| Classification | Industrial Sector |
|---|---|
| c1 | agriculture/forestry/livestock/fisheries |
| c2 | industrial |
| c3 | building and construction |
| c4 | wholesale and retail |
| c5 | transport and logistics |
| c6 | finance |
| c7 | real estate |
| City | Abbrev | c1 | c2 | c3 | c4 | c5 | c6 | c7 |
|---|---|---|---|---|---|---|---|---|
| Guangzhou | GU | 226.84 | 5185.63 | 551.17 | 3099.92 | 1255.19 | 1628.71 | 1529.42 |
| Shenzhen | SZ | 6.65 | 6742.98 | 479.72 | 2361.16 | 540.8 | 2501.57 | 1564.41 |
| Shantou | ST | 96.71 | 877.22 | 86.56 | 341.47 | 42.4 | 50.95 | 82.92 |
| Foushan | FS | 136.45 | 4675.14 | 166.36 | 643.29 | 270.47 | 341.73 | 628.94 |
| Shaoguan | ZK | 151.68 | 360.33 | 71.64 | 146.14 | 84.13 | 50.69 | 55.69 |
| Heyuan | HU | 94.01 | 334.67 | 35.85 | 108.04 | 22.59 | 43.89 | 57.31 |
| Meizhou | MJ | 188.49 | 287.99 | 65 | 108.71 | 25.44 | 42.54 | 52.28 |
| Huizhou | HJ | 151.54 | 1624.48 | 102.43 | 411.41 | 80.71 | 121.04 | 213.79 |
| Shanwei | SW | 118.04 | 320.24 | 28.7 | 93.15 | 20.93 | 20.6 | 51.77 |
| Dongguan | TG | 21.03 | 2840.35 | 88.81 | 905.37 | 205.9 | 401.37 | 529.25 |
| Zhongshan | ZS | 66.48 | 1566.89 | 66.07 | 328.61 | 72.91 | 159.97 | 184.78 |
| Jiangmen | GM | 174.5 | 1023.06 | 62.02 | 222.23 | 85.91 | 126.31 | 128.99 |
| Yangjian | EG | 205.33 | 509.38 | 55 | 129.97 | 81.26 | 34.19 | 73.62 |
| Zhanjiang | JG | 454.67 | 796.77 | 115.88 | 244.34 | 118.97 | 76.82 | 122.85 |
| Maoming | MM | 387.41 | 901.03 | 99.71 | 293.41 | 80.14 | 62.5 | 122.4 |
| Yuqing | CG | 288.29 | 930.28 | 61.17 | 199.15 | 56.77 | 54.91 | 53.25 |
| Qingyuan | FM | 192.52 | 437.46 | 48.48 | 129.91 | 85.9 | 61.08 | 82.06 |
| Chaozhou | T5 | 64.27 | 454.05 | 30.23 | 107.6 | 22.97 | 40.02 | 39.64 |
| Jieyang | RU | 167.69 | 1062.01 | 69.2 | 342.02 | 19.7 | 25.14 | 41.03 |
| Yunfu | ZM | 149.11 | 265.83 | 37.9 | 63.07 | 22.78 | 35.38 | 34.12 |
| Zhuhai | 5C | 45.11 | 894.07 | 119.95 | 249.24 | 46.51 | 146.8 | 160.32 |
| Hong Kong | HK | 18.85 | 508.83 | 885.74 | 1495.18 | 1224.95 | 3316.8 | 869.9 |
| City | 2000 | 2001 | 2002 | 2003 | 2004 | 2005 | 2006 | 2007 | 2008 | 2009 | 2010 | 2011 | 2012 | 2013 | 2014 | 2015 |
|---|---|---|---|---|---|---|---|---|---|---|---|---|---|---|---|---|
| GU | 2.09 | 1.49 | 1.27 | 1.39 | 1.93 | 1.41 | 1.97 | 1.95 | 2.32 | 1.98 | 1.58 | 1.19 | 1.67 | 2.07 | 2.09 | 2.08 |
| SZ | −0.08 | 0.04 | 0.04 | 1.30 | 1.28 | 2.01 | 1.86 | 1.88 | 2.18 | 2.19 | −0.50 | 0.17 | 2.05 | 1.83 | 1.91 | 2.08 |
| ST | −0.26 | −0.37 | −0.41 | −0.53 | −0.19 | −0.34 | −0.39 | −0.39 | −0.37 | −0.40 | 0.11 | 0.03 | −0.12 | −0.07 | −0.02 | 0.02 |
| FS | −0.01 | −0.34 | −0.47 | −0.14 | 0.07 | 0.38 | 0.09 | 0.14 | −0.07 | −0.58 | −1.67 | −1.79 | −1.08 | −0.95 | −0.72 | −0.39 |
| ZK | −0.36 | −0.31 | −0.32 | −0.26 | −0.67 | −0.48 | −0.57 | −0.57 | −0.56 | 0.21 | 1.13 | 1.04 | 0.53 | 0.39 | 0.06 | −0.10 |
| HU | −0.54 | −0.30 | −0.25 | −0.32 | −1.05 | −0.91 | −0.57 | −0.57 | −0.56 | −0.72 | −0.85 | −0.87 | −0.99 | −0.58 | −0.67 | −0.64 |
| MJ | −0.54 | 0.91 | −0.25 | −0.32 | −1.05 | −0.91 | −0.90 | −0.92 | −0.81 | −0.78 | 0.57 | 0.64 | −0.18 | −0.40 | −0.64 | −0.76 |
| HJ | −0.47 | −0.67 | −0.75 | −0.71 | −0.67 | −0.48 | −0.51 | −0.48 | −0.51 | −0.85 | −0.85 | −0.87 | −0.99 | −0.96 | −0.90 | −0.76 |
| SW | −0.54 | −0.30 | −0.07 | −0.27 | −0.50 | −0.59 | −0.54 | −0.56 | −0.47 | −0.35 | 0.70 | 0.63 | −0.12 | −0.16 | −0.90 | −0.76 |
| TG | 2.09 | 1.49 | 1.77 | 1.63 | 1.28 | 2.01 | 1.86 | 1.88 | 1.60 | 1.05 | 0.41 | −0.03 | 1.04 | 0.92 | 1.37 | 1.54 |
| ZS | −0.26 | −0.34 | −0.47 | −0.14 | 0.07 | 0.38 | 0.09 | 0.14 | −0.07 | −0.58 | −1.67 | −1.79 | −1.08 | −0.95 | −0.72 | −0.39 |
| GM | −0.26 | −0.37 | −0.41 | −0.53 | −0.19 | −0.42 | −0.51 | −0.48 | −0.51 | −0.85 | −0.85 | −0.87 | −0.99 | −0.96 | −0.90 | −0.76 |
| EG | −0.54 | −0.30 | 1.31 | 0.91 | 0.13 | −0.59 | −0.54 | −0.56 | −0.47 | −0.35 | 0.70 | 0.63 | −0.18 | −0.58 | −0.67 | −0.17 |
| JG | −0.38 | −0.39 | −0.38 | −0.72 | −0.50 | −0.42 | −0.51 | −0.57 | −0.81 | 0.21 | 1.13 | 1.04 | 0.53 | 0.39 | 0.06 | −0.76 |
| MM | −0.26 | −0.39 | −0.38 | −0.72 | 0.61 | −0.59 | −0.54 | −0.56 | −0.47 | −0.29 | 0.47 | 0.34 | 0.04 | 0.24 | 0.43 | −0.64 |
| CG | −0.47 | −1.00 | −1.04 | −0.72 | −0.32 | −0.59 | −0.54 | −0.56 | −0.47 | −0.35 | 0.57 | 0.64 | −0.99 | −0.96 | −0.90 | −0.76 |
| FM | −0.54 | −0.30 | −0.25 | −0.32 | −1.05 | −0.91 | −0.57 | −0.57 | −0.56 | −0.72 | −0.18 | 1.04 | 0.53 | 0.39 | 0.06 | −0.10 |
| T5 | −0.47 | −0.67 | −0.75 | −0.71 | −0.58 | −0.26 | −0.28 | −0.27 | −0.27 | −0.85 | −0.85 | −0.87 | −0.99 | −0.96 | −0.90 | −0.76 |
| RU | −0.26 | −0.37 | −0.41 | −0.53 | −0.19 | −0.26 | −0.39 | −0.39 | −0.27 | −0.39 | −0.24 | −0.37 | −0.34 | −0.96 | 0.04 | 0.16 |
| ZM | −0.93 | −1.00 | −1.04 | −1.29 | −1.05 | −0.91 | −0.90 | −0.92 | −0.81 | −0.78 | 0.57 | 0.64 | −0.18 | −0.40 | −0.64 | −0.76 |
| 5C | 0.00 | 0.10 | 0.12 | 0.11 | −0.07 | 0.22 | 0.13 | 0.15 | 0.06 | 1.31 | −1.67 | −1.79 | −0.27 | 0.67 | 0.66 | 0.75 |
| HK | 2.95 | 3.38 | 3.12 | 2.89 | 2.69 | 2.21 | 2.28 | 2.22 | 1.93 | 1.89 | 1.40 | 1.20 | 2.13 | 2.01 | 1.92 | 1.89 |
| City | Mean | Standard | Median | First | Third | Variance | Standard | Kurtosis | Skewness | Range | Mini | Max | Sum |
|---|---|---|---|---|---|---|---|---|---|---|---|---|---|
| Error | Quartile | Quartile | Deviation | ||||||||||
| GU | 1.78 | 0.09 | 1.94 | 1.47 | 2.07 | 0.12 | 0.35 | −1.25 | −0.34 | 1.13 | 1.19 | 2.32 | 28.48 |
| SZ | 1.27 | 0.24 | 1.85 | 0.14 | 2.02 | 0.94 | 0.97 | −1.23 | −0.75 | 2.69 | −0.50 | 2.19 | 20.24 |
| ST | −0.23 | 0.05 | −0.30 | −0.39 | −0.06 | 0.04 | 0.20 | −1.28 | 0.36 | 0.64 | −0.53 | 0.11 | −3.70 |
| FS | −0.47 | 0.16 | −0.37 | −0.78 | 0.01 | 0.40 | 0.64 | 0.09 | −0.89 | 2.17 | −1.79 | 0.38 | −7.53 |
| ZK | −0.05 | 0.14 | −0.29 | −0.50 | 0.26 | 0.32 | 0.57 | 0.06 | 1.02 | 1.80 | −0.67 | 1.13 | −0.84 |
| HU | −0.65 | 0.06 | −0.61 | −0.86 | −0.56 | 0.06 | 0.24 | −0.71 | 0.03 | 0.80 | −1.05 | −0.25 | −10.39 |
| MJ | −0.40 | 0.15 | −0.59 | −0.83 | −0.23 | 0.37 | 0.61 | 0.24 | 1.15 | 1.96 | −1.05 | 0.91 | −6.34 |
| HJ | −0.71 | 0.05 | −0.73 | −0.86 | −0.51 | 0.03 | 0.18 | −1.40 | 0.08 | 0.52 | −0.99 | −0.47 | −11.43 |
| SW | −0.30 | 0.11 | −0.41 | −0.55 | −0.15 | 0.19 | 0.44 | 1.55 | 1.29 | 1.60 | −0.90 | 0.70 | −4.80 |
| TG | 1.37 | 0.15 | 1.52 | 1.05 | 1.79 | 0.34 | 0.58 | 0.98 | −1.09 | 2.12 | −0.03 | 2.09 | 21.91 |
| ZS | −0.49 | 0.16 | −0.37 | −0.78 | −0.04 | 0.39 | 0.63 | 0.16 | −0.87 | 2.17 | −1.79 | 0.38 | −7.78 |
| GM | −0.62 | 0.07 | −0.52 | −0.86 | −0.42 | 0.07 | 0.26 | −1.45 | 0.00 | 0.80 | −0.99 | −0.19 | −9.86 |
| EG | −0.08 | 0.16 | −0.33 | −0.55 | 0.26 | 0.39 | 0.63 | 0.02 | 1.13 | 1.98 | −0.67 | 1.31 | −1.27 |
| JG | −0.13 | 0.16 | −0.39 | −0.53 | 0.26 | 0.38 | 0.62 | −0.17 | 0.97 | 1.94 | −0.81 | 1.13 | −2.08 |
| MM | −0.17 | 0.11 | −0.34 | −0.55 | 0.27 | 0.20 | 0.45 | −1.31 | 0.55 | 1.33 | −0.72 | 0.61 | −2.71 |
| CG | −0.53 | 0.13 | −0.58 | −0.92 | −0.44 | 0.25 | 0.50 | 1.88 | 1.48 | 1.68 | −1.04 | 0.64 | −8.46 |
| FM | −0.25 | 0.14 | −0.31 | −0.57 | −0.06 | 0.30 | 0.55 | 0.76 | 0.90 | 2.09 | −1.05 | 1.04 | −4.05 |
| T5 | −0.65 | 0.07 | −0.73 | −0.86 | −0.42 | 0.07 | 0.26 | −1.28 | 0.50 | 0.73 | −0.99 | −0.26 | −10.44 |
| RU | −0.32 | 0.06 | −0.36 | −0.39 | −0.26 | 0.06 | 0.24 | 3.29 | −0.57 | 1.12 | −0.96 | 0.16 | −5.17 |
| ZM | −0.65 | 0.14 | −0.86 | −0.95 | −0.58 | 0.31 | 0.55 | 1.86 | 1.59 | 1.93 | −1.29 | 0.64 | −10.40 |
| 5C | 0.03 | 0.20 | 0.12 | −0.02 | 0.33 | 0.62 | 0.79 | 2.09 | −1.24 | 3.10 | −1.79 | 1.31 | 0.48 |
| HK | 2.26 | 0.15 | 2.17 | 1.91 | 2.74 | 0.37 | 0.61 | −0.43 | 0.25 | 2.18 | 1.20 | 3.38 | 36.11 |
© 2020 by the authors. Licensee MDPI, Basel, Switzerland. This article is an open access article distributed under the terms and conditions of the Creative Commons Attribution (CC BY) license (http://creativecommons.org/licenses/by/4.0/).
Share and Cite
Lee, I.; Lin, R.F.-Y. Economic Complexity of the City Cluster in Guangdong–Hong Kong–Macao Greater Bay Area, China. Sustainability 2020, 12, 5639. https://doi.org/10.3390/su12145639
Lee I, Lin RF-Y. Economic Complexity of the City Cluster in Guangdong–Hong Kong–Macao Greater Bay Area, China. Sustainability. 2020; 12(14):5639. https://doi.org/10.3390/su12145639
Chicago/Turabian StyleLee, Ivan, and Regina Fang-Ying Lin. 2020. "Economic Complexity of the City Cluster in Guangdong–Hong Kong–Macao Greater Bay Area, China" Sustainability 12, no. 14: 5639. https://doi.org/10.3390/su12145639
APA StyleLee, I., & Lin, R. F.-Y. (2020). Economic Complexity of the City Cluster in Guangdong–Hong Kong–Macao Greater Bay Area, China. Sustainability, 12(14), 5639. https://doi.org/10.3390/su12145639


