Analysis of the Environmental Sustainability of a Megacity through a Cobenefits Indicator System—The Case of Shanghai

Abstract
1. Introductions
2. Methodology
2.1. Driver-Pressure-State-Impact-Response (DPSIR) Research Framework
2.2. Entropy Method
2.3. Comprehensive Index Calculation
2.4. Case Study
2.5. Data Collecting and Processing
3. Results
3.1. Introduction of Shanghai
3.2. Index Weight
3.3. Co-Benefit Index
3.4. Evaluation
4. Discussion and Conclusions
4.1. Limitations
4.1.1. Applicable Conditions
4.1.2. Annual Average Concentration of PM2.5 as an Index
4.1.3. Average Regional Dust Settling as an Index
4.2. Suggestions
4.2.1. Enhancing Management of Total Energy Consumption and Carbon Emissions
4.2.2. Promoting Industry Structure Transformations and the Development of Tertiary Industry
4.2.3. Increasing Investments in Eco-Protection and Decreasing the Gap between the Actual Ecological Quality of the City and the Residential Expectations
4.2.4. Cowork Regionally to Control the Pollution of Acid Rain
4.3. Expectations
4.3.1. Cross Comparison of Different Cities Under the Same Index System
4.3.2. Generalized Co-Benefits Index (CBI) System
4.3.3. Co-Benefit Monetization
Author Contributions
Funding
Conflicts of Interest
References
- Science, L. Global Warming: News, Facts, Causes & Effects. Ed. Available online: http://www.livescience.com/topics/global-warming (accessed on 6 November 2019).
- Tiao, G.C.; Box, G.E.P.; Hamming, W.J. Analysis of Los Angeles Photochemical Smog Data: A Statistical Overview. J. Air Pollut. Control Assoc. 1975, 25, 260–268. [Google Scholar] [CrossRef]
- Wang, G.; Zhang, R.; Gomez, M.E.; Yang, L.; Zamora, M.L.; Hu, M.; Lin, Y.; Peng, J.; Guo, S.; Meng, J.; et al. Persistent sulfate formation from London Fog to Chinese haze. Proc. Natl. Acad. Sci. USA 2016, 113, 13630–13635. [Google Scholar] [CrossRef]
- Núñez-Cacho, P.; Molina-Moreno, V.; Corpas-Iglesias, F.A.; Cortés-García, F.J. Family Businesses Transitioning to a Circular Economy Model: The Case of “Mercadona”. Sustainability 2018, 10, 538. [Google Scholar] [CrossRef]
- Ryan, M.; Antoniou, J.; Brooks, L.; Jiya, T.; Macnish, K.; Stahl, B. The Ethical Balance of Using Smart Information Systems for Promoting the United Nations’ Sustainable Development Goals. Sustainability 2020, 12, 4826. [Google Scholar] [CrossRef]
- Keitsch, M. Structuring Ethical Interpretations of the Sustainable Development Goals—Concepts, Implications and Progress. Sustainability 2018, 10, 829. [Google Scholar] [CrossRef]
- Scovronick, N.; Budolfson, M.; Dennig, F.; Errickson, F.; Fleurbaey, M.; Peng, W.; Socolow, R.H.; Spears, D.; Wagner, F. The impact of human health co-benefits on evaluations of global climate policy. Nat. Commun. 2019, 10, 2095. [Google Scholar] [CrossRef] [PubMed]
- Wagner, F.; Amann, M.; Borken-Kleefeld, J.; Cofala, J.; Höglund-Isaksson, L.; Purohit, P.; Rafaj, P.; Schöpp, W.; Winiwarter, W. Sectoral marginal abatement cost curves: Implications for mitigation pledges and air pollution co-benefits for Annex I countries. Sustain. Sci. 2012, 7, 169–184. [Google Scholar] [CrossRef]
- Chen, H.; Wang, Z.; Xu, S.; Zhao, Y.; Cheng, Q.; Zhang, B. Energy demand, emission reduction and health co-benefits evaluated in transitional China in a 2 °C warming world. J. Clean. Prod. 2020, 264, 121773. [Google Scholar] [CrossRef]
- Jiang, L.; Xue, B.; Ma, Z.; Yu, L.; Huang, B.; Chen, X. A life-cycle based co-benefits analysis of biomass pellet production in China. Renew. Energy 2020, 154, 445–452. [Google Scholar] [CrossRef]
- Alimujiang, A.; Jiang, P.; Dong, H.; Hu, B. Synergy and co-benefits of reducing CO2 and air pollutant emissions by promoting new energy vehicles: A case of Shanghai. Acta Sci. Circumstantiae 2020, 5, 1873–1883. [Google Scholar]
- Mao, X.; Xing, Y.; Hu, T.; Zeng, A.; Liu, S. An environmental-economic analysis of carbon, sulfur and nitrogen co-reduction path for China’s power industry. China Environ. Sci. 2012, 32, 748–756. [Google Scholar]
- Ding, M.A.; Chen, W.Y. Analysis of the co-benefit of emission reduction measures in China’s iron and steel industry. China Environ. Sci. 2015, 1, 198–303. [Google Scholar] [CrossRef] [PubMed]
- Sun, X.; Jiang, P.; Gao, S.; Zheng, J.; Zhu, Y.; Zhang, M. Environmental Sustainable Development with Co-benefits Approach in Guangxi Province. J. Fudan Univ. (Nat. Sci.) 2016, 55, 173–182. [Google Scholar]
- Nikiforiadis, A.; Chrysostomou, K.; Aifadopoulou, G. Exploring Travelers’ Characteristics Affecting their Intention to Shift to Bike-Sharing Systems due to a Sophisticated Mobile App. Algorithms 2019, 12, 264. [Google Scholar] [CrossRef]
- Ruiz-Guerra, I.; Molina-Moreno, V.; Cortes-Garcia, F.J.; Nunez-Cacho, P. Prediction of the impact on air quality of the cities receiving cruise tourism: The case of the Port of Barcelona. Heliyon 2019, 5, e01280. [Google Scholar] [CrossRef]
- Svarstad, H.; Petersen, L.K.; Rothman, D.; Siepel, H.; Wätzold, F. Discursive biases of the environmental research framework DPSIR. Land Use Policy 2008, 25, 116–125. [Google Scholar] [CrossRef]
- Zhang, H.; Zhou, J. Evaluation of China’s provincial rural financial ecological environment based on DPSIR model. Jiangsu Agric. Sci. 2018, 46, 319–323. [Google Scholar]
- Zhang, L.; Wang, W.; Deng, Z.; Zhao, Y. On the evaluation system of the environmental business behavior based on the DPSIR model. J. Saf. Environ. 2018, 18, 342–348. [Google Scholar]
- Gari, S.R.; Newton, A.; Icely, J.D. A review of the application and evolution of the DPSIR framework with an emphasis on coastal social-ecological systems. Ocean Coast. Manag. 2015, 103, 63–77. [Google Scholar] [CrossRef]
- Zhang, L.; Li, N.; Qin, Y.; Zhang, J.; Wang, X. The low-carbon city evaluation and its spatial differentiation based on the DPSIR. World Reg. Stud. 2019, 28, 85–94. [Google Scholar]
- Qiao, J. Application of Improved Entropy Method in Henan Sustainable Development Evaluation. Resour. Sci. 2004, 26, 113–119. [Google Scholar]
- Wu, Y.; Zhong, J. Study on Building the Assessment System on Innovative Cities Based on Entropy Method. Sci. Technol. Manag. Res. 2011, 18, 13–15. [Google Scholar]
- Liu, Q.; Zeng, H. Evaluation of Circular Economy Development Based on Entropy Method—A case study of Tianshui City in Gansu Province. Territ. Nat. Resour. Study 2017, 2, 25–28. [Google Scholar]
- Wang, K.; Guo, X.; Li, M. Performance Evaluation of Ecological Civilization of Urban Agglomeration in Greater Bay Area of Yangtze River Delta Based on the Conjoint Analysis of Factor Analysis and Entropy Method. Ecol. Econ. 2020, 4, 213–218. [Google Scholar]
- Liu, Y.; Iiu, C.L.; Zhang, Y. Research on Sustainable Utilization of Land Resources in Quanzhou City Based on Entropy Method. J. Suzhou Univ. 2019, 34, 75–80. [Google Scholar]
- Chen, X. Dynamic Evaluation of Sustainable Land Use Based on Entropy Method—A Case Study of Jiangxi Area. Liaoning Agric. Sci. 2017, 1, 37–42. [Google Scholar]
- Zhou, X.; Tang, X.; Li, M. Evaluation on the Urban Land Use Intensity and its Spatial Difference Based on Improved Entropy Method and Spatial Autocorrelation—A Case Study of Jiangxi Province. J. Fujian Norm. Univ. (Nat. Sci. Ed.) 2015, 31, 88–97. [Google Scholar]
- Ma, Y.-M.; Wu, Y.-M.; Wu, B.-J. Comprehensive Evaluation of Sustainable Urban Development of Yangtze River Delta Based on Entropy Method and Quadrant Method. Econ. Geogr. 2015, 6, 47–53. [Google Scholar]
- Lu, C.; Wen, F.; Yuan, X.; Qin, Y. Research on risk identification of urbanization based on the entropy method in henan province. Chin. J. Agric. Resour. Reg. Plan. 2018, 39, 142–147. [Google Scholar]
- Liu, J.; Huiran, C.; Xie, Z.; Liu, B. A Study on the Urbanization Quality Evaluation of Prefecture-level Cities in Hebei Province Based on Entropy Method. Math. Pract. Theory 2020, 2, 73–81. [Google Scholar]
- Guo, X. Application of improved entropy method in evaluation of economic result. Syst. Eng. Theory Pract. 1998, 12, 99–103. [Google Scholar]
- Wei, J.; Luo, W. Evaluation of Sustainable Ecological Development in Chengdu City Based on DPSIR Model. Environ. Sci. Manag. 2013, 2, 184–187. [Google Scholar]
- Huang, Z.; Li, G.; Li, Y.; Chang, Y. Evaluation and Analysis of Sustainable Development in Beijing Based on DPSIR Model. Urban Dev. Stud. 2016, 23, 20–24. [Google Scholar]
- Liu, X.; Liu, H.; Chen, J.; Liu, T.; Deng, Z. Evaluating the sustainability of marine industrial parks based on the DPSIR framework. J. Clean. Prod. 2018, 188, 158–170. [Google Scholar] [CrossRef]
- Qiao, X.; Yang, Y.; Yang, Y.; Feng, D. Applying DPSIR Model and Theil Coefficient to Assess Sustainable Development in Henan Province. Areal Res. Dev. 2017, 36, 18–22. [Google Scholar]
- Zhou, Y.; Wang, J.; Gao, J.; Jialing, R. Evaluation and Obstacle Factor Diagnoses of Low Carbon Transport Development Based on DPSIR: A Case Study of Beijing. Ecol. Econ. 2020, 4, 13–18. [Google Scholar]
- Wei, Y.; Zhu, X.; Li, Y.; Yao, T.; Tao, Y. Influential factors of national and regional CO2 emission in China based on combined model of DPSIR and PLS-SEM. J. Clean. Prod. 2019, 212, 698–712. [Google Scholar] [CrossRef]
- Salguero-Puerta, L.; Leyva-Diaz, J.C.; Cortes-Garcia, F.J.; Molina-Moreno, V. Sustainability Indicators Concerning Waste Management for Implementation of the Circular Economy Model on the University of Lome (Togo) Campus. Int. J. Environ. Res. Public Health 2019, 16, 2234. [Google Scholar] [CrossRef]
- Gu, J.; Hu, W.; Tian, S. Evaluation of Ecological Carrying Capacity and Diagnosis of Obstacle Factors in Jiangsu Province Based on DPSIR-TOPSIS Model. Bull. Soil Water Conserv. 2019, 39, 246–252. [Google Scholar]
- Spanò, M.; Gentile, F.; Davies, C.; Lafortezza, R. The DPSIR framework in support of green infrastructure planning: A case study in Southern Italy. Land Use Policy 2017, 61, 242–250. [Google Scholar] [CrossRef]
- National BureauofStatistics. ChinaStatistics Yearbook; China Statistics Press: Beijing, China, 2019. [Google Scholar]
- Albrecht, J.; François, D.; Schoors, K. A Shapley decomposition of carbon emissions without residuals. Energy Policy 2002, 30, 727–736. [Google Scholar] [CrossRef]
- Xu, G.; Liu, Z.; Jiang, Z. Decomposition Model and Empirical Study of Carbon Emissions for China, 1995–2004. China Popul. Resour. Environ. 2006, 16, 158–161. [Google Scholar]
- IPCC. 2006 IPCC Guidelines for National Greenhouse Gas Inventories: Energy; Institute for Global Environmental Strategies: Hayama, Japan, 2006. [Google Scholar]
- Shanghai Municipal Development & Reform Commission. The 12th Five Year Plan of Energy Conservation and Climate Change in Shanghai. Available online: http://www.shanghai.gov.cn/nw2/nw2314/nw2319/nw10800/nw11407/nw29273/u26aw31222.html (accessed on 9 March 2012).
- Shanghai Municipal Development & Reform Commission. Key Work Arrangements of Energy Conservation and Emission Reduction in Shanghai in 2018. Available online: http://www.shanghai.gov.cn/nw2/nw2314/nw2319/nw12344/u26aw56092.html?date=2018-06-04 (accessed on 4 June 2018).
- Wu, C.; Dai, J.; Chen, Q.S.A.; Xie, Q. Visualization analysis of the research status and emerging trends of the acid rain application. J. Saf. Environ. 2019, 19, 344–353. [Google Scholar]
- Cai, J.; Gao, S.; Sun, X.; Jiang, P.; Zheng, J.; Zhang, M. A review of studies on the co-benefits of environmental, economic and social development. China Popul. Resour. Environ. 2016, 26, 35–38. [Google Scholar]


| Framework Level | Element Level | Index Level | Type |
|---|---|---|---|
| Drive(D) | Level of economic development in a city | Regional GDP | Economy |
| Average regional GDP per person | Economy | ||
| Industry structures | Weight of first industry production in GDP | Economy | |
| Weight of second industry production in GDP | Economy | ||
| Weight of third industry production in GDP | Economy | ||
| Populations | Residential population | Social | |
| Pressure(P) | Intensity of energy consumptions | Amount of energy consumption | Economy/Environment |
| Average energy consumption per person | Economy/Environment | ||
| Energy consumption per unit GDP | Economy/Environment | ||
| Energy consumption of industry added value | Economy/Environment | ||
| State(S) | Level of air pollutant emissions | PM2.5 average annual concentration | Environment |
| PM10 average annual concentration | Environment | ||
| SO2 average annual concentration | Environment | ||
| NO2 average annual concentration | Environment | ||
| Level of greenhouse gas emissions | Carbon emission | Environment | |
| Average carbon emission per person | Environment/Social | ||
| Carbon emission per 10k GDP | Environment/Economy | ||
| Impact(I) | Air pollution | Frequency of acid rain | Environment |
| Average regional dust settling | Environment | ||
| Greenhouse effect | Average annual temperature | Environment | |
| React(R) | Governmental acts | Flexibility index of energy resource | Economy |
| Average public green land per person | Environment/Social | ||
| Investment in eco-protection | Environment |
| Framework Level | Index Level | Positivity/Negativity | Note |
|---|---|---|---|
| Drive(D) | GDP | + | Positive during the research time span (2005–20018). May need to be adjusted according to research time span change and city development. |
| Regional GDP per person | + | ||
| Weight of first industry production in GDP | - | Currently megacities in China are facing industrial transformation from robust, high-polluting first and secondary industry to intensive, low-polluting tertiary industry. | |
| Weight of second industry production in GDP | - | ||
| Weight of third industry production in GDP | + | ||
| Residential population | - | May need to be adjusted according to research time span change and city development | |
| Pressure(P) | Amount of energy consumption | - | Energy consumption refers to traditional fossil fuel consumption. For megacities in China, these parameters can be typically considered as negative. |
| Average energy consumption per person | - | ||
| Energy consumption per unit GDP | - | ||
| Energy consumption of industry added value | - | ||
| State(S) | PM2.5 average annual concentration | - | |
| PM10 average annual concentration | - | ||
| SO2 average annual concentration | - | ||
| NO2 average annual concentration | - | ||
| Carbon emission | - | ||
| Average carbon emission per person | - | ||
| Carbon emission per 10k yuan GDP | - | ||
| Impact(I) | Frequency of acid rain | - | |
| Average regional dust settling | - | ||
| Average annual temperature | - | ||
| React(R) | Flexibility index of energy resource | - | |
| Average public green land per person | + | ||
| Investment in eco-protection | + |
| Type of Energy | Carbon Emission Coefficient |
|---|---|
| (104 tons Carbon/104 tons Standard Coal) | |
| Coal | 0.7559 |
| Petroleum | 0.5857 |
| Natural Gas | 0.4483 |
| Water/Nuclear Power | 0 |
| Framework Level | Index | Weight |
|---|---|---|
| Drive (D) | Regional GDP | 0.0649 |
| Average regional GDP per person | 0.0680 | |
| Weight of first industry production in GDP | 0.0341 | |
| Weight of second industry production in GDP | 0.0380 | |
| Weight of third industry production in GDP | 0.104 | |
| Residential population | 0.0639 | |
| Pressure (P) | Amount of energy consumption | 0.0409 |
| Average energy consumption per person | 0.0146 | |
| Energy consumption per unit GDP | 0.0388 | |
| Energy consumption of industry added value | 0.0298 | |
| State (S) | PM2.5 average annual concentration | 0.0442 |
| PM10 average annual concentration | 0.0534 | |
| SO2 average annual concentration | 0.0380 | |
| NO2 average annual concentration | 0.0201 | |
| Carbon emission | 0.0298 | |
| Average carbon emission per person | 0.0259 | |
| Carbon emission per 10k GDP | 0.0322 | |
| Impact (I) | Frequency of acid rain | 0.0547 |
| Average regional dust settling | 0.0377 | |
| Average annual temperature | 0.0075 | |
| React (R) | Flexibility index of energy resource | 0.0405 |
| Average public green land per person | 0.0730 | |
| Investment in eco-protection | 0.0407 |
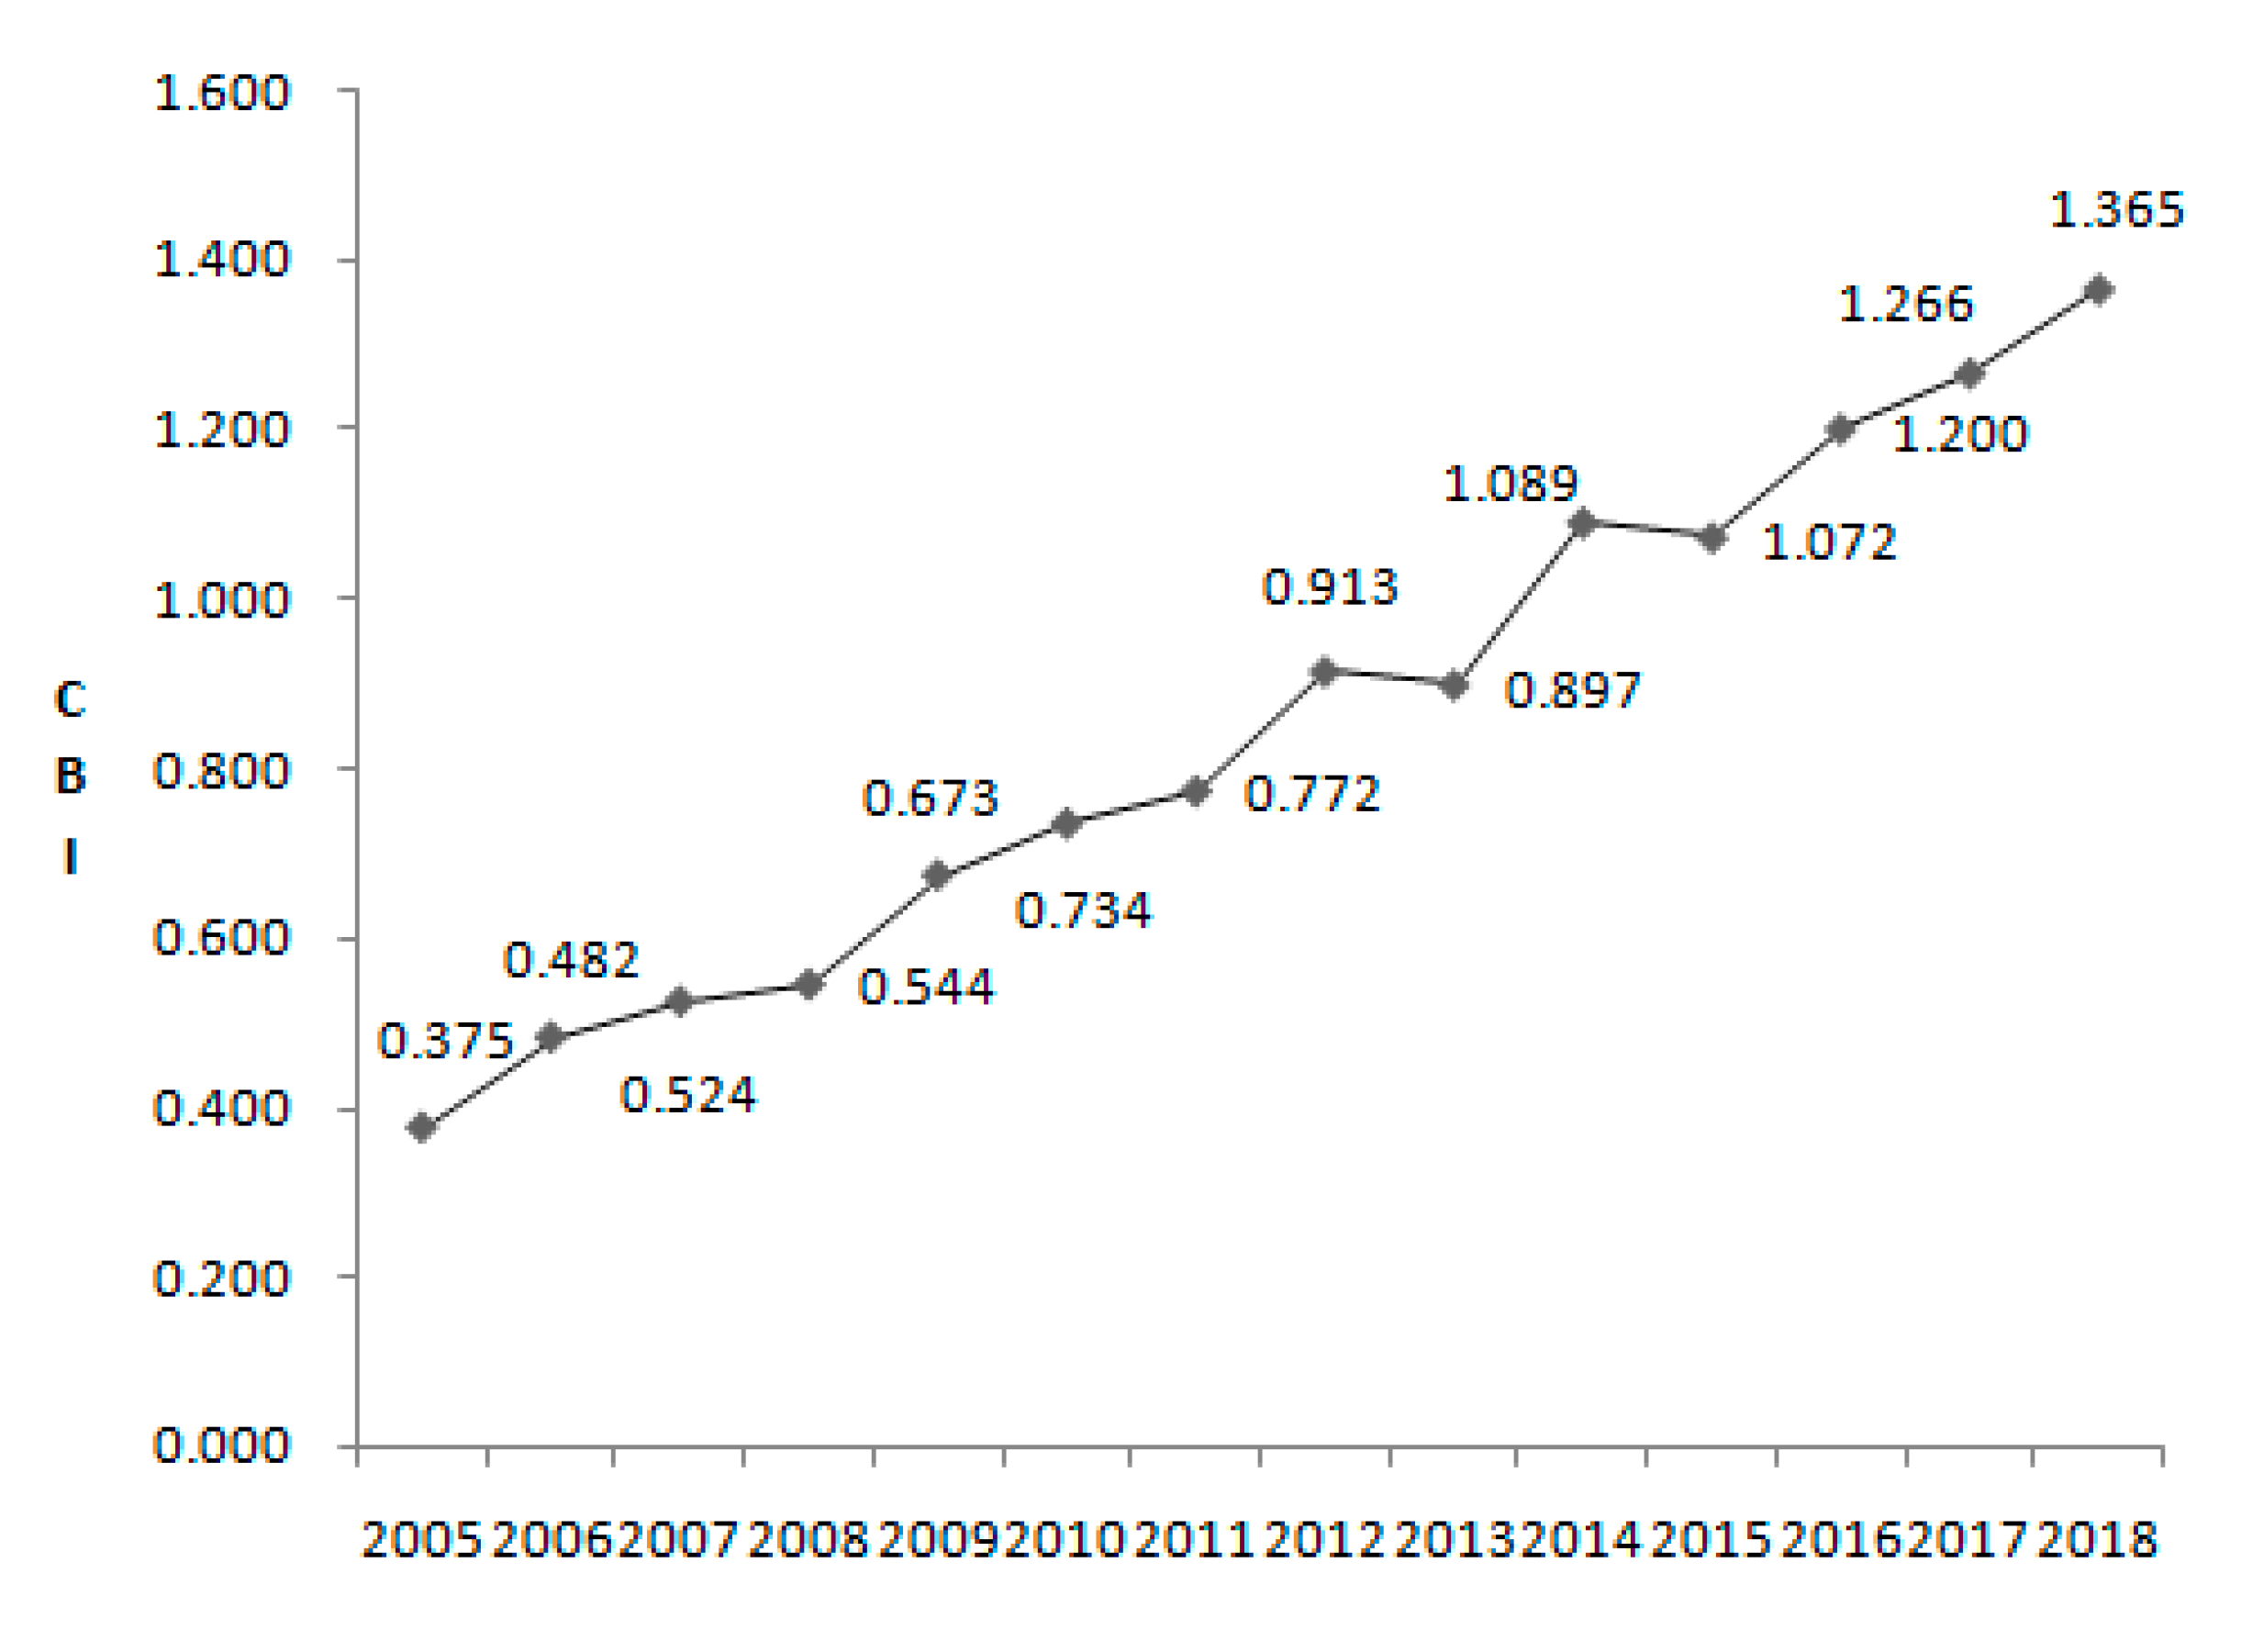
| Year | CBI | Annual Percentage Increase |
|---|---|---|
| 2005 | 0.375 | \ |
| 2006 | 0.482 | 28.5% |
| 2007 | 0.524 | 8.7% |
| 2008 | 0.544 | 3.8% |
| 2009 | 0.673 | 23.7% |
| 2010 | 0.734 | 9.1% |
| 2011 | 0.772 | 5.2% |
| 2012 | 0.913 | 18.3% |
| 2013 | 0.897 | −1.8% |
| 2014 | 1.089 | 21.4% |
| 2015 | 1.072 | −1.6% |
| 2016 | 1.200 | 11.9% |
| 2017 | 1.266 | 5.5% |
| 2018 | 1.365 | 13.8% |
| Index | Weight | |
|---|---|---|
| Weight of tertiary industry production proportion in GDP | 0.104 |  |
| Average public green land per person | 0.073 | |
| Residential population | 0.0693 | |
| Regional GDP per person | 0.068 | |
| Regional GDP | 0.0649 | |
| Frequency of acid rain | 0.0547 | |
| PM10 average annual concentration | 0.0534 | |
| PM2.5 average annual concentration | 0.0442 | |
| Amount of energy consumption | 0.0409 | |
| Investment in eco-protection | 0.0407 | |
| Flexibility index of energy resource | 0.0405 | |
| Energy consumption per unit GDP | 0.0388 | |
| Weight of secondary industry production proportion in GDP | 0.038 | |
| SO2 average annual concentration | 0.038 | |
| Average regional dust settling | 0.0377 | |
| Weight of first industry production proportion in GDP | 0.0341 | |
| Carbon emission per 10k GDP | 0.0322 | |
| Energy consumption of industry added value | 0.0298 | |
| Carbon emission | 0.0298 | |
| Average carbon emission per person | 0.0259 | |
| NO2 average annual concentration | 0.0201 | |
| Average energy consumption per person | 0.0146 | |
| Average annual temperature | 0.0075 |
© 2020 by the authors. Licensee MDPI, Basel, Switzerland. This article is an open access article distributed under the terms and conditions of the Creative Commons Attribution (CC BY) license (http://creativecommons.org/licenses/by/4.0/).
Share and Cite
Qiao, W.; Sun, X.; Jiang, P.; Wang, L. Analysis of the Environmental Sustainability of a Megacity through a Cobenefits Indicator System—The Case of Shanghai. Sustainability 2020, 12, 5549. https://doi.org/10.3390/su12145549
Qiao W, Sun X, Jiang P, Wang L. Analysis of the Environmental Sustainability of a Megacity through a Cobenefits Indicator System—The Case of Shanghai. Sustainability. 2020; 12(14):5549. https://doi.org/10.3390/su12145549
Chicago/Turabian StyleQiao, Wen, Xing Sun, Ping Jiang, and Linji Wang. 2020. "Analysis of the Environmental Sustainability of a Megacity through a Cobenefits Indicator System—The Case of Shanghai" Sustainability 12, no. 14: 5549. https://doi.org/10.3390/su12145549
APA StyleQiao, W., Sun, X., Jiang, P., & Wang, L. (2020). Analysis of the Environmental Sustainability of a Megacity through a Cobenefits Indicator System—The Case of Shanghai. Sustainability, 12(14), 5549. https://doi.org/10.3390/su12145549