Study of Urban Greenery Models to Prevent Overheating of Parked Vehicles in P + R Facilities in Ljubljana, Slovenia

 ,
, 

Abstract
:1. Introduction
2. Materials and Methods
2.1. Case Study
2.2. Methods and Tools
- Geomorphological data by the Surveying and Mapping Authority of the Republic of Slovenia were used [36]. Analyses of geomorphological (topography, reliefs, terrain type, and climate conditions), and mapping of landscape characteristics were conducted. Spatial data were mapped using GIS ESRI ArcGIS software (ArcMap version 10.3.1) for visual representations and analyses.
- Thermal satellite imagery was done based on Landsat 8 data obtained from the satellite thermal infrared sensor (TIRS) [37]. The Landsat 8 satellite (launched as the Landsat Data Continuity Mission—LDCM on 11 February, 2013) mission continues the acquisition of high-quality data that meet both NASA and USGS scientific and operational requirements for observing land use and land change [37]. We used Landsat 8 images for the production of the thermal map. The images were processed using Esri ArcGis Software, which was transformed in a way to calculate the temperature for each pixel separately by converting the raw bands into top of atmosphere radiance (TOAr). The temperature calculations were done with the Raster calculator tool, which calculated the temperature values for each pixel separately. For the visual representation, the initial 30 × 30 m grid was resampled using the ArcMap Resample tool to a 1 × 1 m grid. A bilinear resampling technique was used.
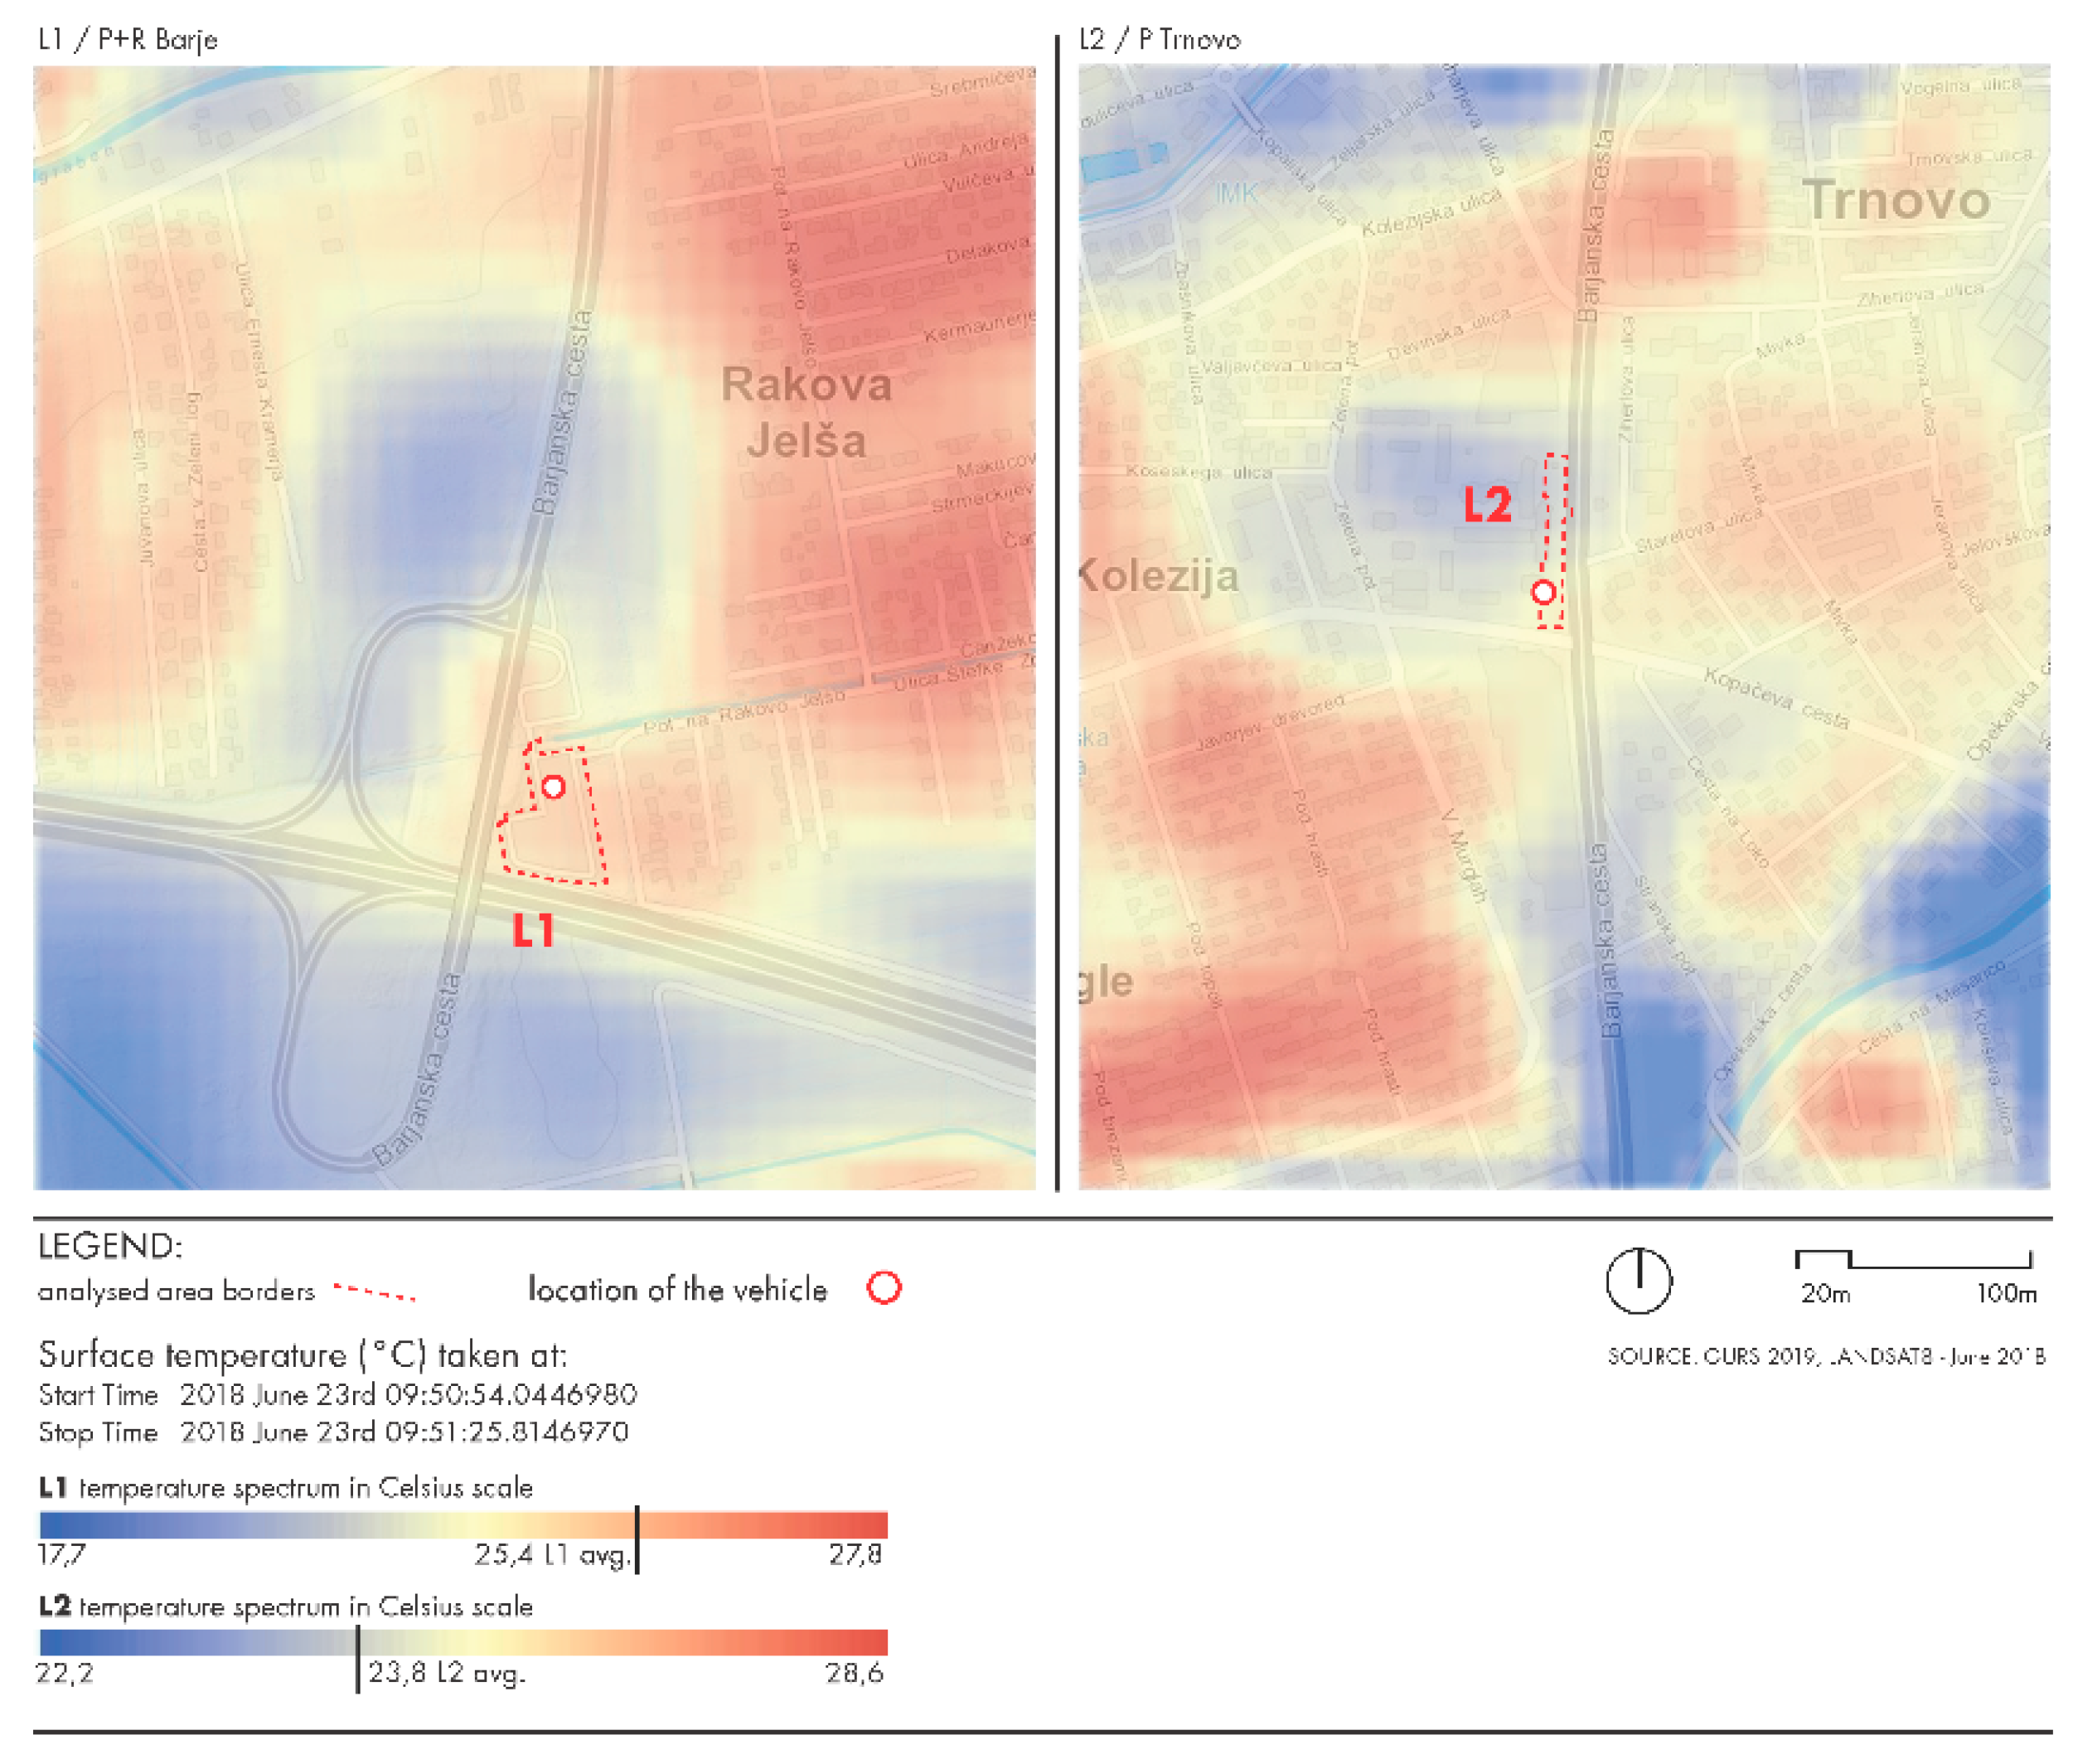
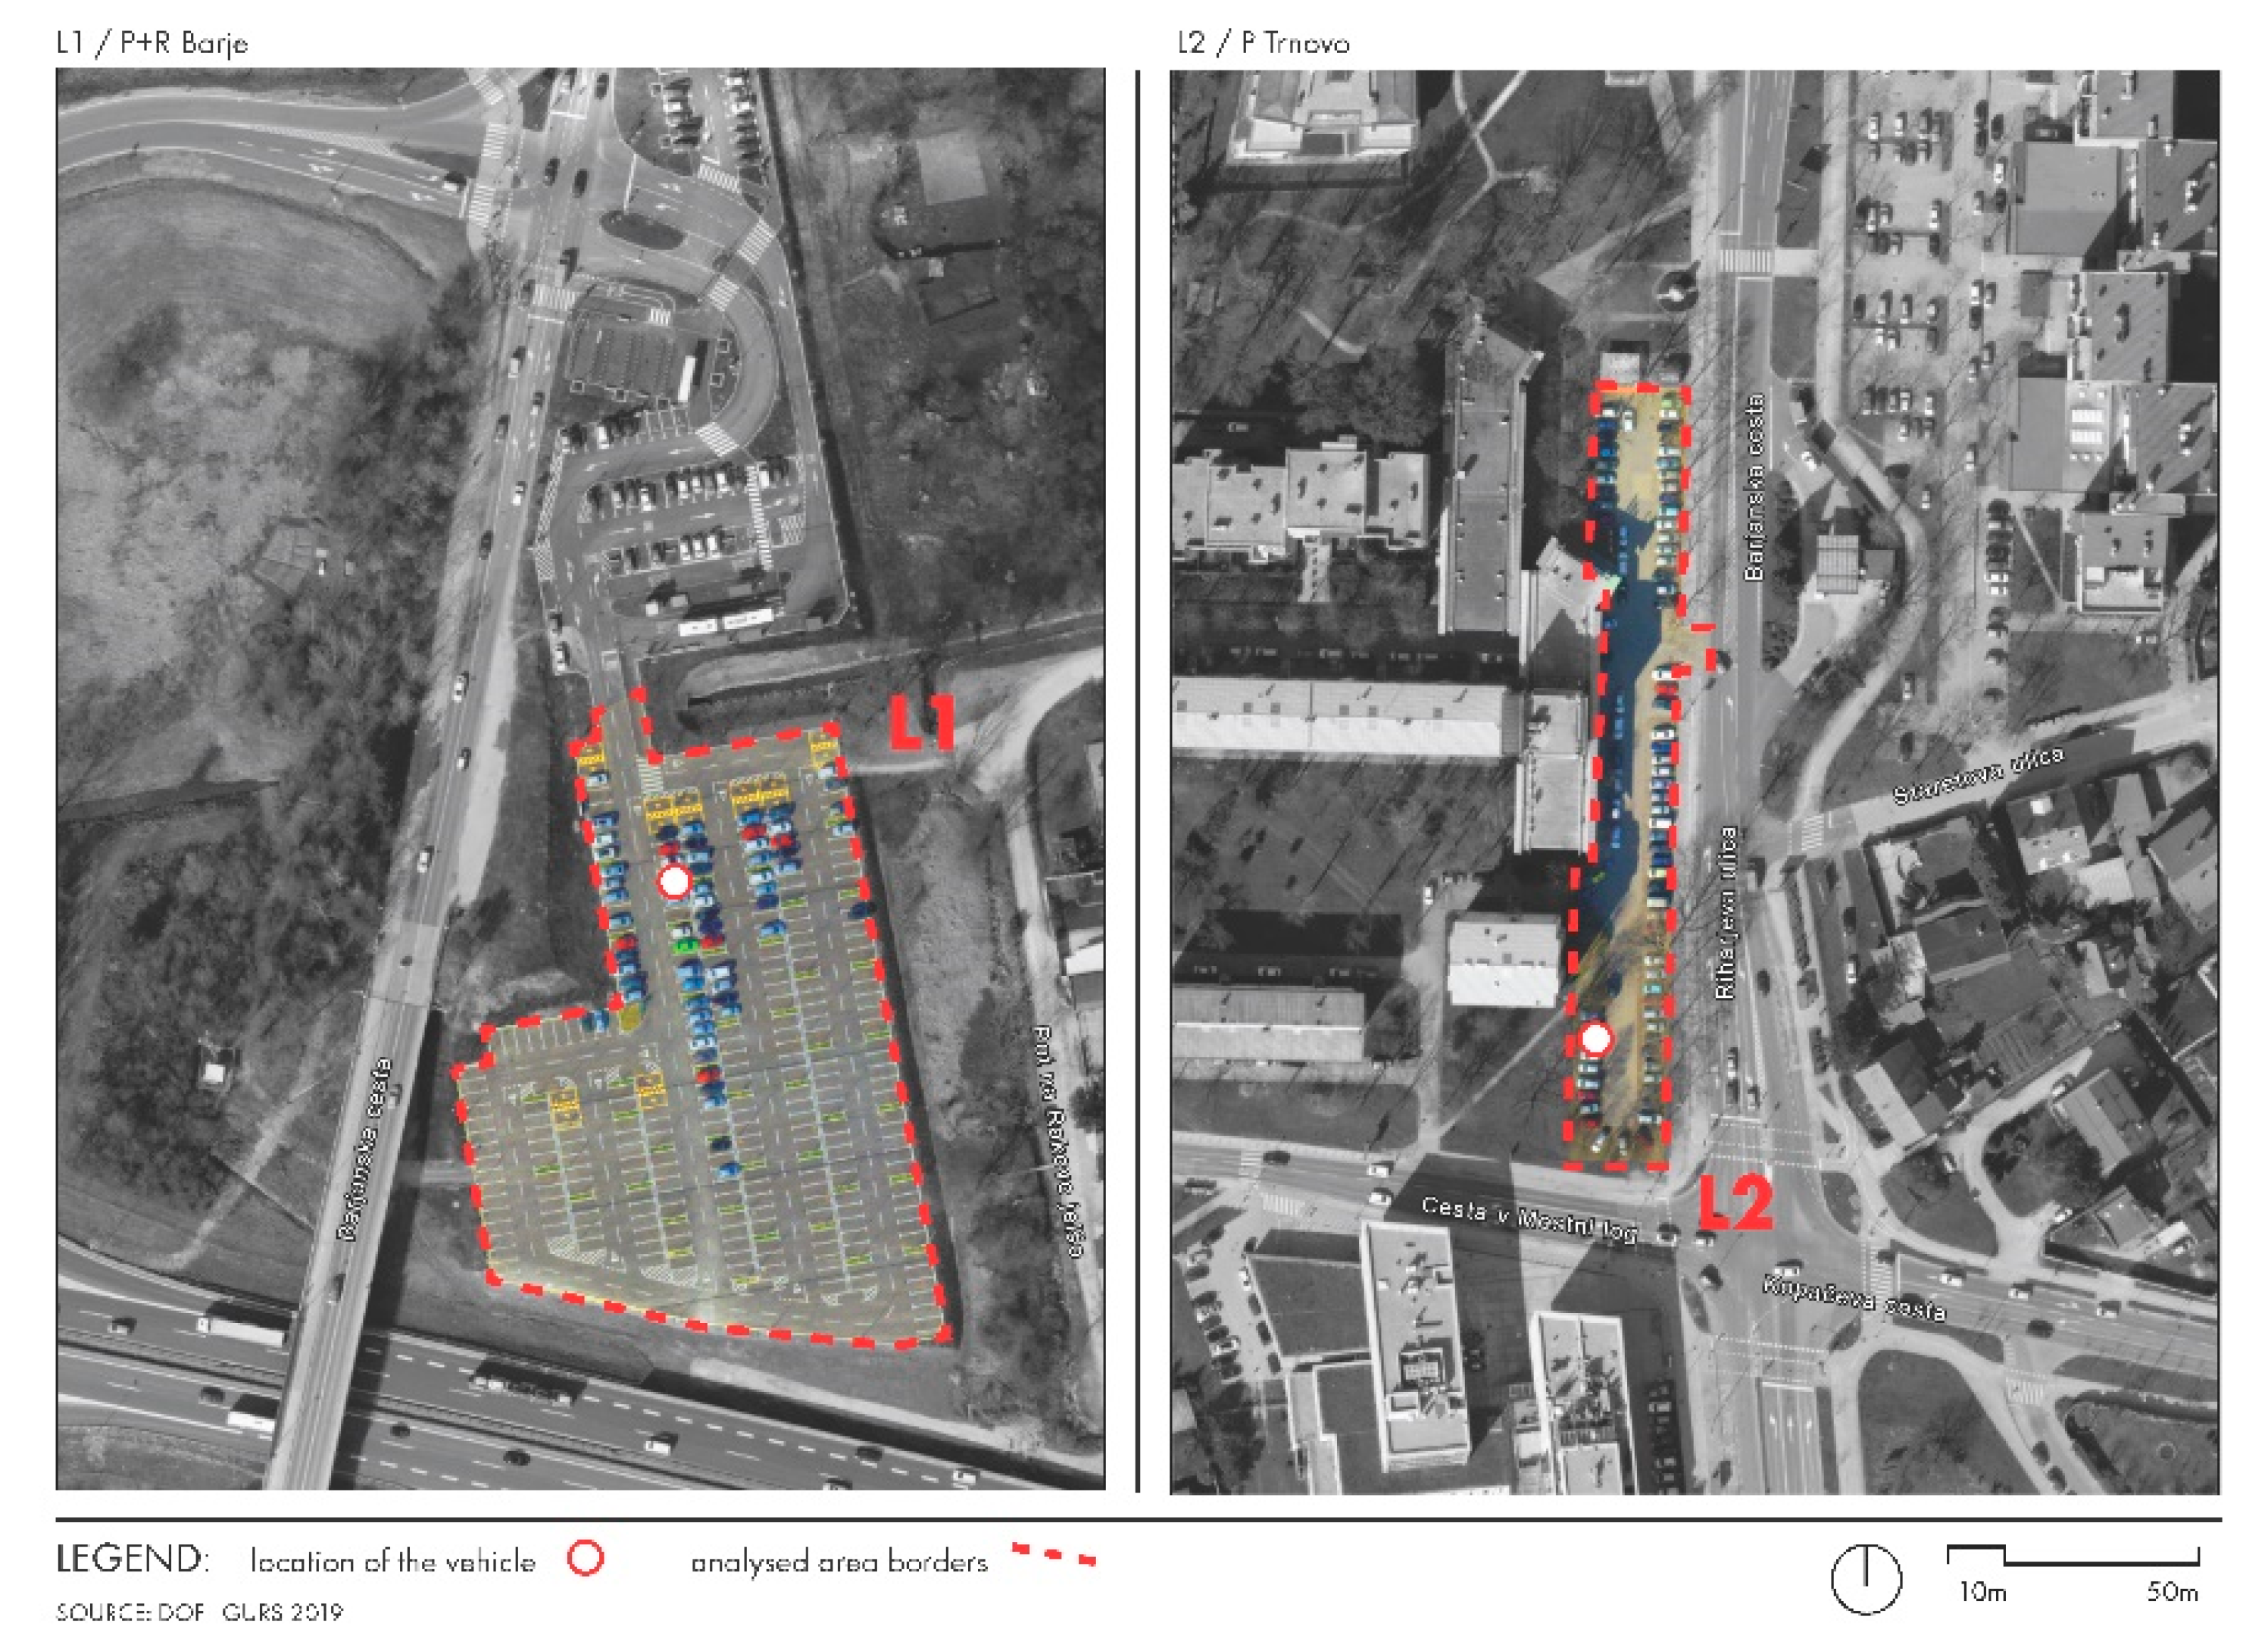
- Remote sensing images: Google satellite images of P + R Barje (L1) and Trnovo parking (L2) [38] (Figure 2) and orthophoto images from the remote sensing database, sheet orthophotos DOF050 2018 [36] were used. Remote sensing data were used for a manual line-art drawing of the spatial situation in Autodesk AutoCAD 2019. Furthermore, we elaborated a spatial representation of the P + R Barje parking area. Sheets of DOF050 images covering the area were combined and clipped to the study area using ESRI ArcGIS 10.6 and the ArcToolbox clip tool.
- The ENVI-met [39] database of materials and 3D vegetation was used in ENVI-met SCIENCE in ENVI-met SPACES for the manual drawing of the cell map in the size of 100 × 100 × 20 pixels. We mapped the existing vegetation and surfaces using input cartographic data. The selection of materials and surrounding vegetation reflected the actual conditions in the area. The choice of vegetation in the parking area varied in the variant solutions.
- Temperature measurements were taken in vehicle cabins at parking areas P + R Barje (L1) and Trnovo parking (L2) under various temperature and weather conditions (June–August, 2018).
- In situ observations and analysis were conducted with fieldwork and photographic recording (May, 2018–August, 2019).
2.3. Preliminary Research
2.4. Elaboration of Greening Scheme Models at P + R Sites
3. Results
3.1. Preliminary Research Outcome
- the difference between outdoor morning temperature at locations L1 (strongly sun-exposed P + R Barje) and L2 (well-landscaped Trnovo parking), measured at 8.00 a.m., was small (from 0.4 °C min. to 1.4 °C max.);
- the temperature in the cabin of the sun-exposed vehicle at L1 was significantly higher than the temperature in the vehicle in the shade at L2 (both were measured at 2.00 p.m. during the whole examination period);
- on July 7 at 2.00 p.m., the temperature in the cabin of the vehicle parked at the exposed lot L1 was high even in partly cloudy weather;
- on 29 June, 3 July, and 4 July at 2.00 p.m., the temperature in the cabin of the car parked at L1 reached a dangerous level despite the more favorable external conditions (cloudy weather and milder outside air temperature) (Table 1);
- at 2.00 p.m. on the excessively hot day of 7 August, the temperature inside the car parked at L1 was extremely high, thus, endangering the health and well-being of vehicle users.
3.2. Modelling the Greenery at P + R Barje (L1)
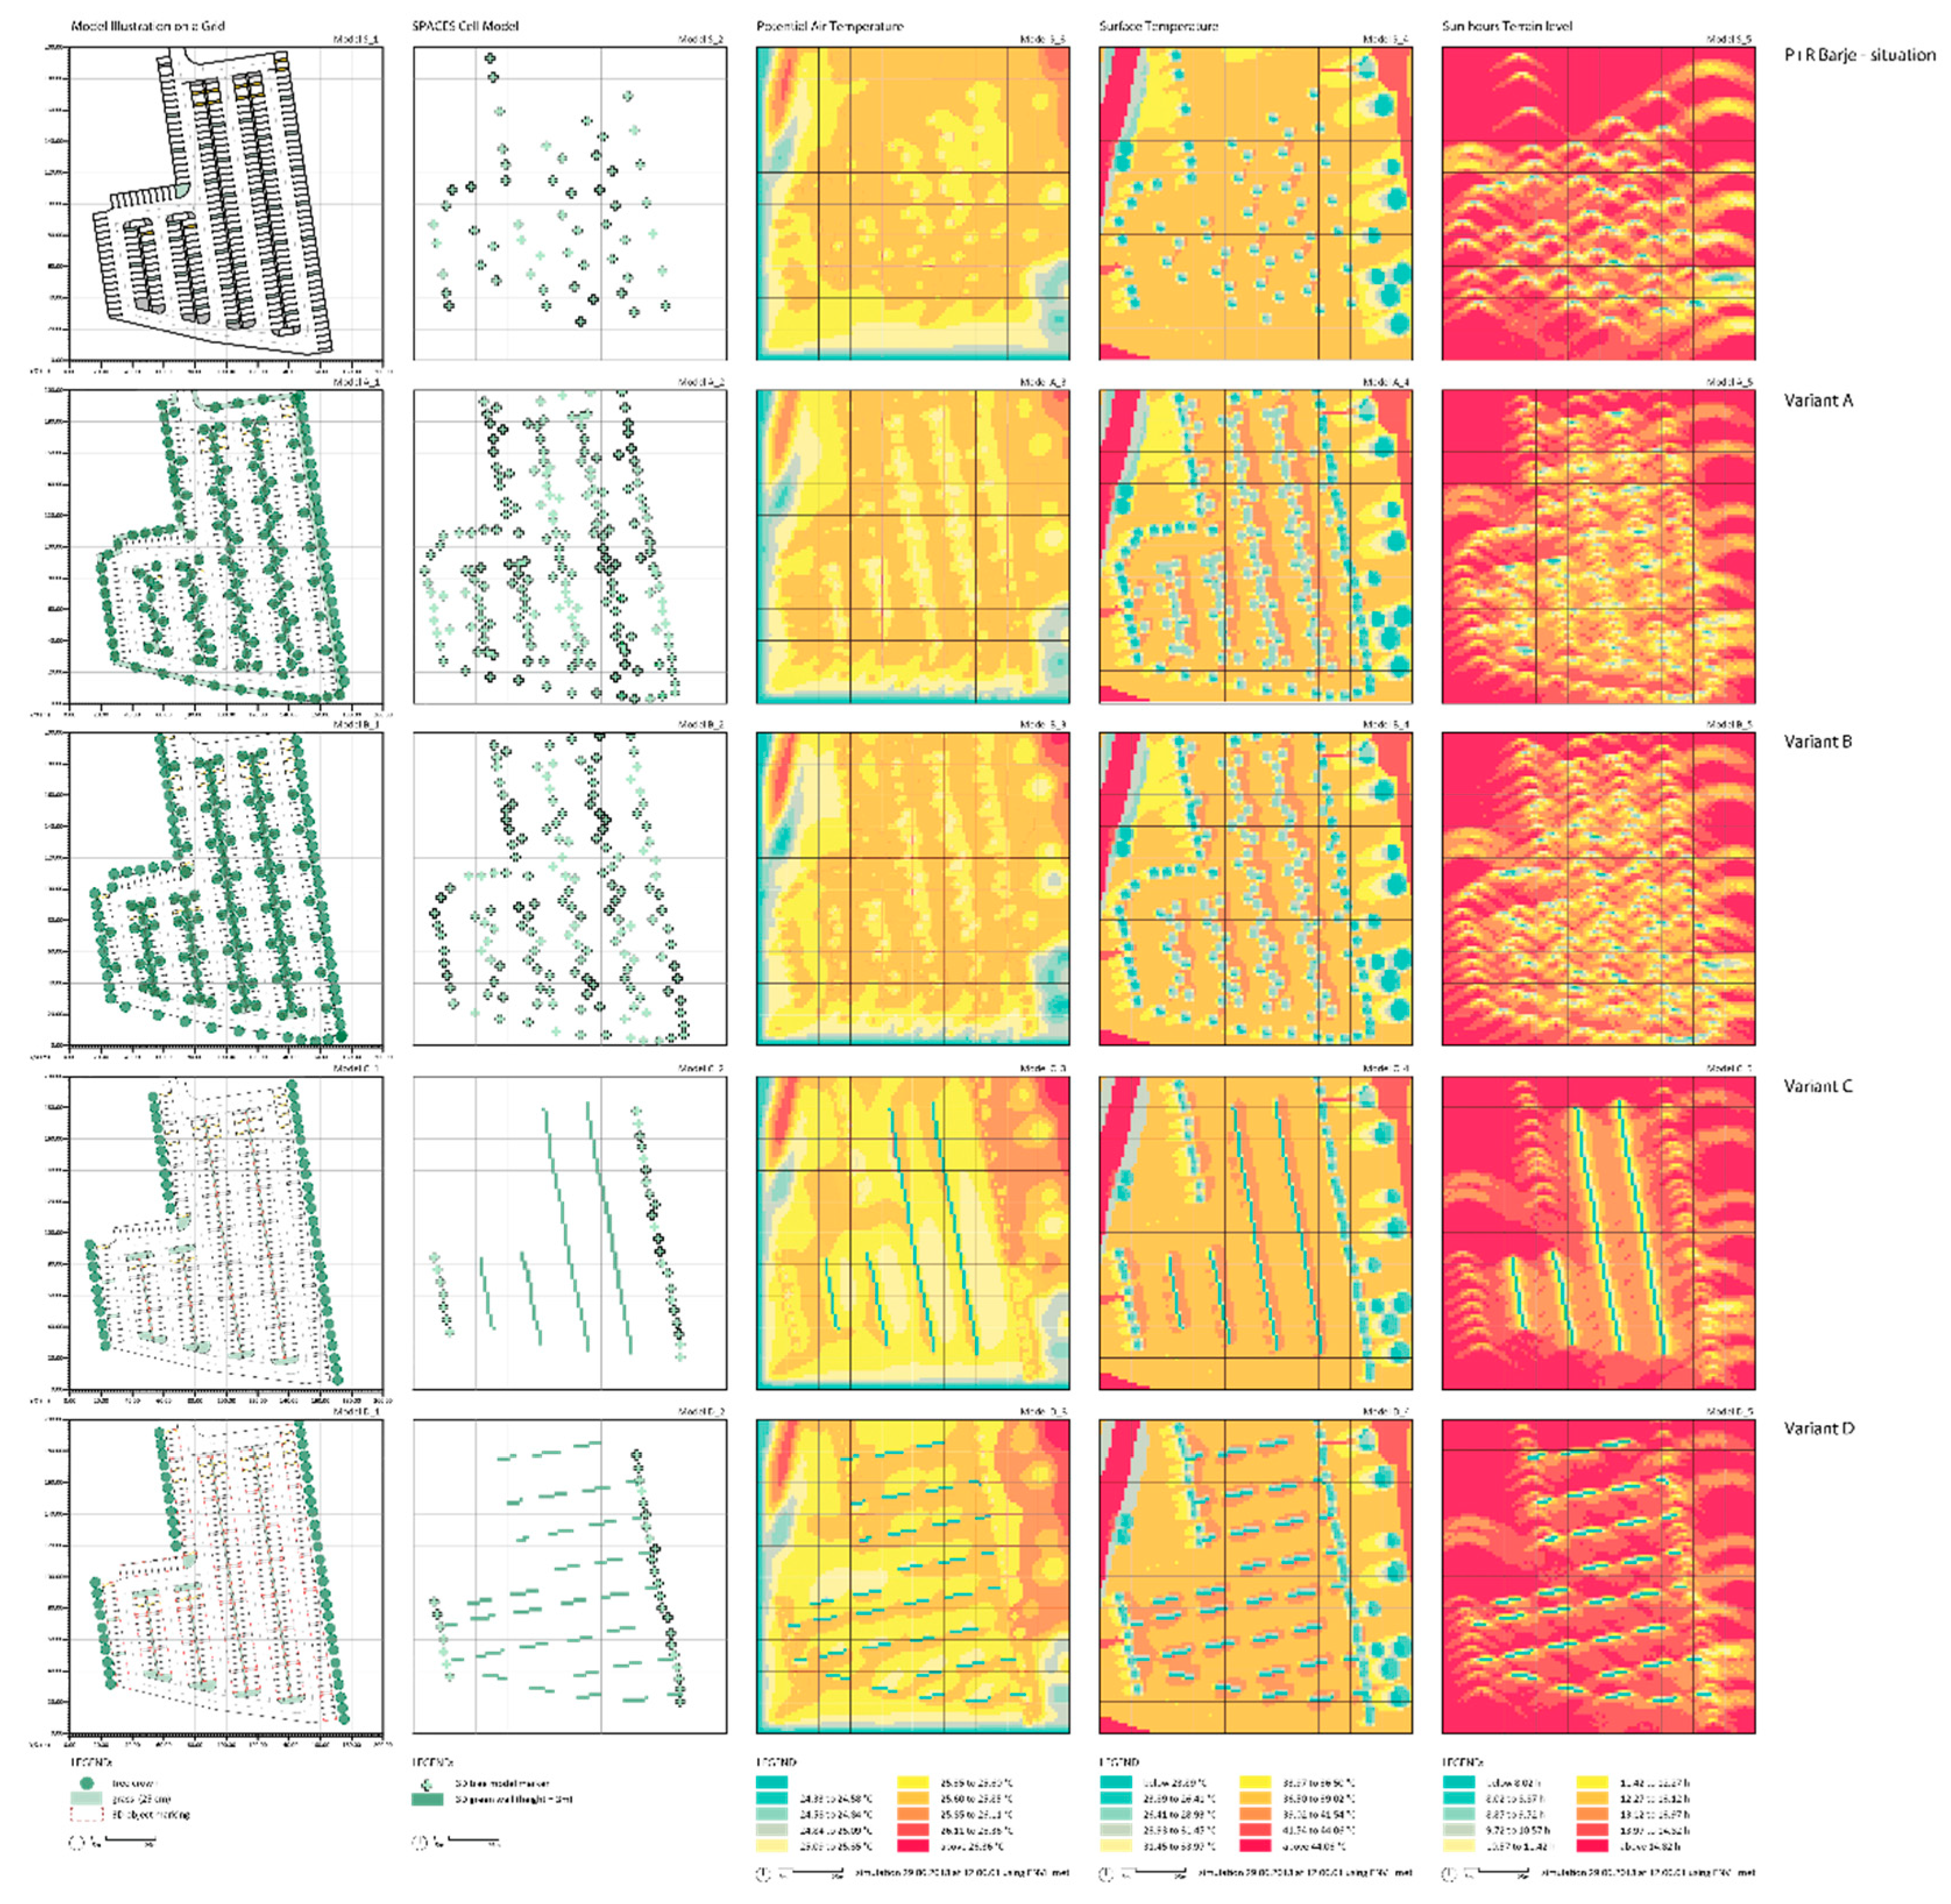
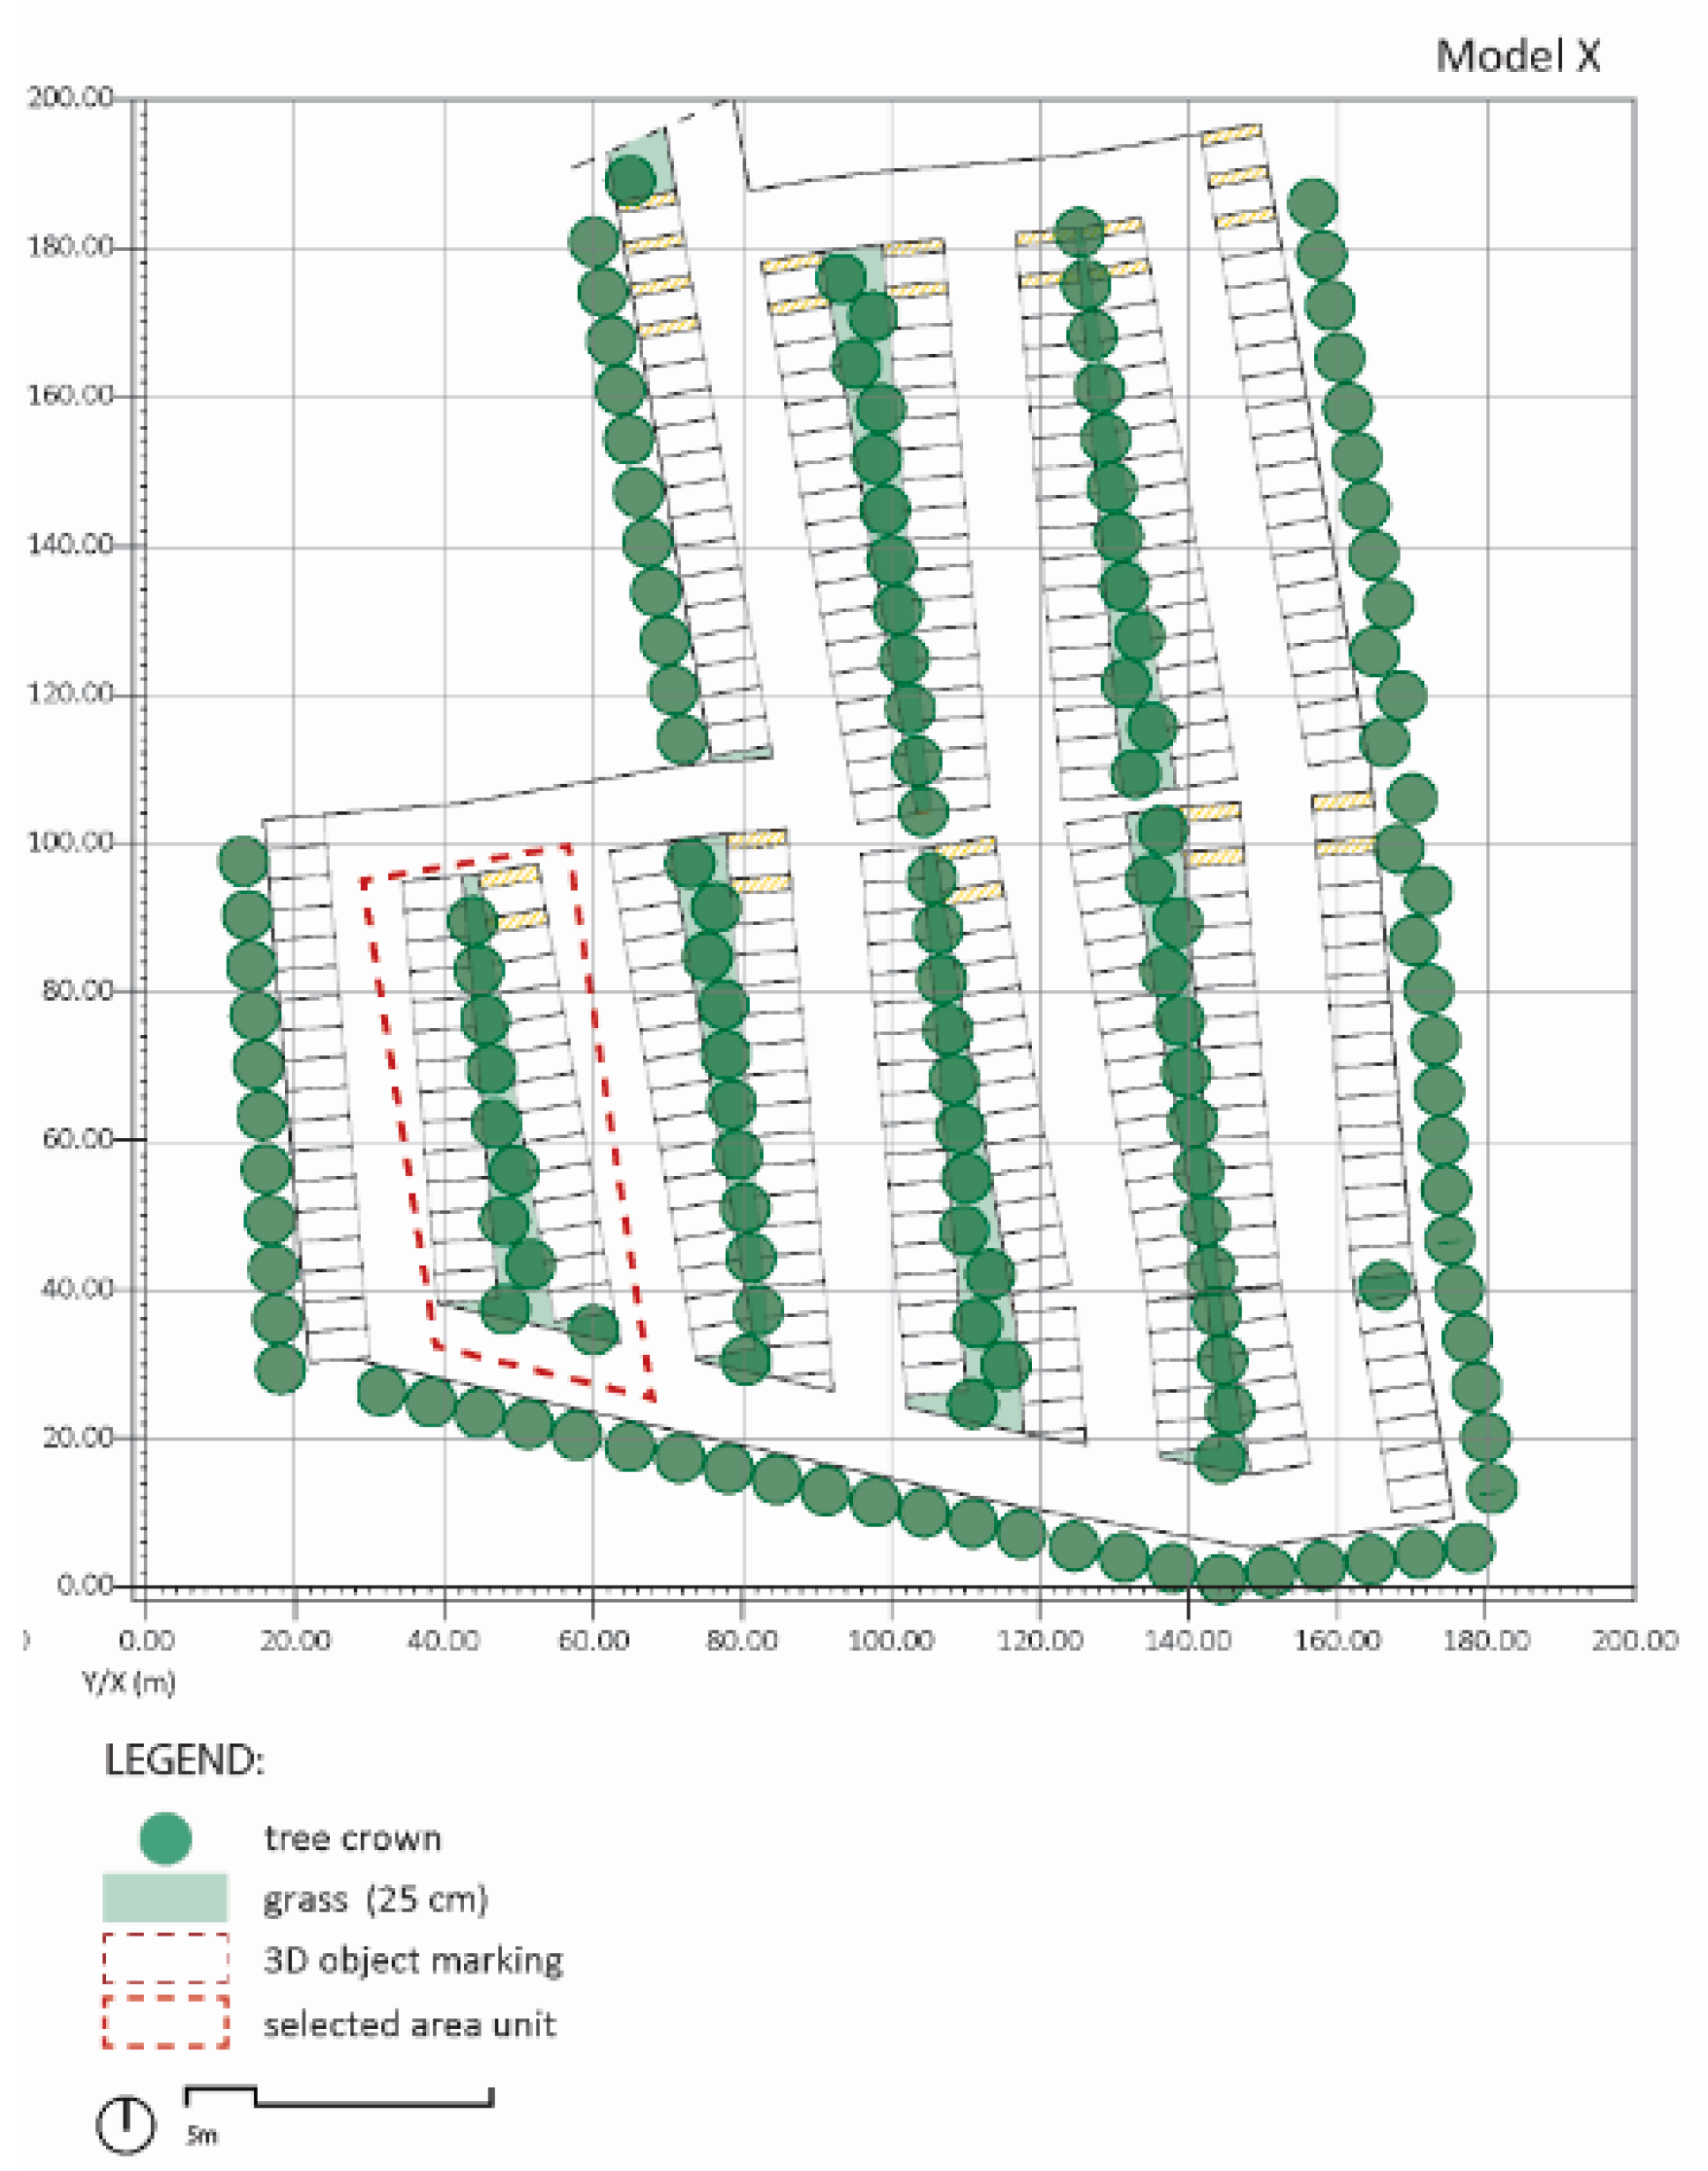
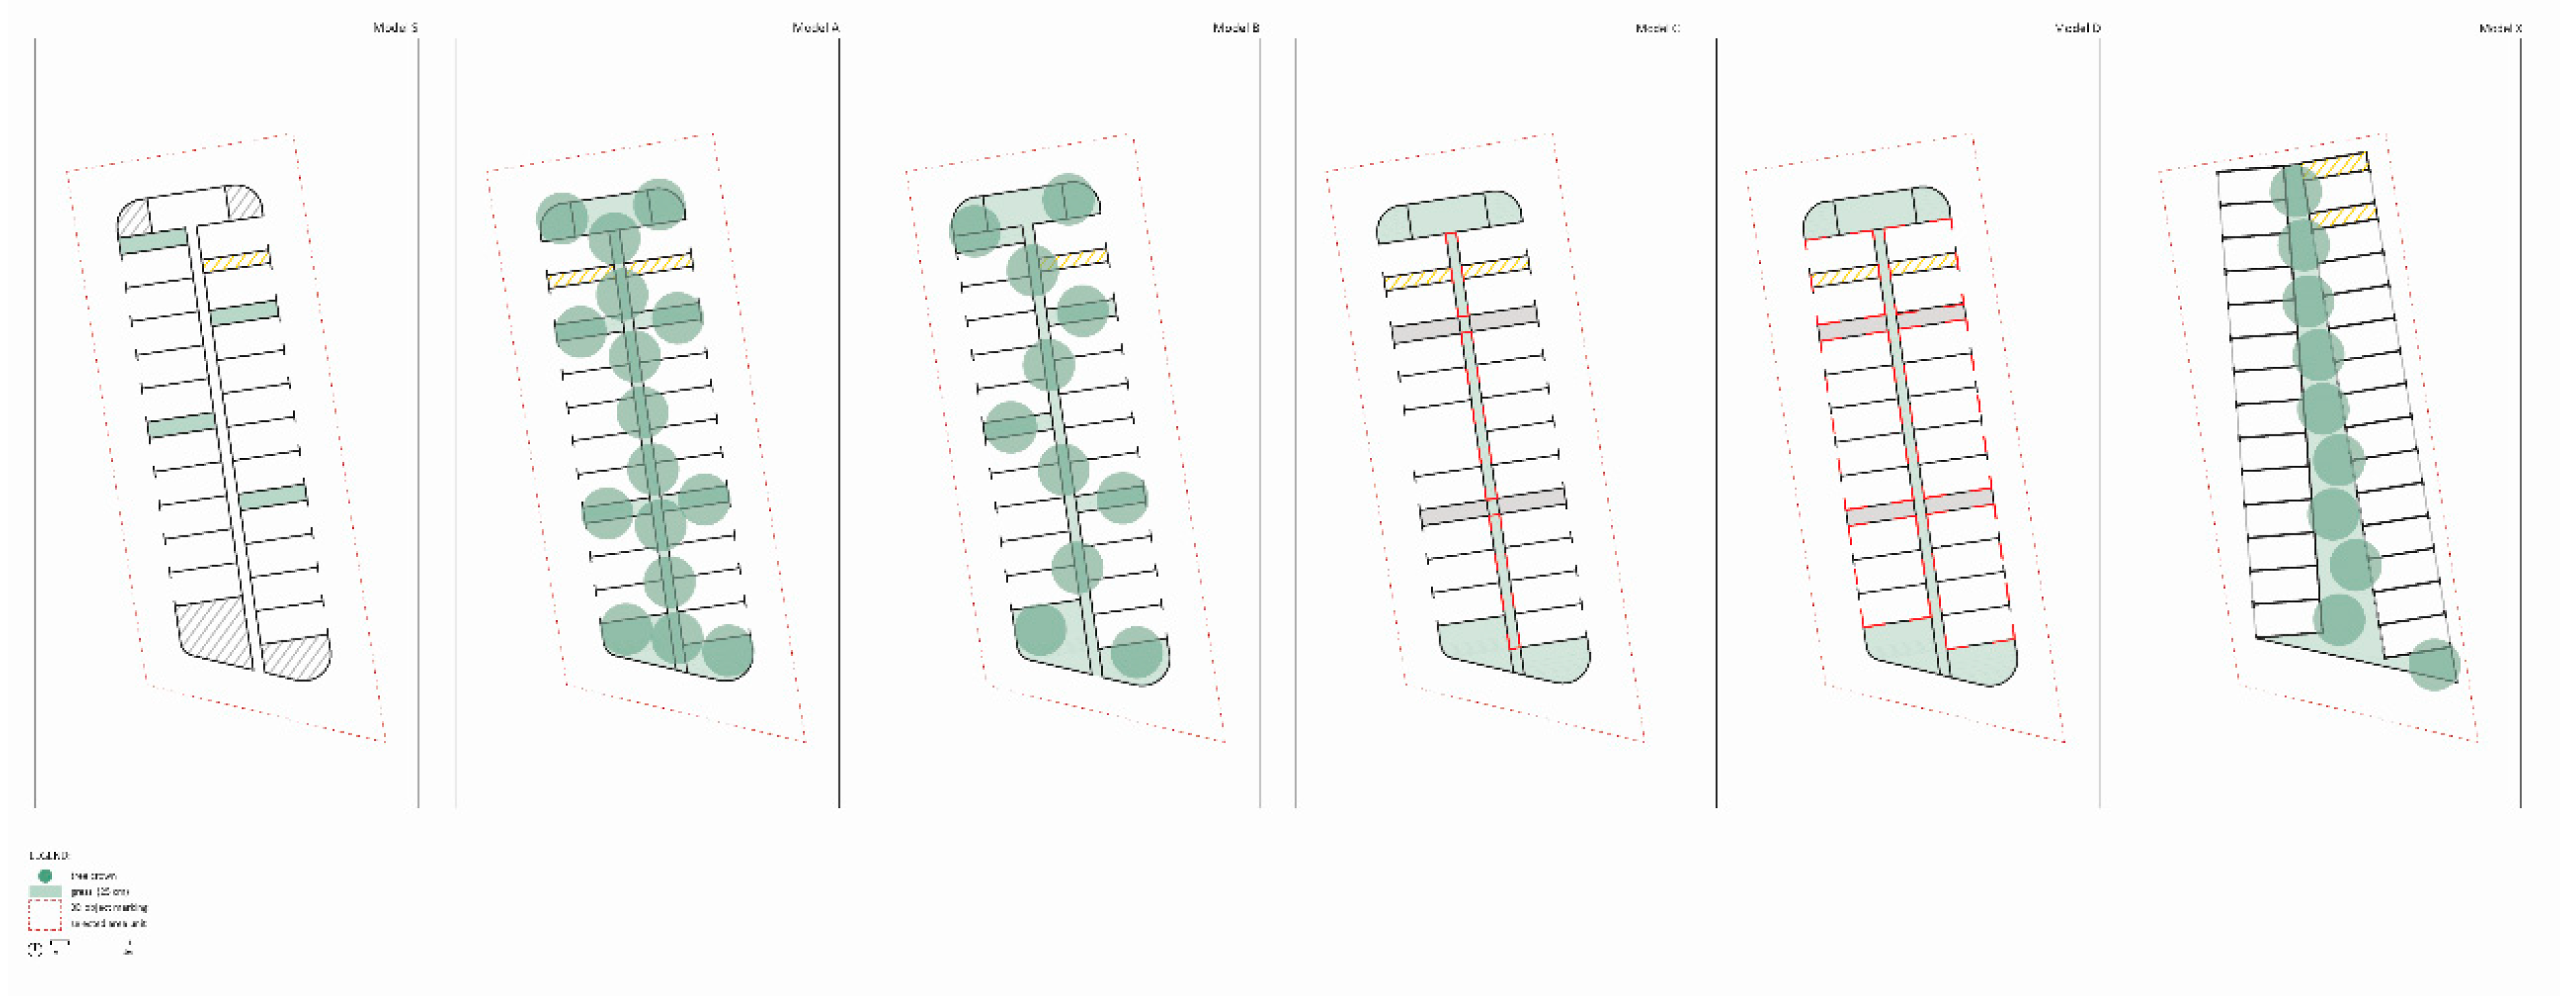
- Model S stands for the current situation at site L1. We included trees (44) that were there in 2018 and are still there now (May 2020). Model S2 did not include the existing large trees outside L1; however, the model detected them (there was, however, no direct impact on the shading, depiction Model S3, while there was an impact on temperatures in Model S4).
- Model A presents the variant of tree densification in direction N–S (between the individual lines of parking). Trees in the E–W direction were added. The parking design affected the reorganization of the individual parking areas, which was still five parking spaces per unit. In Model A5 (in Table 5), we see that the shading was distributed evenly, meaning that there were several quality conditions of shading the parking areas. According to Model A3, we found that higher temperatures were evenly distributed across the parking area. This was the result of an increased number of trees and airflow stabilization. In this case, the number of trees did not bring about a reduction in temperatures.
- Model B also presents the variant of tree densification in the N–S direction, but with additional trees along a zigzagging line, with one tree per five parking spaces, switching to the East and West orientation. The design of the parking was not affected by this; the parking spaces remained organized in groups of five. The variant had an interesting composition, but in the horizontal direction, it created major islands without trees (compared to Model A), causing less favorable shading with trees and a poorer distribution of quality parking spaces.
- Model C involved green walls between the parking lines in a N–S direction. The design of the parking remained the same, while a passage between the groups of five parking spaces must be provided. The model confirmed the thesis that green walls favorably affect air temperatures; however, in the sense of creating well-shaded parking areas (Model C5), it was less effective than Model A5 and B5. Interestingly, with this positioning, we managed to avoid all the worst shading positions. This variant also significantly affected the lowering of temperatures as, compared to Model A and B, the temperatures were, on average, lower by 2 °C.
- Model D was an organization variant of the parking area, with walls installed in the E–W direction. The parking area design was not changed with this; the discontinuity of the green wall between the groups of five parking spaces was not necessary. The model negated the vision of the significance of green walls, as shades in Model D5 were positioned the worst compared to all the previous models. The importance of the orientation of the greening element related to the rate of sunshine (sun hours) was confirmed. Air temperatures were less favorable in Model D3 than in Model C and Model C3 (which was related to the element of the green wall in N–S orientation).
4. Discussion
5. Conclusions
Author Contributions
Funding
Conflicts of Interest
References
- De la Barrera, F.; Henríquez, C. Monitoring the change in urban vegetation in 13 Chilean cities located in a rainfall gradient. What is the contribution of the widespread creation of new urban parks? Conf. Ser. Mater. Sci. Eng. 2017, 245, 72023. [Google Scholar] [CrossRef] [Green Version]
- McCarthy, M.P.; Best, M.J.; Betts, R.A. Climate change in cities due to globalwarming and urban effects. Geophys. Res. Lett. 2010, 37, 1–5. [Google Scholar] [CrossRef] [Green Version]
- Arnds, D.; Böhner, J.; Bechtel, B. Spatio-temporal variance and meteorological drivers of the urban heat island in a European city. Theor. Appl. Climatol. 2015, 128, 43–61. [Google Scholar] [CrossRef]
- Guerreiro, S.B.; Dawson, R.J.; Kilsby, C.; Lewis, E.; Ford, A. Future heat-waves, droughts and floods in 571. European cities. Environ. Res. Lett. 2018, 13, 034009. [Google Scholar] [CrossRef]
- Smid, M.; Russo, S.; Costa, A.C.; Granell, C.; Pebesma, E. Ranking European capitals by exposure to heat waves and cold waves. Urban Clim. 2019, 27, 388–402. [Google Scholar] [CrossRef]
- De Roo, M.; Roozen, N. The Green City Guidelines. Techniques for a Healthy Liveable City; Zwaan Printmedia: Wormerveer, The Netherlands, 2011; Available online: http://aiph.org/wp-content/uploads/2015/04/Green%20City%20-%20Guidelines.pdf (accessed on 20 April 2020).
- Oliveira, S.; Andrade, H.; Vaz, T. The cooling effect of green spaces as a contribution to the mitigation of urban heat: A case study in Lisbon. Build. Environ. 2011, 46, 2186–2194. [Google Scholar] [CrossRef]
- Afzan Buyadi, S.N.; Wan Mohd, W.M.N.; Misni, A. Green Spaces Growth Impact on the Urban Microclimate. Procedia Soc. Behav. Sci. 2013, 105, 547–557. [Google Scholar] [CrossRef] [Green Version]
- Huang, C.; Ye, X. Spatial Modeling of Urban Vegetation and Land Surface Temperature: A Case Study of Beijing. Sustainability 2015, 7, 9478–9504. [Google Scholar] [CrossRef] [Green Version]
- Irman, H.M.; Kala, J.; Ng, A.W.M.; Muthukumaran, S. Effectiveness of vegetated patches as Green Infrastructure in mitigating Urban Heat Island effects during a heatwave event in the city of Melbourne. Weather. Clim. Extrem. 2019, 25, 1–14. [Google Scholar] [CrossRef]
- Amani-Beni, M.; Zhang, B.; Xie, G.-D.; Shi, Y. Impacts of Urban Green Landscape Patterns on Land Surface Temperature: Evidence from the Adjacent Area of Olympic Forest Park of Beijing, China. Sustainability 2019, 11, 513. [Google Scholar] [CrossRef] [Green Version]
- Lavtižar, K. Urban Design Embracing the Wind Environment: Bezigrad Neighbourhood Case Study in Ljubljana, Slovenia. Res. Ecol. 2020, 2, 23–31. [Google Scholar] [CrossRef]
- Kosanović, S.; Fikfak, A. Development of criteria for ecological evaluation of private residential lots in urban areas. Energy Build. 2016, 115, 69–77. [Google Scholar] [CrossRef]
- Čok, G. Residential buildings and sustainable development in Slovenia—Stambene zgrade i održivi razvoj u Sloveniji. Prostor 2014, 22, 134–147. Available online: http://hrcak.srce.hr/index.php?show=clanak&id_clanak_jezik=183572 (accessed on 10 April 2020).
- Fikfak, A.; Kosanović, S.; Konjar, M.; Grom, J.P.; Zbašnik-Senegačnik, M. The impact of morphological features on summer temperature variations on the example of two residential neighborhoods in Ljubljana, Slovenia. Sustainability 2017, 9, 122. [Google Scholar] [CrossRef] [Green Version]
- Mueller, N.; Rojas-Rueda, D.; Khreis, H.; Cirach, M.; Andresg, D.; Ballester, J.; Bartollh, X.; Daher, C.; Deluca, A.; Echaveg, C.; et al. Changing the urban design of cities for health: The superblock model. Environ. Int. 2020, 134, 1–13. [Google Scholar] [CrossRef]
- Žaucer, T.; Suhadolc, M.; Prijon, J.; Jeriha, U.; Peterlin, M. P+R Lokacija, Oblikovanje, Oprema; Inštitut za Politike Prostora: Ljubljana, Slovenia, 2014; Available online: http://ipop.si/wp/wp-content/uploads/2010/04/P+R-2016-05-30-lo-res.pdf (accessed on 10 January 2018).
- Bajsanski, I.; Stojakovic, V.; Jovanovic, M. Effect of tree location on mitigating parking lot insolation. Comput. Environ. Urban Syst. 2016, 56, 59–67. [Google Scholar] [CrossRef]
- O’Malley, C.; Piroozfarb, P.A.E.; Farr, E.R.P.; Gates, J. An investigation into minimizing urban heat island (UHI) effects: A UK perspective. Energy Procedia 2014, 62, 72–80. [Google Scholar] [CrossRef] [Green Version]
- Srivanit, M.; Kazunori, H. The Influence of Urban Morphology Indicators on Summer Diurnal Range of Urban Climate in Bangkok Metropolitan Area, Thailand. Int. J. Civ. Environ. Eng. 2011, 11, 34–46. Available online: http://www.ijens.org/Vol_11_I_05/112805-7676-IJCEE-IJENS.pdf (accessed on 24 November 2016).
- Venter, Z.S.; Krog, N.H.; Barton, D.N. Linking green infrastructure to urban heat and human health riskmitigation in Oslo, Norway. Sci. Total Environ. 2020, 709, 1–10. [Google Scholar] [CrossRef]
- Grundstein, A.; Meentemeyer, V.; Dowd, J. Maximum vehicle cabin temperatures under different meteorological conditions. Int. J. Biometeorol. 2009, 53, 255–261. [Google Scholar] [CrossRef]
- McLaren, C.; Null, J.; Quinn, J. Heat stress from enclosed vehicles: Moderate ambient temperatures causes significant temperature rise in enclosed vehicles. Pediatrics 2005, 116, e109–e112. Available online: https://pediatrics.aappublications.org/content/pediatrics/116/1/e109.full.pdf (accessed on 26 April 2020). [CrossRef] [Green Version]
- Marty, W.T.; Sigrist, T.; Wyler, D. Temperature variations in automobiles in various weather conditions: An experimental contribution to the determination of time of death. Am. J. Forensic Med. Pathol. 2001, 22, 215–219. [Google Scholar] [CrossRef] [PubMed]
- Lenzuni, P.; Capone, P.; Freda, D.; del Gaudio, M. Is driving in a hot vehicle safe? Int. J. Hyperther. 2014, 30, 250–257. [Google Scholar] [CrossRef] [PubMed]
- Hancock, P.A.; Vasmatzidis, I. Effects of heat stress on cognitive performance: The current state of knowledge. Int. J. Hyperther. 2003, 19, 355–372. [Google Scholar] [CrossRef] [PubMed]
- Sun, G.; Yang, X.; Jiang, Q.; Liu, K.; Li, L. Hyperthermia impairs the executive function using the attention network test. Int. J. Hyperther. 2012, 28, 621–626. [Google Scholar] [CrossRef]
- Wyon, D.P.; Wyon, I.; Norin, F. Effects of moderate heat stress on driver vigilance in a moving vehicle. Ergonomics 1996, 39, 61–75. [Google Scholar] [CrossRef]
- Alavipanah, S.; Wegmann, M.; Qureshi, S.; Weng, Q.; Koellner, T. The Role of Vegetation in Mitigating Urban Land Surface Temperatures: A Case Study of Munich, Germany during the Warm Season. Sustainability 2015, 7, 4689–4706. [Google Scholar] [CrossRef] [Green Version]
- Onishi, A.; Cao, X.; Ito, T.; Shi, F.; Imura, H. Evaluating the potential for urban heat-island mitigation by greening parking lots. Urban For. Urban Green. 2010, 9, 323–332. [Google Scholar] [CrossRef]
- Gillner, S.; Vogt, J.; Tharang, A.; Dettmann, S.; Roloff, A. Role of street trees in mitigating effects of heat and drought at highly sealed urban sites. Landsc. Urban Plan. 2015, 143, 33–42. [Google Scholar] [CrossRef]
- Statistical Office of the Republic of Slovenia. SI-Stat Data Portal. Available online: http://www.stat.si/eng/index.asp (accessed on 29 April 2020).
- European Commission. Environment, European Green Capital. Available online: https://ec.europa.eu/environment/europeangreencapital/winning-cities/2016-ljubljana/ (accessed on 29 April 2020).
- City of Ljubljana. Integrated Transport Strategy. Available online: https://www.ljubljana.si/sl/moja-ljubljana/promet-in-mobilnost/javni-prevoz/ (accessed on 21 June 2020).
- City of Ljubljana. P+R Parkings. Available online: https://www.ljubljana.si/sl/moja-ljubljana/ljubljana-zate/pregled-vseh-projektov/parkirisca-p-r/ (accessed on 21 June 2020).
- Ministry of Environment and Spatial Planning, Surveying and Mapping Authority of the Republic of Slovenia. E-Suraying Data. Available online: https://www.gov.si/en/state-authorities/bodies-within-ministries/surveying-and-mapping-authority/ (accessed on 25 April 2020).
- USGS Science for a Changing World. Landsat Missions. Available online: https://www.usgs.gov/land-resources/nli/landsat (accessed on 10 April 2020).
- Google Maps. Available online: https://www.google.si/maps (accessed on 6 April 2020).
- ENVI-Met. Available online: https://www.envi-met.com/ (accessed on 28 April 2020).
- Chatzinikolaou, E.; Chalkias, C.; Dimopoulou, E. Urban microclimate improvement using ENVI-met climate model. Int. Arch. Photogramm. Remote Sens. Spatial Inf. Sci. 2018, 42, 69–76. [Google Scholar] [CrossRef] [Green Version]
- Bruse, M. Die Auswirkungen kleinskaliger Umweltgestaltung auf das Mikroklima. Entwicklung des Prognostischen Numerischen Modells ENVI-met zur Simulation der Wind-, Temperatur- und Feuchteverteilung in Stadtischen Strukturen. Ph.D. Thesis, Ruhr-Universität, Bochum, Germany, 1999. [Google Scholar]
- Ministry of the Environment and Spatial Planning; Slovenian Environmental Agency. Meteorološke Postaje Ljubljana Bežigrad. Available online: https://meteo.arso.gov.si/met/en/ (accessed on 28 April 2020).
- Cegnar, T. Podnebne razmere v juniju 2018. Naše Okolje 2018, 6, 3. Available online: https://www.arso.gov.si/o%20agenciji/knji%c5%benica/mese%c4%8dni%20bilten/NASE%20OKOLJE%20-%20Junij%202018.pdf (accessed on 28 April 2020).
- Cegnar, T. Podnebne razmere v juliju 2018. Naše Okolje 2018, 7, 3. Available online: https://www.arso.gov.si/o%20agenciji/knji%c5%benica/mese%c4%8dni%20bilten/NASE%20OKOLJE%20-%20Julij%202018.pdf (accessed on 28 April 2020).
- Cegnar, T. Podnebne razmere v juliju 2018. Naše Okolje 2018, 8, 3. Available online: https://www.arso.gov.si/o%20agenciji/knji%c5%benica/mese%c4%8dni%20bilten/NASE%20OKOLJE%20-%20Avgust%202018.pdf (accessed on 28 April 2020).
- Nieuwenhuijsen, M.J. Urban and transport planning pathways to carbon neutral, liveable and healthy cities; A review of the current evidence. Environ. Int. 2020. [Google Scholar] [CrossRef]
- Song, X.P.; Tan, P.Y.; Edwards, P.; Richards, D. The economic benefits and costs of trees in urban forest stewardship: A systematic review. Urban For. Urban Green. 2018, 29, 162–170. [Google Scholar] [CrossRef]


| P + R Barje L1 | Trnovo Parking L2 | ||||||||
|---|---|---|---|---|---|---|---|---|---|
| Weather | Day | Hour | OUT. | INS. | Weather | Day | Hour | OUT. | INS. |
 | 29.6.2018 | 8.00 a.m. | 16.4 °C | 20.9 °C |  | 29.6.2018 | 8.00 a.m. | 16.9 °C | 21.2 °C |
 | 2.00 p.m. | 29.1 °C | 38.4 °C |  | 2.00 p.m. | 20.7 °C | 26.2 °C | ||
 | 3.7.2018 | 8.00 a.m. | 21.3 °C | 26.3 °C |  | 3.7.2018 | 8.00 a.m. | 20.3 °C | 23.6 °C |
 | 2.00 p.m. | 28.9 °C | 48.8 °C |  | 2.00 p.m. | 25.9 °C | 33.8 °C | ||
 | 4.7.2018 | 8.00 a.m. | 19.8 °C | 25.6 °C |  | 4.7.2018 | 8.00 a.m. | 18.4 °C | 23.4 °C |
 | 2.00 p.m. | 25.3 °C | 44.9 °C |  | 2.00 p.m. | 24.4 °C | 25.8 °C | ||
 | 5.7.2018 | 8.00 a.m. | 19.2 °C | 25.1 °C |  | 5.7.2018 | 8.00 a.m. | 19.7 °C | 25.1 °C |
 | 2.00 p.m. | 31.5 °C | 53.5 °C |  | 2.00 p.m. | 31.8 °C | 33.5 °C | ||
 | 2.8.2018 | 8.00 a.m. | 25.1 °C | 26.2 °C |  | 2.8.2018 | 8.00 a.m. | 25.1 °C | 26.1 °C |
 | 2.00 p.m. | 33.0 °C | 46.5 °C |  | 2.00 p.m. | 30.0 °C | 33.5 °C | ||
 | 7.8.2017 | 8.00 a.m. | 21.3 °C | 27.0 °C |  | 7.8.2017 | 8.00 a.m. | 21.3 °C | 27.0 °C |
 | 2.00 p.m. | 35.5 °C | 59.1 °C |  | 2.00 p.m. | 33.5 °C | 38.1 °C | ||
| Input Data | |
|---|---|
| Latitude and longitude | 46–14.5 |
| Time zone | (GMT + 2) |
| Start and duration of simulation | 05:00; 24 h |
| Date of simulation | 29/6/2018 |
| Wind speed at a height of 2 m | 1.1 m/s |
| Wind direction | 225° |
| Min. air temperature at a height of 2 m | 15 °C |
| Max. air temperature at a height of 2 m | 29 °C |
| Relative air humidity at a height of 2 m | 62% |
| Tree model albedo | A generic-deciduous-tree |
| Tree ID | 01CMSS |
| Canopy geometry (m) | 3 × 3 × 5 |
| Tree albedo | 0.12 |
| SPACES wall model | Generic wall |
| Wall ID | 100MI |
| Type of green areas | mixed substratum |
| Greening ID | 01AGDS |
| Green wall albedo | 0.2 |
| Variant Name | Variant ID Tag | Sun Hours (Terrain Level) | Number of Parking Units | Sun Hours Area (m2) | Combined Shade Footprint (m2) 2–10 h |
|---|---|---|---|---|---|
| Situation | 5S_UHI | below 8.87 h | 2 | 25 | 2312 |
| 8.87 to 10.57 h | 30 | 375 | |||
| 10.57 to 12.27 h | 60 | 750 | |||
| 12.27 to 13.97 h | 93 | 1162.5 | |||
| above 13.97 h | 82 | 1025 | |||
| Model A | 5A_UHI | below 8.87 h | 2 | 25 | 2987 |
| 8.87 to 10.57 h | 43 | 537.5 * | |||
| 10.57 to 12.27 h | 141 | 1762.5 * | |||
| 12.27 to 13.97 h | 53 | 662.5 | |||
| above 13.97 h | 28 | 350 | |||
| Model B | 5B_UHI | below 8.87 h | 16 | 200 * | 2900 |
| 8.87 to 10.57 h | 39 | 487.5 | |||
| 10.57 to 12.27 h | 92 | 1150 | |||
| 12.27 to 13.97 h | 85 | 1062.5 | |||
| above 13.97 h | 35 | 437.5 | |||
| Model C | 5C_UHI | below 8.87 h | 0 | 0 | 2700 |
| 8.87 to 10.57 h | 19 | 237.5 | |||
| 10.57 to 12.27 h | 82 | 1025 | |||
| 12.27 to 13.97 h | 115 | 1562.5 * | |||
| above 13.97 h | 51 | 512.5 | |||
| Model D | 5D_UHI | below 8.87 h | 13 | 162.5 | 1312 |
| 8.87 to 10.57 h | 28 | 350 | |||
| 10.57 to 12.27 h | 8 | 100 | |||
| 12.27 to 13.97 h | 56 | 700 | |||
| above 13.97 h | 162 | 2025 * |
| Variant Name | Variant ID Tag | Potential Air Temperature | Number of Parking Units | Parking Units Area (m2) |
|---|---|---|---|---|
| Situation | 5S_UHI | below 24.33 °C | 0 | 0 |
| 24.33 °C to 25.09 °C | 0 | 0 | ||
| 25.09 °C to 25.85 °C | 74 | 925 | ||
| 25.85 °C to 26.36 °C | 177 | 2212.5 | ||
| above 26.36 °C | 16 | 200 | ||
| Model A | 5A_UHI | below 24.33 °C | 0 | 0 |
| 24.33 °C to 25.09 °C | 0 | 0 | ||
| 25.09 °C to 25.85 °C | 64 | 800 | ||
| 25.85 °C to 26.36 °C | 168 | 2100 | ||
| above 26.36 °C | 35 | 437.5 | ||
| Model B | 5B_UHI | below 24.33 °C | 0 | 0 |
| 24.33 °C to 25.09 °C | 0 | 0 | ||
| 25.09 °C to 25.85 °C | 72 | 900 | ||
| 25.85 °C to 26.36 °C | 153 | 1912.5 | ||
| above 26.36 °C | 42 | 525 | ||
| Model C | 5C_UHI | below 24.33 °C | 9 | 112.5 |
| 24.33 °C to 25.09 °C | 10 | 1250 | ||
| 25.09 °C to 25.85 °C | 233 | 2912.5 | ||
| 25.85 °C to 26.36 °C | 15 | 187.5 | ||
| above 26.36 °C | 0 | 0 | ||
| Model D | 5D_UHI | below 24.33 °C | 4 | 50 |
| 24.33 °C to 25.09 °C | 28 | 350 | ||
| 25.09 °C to 25.85 °C | 182 | 2275 | ||
| 25.85 °C to 26.36 °C | 48 | 600 | ||
| above 26.36 °C | 5 | 625 |
| Greening Scheme | |||||||
|---|---|---|---|---|---|---|---|
| Border Cond. V. | Border Cond. H. | Vertical Distance between Parking Units | Horizontal Distance between Parking Units | Comparable Unit in Length | Unit m2 (Green Area) | Unit m2 (Green Wall) | |
| Model S 3 | 11 | 4 | n/o | 43 * | 3 | 24 | - |
| Model A | 21 + 27 | 11 + 6 | sum 60 | 48 + 13 | 16 | 112.6 | - |
| Model B | 21 + 27 | 11 + 10 | sum 23 | 47 + 11 | 11 | 106 | - |
| Model C | 21 + 27 | n/o | - | - | - | 82.5 | 120 |
| Model D | 21 + 27 | n/o | - | - | - | 82.5 | 174 |
| Model X | 21 + 22 | n/o | sum 60 | 2 | 11 | 119 | - |
© 2020 by the authors. Licensee MDPI, Basel, Switzerland. This article is an open access article distributed under the terms and conditions of the Creative Commons Attribution (CC BY) license (http://creativecommons.org/licenses/by/4.0/).
Share and Cite
Fikfak, A.; Lavtižar, K.; Grom, J.P.; Kosanović, S.; Zbašnik-Senegačnik, M. Study of Urban Greenery Models to Prevent Overheating of Parked Vehicles in P + R Facilities in Ljubljana, Slovenia. Sustainability 2020, 12, 5160. https://doi.org/10.3390/su12125160
Fikfak A, Lavtižar K, Grom JP, Kosanović S, Zbašnik-Senegačnik M. Study of Urban Greenery Models to Prevent Overheating of Parked Vehicles in P + R Facilities in Ljubljana, Slovenia. Sustainability. 2020; 12(12):5160. https://doi.org/10.3390/su12125160
Chicago/Turabian StyleFikfak, Alenka, Kristijan Lavtižar, Janez Peter Grom, Saja Kosanović, and Martina Zbašnik-Senegačnik. 2020. "Study of Urban Greenery Models to Prevent Overheating of Parked Vehicles in P + R Facilities in Ljubljana, Slovenia" Sustainability 12, no. 12: 5160. https://doi.org/10.3390/su12125160
APA StyleFikfak, A., Lavtižar, K., Grom, J. P., Kosanović, S., & Zbašnik-Senegačnik, M. (2020). Study of Urban Greenery Models to Prevent Overheating of Parked Vehicles in P + R Facilities in Ljubljana, Slovenia. Sustainability, 12(12), 5160. https://doi.org/10.3390/su12125160