1. Introduction
Aging drew global attention in the last decade primarily because of the challenges it brings to the labor market [
1] and to public health and economic security, as seen in the recent devastating spread of the COVID-19 pandemic. With decreasing birth rates and increasing life expectancies, the world has witnessed an overall aging process in both developed and developing countries. China, as the most populous country and with the second-largest economy, contributed 15.86% of the world’s total GDP (Data source: World Bank (2018)), with 18.34% of the world population in 2018 (United Nations, 2018). Understanding China’s aging problems could have important socioeconomic implications for other countries. The imbalanced development between urban and rural areas in China across different regions could also result in significant socioeconomic consequences. We study, specifically, China’s aging situation, both domestically and internationally. We qualitatively and quantitatively answer the questions of whether unbalanced regional urban–rural development could influence the disparities in the urban and rural aging process, and also whether the inverted pattern of urban and rural aging has been reversed in some areas.
As a natural process, the aging trend in China may follow a path that is similar to that of other countries, especially those in a similar stage of development (in economic terms) or other East Asian countries (in terms of ethnicity). However, China has several unique social and cultural factors that may differentiate its aging progress and demographic transitional path. First, China has experienced two dramatic fertility rate reversions since the 1960s: from the maximal 6.4 childbirths per woman in 1965 to 2.6 in 1980; and from 2.6 to 1.5 childbirths per woman since 1980 (Data source: United Nation (2018)). The first drop is due to China’s family planning policy change in the late 1970s [
2], and the second drop is primarily associated with rapid urbanization since the 1980s [
3].
Second, the residential registry system in China, known as
Hukou, (according to the regulations of the People’s Republic of China on Household Registration since 1958) has generated unbalanced urban–rural development and substantial internal labor migration since 1984 [
4]. The flow of rural and urban populations within the
Hukou system resulted in different demographic compositions and aging structures between the two sectors. The rural population decreased from 80.25% of the total population in 1960 to 41.48% in 2017 (Data source: China Statistical Yearbook (2018)) (The China Statistical Yearbook calculated the rural population percentage according to Hukou before 1982, and by residency after 1982). The rural sector may face a more severe challenge than the urban sector due to this unequal labor force change. Adamchak (2001) [
5] argues that the one-child policy in China affected the age structure and aging process in rural areas more due to the underdevelopment of formal systems of elderly support. The proportion of the Chinese population aged 65+ reached the UN’s 7% threshold for the classification as an “aging society” (The United Nations (UN) defines a country/region as an “aging society” when the population of age 65+ accounts for more than 7% of the total population in 1956.) in 2000, while China’s rural areas reached this threshold before 2000. This study documents the age structure and aging process between urban and rural sectors and across regions in the course of urbanization and internal migration.
Our paper closely relates to three lines of the literature: (1) research that illustrates the consequences aging could bring to social, economic, and health care perspectives; (2) the spatial exploration of unbalanced aging progress; and (3) the urban–rural disparity in aging. Aging and uneven age structures can cause both economic problems and social anxiety, such as slower economic development [
6] enormous health care challenges [
7], and labor supply issues in both the agricultural and nonagricultural sectors [
8,
9,
10,
11]. Major countries in North America, Europe, and East Asia all face various levels of problems associated with aging. They all suffer from the challenges resulting from the increasing proportion of older people in the population. For developing countries, such challenges could be more demanding if their population is “getting old before rich” (the phrase “getting old before rich” refers to the situation in which the ratio of one country’s aging population becomes disproportionally high at the early phase of that country’s economic development stage) [
12], and if facilities and institutions have not yet transitioned to an elder-friendly model. Financial burdens related to the senior population’s social welfare and health care provision could be substantial and challenging to the economy. Our study conducts an international comparison of aging issues between China and other countries with a similar development status and geographical locations to position China’s aging status quo in the global environment.
From the global perspective, studies have shown a heterogeneous aging rate on different continents overall in the past half-century [
13]. The decreases in the fertility rate and the death rate, together with the increase in life expectancy, are the fundamental causes of the global aging phenomenon [
1]. China has had a fast-aging tendency and regional disparity across time. In this context, spatial analysis models are of particular importance in understanding aging issues in China, given massive rural–urban migration activities since the economic reforms in the late 1970s. The geographical research on China’s aging has had various focuses, e.g., its spatial distribution, the spatiotemporal evolution of the elder generation [
13,
14], and the relationship between aging and the other socioeconomic factors [
15]. The previous studies usually explore the relationship between the proportion of the aging population and other factors from the spatial perspective.
In China, rapid migration from province to province and from rural to urban areas could alter the dynamics of the aging situation. More specifically, the enormous internal migration in China may have potentially increased regional disparity. Wu et al. (2019) [
16] studied the factors that impact China’s aging by incorporating spatial heterogeneity and dependence in an empirical model. Yang et al. (2019) [
15] also examined the determining socioeconomic factors that affect aging in Northeast China, where aging, accompanied by a significant economic slowdown, was most acute. In this study, we tackle the regional unbalanced aging issue using the concept of the urban–rural aging gap. We contribute to the literature by employing both statistical comparisons and spatial econometrics models to reveal the relationship between socioeconomic factors and the regional unbalanced urban–rural aging gap in China.
Our study is also closely related to existing studies on urban–rural aging disparity. Kinsella (2001) [
17] shows that the elderly are more likely to reside in rural areas. The main reason is probably the migration of the young labor force and the return-migration of the older one. China’s unique
Hukou system not only generates the migration from rural to urban areas but also incorporates the migration from city to city. Previous studies summarize that the proportion of the elderly population was higher in the less developed areas and the rural regions of China in 1990 [
18]. They also predict the most developed regions, such as Shanghai, Beijing, Jiangsu, and Zhejiang, would reverse the situation due to migration, while exacerbating the aging situation in rural areas by the 2050s. However, the literature fails to analyze the disparity between rural and urban areas across different regions, at the same time utilizing the data over time after 2010. We add information and analysis to extend the existing literature [
6,
19], using data beyond 2010 and proposing possible research directions for future studies.
The rest of the paper is organized as follows.
Section 2 examines the aging status quo of China from an international perspective.
Section 3 applies statistical comparisons in the domestic contents and addresses the spatial differences and changes in the period of 2000 to 2017.
Section 4 employs the empirical model and illustrates the results.
Section 5 concludes the study, discusses the limitations of this paper, and provides policy suggestions and future study directions.
2. Aging: An International Comparison
Aging of societies first started in developed countries.
Table 1 shows the aging process in significant countries/regions. Most developed countries became an aging society by the mid-1950s (e.g., the US, UK, and EU countries), except for Japan (in the 1970s). The “aged” proportion in these countries reached 14% before or in 2018. Especially in European countries, the aged population reached this criterion long before 2000. Compared to these countries, China is still “young”, becoming an aging society in 2000, and the aged proportion is forecast to double by 2027 (United Nations, 2018). In 2018, China’s aged population accounted for 10.9% of the total, which is much less than that in developed countries. Compared to other BRICS countries, China is “younger” than Russia, whose aged population was 14.7% in 2018, but “older” than Brazil (8.9%), India (6.5%), and South Africa (5.3%). Compared to other East Asian countries, China is younger than Japan and South Korea (with a 14.4% aged population in 2018), and its aging process is also slower than that in South Korea. Essentially, both countries became an aging society in 2000, but South Korea’s aged population proportion doubled by 2018.
This pattern may reflect the fact that the aging process is primarily driven by natural processes: a decrease in fertility rates and death rates, and extended life expectancy.
Figure 1 shows the fertility rates of the BRICS countries and East Asian countries/regions. China shows an increasing fertility rate in the early 1960s (associated with the government’s encouragement of fertility in the 1950s Chairman Mao Zedong stated in 1949 that, “Of all things in the world, people are the most precious”—Hu Yaobang, secretary of the Communist Youth League argued that “A larger population means greater manpower” in 1955), a sharp drop in the 1970s (associated with the birth control policy, the slogan “Late, Long, and Few” started in 1969, and the single-child policy was officially implemented in 1979, which ended in 2015), and a moderate decreasing trend since then. Other BRICS countries (see
Figure 1, left panel) show a steadily decreasing fertility rate, among which Russia had a relatively stable fertility rate with an increasing rate since 2000. We also notice that the fertility rate in China dropped quickly in the 1990s, although not at the same magnitude as in the 1970s. The phenomenon is likely due to the urbanization process associated with China’s transition to a market economy starting in the early 1990s. Overall, China and Russia have a lower fertility rate than the other three countries, but the gap is shrinking or disappearing.
Compared with other East Asian countries/regions (
Figure 1, right panel), China had the second-highest fertility rate, after Mongolia, from 1963 to 1979. Since the 1980s, the gap between China and other countries, except for Mongolia, has also been shrinking or even disappearing over time. Although the single-child policy was not implemented in Hong Kong and Macao, their fertility rates were always lower than those of mainland China. The trend in Hong Kong resembles that of South Korea, likely because of their similar development status. Macao also had an increase in the fertility rate starting from 1976. The aging population resulted from China’s baby boom in the 1960s, and the persistently low fertility rate after the 1990s may indicate that China will face a deteriorating aging situation in the next twenty years.
Figure 2 illustrates the death rate for BRICS countries (left panel) and East Asian countries/regions (right panel). The death rate in China dropped dramatically in the early 1960s, from 25 per 1000 people in 1960 to around 7 per 1000 people in 1970, and has remained at that level since then. This death rate is the lowest among BRICS countries for most of the period. Similar to the fertility rate, the gap is shrinking over time, likely due to improved nutrition, medical, and health care across all countries. South Africa and Russia show an increasing death rate from 1990 to around 2005, likely due to unstable domestic political and economic situations during that period. Compared with East Asian countries/regions, China’s pattern after the mid-1960s is similar except for Mongolia. The death rate in Mongolia was higher than that in the other countries until 1995, likely due to the lag in public health care. Note that the death rate in both North Korea and Japan started to increase since the 1990s, but likely for different reasons. Reportedly, a devastating famine hit North Korea in the 1990s, and there has been a food shortage in the country since then. For Japan, the death rate increase may be a direct result of its aging society structure, as Japan is the earliest East Asian country to become an aging society (in 1971).
Figure 3 shows the third important factor in the natural process of aging—life expectancy—for the BRICS countries (left panel) and the East Asian countries/regions (right panel). All countries show an upward trend in life expectancy, except for Russia and South Africa in the 1990s and early the 2000s, and North Korea in the 1990s. These patterns are consistent with those observed for the death rate. China recovered from World War II and its civil war quickly in the 1960s, with life expectancy increasing from 40 years in the early 1960s to around 60 years by 1970. By 2018, it reached 77 years (National Health Commission of China, 2019). Compared to BRICS countries, China has the longest life expectancy since the 1980s.
Compared to other East Asian countries/regions, China is in the middle, with a life expectancy about ten years longer than that in Mongolia and North Korea, but approximately ten years shorter than that in South Korea, Japan, Hong Kong, and Macao. Unlike the fertility rate and death rate, this gap is quite stable and has not yet started to shrink. Life expectancy has not yet reached its limit. Given China’s strong economic growth, improving nutrient supply, and health care infrastructure, the Chinese population has the potential for a continued life expectancy increase.
Policies such as family planning and immigration have played an important role in adjusting the population structure in many countries. Still, policies may have limited effects on slowing the aging process [
21]. South Korea’s birth control policy successfully controlled the rapid population growth in 1962 and caused the rapid aging of the population [
22].
Due to the increase in life expectancy and the decrease in fertility rates, the proportion of the elderly group will increase further in the 2020s. China implemented initiatives such as the two-child policy in late 2015, attempting to reverse the persistently low fertility rate. However, China’s registered births in 2018 were fewer than those in 2017 and much lower than the government estimates (Data source: National Bureau of Statistics of China (2019)). The aging process in China is likely to accelerate in the 2020s and may outpace its international counterparts in BRICS countries and East Asia.
3. Aging in China: A Domestic Comparison
Accelerated aging is inevitable in China’s unique social and political context. It is crucial to understand whether and how the age structure and aging process differ by economic sectors and across regions. In particular, how does the economic development path affect the aging disparity in the labor force in rural and urban areas over time and across regions? Given the vital role of labor resources in China’s economic growth in the past forty years, understanding the dynamics of the age structure and the aging process may provide useful information to policymakers. Aging also has important implications for the design of the social security system and health care programs for the general and targeted populations.
China’s aging population increased by less than 2% annually from 1997 to 2010 and then increased by 2.47% from 2010 to 2017, showing an accelerated overall aging rate.
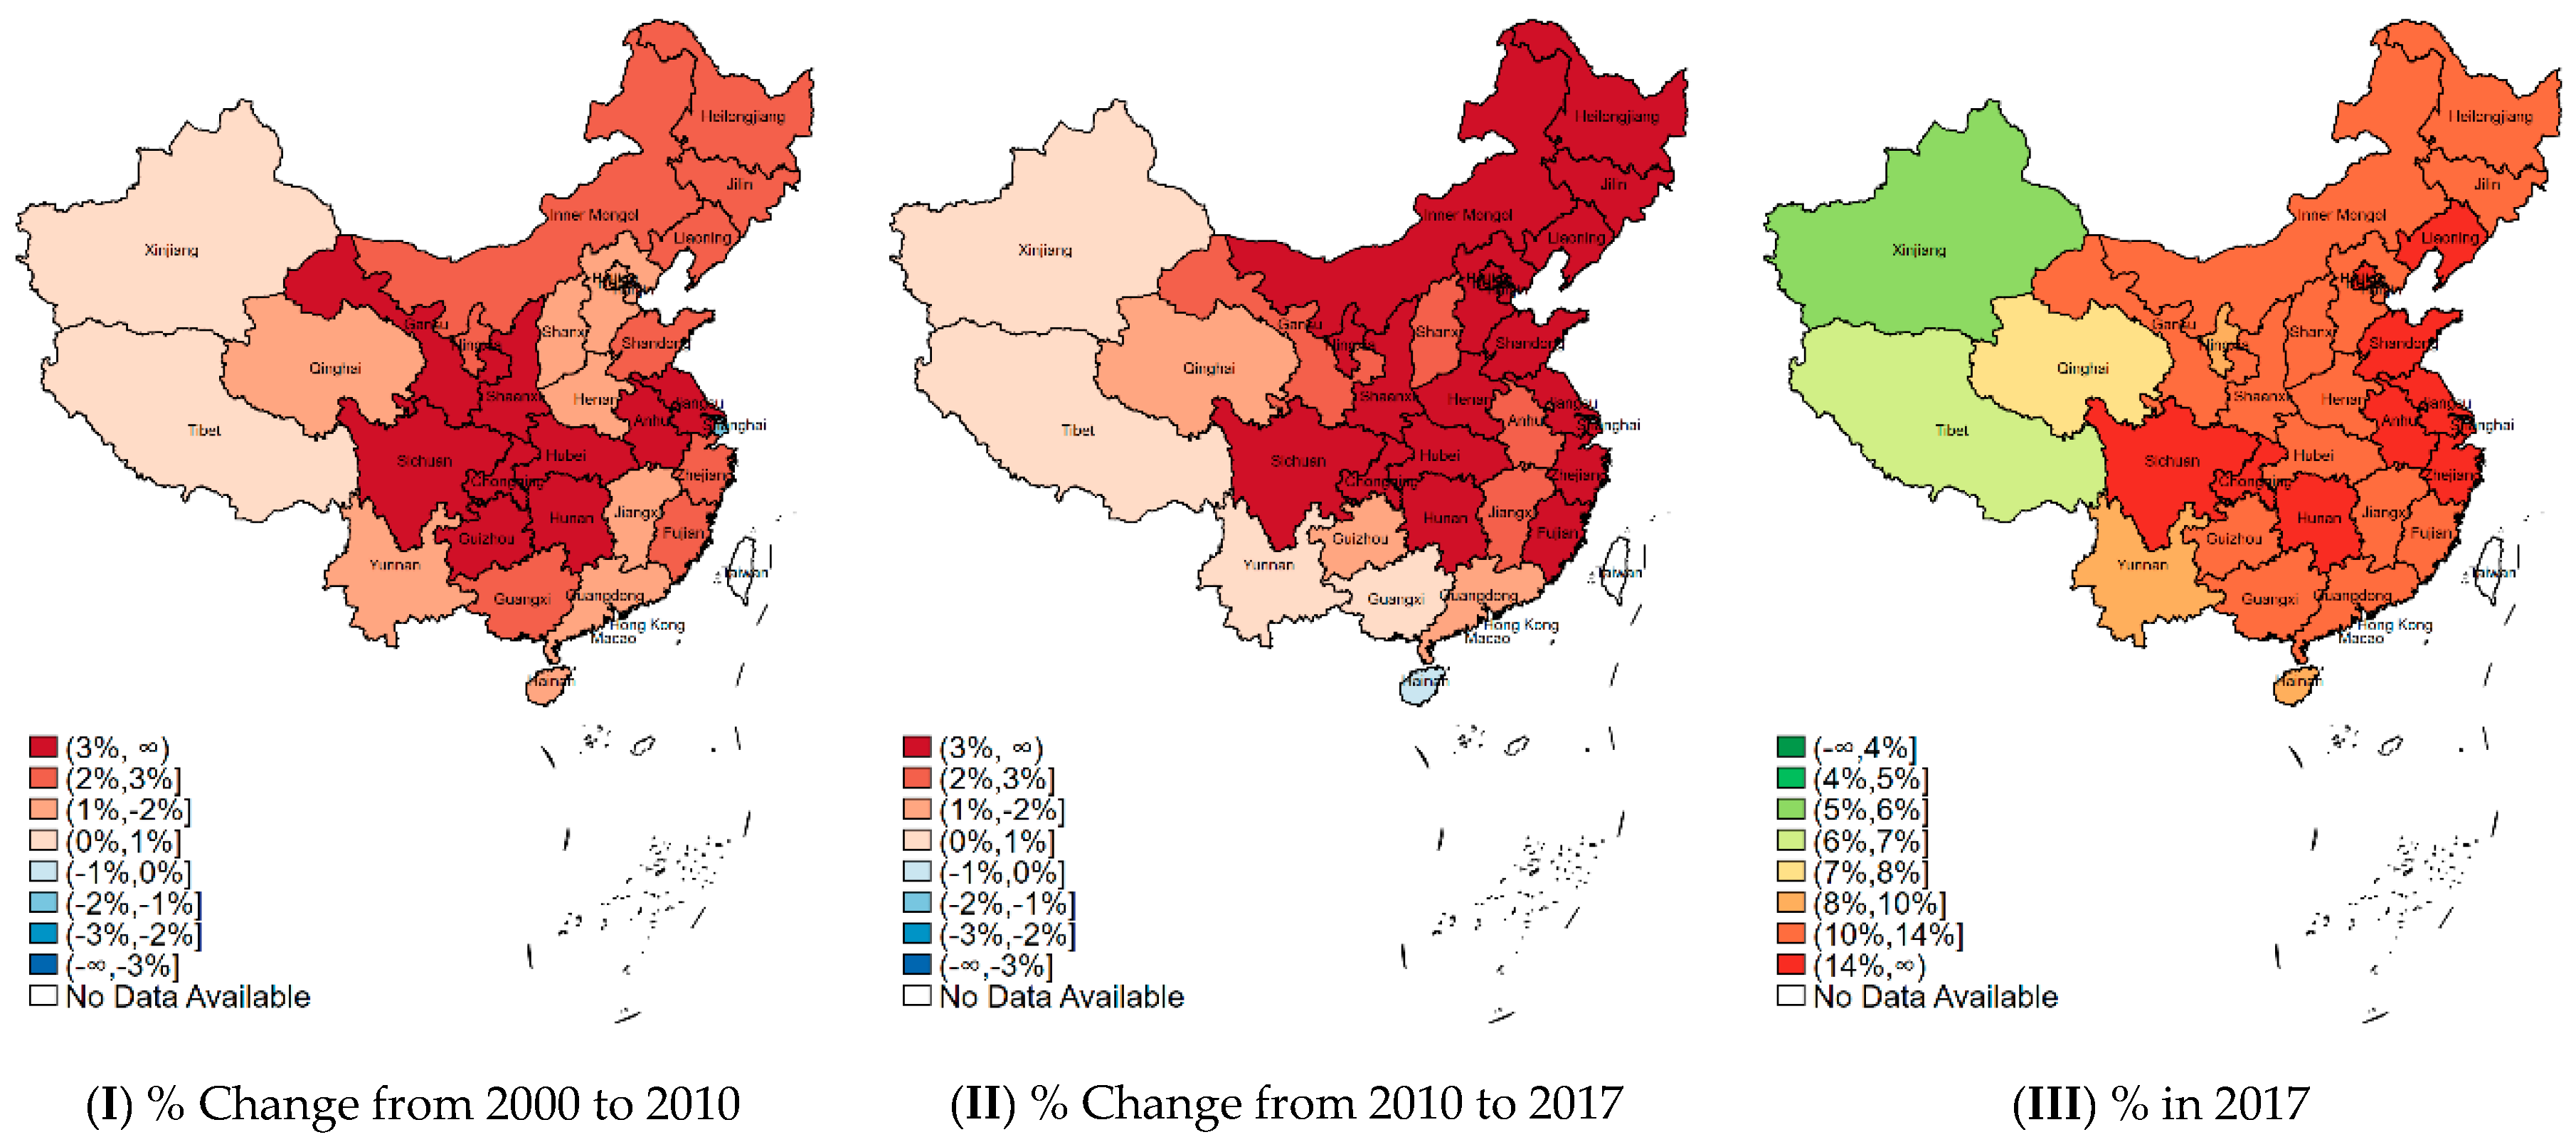
Figure 4 shows China’s aging process at the provincial level using China Statistics Bureau (CSB) data from 2000 to 2017. Comparing panels (I) and (II), the aging population grew faster in the northern-eastern provinces than in the other regions from 2000 to 2010. The central provinces outpaced the others from 2010 to 2017, and the western provinces will likely be the leaders in the next decade. Panel (III) suggests that in 2017, the only province that has not yet aged (under 7% of the population is aged) is Tibet. Overall, the western regions are the “youngest”, followed by the southern regions. Note that Beijing and the surrounding areas and the Yangzi Delta saw significant changes in the aging population during 2010–2017, each with an increase of more than 3% in the aging population.
At the provincial level, we reveal more regional disparities in the urban–rural aging process by representing the dynamics of the aging population.
Figure 5 and
Figure 6 illustrate the aging process from 2000 to 2010 and from 2010 to 2017, and age structure in 2017 across regions for the rural and urban sectors, respectively. Together, they provide information on the potential urban–rural disparity in the age structure and the aging process. The rural population was older than the urban population, with the aging population accounting for 13.22% of the rural population in 2017, higher than the national average of 11.39%. By 2017, the urban population in all regions except Tibet and Guangdong were considered to be aging, while the rural population in all regions except Tibet and Xingjiang were considered to be aging.
The aging process in the rural sector was also faster than that in the urban sector. The proportion of the aged population in the rural sector increased by 2.71% and 3.16% over 2000–2010 and 2010–2017, respectively, while the corresponding statistics in the urban sector are 1.50% and 2.29%, respectively.
The proportion of the aging population in the rural sector in central regions grew the fastest, by 3.14% from 2000 to 2010, while the northwest regions aged the most, by adding 5.39% more elderly to their population from 2010 to 2017. In contrast to the rural sector, the urban aging process is not as severe; only two provinces, Xinjiang and Heilongjiang, have an aging population that grew by more than 3% overall from 2000 to 2010. The three most developed regions, Beijing, Shanghai, and Zhejiang show a decrease in the aging population proportion in this period. This phenomenon was likely due to urban–rural migration. There was an outflow of labor from urban to rural areas, likely including older people who chose to return to the agricultural sector as “Returning Farmers”. Meanwhile, there was an inflow of labor from rural to urban areas, often of young “Migrant Workers”. The aging process in the urban sector, therefore, intensified slightly from 2010 to 2017, such that all regions show an increase in the aging population proportion, with a growth rate ranging from 0.64% to 3.78%.
The aging problem among the rural labor force has become a constraint in the development of agriculture and may hinder the revitalization of the rural economy. Compared with secondary and tertiary industries such as manufacturing and services, the aging problem in agriculture is particularly prominent [
23]. According to the China National Agricultural Census (CNAC) of 1996 and 2006, the agricultural population aged 60 and over accounted for 7.3% and 11.25% of the overall population, respectively. In addition, 33.58% of the working population in the rural sector was 55 years old or above in 2016 (Data source: China National Agricultural Census (2016)). In comparison, those aged 50 and above accounted for only 21.28% of the rural working population in 2006. The change in the age structure and the aging process in the rural sector occurred along with the transformation in economic structure and development.
4. The Urban–Rural Aging Gap
In comparing rural and urban aging rates in 2010 and 2017, we find that the aging percentage gap between rural and urban areas seems to be also associated with the location’s development. In regions in which the urban aging rate is faster than the rural one from 2010 to 2017, including Anhui, Hebei, Jiangxi, Hainan, Guangxi, Yunnan, Xinjiang, and Tibet, their GDP per capita is also relatively low compared to other provinces. For areas with a much larger urban population (the urban–rural difference accounted for more than 1% of China’s population) and higher population density, including Shanghai, Beijing, Jiangsu, Shandong, Guangdong, Zhejiang, and Liaoning, their aging problem deteriorated more in rural areas than in urban areas in 2017. The migration of the rural population and the rapid urbanization process during the years of interest are possible reasons for this situation.
Besides the urban–rural aging disparity, there are dramatic differences in the type of economic activities, level of economic development, and geographical and climate attributes across regions in China.
Figure 7 shows (I) the proportion in terms of China’s GDP, (II) population density, and (III) urbanization rate at the provincial level, which indicate unbalanced regional development in China.
The western region had a lower aging rate than other regions did, except for Sichuan and Chongqing. Although Sichuan and Chongqing are in the West, they have a relatively larger population base and higher urbanization rate with a critical aging situation. More developed regions, including Beijing, Shanghai, Zhejiang, and Jiangsu, became aging societies earlier than the others did, and their aging problem later became worse in rural areas. The only exception was Guangdong, which has a moderate aging problem, with a higher aging rate in urban areas than in rural areas. Northeastern China, including Jilin, Liaoning, and Heilongjiang, had the opposite situation compared to the more developed areas. Their rural areas became an aging society later than the urban areas did, but their rural areas aged faster than the urban areas.
Different regions’ aging problems can be related to different sectors. We further rank the provinces by whether they have a higher or lower aging rate than the national average (See
Figure 8). Comparing with the national average in rural and urban sectors, areas including Chongqing, Sichuan, Shanghai, Zhejiang, Jiangsu, and Shandong demonstrated a rural aging rate of more than 20% higher than the average in 2017, while the Jingjinji metropolitan region (including Beijing, Tianjin, and Hebei) and the Northeast provinces, Jilin, Heilongjiang, and Liaoning, showed strong evidence that their aging problem was more in the cities in that same year. This comparison shows that China’s aging has a close relationship with the regional development status quo.
Given these observations, we further test whether the development of the region, the population density, and the urbanization rate could impact the change in the urban–rural aging gap in spatial terms. We define the urban–rural aging gap as the difference between the proportion of the urban aging population and the proportion of the rural one. We form the following hypotheses to test:
Hypothesis 1. The regional development level can deepen the urban–rural aging gap, i.e., the higher the GDP percentage, the higher the increase in the urban–rural aging gap.
Hypothesis 2. The higher the population density, the higher the increase in the urban–rural aging gap.
Hypothesis 3. The higher the urbanization level, the higher the increase in the urban–rural aging gap.
4.1. The Data and Methodology
We utilize population and GDP data from the “China Statistics Yearbook” (2018). We calculate the population density data at the provincial level using population data and land area data provided on China’s government websites (sources:
http://www.gov.cn/test/2005-06/15/content_18253.htm). The urbanization rate was calculated by dividing the urban population by the total population at the provincial level. The data covers 31 provincial districts. We construct our dependent variable as the change of the urban–rural gap from 2010 to 2017. A positive shift in the urban–rural gap shows that the aging process is faster in urban areas than in rural areas during the period of interest, and vice versa. As we have illustrated, the aging population accounted for a higher proportion of the total population in agricultural sectors than in urban areas, and the aging process also progressed faster in rural areas than in urban areas. Different regions had different changes during the years of study, which provided us the possibility of identification.
We utilize spatial statistics and spatial econometric models in the following analysis. We first use the spatial statistics to show the spatial autocorrelation in the dependent variable, i.e., the change of the urban–rural aging gap. Then we employ spatial econometric models to incorporate the potential spatial autocorrelation issue in the dependent variable as well as in the error term.
Spatial Statistics
From the overall distribution perspective, we use the most used two global spatial statistics. First is the global Moran’s statistic, which is referred to as the global Moran’s I [
24], where
is the spatial weight index, and
are the observations of the variable of interest,
is the mean of the variable of interest, and
is the sample variance. The Moran’s I ranges from −1 to 1. When Moran’s I is larger than zero, we have a positive spatial autocorrelation in the variable of interest, and vice versa. Positive spatial autocorrelation indicates that high values are surrounded by high values, while negative autocorrelation means high values are surrounded by low values. Second is the global Geary’s Continuity ratio, which is also called Geary’s C [
25], where
The global Geary’s C is similar to the global Moran’s I, while the global Geary’s C ranges in general from 0 to 2. When the global Geary’s C is larger than 1, the variable has a negative autocorrelation, and vice versa. Both of these are frequently used statistics, and global statistics are the average representation of the entire area. The Moran’s I’s reference is the sample; meanwhile, Geary’s C compares neighboring observations. We adopt both of these statistics to confirm the overall existence of spatial autocorrelation.
We also break down the analysis at the provincial level. We adopt only the Local Moran’s I (Local Indicators of Spatial Association, hereafter referred to as LISA), where
Since it is, in general, more reliable and preferred [
4]. Similar to the global Moran’s I, a LISA larger than zero means high values clustered with high values, and vice versa.
Spatial Autoregression (SAR) and Spatial Autoregressive Models with Spatial Autoregressive Disturbances (SARAR) were also used.
When spatial lag and spatial disturbances exist in the error term, a simple Ordinary Least Square (hereafter referred to as OLS) regression could lead to biased estimation. As a result, we use the SARAR model [
26,
27,
28,
29] to test our hypotheses to reveal the relationship between the regional development variables and the change of the urban–rural aging gap. The SARAR model has many applications in both geographical contents and other interaction-related models [
30].
We use the following specification for SARAR:
where
W and
M are the spatial weighting matrixes of the dependent variable and the disturbance term, respectively;
is the spatial autoregressive parameter, which examines the spatial lag effect on the dependent variable; and
is the parameter that describes the occurrence of the spatial disturbance. When
, the model becomes the special case, i.e., SAR, where spatial error term autocorrelation does not exist [
31,
32]. The validity of the models relies on the statistical test of
and
; when
is significantly different from zero, there exists spatial lag in
. When
enters the equation significantly, there exists spatial autocorrelation in the error term. Different estimation procedures can be used in the estimation. We employ the maximum likelihood procedure in model estimation [
33].
4.2. Measures of Global and Local Spatial Autocorrelation of the Urban–Rural Aging Gap
Different regions have different aging trends in their rural and urban areas. We first represent the change of the urban–rural aging gap from 2010 to 2017 before applying any statistical analysis. As shown in
Figure 9 (left), the aging process was faster in urban areas in the Northeast and West regions. At the same time, the rest of the country witnessed a more difficult aging situation in rural areas. We, therefore, test whether there existed a spatial correlation in the change of the urban–rural aging gap from 2010 to 2017. The Moran’s global statistic and the Geary’s Contiguity ratio are 0.249 (i.e., larger than zero) and 0.661 (i.e., smaller than one), respectively, strongly rejecting the hypothesis that there was no spatial correlation at the 1% significance level, suggesting a positive spatial correlation in both cases. The global positive spatial autocorrelation in the change of the urban–rural aging gap means that if there is an increase in the urban–rural gap in one province, its neighbor provinces also experience an enlarging aging gap in the same direction.
The LISA analysis also shows an unbalanced trend in different regions (see
Figure 9 (right panel)). The Northeast region, Heilongjiang and Jilin, together with Inner Mongolia and Shaanxi were the “Low-Low” cluster with a lower than average change rate. In these areas, rural sectors are aging faster than the urban sectors at a rate faster than the national average. Western provinces Tibet and Xinjiang were in the “High-High” cluster. These urban areas are aging more quickly than the average change rate. The remaining areas were either with no statistical significance or without the data coverage.
On the one hand, the cluster could be due to the urbanization rate in one region. On the other hand, regional development could lead to a migration of national labor forces. Underdeveloped provinces may face a net outflow of people compared to the more developed ones. The “High-High” cluster may be caused by the outflow of a higher percentage of the rural young labor force, while the “Low-Low” cluster could be the result of the outflow of a higher percentage of the urban population.
4.3. Spatial Autoregression (SAR) and Spatial Autoregressive Models with Spatial Autoregressive Disturbances (SARAR) Estimation
To examine our hypothesis that the change in the urban–rural aging gap is associated with regional development parameters, we select the following parameters for our empirical analysis: 1) % of China GDP represents the proportion of the provincial GDP in 2017; 2) the population density refers to the population count per hectare of 2017; 3) the urbanization rate is equal to the ratio of the urban population to the total in one province.
We address spatial autocorrelation in the estimation by using the SAR and SARAR models, where the empirical specification is as follows:
where
y is the change in the urban–rural aging gap from 2010 to 2017, and
W and
M are the spatial weighting matrixes for the shift of the urban–rural aging gap and the disturbance term, respectively. We use here the same contiguity matrix for
W and
M in our estimation of SARAR, where the weight
when the two provinces share borders.
includes the development variables. We have
M = 0 for the SAR model, indicating no spatial autocorrelation in the error terms.
We also include the regional specific fixed effects in the later regressions (4), (5), and (6) to capture the region-specific factors besides the GDP percentage, population density, and urbanization rate. The regression results are shown in
Table 2.
We first utilize the Moran’s I test on the error term in regressions (1) and (3) to detect the existence of spatial dependence. The test value regression (1) is 5.79, reaching the 5% significance level. While controlling the fixed effects in different regions, the test value of regression (3) is only 0.24, failing to confirm spatial autocorrelation in the random component. We then employ the Wald test on λ for regressions (2) and (5). Both analyses are statistically significant at the 1% level, representing a spatial lag. Therefore, the OLS regression is biased if we do not incorporate the spatial effect. We also further test whether there is spatial autocorrelation in the error term. The Wald test on ρ for regression (6) shows evidence of spatial disturbance in the random component.
After adding regional fixed effects, we are able to capture the unobserved regional elements in the estimation. The % of China’s GDP variable becomes significant at the 10% level. Together with the test results, we believe that regression (6), which incorporates the spatial lag in both the dependent variable and the error term with the fixed effects of different regions, provides us the best fit among all the models.
4.4. Results and Discussion
According to the results of regression (6), the % GDP and the urbanization rate are the development factors that are significant in the regressions. Population density does not significantly influence the urban–rural aging gap. Urbanization could enlarge the disparity where the rural aging rate is higher than the urban aging rate. Furthermore, the % GDP also leads to the same situation in the same direction. Our finding aligns with previous studies that argue urbanization is the primary reason for the urban–rural aging gap.
The inverse of the urban–rural aging pattern, i.e., rural China is older and aging faster than urban China, is one of the significant problems in terms of aging in China. More of the young labor force migrates to the large and more developed cities, seeking to stay and pursue permanent household registration opportunities for their next generation. Nevertheless, the primary concern is that the rural areas are not ready for the aging trend. Especially in China, the urbanization process is accompanied by concomitant improvement of the GDP; 1% of the growth of the urbanization rate and a 1% increase in the proportion of China’s GDP could result in a 0.271% larger urban–rural aging gap.
Consequently, rural China has aged more rapidly with this dual effect. In places where the urbanization rate is already high, a special focus should be given to balancing the urban–rural development strategy. In areas where urbanization is still lagging behind, the regional development strategy should always be a priority.
Our research findings could have policy implications for the current urbanization process. Previous literature shows that China’s urbanization rate lags its development status quo in terms of global comparisons. Unlike other countries, the urban population in China includes a high proportion of migrant workers. Their presence in urban areas brings up at least two considerations: (1) less health care and social insurance coverage, and (2) unstable employment opportunities. When migrant workers in cities become sick or get older, their only option is to return to their rural home, which will further increase the urban–rural aging gap and add to the burden on the social systems in rural areas. Our results imply that the overall increase in population density cannot solve the problem of the enlarging urban–rural aging gap. However, at the same time, pushing too hard on the boundary of the urbanization process without resolving other conflicts could leave rural areas in an even more dangerous situation.
A possible solution to the problem also lies in the regression results. We find that the urban–rural aging gap is highly correlated with different administrative region divisions. The regional specific parameters capturing other unobserved incidents during the years of study turn out to be significant in regressions (4), (5), and (6). By adding fixed effects into the regression, we see a significant change in the regression estimates. The % GDP becomes statistically significant and negatively influences the urban–rural aging gap, i.e., it intensifies the situation in which the rural areas are aging faster than the urban ones. Population policy should be set by taking into account different geographical and political regions to achieve a balanced aging process. The West region has the most substantial cushion, 7.555%, and the Northeast region the smallest, 4.526%, in the mean. In fact, the Northeast region is the most urbanized just after the West region. The results imply that the Northeast region encounters a larger urban–rural aging gap at the same level of urbanization rate. The Northeast region might focus more on rural revitalization and rural industrialization, while the West could still emphasize the urbanization process.
The fixed effects in some regions are all positive, which suggests that in these regions, the urban–rural gap illustrates the potential for a reversion trend from 2010 to 2017. Previous literature has pointed out the reverse of the urban–rural aging gap, i.e., the urban aging population ratio is larger than the rural, which can happen when the massive urban–rural migration starts to settle down.
5. Conclusions
China’s rapid economic and social development in the past decades has increased life expectancy and decreased the infant mortality rate dramatically. Accompanying such changes is a sharp decrease in the fertility rate, making the aging problem inevitable. Compared with other BRICS countries and other East Asian countries/regions, China’s aging problem is still moderate but is expected to deteriorate quickly in the coming two decades. Similar to most industrialized countries, China will be confronted with potential aging challenges to major economic, social, and public health factors. In general, the elderly group relies more on the social security system and may be vulnerable in outbreaks of health threats, as is notable in the COVID-19 pandemic.
Regarding aging in different areas, more of the age 65 + population is located in the Eastern region as of 2017, which is also the more economically developed region in China. In particular, the Eastern provinces of China have had a massive influx of people, but the aging problem did not slow significantly with the arrival of a younger population. This may be related to the availability of more comprehensive and convenient social and medical services, which significantly increased life expectancy from 74.30 in 2000 to 77.37 in 2010, which is the highest recorded in China (CSB, 2010). We also find that areas with higher population densities have more severe aging problems than less populated ones. Nevertheless, by analyzing the GDP and population density, we see that regions with higher population densities do not necessarily have a more severe rural aging process than urban areas. We find no evidence that the less developed areas had a much faster rate of population aging from 2010 to 2017; when controlling for the effect of urbanization and regional fixed effects, the GDP also impacts the urban–rural aging gap significantly.
We find evidence suggesting that aging will become more severe after the 2020s due to the first child boom in the 1960s. The new two-child policy shows little evidence of changing China’s persistently low fertility rate. Our empirical tests confirm that the development factors that generated the enlarging urban–rural gap are the GDP percentage and the urbanization rate. With urbanization progress, a further increase in the urban–rural aging gap will undoubtedly appear. Our research also shows suggestive evidence of the reversion of the urban–rural aging situation. When the urbanization rate is constant, regional related factors could decrease the urban–rural aging gap. With most of the provinces likely to realize their urbanization goals and with the gradual abandoning of the Hukou system in most cities, adjusting regional-specific policies according to their potential urban–rural aging gaps could be one of the solutions to the increasingly diverging aging situation.
Our research also includes several limitations. First are the data limitations: we would benefit from smaller districts’ data, which would provide a more precise representation of spatial correlation. Second, more regional policy-related factors could be included in the estimation. Regional development in China is closely related to government planning and policy direction. More policy-specific variables could be a proxy for local development.
Our study suggests that agriculture and rural development face more aging problems due to the unbalanced urban–rural aging process in China. For agricultural production, the aging farming population has a significant influence on a family’s successors, farmland [
34,
35], and agricultural management practices [
36]. Aging could also negatively impact the entire industry [
3]. For rural development, population aging is largely responsible for the sharp increase in income inequality in rural China [
37], and the rural social old-age care services are generally undersupplied and their staff underpaid [
38]. Future research inquiry should focus on the analysis of the relationship between aging and agriculture and rural development, and provide policymakers with insights on rural China in particular.


