Article

The Ripple Effect and Spatiotemporal Dynamics of Intra-Urban Housing Prices at the Submarket Level in Shanghai, China

1
University of Chinese Academy of Sciences, Beijing 100049, China
2
Key Laboratory of Watershed Geographic Sciences, Nanjing Institute of Geography and Limnology, Chinese Academy of Sciences, Nanjing 210008, China
3
Key Research Institute of Yellow River Civilization and Sustainable Development, Henan University, Kaifeng 475001, China
4
School of Economic & Management, Nanjing University of Science & Technology, Nanjing 210094, China
5
Department of Human Geography and Spatial Planning, Utrecht University, 3584CB Utrecht, The Netherlands
*
Authors to whom correspondence should be addressed.
Sustainability 2020, 12(12), 5073; https://doi.org/10.3390/su12125073
Submission received: 14 May 2020 / Revised: 12 June 2020 / Accepted: 16 June 2020 / Published: 22 June 2020
(This article belongs to the Section Sustainable Urban and Rural Development)

Abstract

:
The ripple effect of housing price movements between cities has been extensively investigated, but there are relatively few studies on this topic within a metropolitan context, especially at the submarket level. This paper describes the use of ripple effect theory to examine the diffusion process and convergence of intra-urban housing prices at the submarket level in Shanghai, an emerging global city in China. The analysis is based on directed acyclic graphs, local indicators of spatial association time-paths, and a recently developed convergence test. The empirical results of grouping analysis identify 25 submarkets in Shanghai, and the diffusion of housing prices between these submarkets is found to be caused by both geographical and economic proximities. There is also a complex recursive process of price spillovers from high- to low-priced submarkets, and vice versa, which contributes to the spiraling local housing prices. Housing prices diverge across all submarkets, and the whole market can be divided into three convergence clubs. Finally, these convergence clubs have a circular structure with a degree of continuity. This study broadens our knowledge of the price interrelationship among housing submarkets at the intra-urban level. These findings have profound implications for urban planners, policy makers, and local residents.

1. Introduction

Given the rocketing housing prices in many areas of the world in recent decades, housing has become a crucial focus in attempts to avoid the reproduction of social inequality, which represents a major challenge in achieving sustainable urban development [1]. There is a rich body of literature on decoding the determinants of housing prices by investigating a variety of demand- and/or supply-side fundamentals at different scales [2,3,4,5], such as location, population, income, economic development, and urban amenities [2,6,7,8,9,10,11]. In addition, recent studies suggest that differences in housing prices are related to spatial heterogeneity and the dependence of housing (sub)markets [2,12,13,14], factors that are partially independent of the demand- and supply-side factors. In this sense, exploring the spatiality of housing prices can improve our understanding of the nature and inequality of property values and the causes of housing affordability problems [15,16,17].
At least three interrelated aspects of the spatiality of housing prices are worthy of further investigation. First, existing studies have focused on the heterogeneous dimensions of the housing price distribution, such as the segmentation of housing submarkets and coefficient heterogeneity [12,18,19,20]. Relatively little attention has been paid to the interrelationships among different observation units of housing prices. Existing empirical studies, which mainly consider Western countries, note that an increase or decrease in housing prices in prime locations can spill over in space and time, and this issue is usually debated in terms of the ripple effect of regional housing prices [21]. Compared with Western countries, there is much less evidence of the diffusion process and the convergence of the housing market in China, albeit with some exceptions [22,23].
Second, although there is a growing body of literature on interregional interactions and the ripple effect of housing prices, few studies have explored this phenomenon at the intra-urban level [15,24]. Indeed, little is known about the spatiotemporal process and spatial dependence of the intra-urban housing market [25,26,27,28,29]. This is partially the result of using standard definitions of economic regions when examining the ripple effect, and partially the result of limitations in data collection and econometric techniques [24].
Finally, most existing studies adopt various administrative areas—such as a city in a regional context or a district in a metropolitan context—as the analysis unit in attempting to detect the ripple effect of the housing market. However, recent studies point out that both cities and districts can include several heterogeneous submarkets, which may lead to different market equilibriums. Therefore, it has been proposed that the study areas be delineated into disaggregated submarkets based on a finer unit [19,27,30]. In this regard, using the theory of the ripple effect, this study focuses on the diffusion process and the convergence of intra-urban housing prices at the submarket level in Shanghai, an emerging global city in China. The remainder of this paper is organized as follows. Section 2 presents a literature review, focusing on studies on the long-term convergence and short-term diffusion process of housing prices. Section 3 describes the study area, data processing, and methods. Section 4 reports the main findings from Shanghai, which are discussed in detail in Section 5. Finally, Section 5 presents the conclusions to this study.

2. Literature Review

Empirical studies have observed that influential changes in housing prices in a given location can spill over in space and time, with such issues usually debated in terms of similar concepts such as the ripple effect [21,31,32], contagion effect [33], domino effect [34], and co-movement [35,36,37] of housing prices. These concepts are based on a common judgment that housing prices in different locations interact spatially, although several small differences explain the causes of the interactions [38,39]. Among these concepts, the ripple effect, which is the subject of this paper, has become widespread and commonly accepted in the literature. In his seminal work, Meen [21] argues that if the ripple effect exists, short-term variations in price differentials lead to the diffusion of housing prices and to spatial price patterns that tend to converge in the long term. Subsequent studies have adopted various econometric and spatial analysis tools to verify this statement at various scales. These studies form two strands in the existing literature.
One strand of the literature is concerned with how regional housing prices interact with each other in the short run through ripple effects. Many previous studies agree that the ripple effect usually emanates from a dominant region, such as the central city in the national housing market (e.g., London in the UK, New York in the US, and Beijing in China) and central business districts (CBDs) in the local housing market (e.g., Gangnam-gu in Seoul, Korea), and then spills over to the remainder of the housing market [22,29,40]. This has important policy implications, as attempts to resolve the issues arising from housing bubbles should focus on controlling the housing price appreciation in the dominant region, rather than in all regions [22]. However, how the housing price diffuses from a dominant region to other regions and the extent and mechanism whereby the ripple effect decays with time and distance remain unclear.
It is much more difficult to explain the diffusion of housing prices between regions than it is to explain the spatial pattern of housing values, which can be roughly interpreted in terms of regional differences in socioeconomic fundamentals, such as location, urban hierarchy, incomes, population, and quality of living [2,7,41,42,43]. Previous studies focus on the influence of geographical proximity on the interaction of regional housing prices [44,45]. Empirical studies offer strong evidence of housing price diffusion between cross-border or neighboring regions [46,47,48,49]. Other studies find that, in addition to geographic proximity, economic proximity is an important influence, providing a good explanation of how the spillover effect extends to markets characterized by similar regional economic attributes and conditions [50].
The price relation between different regions is not unilateral, but rather bilateral and interactive. Hudson et al. [51] suggest that there is a complex recursive process of price spillovers between different regions, whereby an unexpected price increase in a dominant region impacts on prices in other regions, and these in turn echo back to the dominant region. In recent years, several studies have attempted to investigate the interaction of housing prices in both the spatial and the temporal dimensions [29]. Holly et al. [40] found that the diffusion of price changes decays more slowly along the geographical dimension than along the time dimension.
Another strand of the literature seeks evidence for the long-term convergence of regional housing prices implied by the ripple effect hypothesis, by applying a wide variety of techniques, such as cointegration estimations, Granger causality tests, unit root tests, non-parametric tests, and threshold autoregressive models [33,52]. To date, there is mixed evidence that long-run equilibrium relationships actually exist in regional housing markets [24]. There is a wealth of evidence to support the view that convergence is reestablished and that the so-called ripple effect occurs [52,53]. Meen [21] provides four possible explanations for these effects: interregional migration, equity (ownership) transfer, spatial arbitrage, and spatial patterns in the determinants. However, many existing studies conclude that there is no evidence for the long-run convergence of regional housing prices [25,44].
Other researchers view the relationship between regional housing prices as involving neither a constant state of convergence nor one of divergence; instead, the relationship can vary over time and space [24,54,55,56,57]. Recent studies suggest that it is essential to take the potential asymmetry of housing price cycles into account in analyzing ripple effects and the contagion process. Such asymmetry may be caused by nonlinearity in the determinants and behavioral responses, particularly by equity constraints and loss aversion [54,55]. André et al. [54] examine differences in the magnitude (deepness asymmetry) and speed (steepness asymmetry) of price changes for upswings and downturns at the regional level in the US, and find that housing prices are asymmetric in the majority of states and metropolitan statistical areas. Some studies indicate that the co-movement of regional housing prices in the UK and the US is stronger during upswings than during downswings [32,39,58]. Moreover, Cook’s [59] study of the UK provides a range of evidence that regions in the southeast of the UK experience faster convergence following downswings in prices, whereas other regions exhibit more rapid convergence following price increases.
Given the importance of spatial heterogeneity and complexity in the housing market, some scholars insist that regional housing prices cannot converge to a single steady group of prices. Drake [44] finds clear regional differences in the pattern of UK house price movements. Subsequently, researchers investigated this phenomenon under the framework of convergence clubs [56,57,58,59,60,61,62,63,64,65,66] and usually with the help of the clustering procedure of Philips and Sul [67]. Most existing studies explored the convergence clubs at the provincial/state or inter-urban scales. Apergis and Payne [56] found three convergence clubs by state from 1975 to 2010 in the US, while Kim and Rous [57] found four convergence clubs by state and metropolitan area from 1975 to 2008 in the US. Montagnoli and Nagayasu [58] show that housing prices across the UK fall into four groups. Blanco et al. [59] demonstrate the existence of convergence clubs in Spanish regions, and suggest that differences in population growth, the size of the rental market, initial house supply, and geographical situation are crucial determinants of convergence club membership. Tomal [60] discovered a U-shape pattern of convergence, and three convergence clubs on both primary and secondary markets in Poland. Apergis et al. [61] found that South Africa’s housing market can be divided into two convergence clubs. Empirical evidence also supports the existence of heterogeneous convergence clubs in China. For example, Meng et al. [62] found that 10 key cities in China can be grouped into two clubs, and Lin et al. [63] found similar results for the new housing market and second-hand housing market over 69 large and medium-sized cities.
In recent years, some scholars have attempted to investigate the long-run convergence of housing prices within cities, albeit with mixed results [24,68,69]. Holmes et al. [70] provided evidence for the existence of long-run property price convergence in London. However, in their most recent paper, they pointed out that there are four housing price convergence clubs in London, rather than a single club, which can be explained by differences in location, distance, income, population density, congestion, education, and housing types [24]. However, there are few studies on the long-run housing price convergence at the intra-urban scale.

3. Data and Methodology

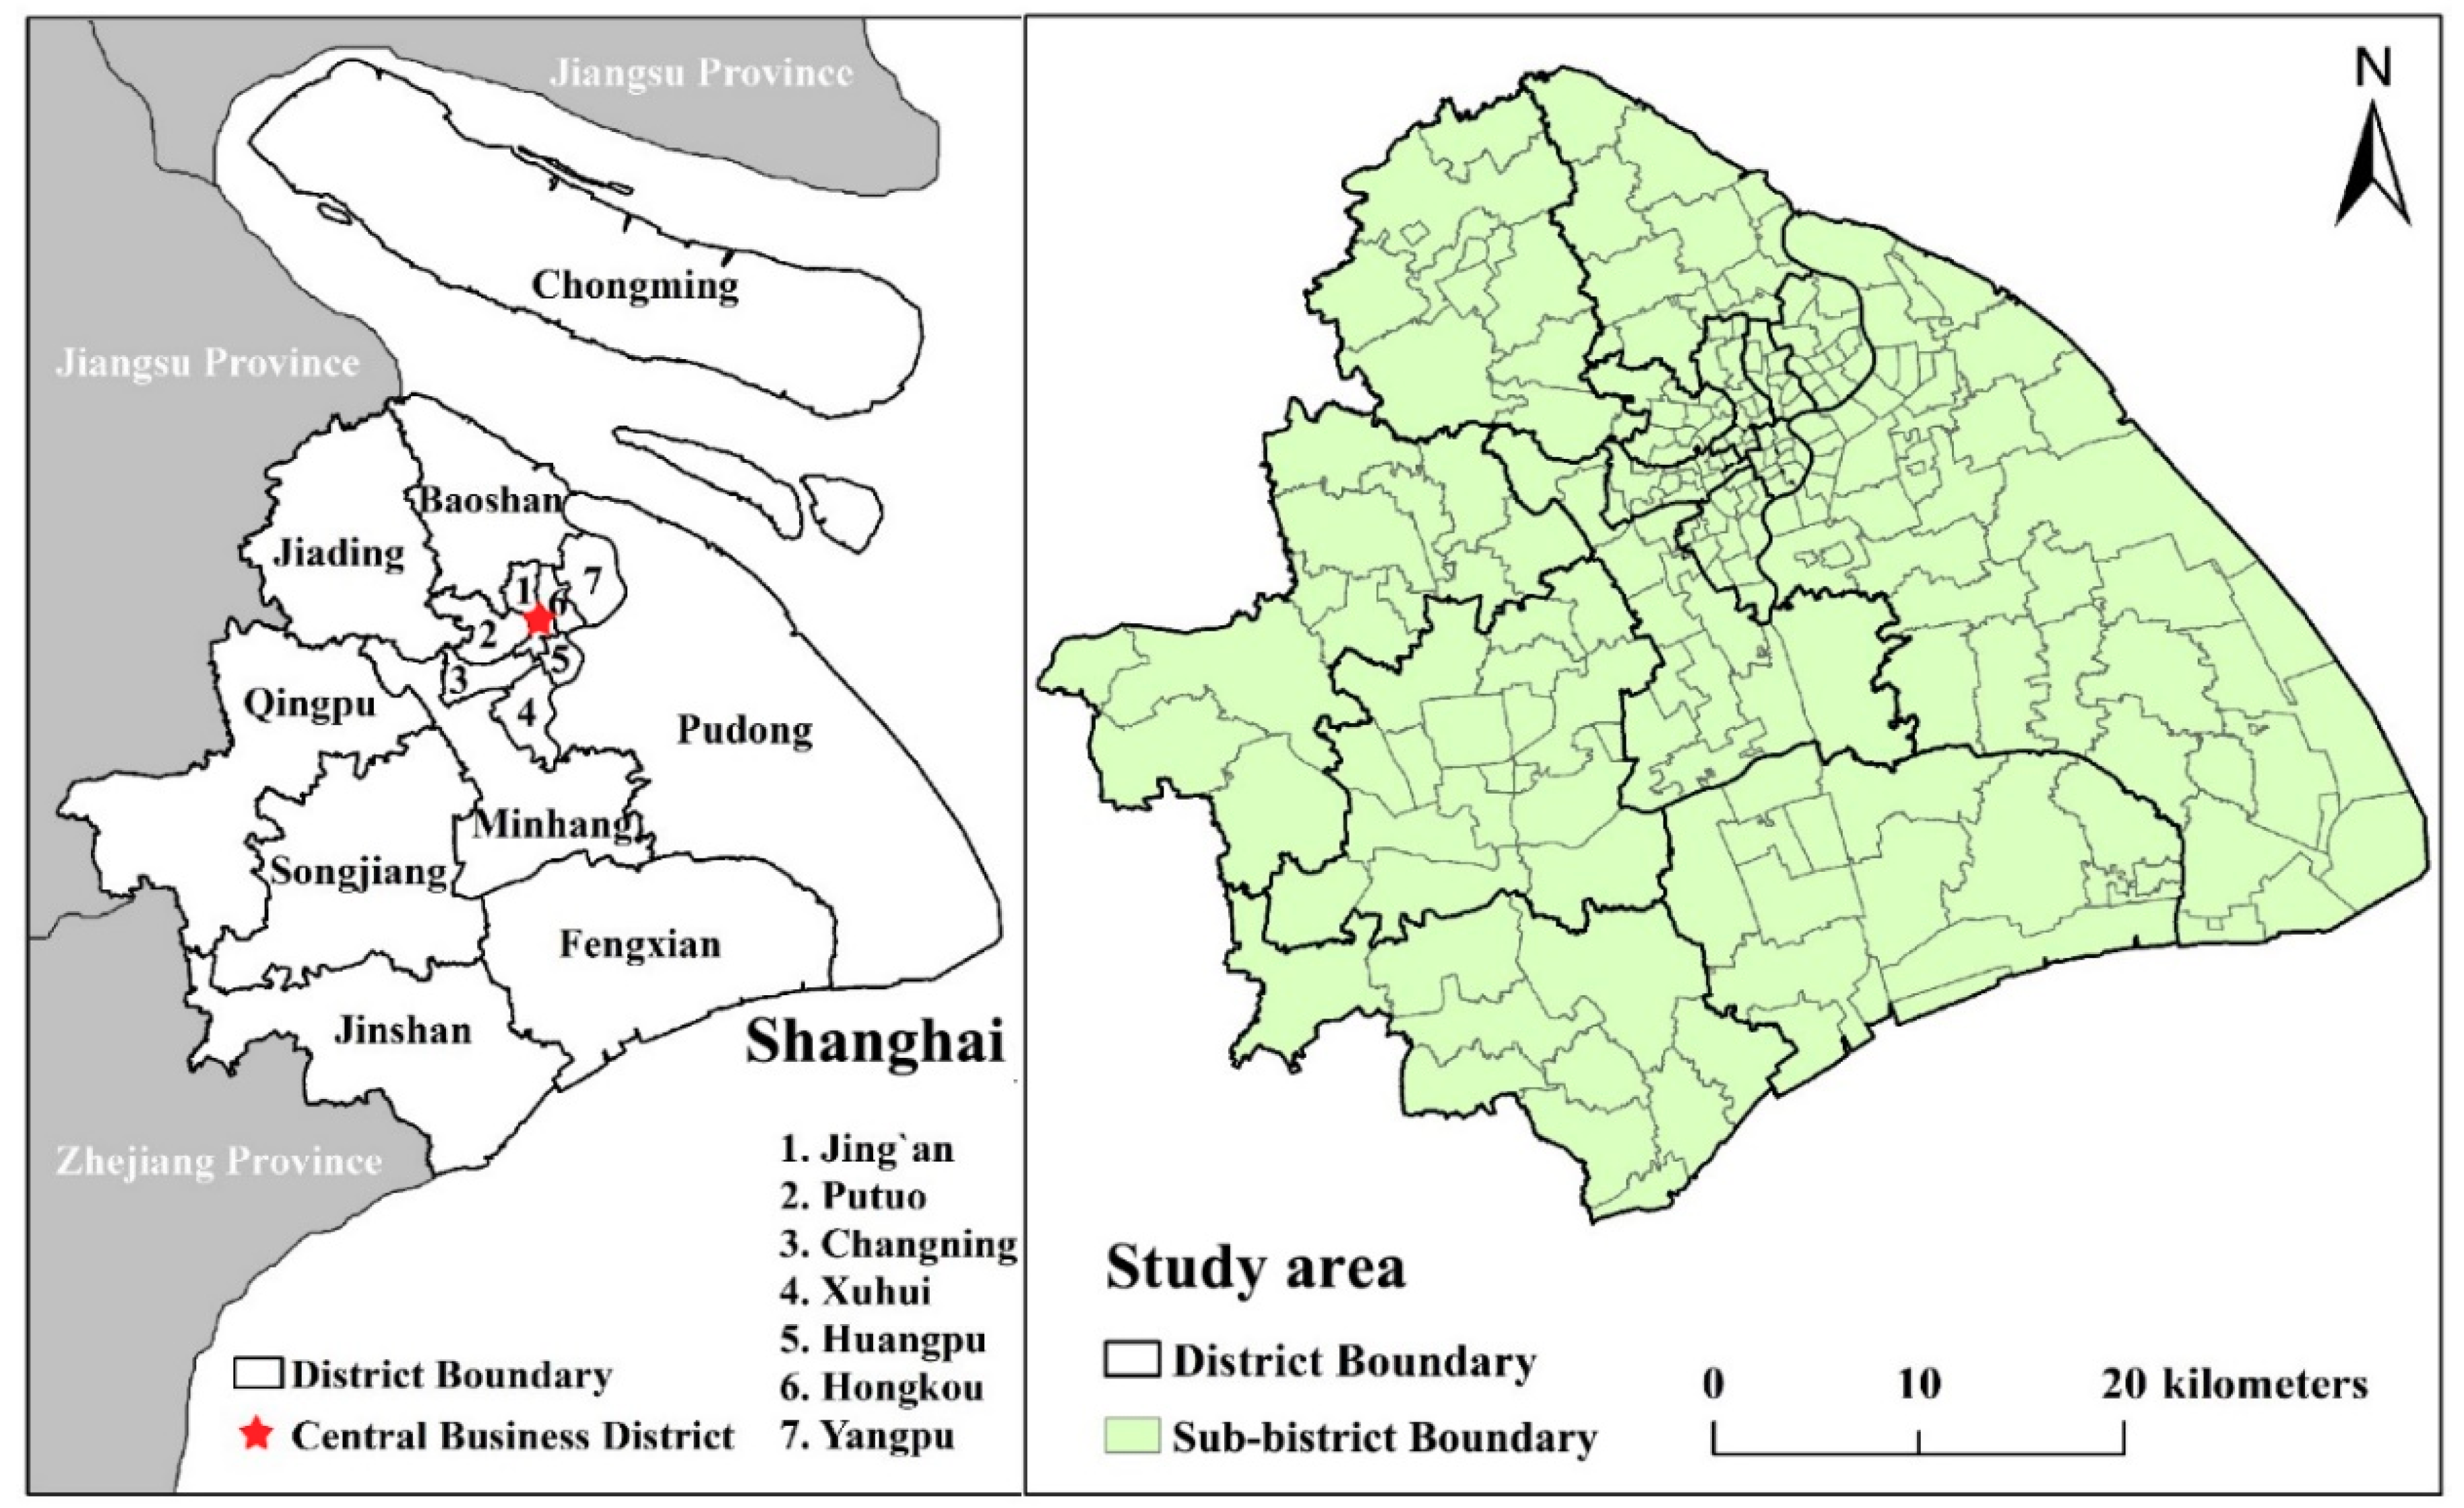
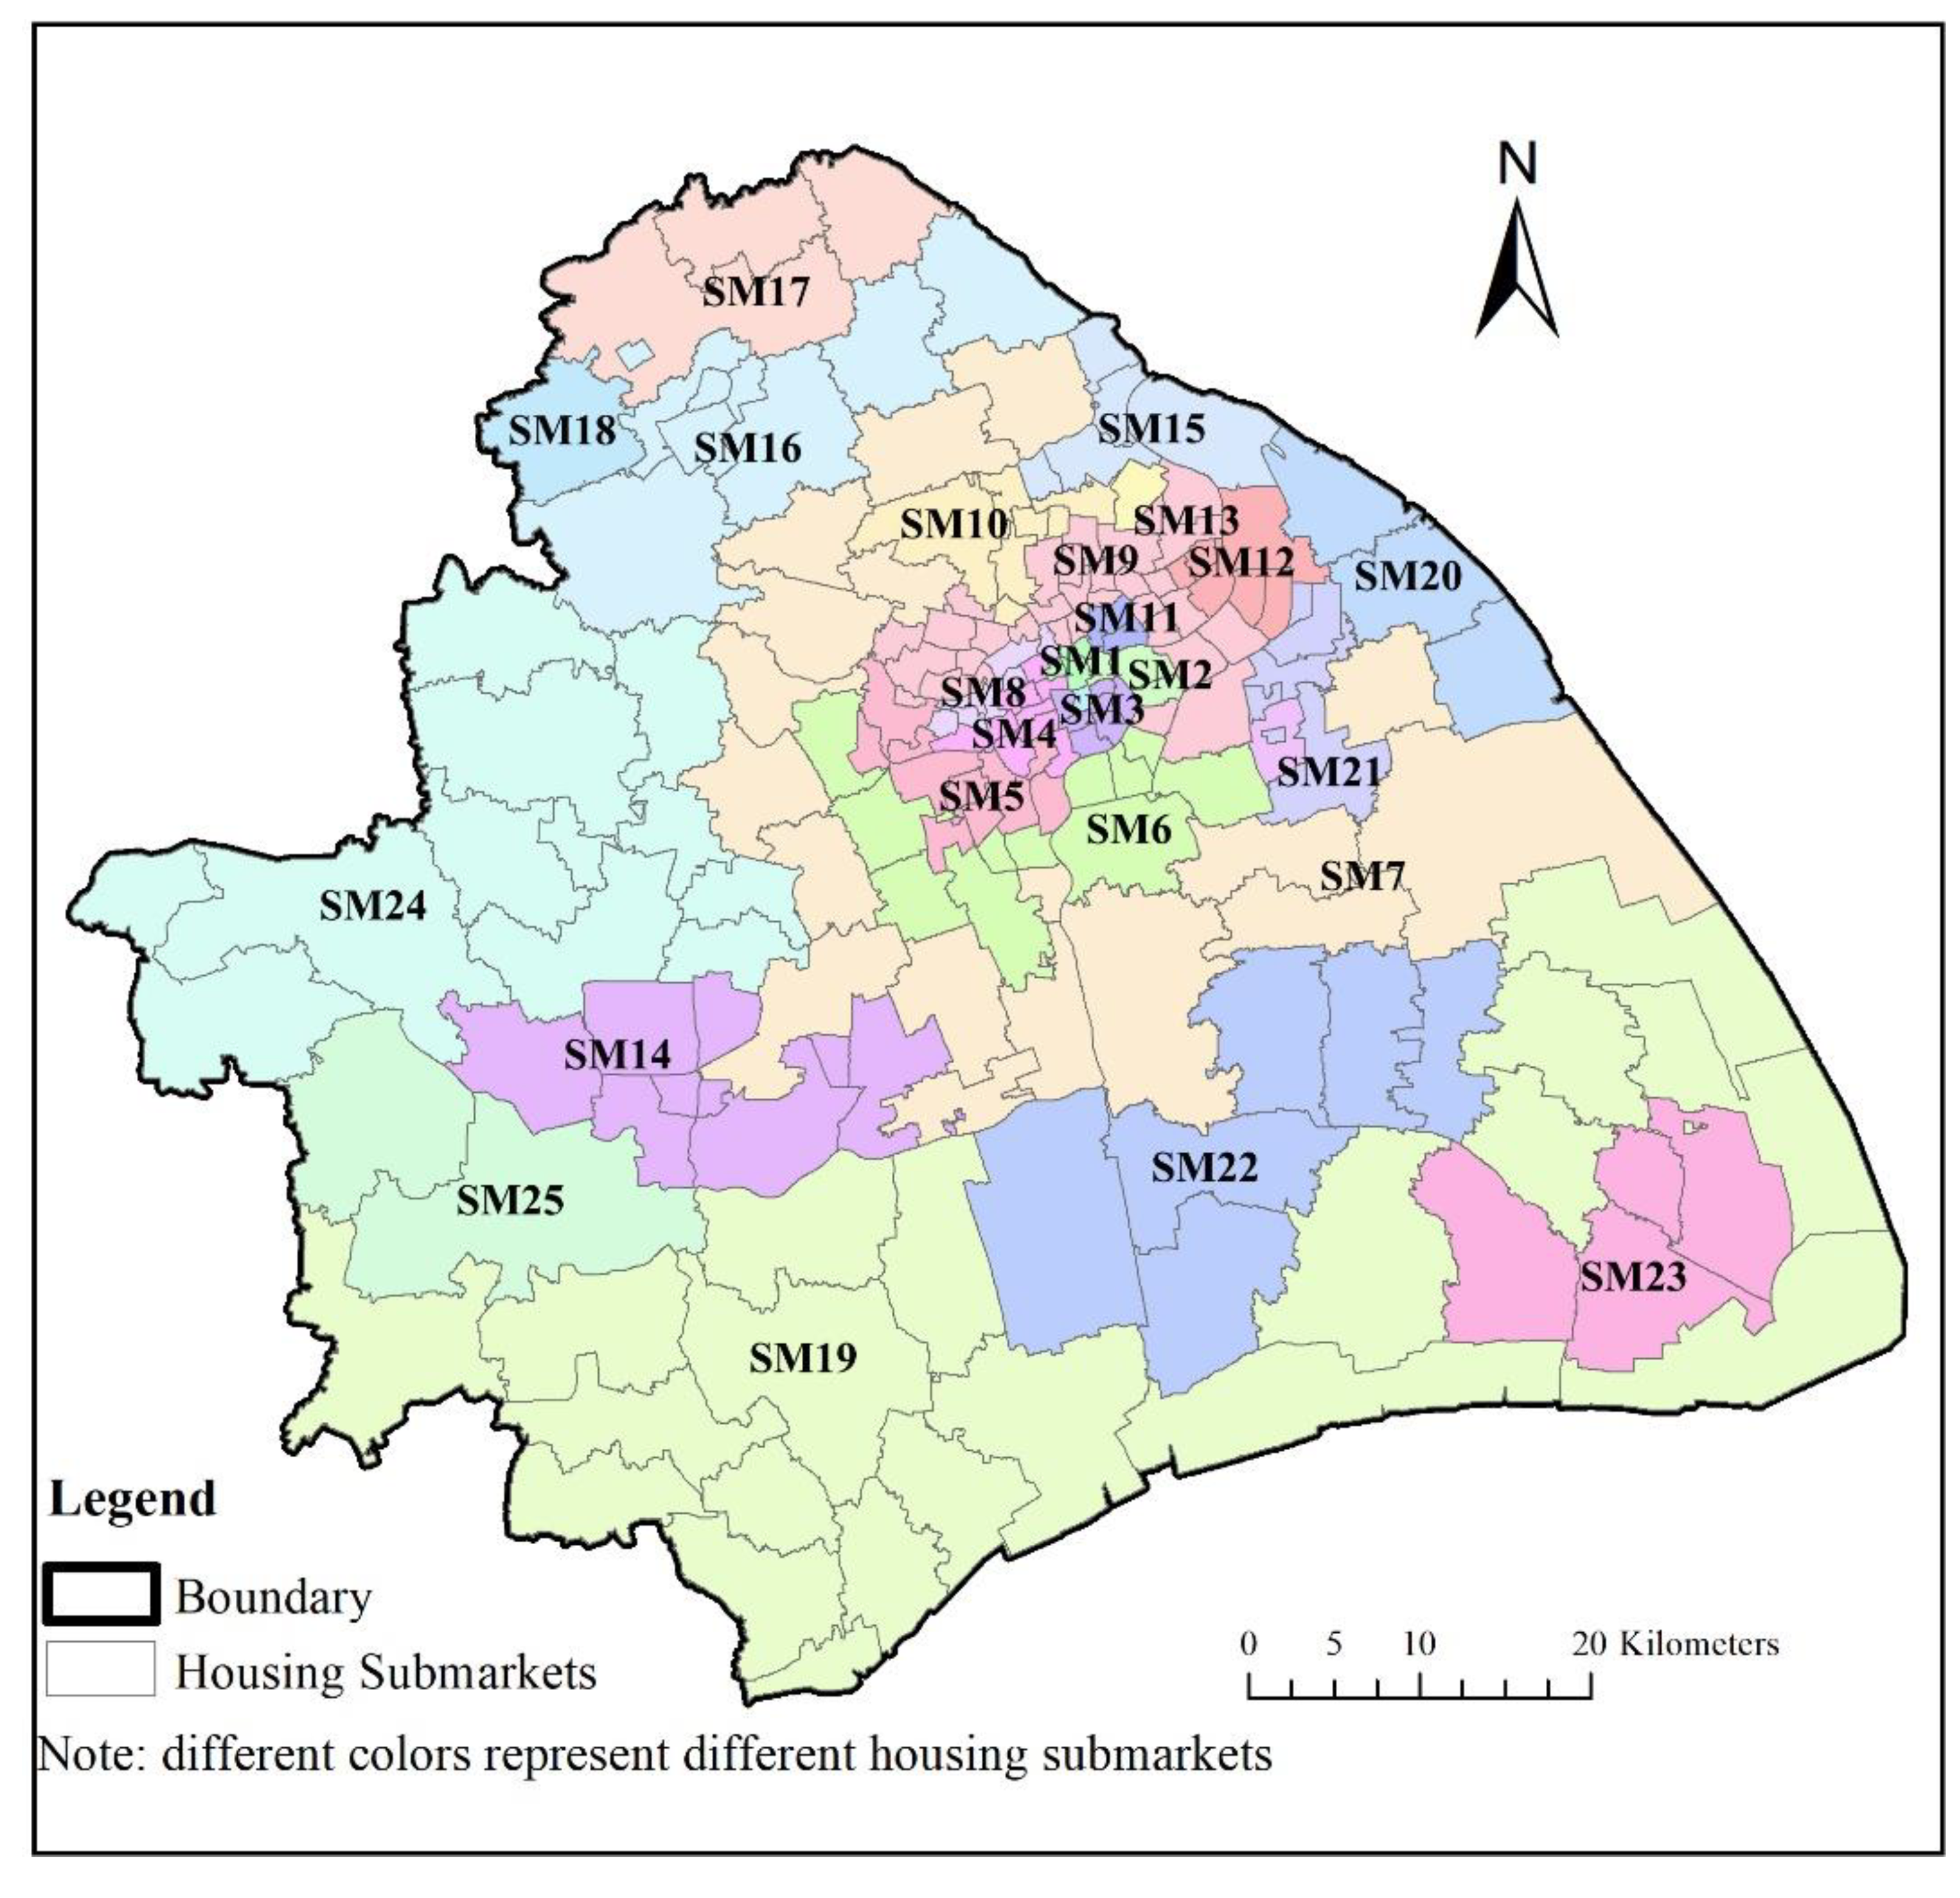
3.1. Study Area and Data Processing

The area considered in this study is the Shanghai municipality, excluding the Chongming district (Figure 1). Shanghai was chosen because it is the largest city in China and an emerging global city, with a more developed housing market than other Chinese cities [71,72]. Over the past four decades, Shanghai has undergone a profound restructuring of its economy and infrastructure, as well as its housing market [67,73,74,75]. Similar to other cities in China, the housing market in Shanghai has been booming since 1998, when the central government launched market-oriented housing reforms and completely abolished the traditional housing allocation system, which operated through a work unit–employee linkage [76]. According to Shanghai Statistical Yearbooks, the average sales price for new-builds in Shanghai soared from 1421.1 yuan/m2 in 2000 to 24,865.6 yuan/m2 in 2017, creating serious wealth inequality and housing affordability problems [77]. According to Numbeo (https://www.numbeo.com/), in 2020, the housing price-to-income ratio of 41.5 was the seventh highest in the world and the fourth highest in China (after Hong Kong, Shenzhen, and Beijing). In addition, the distribution of housing prices in Shanghai is spatially uneven, with high-priced areas mainly located in the inner city and prices decreasing steadily with distance to the CBD (the People’s Square) [71].
In 2003, Shanghai was one of the first cities in China to implement real estate registration, and has since accumulated a long-term series of housing transaction data, an essential requirement in examining the ripple effect. The housing transaction data were provided by the local land and housing registration department in Shanghai. The database includes information on the house ID, transaction date, transaction method, sale price, house size, type, age, address, and township (xiangzheng or jiedao), for both primary and secondary transaction records, collected from transaction contracts, from 2004–2018. Given that real estate developers often reported an artificially low transaction price to reduce or avoid taxes in the early years of the housing market, and that the primary market data have a smaller geographic coverage than the secondary market data [72], our analysis excludes the primary market data and focuses on the secondary market data.
Using the information on townships, we can calculate the total sales price and housing size, and then average the housing prices for every quarter, subdistrict by subdistrict (town or jiedao). To remove some of the inaccurate information in the database (the fake prices reported by real estate agents), we neglected the 1% of transaction records at the top (highest prices) and bottom (lowest prices) of the average price range for every quarter, subdistrict by subdistrict [78].

3.2. Methodology

3.2.1. Grouping Analysis and Space–Time Analysis

Considering that 194, too many, subdistrict units in the study area may lead to difficulties in identifying the price relationship between different units, we merged subdistricts into several housing submarkets. There is no widely accepted method of identifying housing submarkets [19,20,27,79]. In this study, we conducted a grouping analysis with the assistance of a spatial statistics tool in ArcMap 10.2 to identify housing submarkets in Shanghai. This tool can classify data into several natural groups based on one or more analysis fields. Specifically, the tool uses unsupervised machine-learning to seek a solution, such that all features within each group are as similar as possible and all groups are as different as possible. In this study, the housing submarkets were classified at the subdistrict level using the average housing prices, specifically prices for both the first quarter (Q1) of 2004 and the fourth quarter (Q4) of 2018, as the analysis field. The spatial constraint that subdistricts in the same housing submarket should share borders was also applied.
We used a local indicators of spatial association (LISA) time-path and a directed acyclic graph (DAG) to investigate the interaction relationship and spillover effect of housing prices across submarkets. The LISA time-path can be regarded as a continuous representation of the Markov transfer matrix [80], and plotting this path extends Luc Anselin’s LISA into the dynamic context, illustrating the pairwise movement of a unit’s observation value (average housing price) and its spatial lag over time [80]. The path of submarket i can be described as [(yi,1, yli,1), (yi, 2, yli, 2),..., (yi,T, yli,T)], where yi,t is the average housing price of submarket i at time t and yli,t is its corresponding spatial lag term. The path of submarket i can then be drawn by connecting all the coordinates in temporal order on the Moran scatter plot. The length of the time-path, used to estimate the dynamics of the local spatial structure of the housing market, can be calculated as follows:
Γ i = N i = 1 T 1 d ( L i , t , L i , t + 1 ) i = 1 N i = 1 T 1 d ( L i , t , L i , t + 1 )
where Li,t denotes the location of observation unit (housing submarket) i on the Moran scatter plot at time t, d(Li,t, Li,t+1) denotes the distance between submarket i at times t and t + 1, and N is the number of housing markets.
The DAG is applied to represent conditional independence, as implied by the recursive product decomposition [81], which can be defined by the following formula:
p r o b ( v 1 , v 2 , , v n ) = i = 1 n p r ( v i π i )
where prob represents the probability of variables v1, v2,..., vn. The symbol Π refers to the multiplication operator, and π i is the realization of a subset of variables that precede (come before in a causal sense) vi in order (i = 1, 2,..., n).
In this study, the DAG graphically represents the causality and direction between housing submarkets. The DAG takes the whole city as an integrated system, identifies the causal relationship within a period, and obtains the transmission path, direction, and network structure of the housing prices. In practice, we use lines and arrows to indicate the causal relationship and its directivity between two submarkets; otherwise, the two are independent of each other.

3.2.2. The Convergence Test and Convergence Club Identification

The convergence test developed by Phillips and Sul is used to analyze the price convergence of the Shanghai housing market [82,83]. This test can detect the formation of convergence clubs among housing prices simultaneously [24]. In the framework, panel data on housing prices (HPit) contain both permanent common components that bring about cross-sectional dependence (git) and transitory components (ait). Thus, we have:
H P i t = g i t + a i t
where i = 1, …, N is the number of observation units (housing submarkets) in the panel and t = 1, …, T is the observation time. To separate these two components, Equation (3) is rewritten as:
H P i t = g i t + a i t μ t μ t = δ i t μ t
where μt denotes a time-varying component that is common to all housing submarkets and δit denotes a time-varying idiosyncratic component.
The relative transition parameter hit describes the transition path for submarket i over time, by removing the common component μt:
h i t = H P i t 1 N i = 1 N H P i t = δ i t μ i t 1 N i = 1 N δ i t μ i t = δ i t 1 N i = 1 N δ i t
which depicts the convergence process and measures δ i t in relation to the panel. Then, the cross-sectional variation Ht of hit is constructed as
H t = 1 N i = 1 N ( h i t 1 )
In Equations (5) and (6), the convergence for HPit implies that h i t   1 , and thus H t   0 as t   .
Then, the semi-parametric form of δ i t is:
δ i t = δ i + σ i ξ i t L ( t ) t α
where δ i a fixed term, ξ i t iid(0, 1) across i but is weakly dependent over t, and L(t) is a slowly varying function and L ( t )     with t   , such as log(t). Therefore, δ i t   δ i for all α ≥ 0.
In this context, the null hypothesis of convergence for all i can be represented as:
H 0 : δ i t = δ   and   α 0
while the divergence hypothesis is:
H A :   δ i t δ :   I     or   α < 0
According to Phillips and Sul [82], the log(t) regression can be described as:
l o g ( H 1 / H t ) 2 l o g L ( t ) =   c + b l o g t + u t ,     t = [ r T ] , . T
where L(t) = log(t + 1) and the estimated coefficient of log t is b = 2 α . Note that the parameter b is related to the rate of convergence under the null hypothesis, so that the higher the value of b, the faster the rate of convergence. Convergence is identified using a one-sided t-test when tb > −1.65, and the type of convergence is judged by the value of b, namely, if 0 < b < 2, convergence belongs to conditional convergence; if b > = 2, convergence is absolute convergence. Then, the test estimators adopt heteroskedasticity and an autocorrelation-consistent standard error. In particular, a fraction (1-r) of the observations are utilized in the log(t) regression. Based on Monte Carlo simulations, the trimming parameter r (0.2,0.3) is recommended by Phillips and Sul [67]. In general, setting r = 0.3 is for the small or moderate T (< =5 0) sample and setting r = 0.2 is for the large T (> = 100) sample.
Based on the log(t) test, Phillips and Sul’s clustering and merging procedure can be used to identify the potential convergence clubs of housing prices and their members. This study adopts the method with the help of the code in Stata and the four steps suggested by Holmes et al. [24,84]

4. Empirical Results

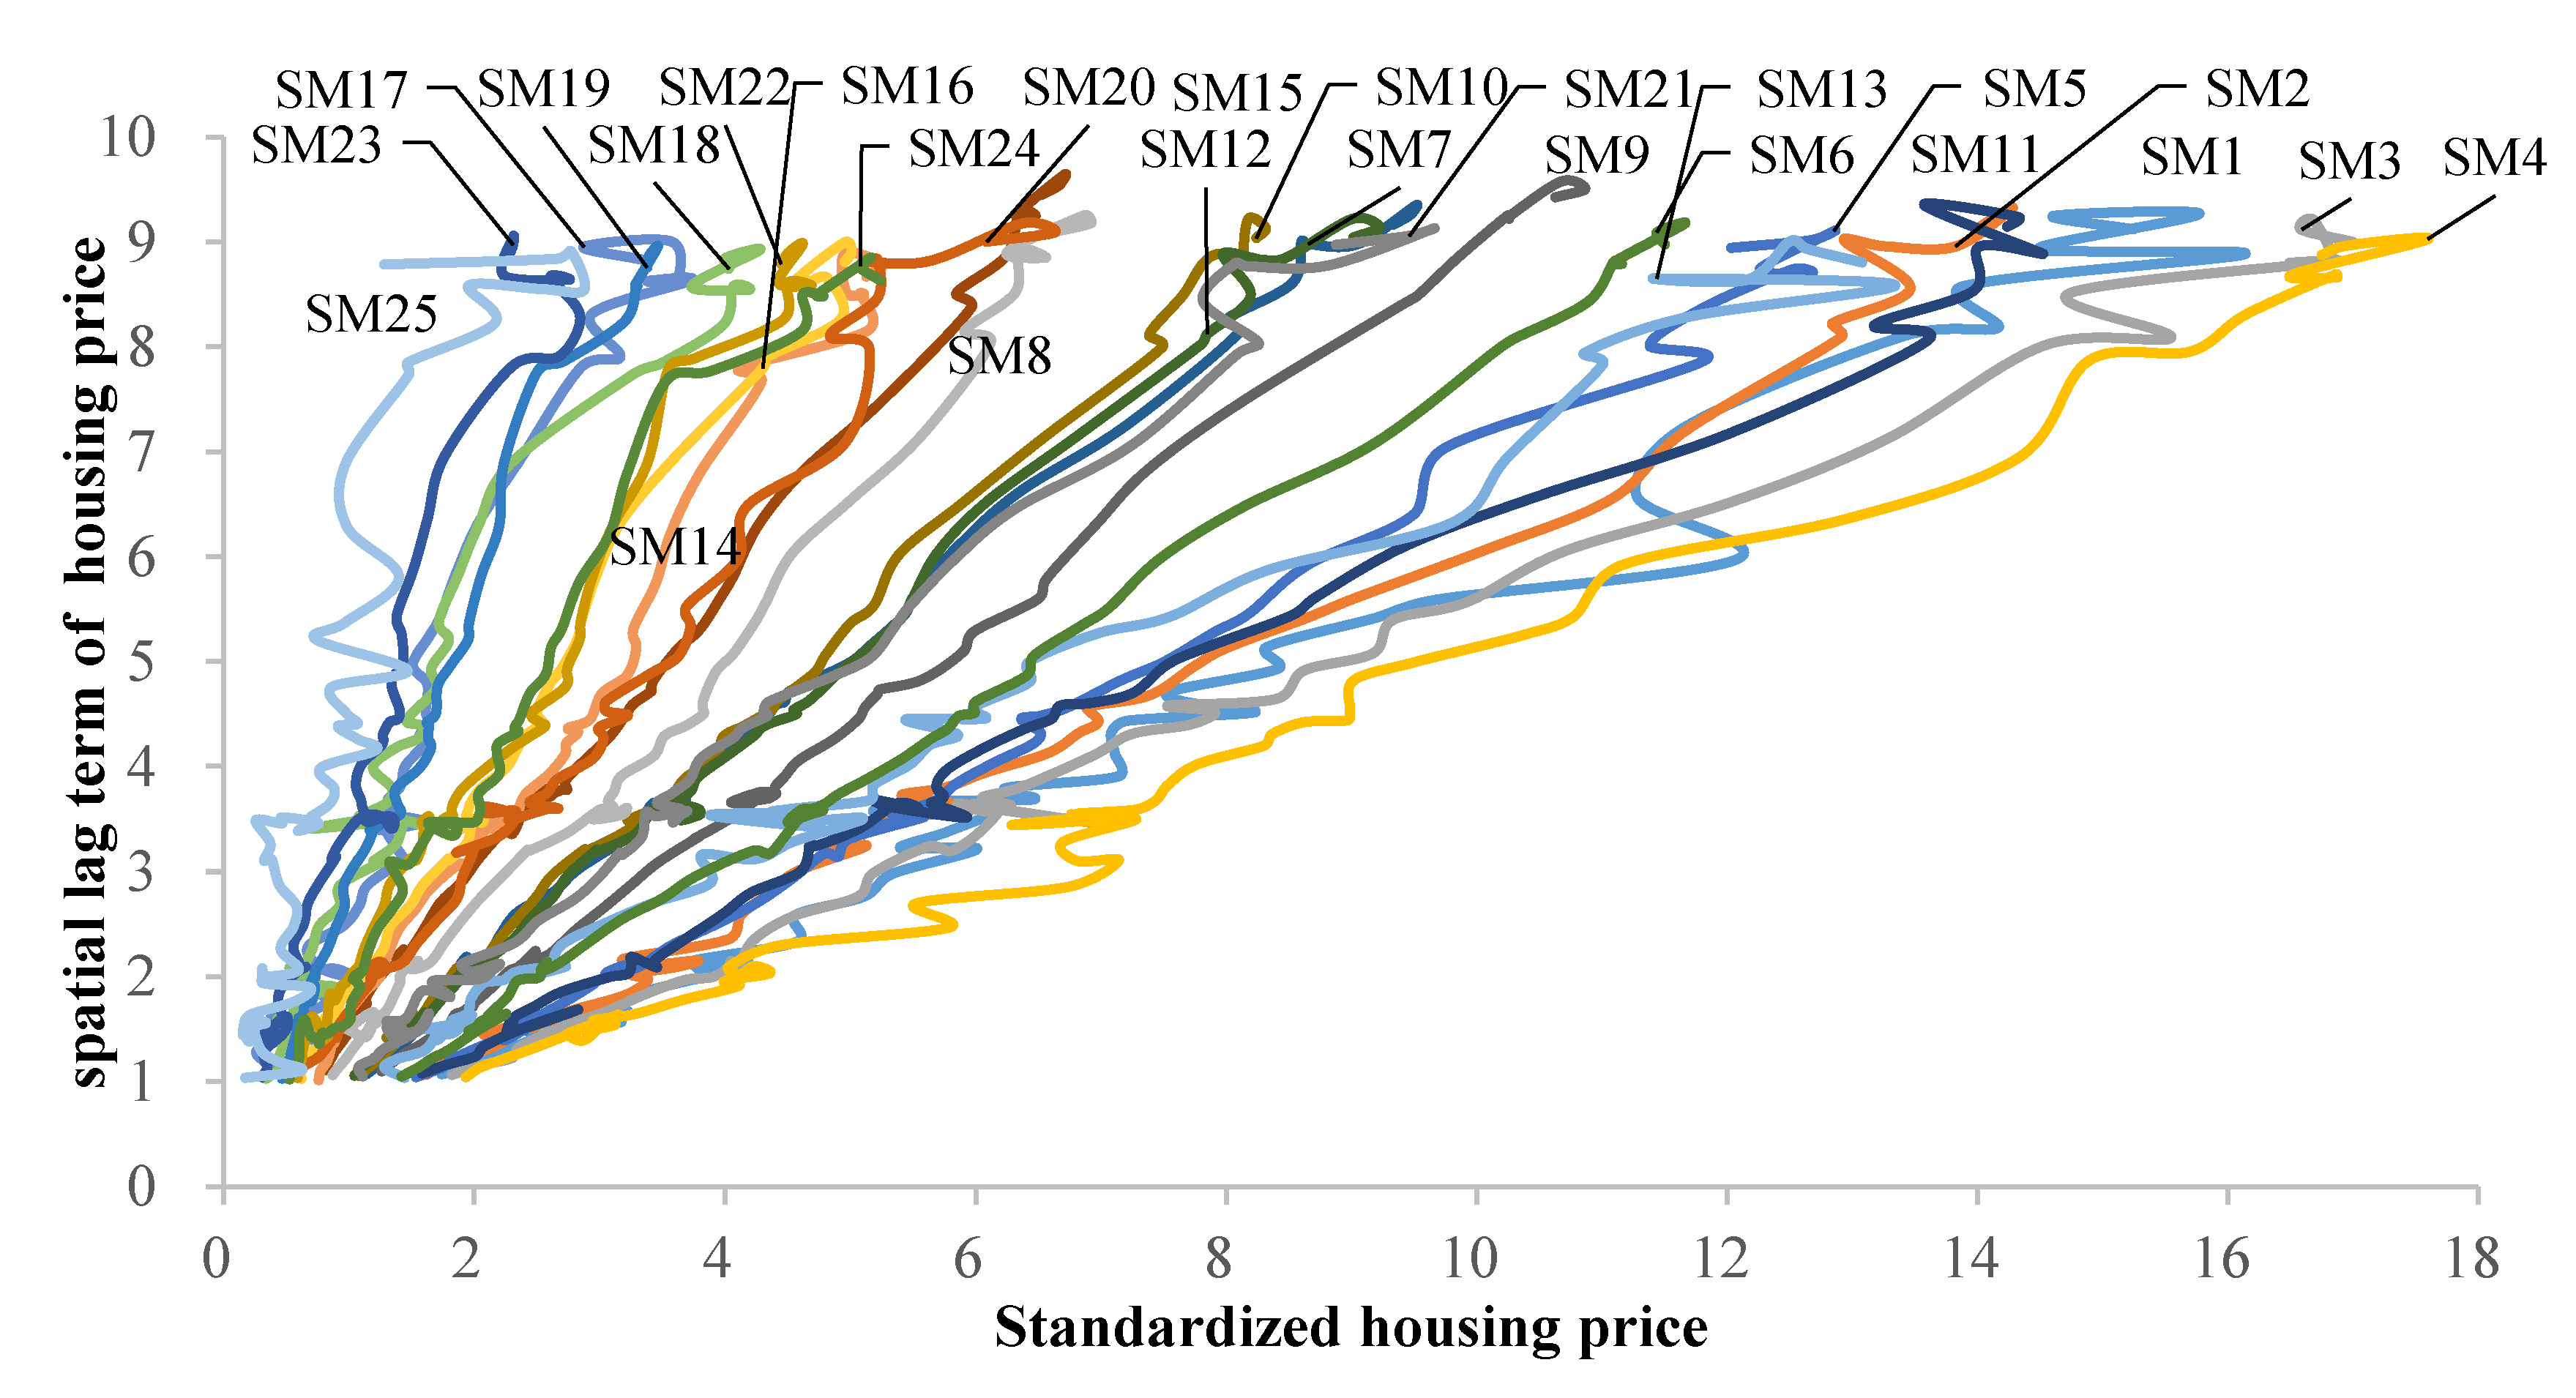
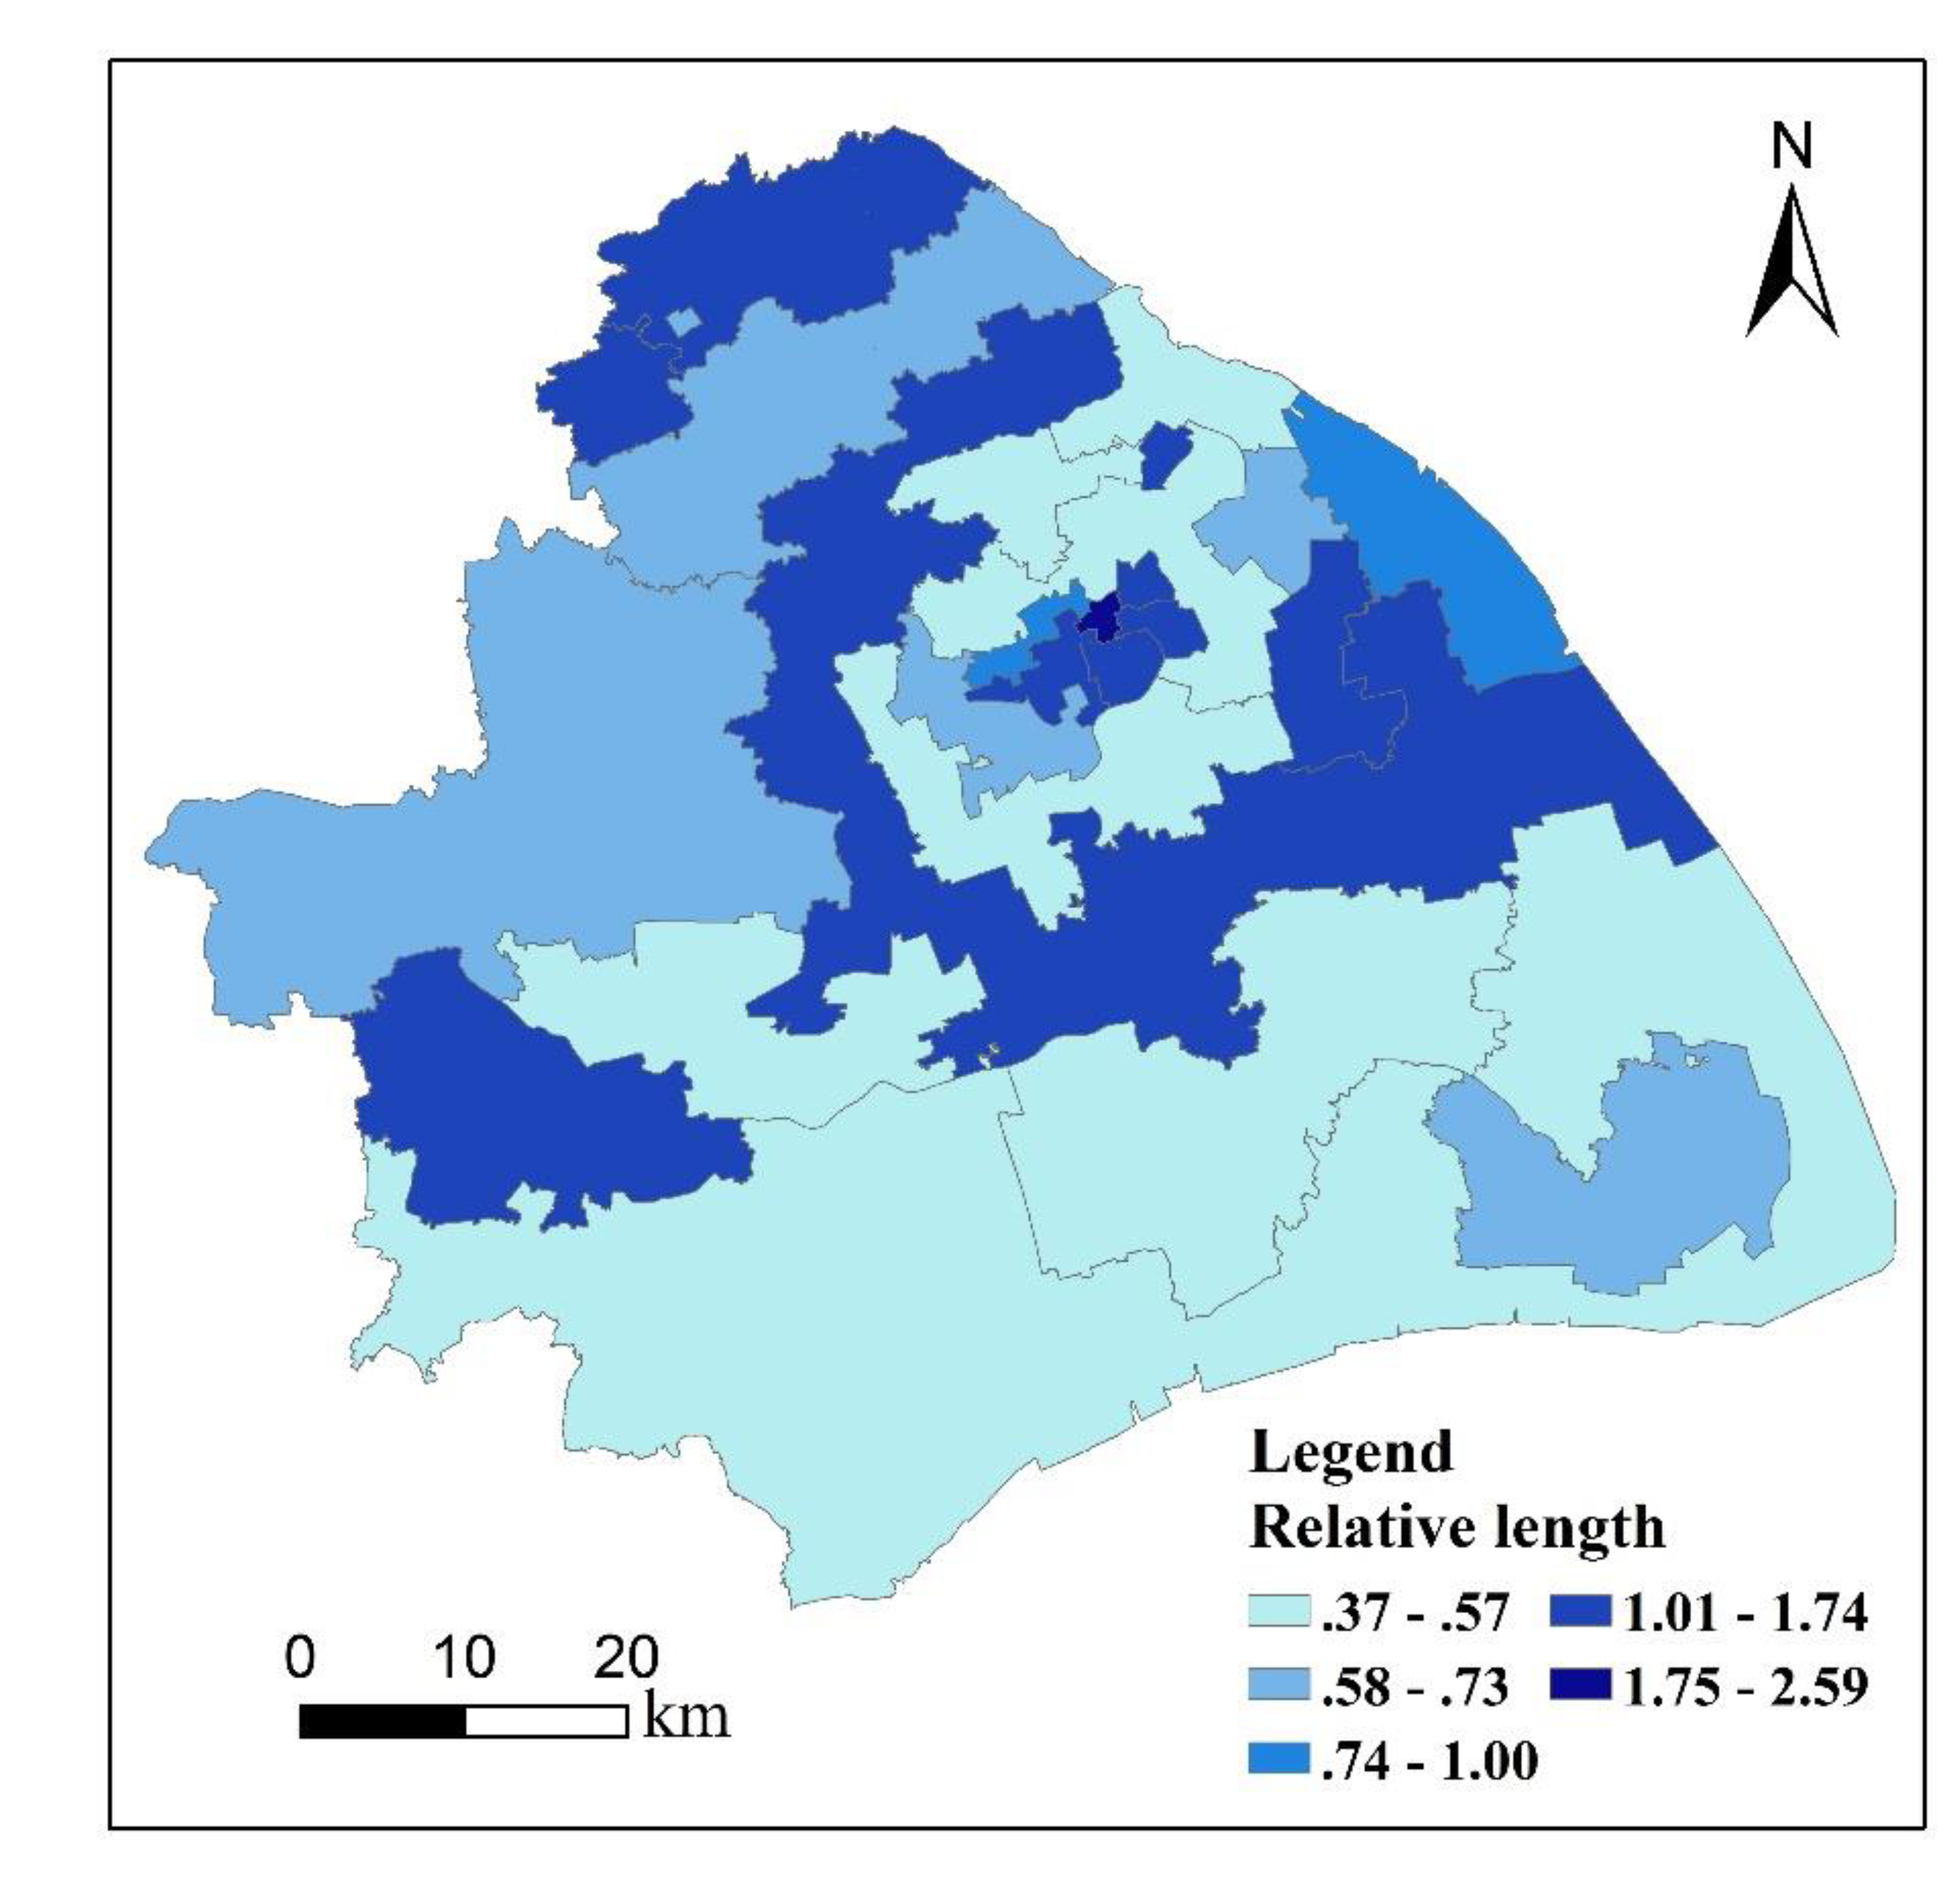
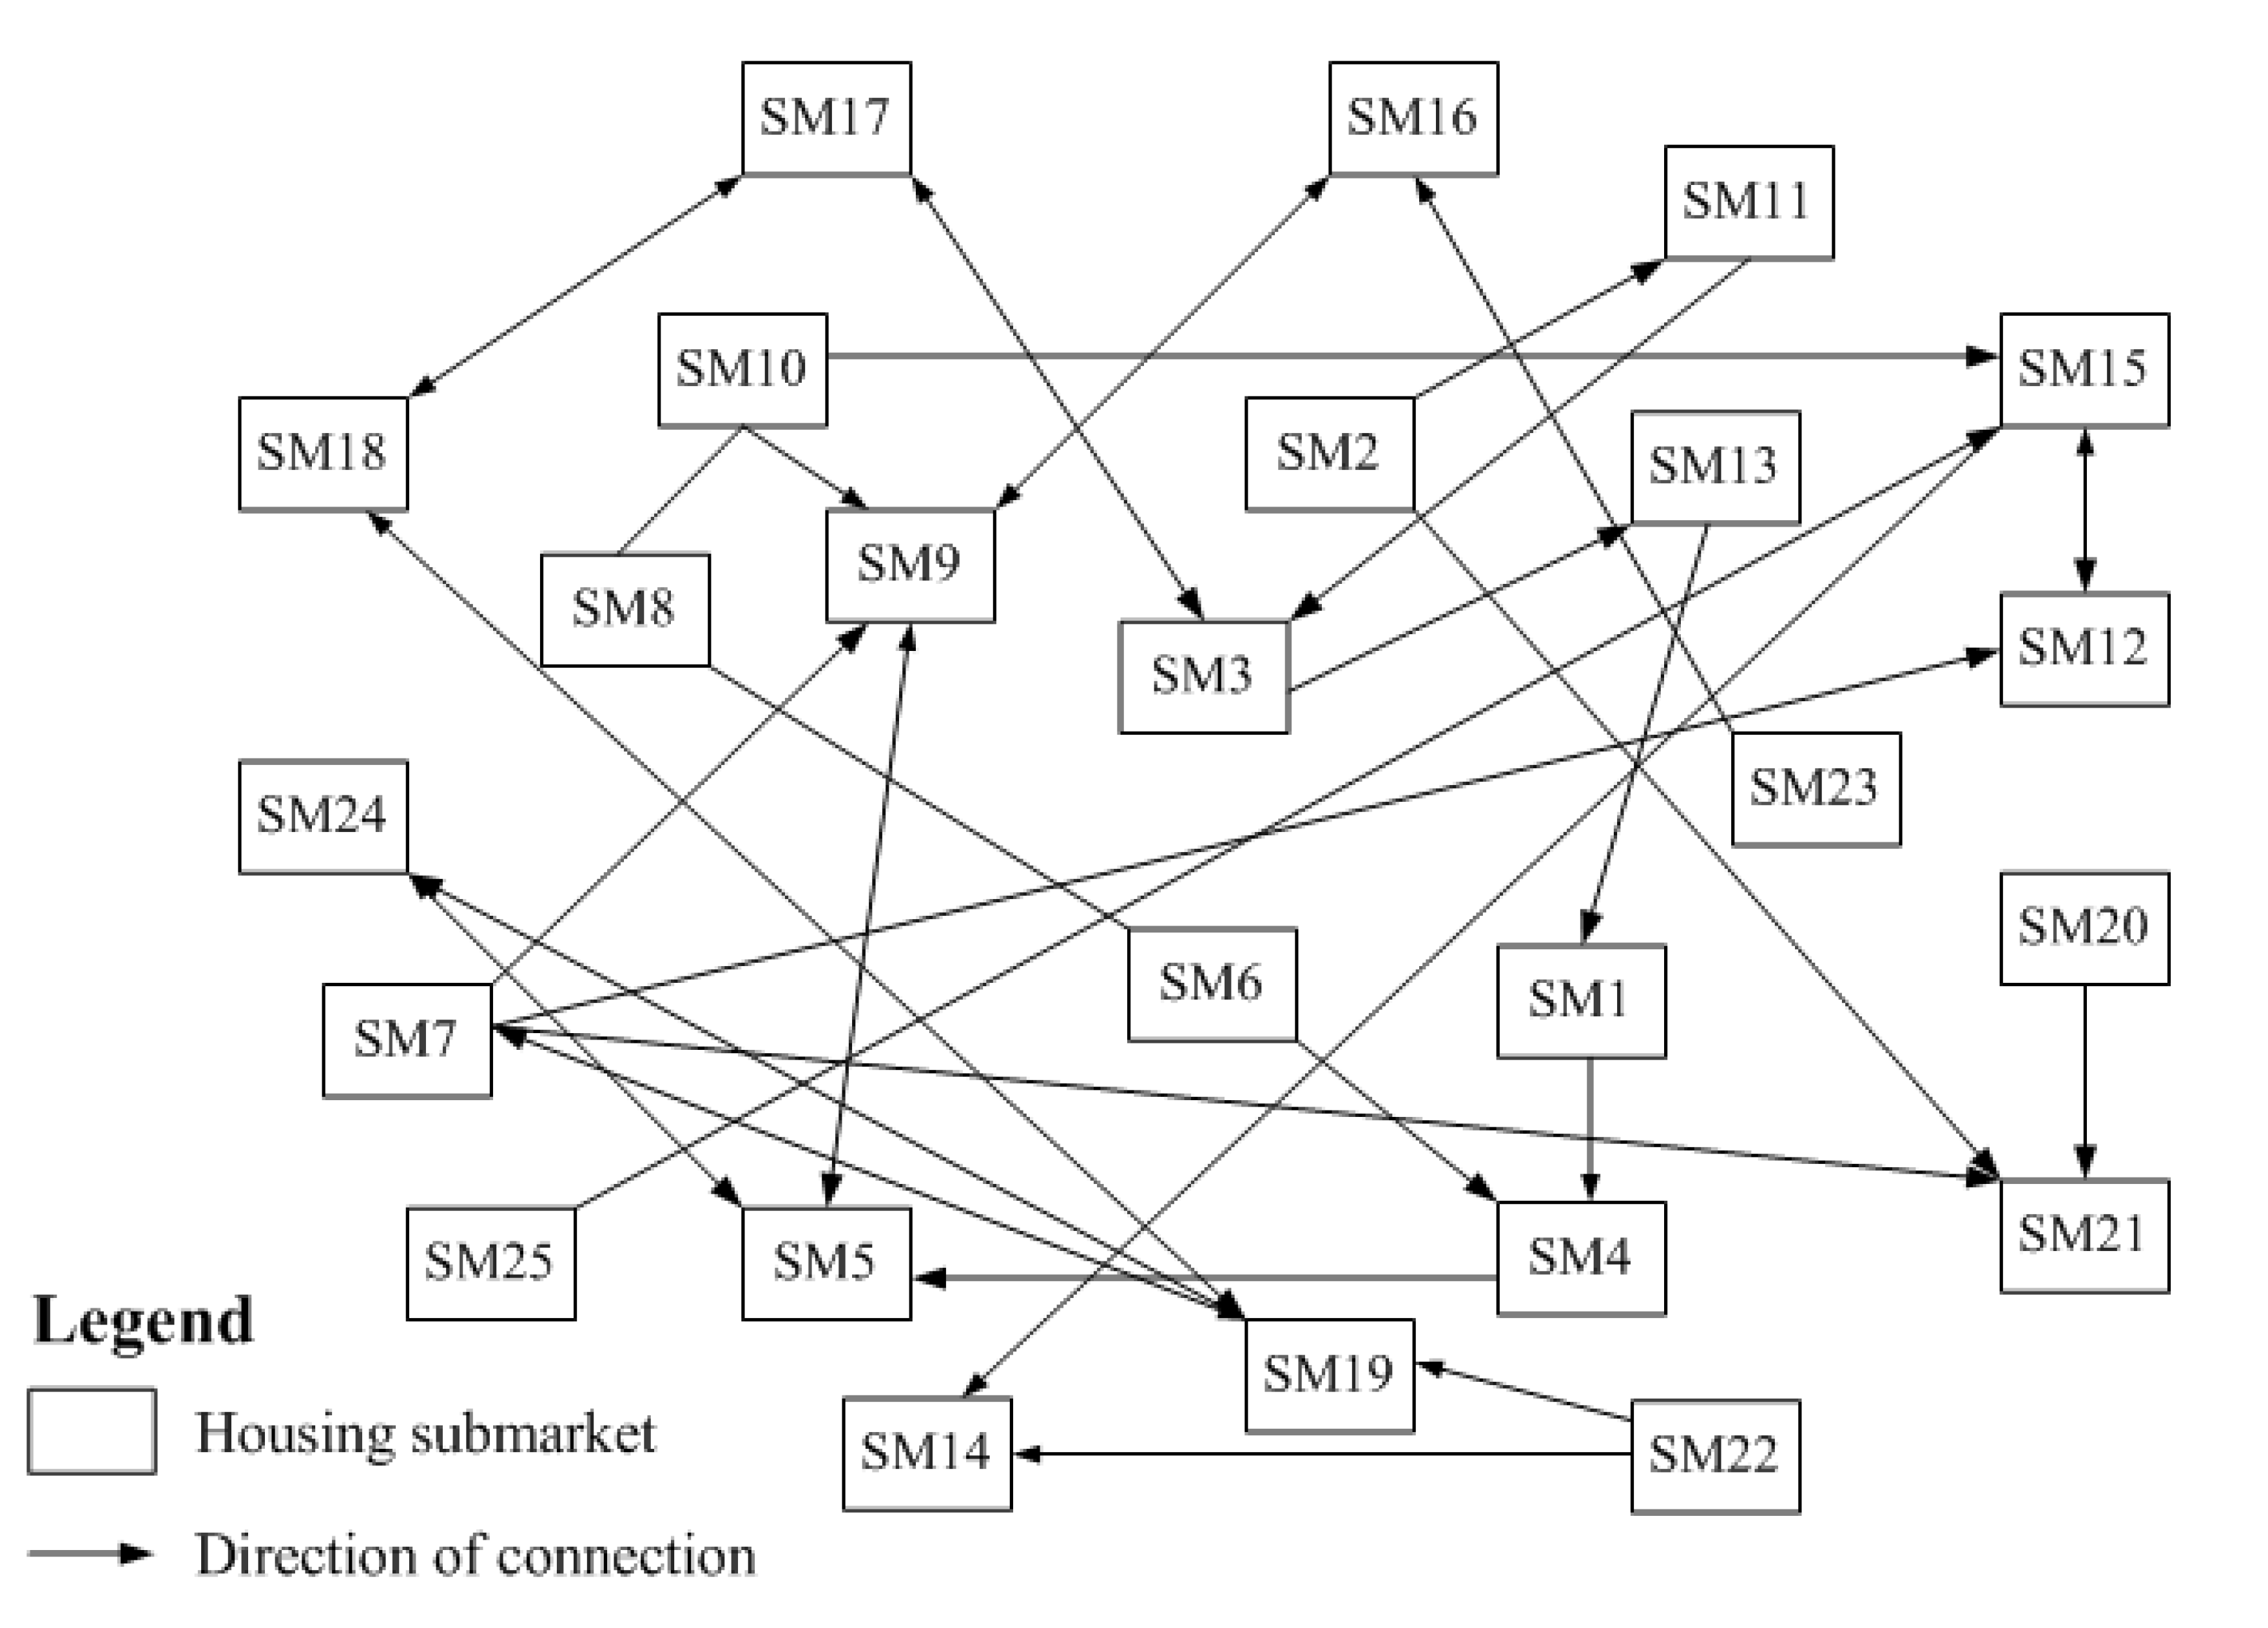
4.1. Spatiotemporal Distribution and Diffusion of Housing Prices across Submarkets in Shanghai

Using the grouping analysis tool, we delineated the housing submarkets in Shanghai city at the subdistrict level based on the average housing prices from 2004 (Q1) to 2018 (Q4). Initially, we detected 45 housing submarkets, which were then merged into the final 25 housing submarkets, based on the boundaries of the districts in Shanghai (see Figure 2).
Figure 3 illustrates the spatial distribution of average housing prices in the submarkets. In general, the distribution of housing prices is in line with the classical core–periphery structure, with the areas of highest prices agglomerated around the CBD (the People’s Square), and prices decreasing with distance from the CBD, which is consistent with existing studies [71,85]. Although housing prices have skyrocketed in recent decades, the overall spatial pattern of prices has not changed significantly. In 2006 (Q4), the high-priced submarkets with unit prices above 10,000 yuan/m2—SM1, SM2, SM3, SM4, SM6, and SM11—were concentrated in the inner-city area of Shanghai. By the fourth quarter of 2018, the areas with the highest prices (more than 50,000 yuan/m2) still include these six submarkets, but have expanded to surrounding areas, including SM9 and SM12. The low-priced submarkets are located in the outer ring of the city.
Figure 4 shows the overall coefficient of variation (CV) and Gini coefficient of housing prices across different submarkets in Shanghai. These metrics are used to estimate the inequality of intra-urban housing prices in this study. Overall, the inequality of house prices in Shanghai did not alter significantly from 2004 (Q1) to 2018 (Q4), with CVs ranging from 0.52–0.63 and Gini coefficients ranging from 0.29–0.35. This is because the spatial distribution of housing prices remained stable, with the highest-price areas located in the urban core from 2004–2018, although the average prices rose sharply. The remarkable fluctuations of these coefficients, such as from 2004 (Q1) to 2006 (Q1) and from 2015 (Q2) to 2017 (Q2), can be explained by the influence of housing policies, the development of a new urban district, and the layout of public facilities [15].
As shown in the LISA time-path plot (Figure 5), we can find similar upward movements over time among different submarkets, indicating the trend of ever-rising prices in all submarkets. We can also identify the existence of co-movement in housing prices, and the whole market can be roughly divided into four interrelated subgroups: (1) SM1, SM2, SM3, SM4, SM5, SM6, SM9, SM11, and SM13; (2) SM7, SM10, SM12, and SM21; (3) SM8, SM15, SM20, SM22, and SM24; and (4) SM12, SM18, SM19, SM23, and SM25. Moreover, the submarkets with longer LISA time-paths are mainly concentrated in the inner city, surrounding area of outer ring, and some border areas (see Figure 6). This indicates that housing prices in these areas have a more dynamic local spatial structure, whereas housing prices in the other areas have a more stable structure.
In this study, a DAG was introduced to investigate the diffusion network of housing prices among different submarkets (Figure 7). Generally, the DAG shows that the whole network has good connectivity, with each submarket connected to at least one other submarket. In other words, different submarkets interact with each other through the diffusion of housing prices [21]. Specifically, both geographic and economic proximity can be detected in the spillovers of housing prices. A spillover effect frequently occurs between adjacent submarkets (e.g., SM4 and SM5), although price diffusion also occurs between submarkets with similar regional economic attributes and conditions [50], such as spillovers among high-priced submarkets and among low-priced submarkets. In addition, the recursive processes of price spillovers are observed between different submarkets. For example, an unexpected price increase in a dominant region impacts prices in other regions, which in turn echo back to the dominant region.

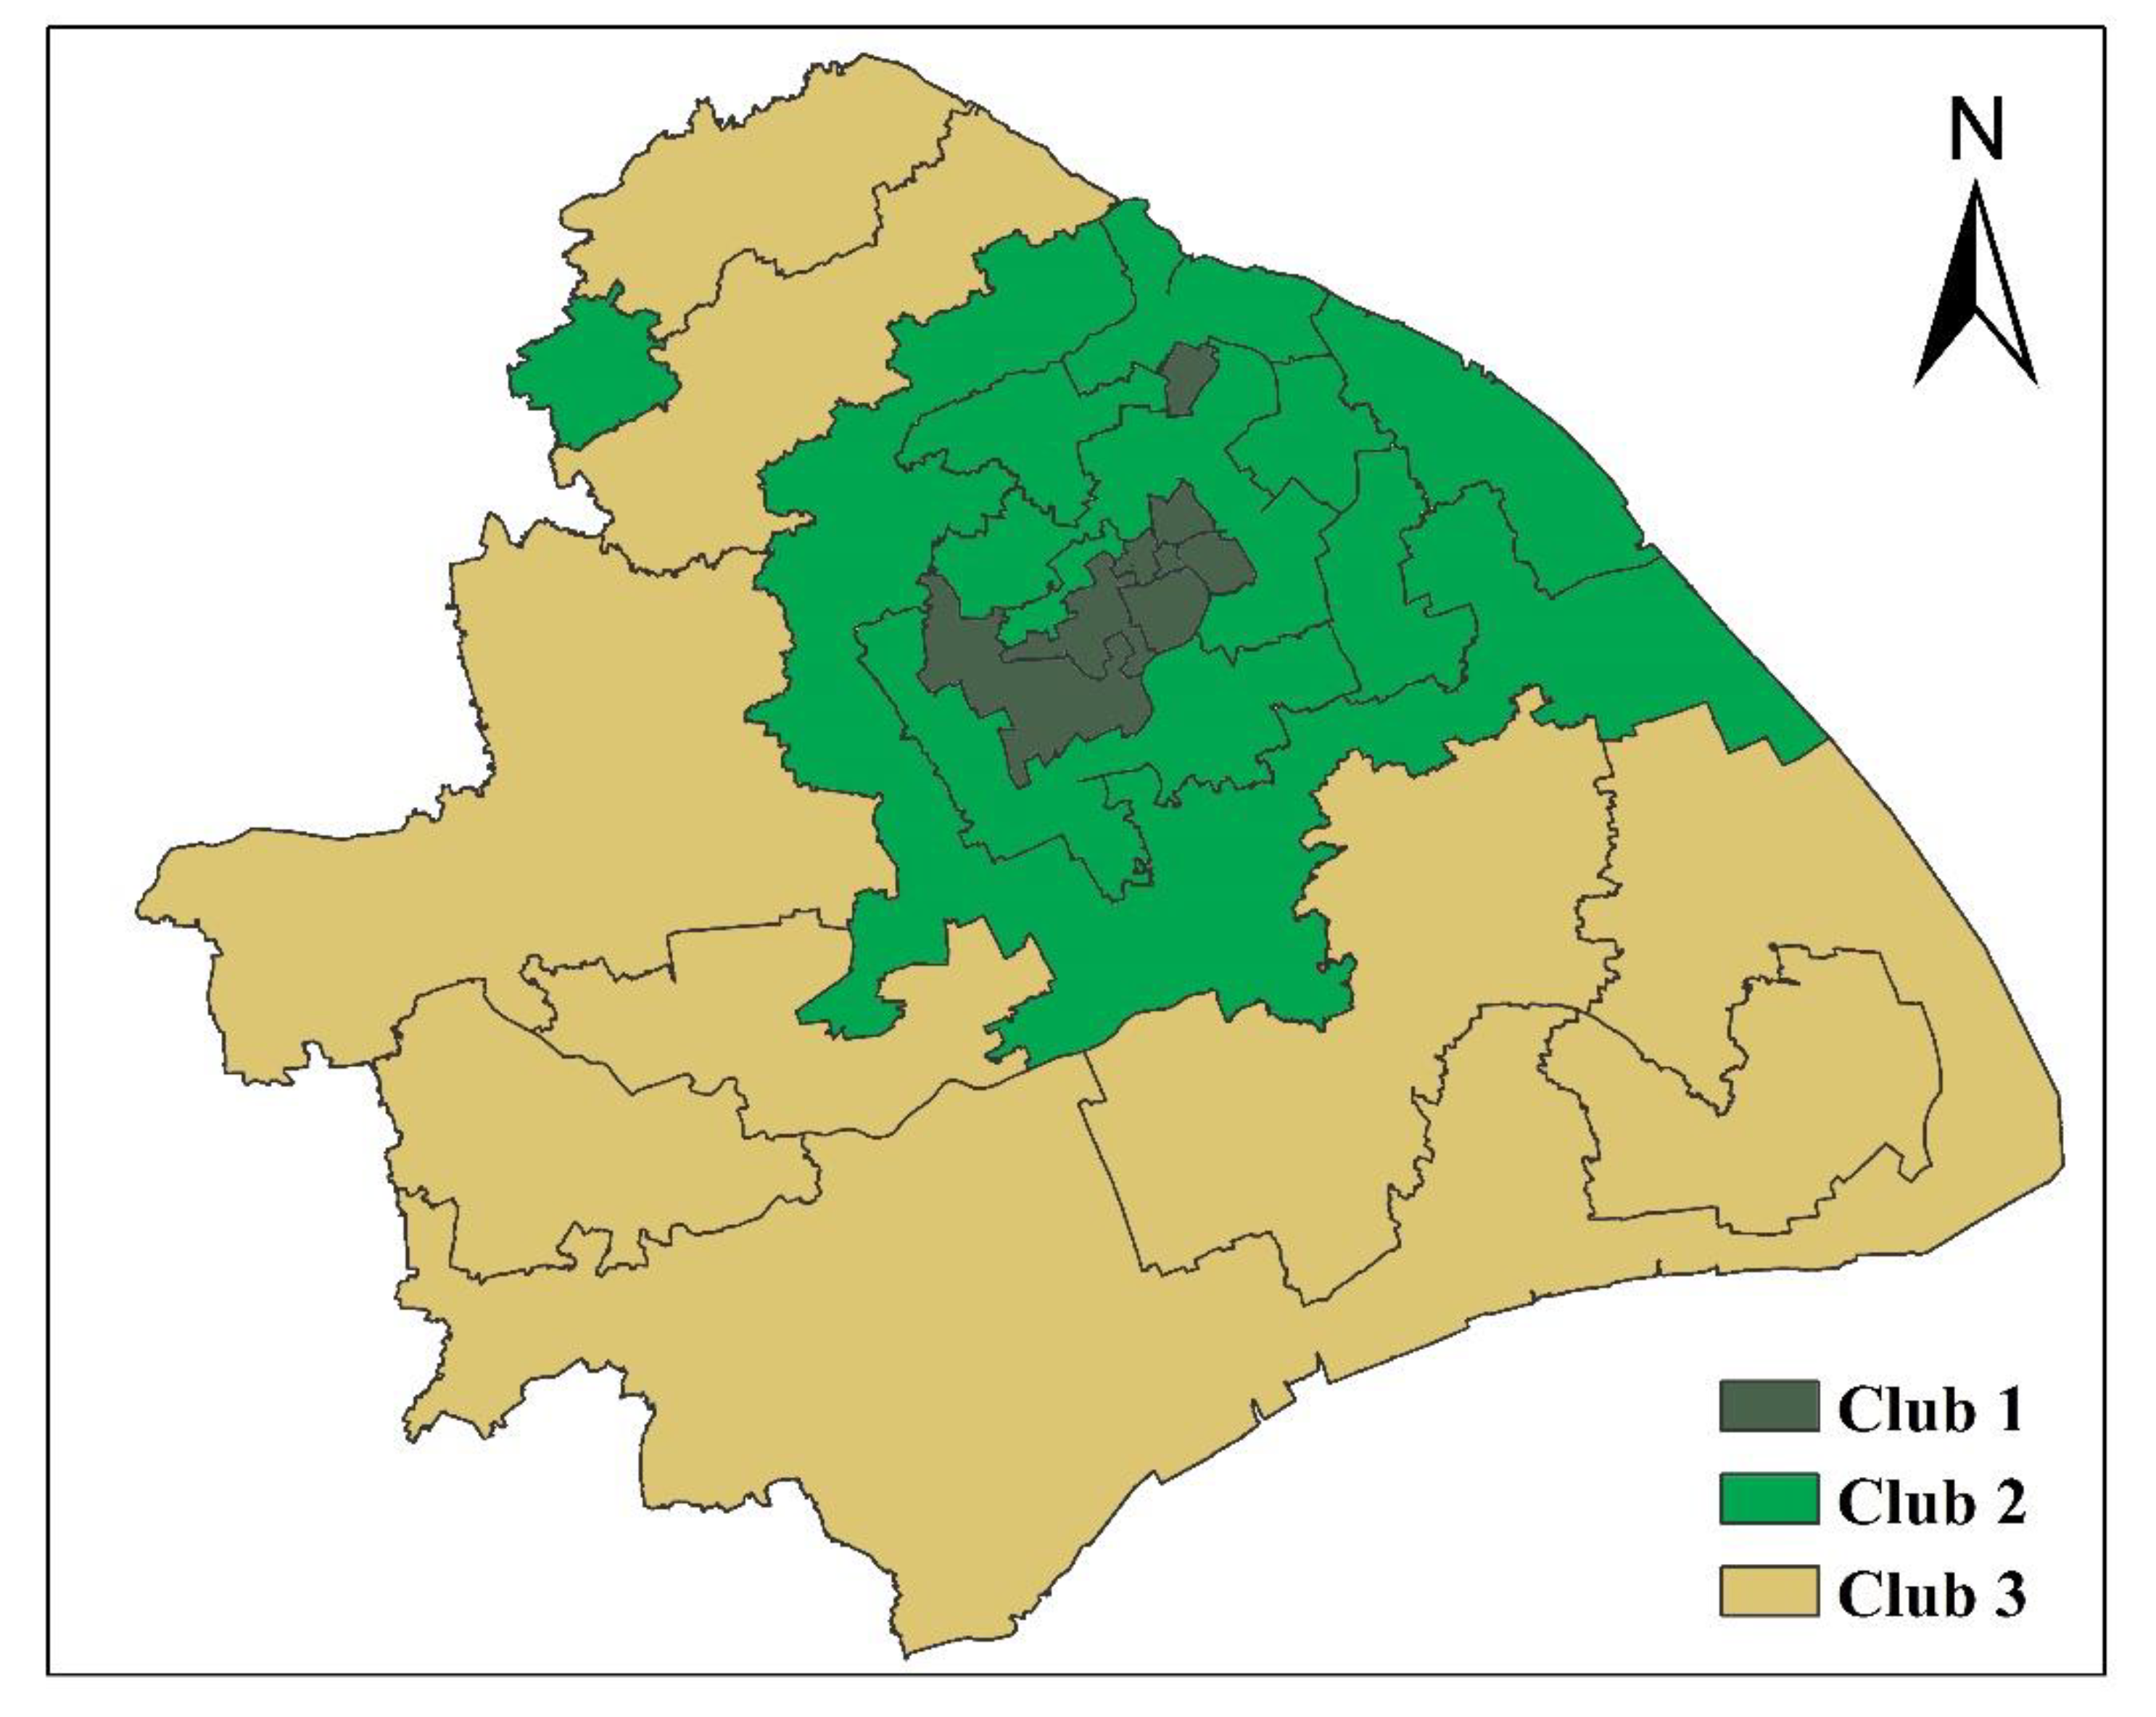
4.2. Convergence Club Formation among Different Submarkets in Shanghai

To analyze the convergence of housing prices, we begin by applying the log(t) test to the 25 submarkets in Shanghai. In this process, the housing prices are considered in logarithmic terms, and the Hodrick–Prescott filter is used to smooth out the cyclical effects [86], and the first 30% of the sample period is discarded, that is, the first 18 time observations for each housing price series. An ordinary least-squares estimation of the log(t) regression yields an estimated slope coefficient of −0.14 and a t-statistic of −13.2, indicating no convergence of housing prices across the whole city.
Next, we examine the possibility of convergence clubs, using a clustering and merging procedure based on the log(t) test. The merging algorithm further identifies whether any larger clubs from the initial classification should be merged, in case of the over determination of clubs’ number [83]. Table 1 presents the initial classification of convergence clubs and the statistical tests of potential club merging. The results of the clustering algorithm show that five convergence clubs can be identified in the initial classification. After merging produce, three convergence clubs finally are identified (see Figure 8), and are all conditional convergence based on the estimated coefficients of b (0 < b < 2).
The spatial pattern of convergence clubs in Shanghai exhibits, to some extent, a circular structure with continuity, which is consistent with existing studies [24,25]. Club 1 consists of seven submarkets that are mostly located in the urban areas of Shanghai with the highest average housing prices, in contrast to the other two clubs. Club 2 mainly covers the Pudong, Baoshan, Yangpu, Hongkou, Minhang, Qingpu, and Songjiang districts, which are further from the CBD than Club 1 and have medium housing prices. It is hard to explain why SM18, located in the northwest of the city, belongs to Club 2. It may be because there was a large amount of interregional migration between SM18 and the other submarkets in Club 2. Club 3 is located in the outermost part of the city, with the lowest housing prices.

5. Conclusions and Discussion

In this study, we disaggregated the Shanghai municipality into 25 submarkets and explored the price diffusion and convergence among these submarkets, using integrated quarterly house price transaction data from 2004 (Q1) to 2018 (Q4). This study provides a number of interesting empirical findings. First, although there were similar upward movement paths for all submarkets over time in Shanghai, the diffusion path of housing prices is diversified, affected by both geographical and economic proximities. Different from empirical evidence at the regional scale, the distribution of housing prices and the relative length of LISA time-paths show an obvious circular spatial structure, with high-priced areas located around the urban core. Second, we found a complex recursive process of price spillovers among different submarkets, rather than price diffusion from high-priced to low-priced submarkets, which partially explains the spiraling housing prices in Shanghai. Third, we did not find any convergence of housing prices in the market as a whole from 2004 (Q1) to 2018 (Q4), but some evidence of housing-submarket-level segmentation in Shanghai was detected. Specifically, three convergence clubs were identified, a result that is consistent with a large number of empirical studies at the regional scale, and is also consistent with the evidence observed in London [24,25]. Moreover, it is interesting to note that the spatial distribution of these three convergence clubs has a circular structure with continuity, similar to the spatial distribution of housing prices. Overall, this study broadens our knowledge of the price interrelationship of housing submarkets at the intra-urban level.
One of the contributions of this paper was to provide a more comprehensive understanding of the ripple effect at the intra-urban scale, by investigating both the short-run price diffusion process and the long-run convergence process [24,29]. In contrast to most previous studies, this paper investigates short-run price diffusion through exploratory space–time data analysis, including LISA time-path plots and a DAG, which not only offer novel scientific visualizations of the relationships between segmented housing markets, but also integrate the spatial effects of dependence and heterogeneity into empirical analysis [80]. Moreover, unlike earlier studies of long-run price convergence based on variations in panel unit root testing and cointegration estimations [33,52], this study has used the newly developed Phillips and Sul convergence test, which enables the detection of asymptotic co-movement between two time series, that would be erroneously missed by stationary time series methods [24,83]. In addition, this new method allows us to identify convergence clubs more conveniently and accurately. However, future studies should consider the relationship between the diffusion process and convergence club formation in more detail through sophisticated econometric techniques, as the long-run spatial distribution of housing prices could be caused by the short-run housing diffusion process.
Although the previous literature has advanced our understanding of the spatiotemporal interaction of housing prices among different cities [21,35,48,51,87,88], there has been less research on the spatial features of the ripple effect within a metropolitan area. This paper provides more detail on the long-term housing market dynamics in a metropolitan context than previous studies on China [88], thanks to the use of high-quality and long-term accumulated housing registration data from 2004 (Q1) to 2018 (Q4). It is difficult to directly compare the empirical results of this study with earlier literature on intra-urban housing price convergence in China, as there are very few studies, to our knowledge, that investigate the ripple effect at this scale. However, the results of this study agree with recent studies in Western cities such as London and Greater Sydney in terms of indicating the presence of multiple long-run convergence clubs rather than just a single club in a metropolitan area [24,25,27]. That is, there is no strong evidence confirming the convergence of the housing market at the intra-urban level, which may further imply that such convergence cannot be expected at the interurban level either [26]. Even so, short-run price diffusion frequently occurs between different submarkets, affected by both geographical and economic proximities, which is similar to what has been observed at the regional scale [50]. In addition to the lead–lag relationship that diffuses from high-priced to low-priced submarkets, we also found the existence of a complex recursive process of price spillovers among different submarkets [51], which is, to some extent, neglected in previous studies focusing on London and Greater Sydney.
There is an urgent need to establish a clearly conceived and cogent theoretical framework to explain the price relationship and diffusion process among different submarkets with different socioeconomic and spatial–physical attributes in a metropolitan area. The proposed reasons for price spillover at the intra-urban scale from Western case studies include migration, spatial arbitrage, quality of life, and spatial differences in housing price determinants [70]. Nevertheless, price diffusion and the formation of convergence clubs in Chinese cities may differ from that in Western cities. In a Chinese context, housing values are heavily influenced by the amenity effects of urban facilities, such as high-quality schools and metro stations, because of the lack of urban facilities and competition for public goods through housing choices and purchases [89]. Shanghai’s residential market still has a monocentric structure, because of the centralized distribution of public transport facilities and amenities [71], and similarly, the distribution of convergence clubs has a core-peripheral structure. Thus, further studies considering more comprehensive variables in the regression model should be undertaken.
The findings of this study have some profound implications. First, given that the spillover of housing prices is usually caused by high-priced submarkets, such as the CBD in Shanghai, enforcing policies to control housing price increases, in combination with controlling residential land leasing prices in these dominant regions, is likely to be more effective than adopting a “one size fits all” approach. Second, given that a lack of high-quality urban facilities in peripheral regions is an important reason for the divergence within the housing market, governments should seek a more balanced distribution of high-quality urban facilities and public services in urban planning, to make housing more affordable. Finally, for local residents and housing investors, purchasing housing properties in low-price submarkets that belong to the same convergence clubs as high-price submarkets is a sensible investment choice.

Author Contributions

Conceptualization, J.H. and F.Y.; methodology, X.X. and Y.C.; software, X.X.; formal analysis, J.H.; resources, J.H.; data curation, J.H. and X.X.; writing—original draft preparation, J.H.; writing—review and editing, F.Y. and Y.C.; visualization, X.X.; supervision, F.Y.; project administration, F.Y.; funding acquisition, J.H. and F.Y. All authors have read and agreed to the published version of the manuscript.

Funding

This research was funded by National Natural Science Foundation of China [grant number 71950004 and 41671133].

Acknowledgments

We would like to thank the referees for their constructive comments, and Yao Chen and Yan Zhao for their research assistance and Liwen Bianji, Edanz Editing China (www.liwenbianji.cn/ac), for editing the English text of a draft of this manuscript.

Conflicts of Interest

The authors declare no conflict of interest.

References

  1. United Nations (UN). Sustainable Development Goals Report; UN: New York, NY, USA, 2017. [Google Scholar]
  2. De Bruyne, K.; Van Hove, J. Explaining the spatial variation in housing prices: An economic geography approach. Appl. Econ. 2013, 45, 1673–1689. [Google Scholar] [CrossRef]
  3. Fan, G.-Z.; Ong, S.E.; Koh, H.C. Determinants of house price: A decision tree approach. Urban Stud. 2006, 43, 2301–2315. [Google Scholar] [CrossRef]
  4. Sheppard, S. Chapter 41 Hedonic analysis of housing markets. In Handbook of Regional and Urban Economics; Elsevier: Amsterdam, The Netherlands, 1999; Volume 3, pp. 1595–1635. [Google Scholar]
  5. Glaeser, E.L.; Gyourko, J.; Saks, R.E. Why have housing prices gone up? Am. Econ. Rev. 2005, 95, 329–333. [Google Scholar] [CrossRef] [Green Version]
  6. Mankiw, N.G.; Weil, D.N. The baby boom, the baby bust, and the housing market. Reg. Sci. Urban Econ. 1989, 19, 235–258. [Google Scholar] [CrossRef] [Green Version]
  7. Plantinga, A.J.; Détang-Dessendre, C.; Hunt, G.L.; Piguet, V. Housing prices and inter-urban migration. Reg. Sci. Urban Econ. 2013, 43, 296–306. [Google Scholar] [CrossRef] [Green Version]
  8. Abelson, P. House and land prices in Sydney from 1931 to 1989. Urban Stud. 1997, 34, 1381–1400. [Google Scholar] [CrossRef]
  9. Banzhaf, H.S.; Farooque, O. Interjurisdictional housing prices and spatial amenities: Which measures of housing prices reflect local public goods? Reg. Sci. Urban Econ. 2013, 43, 635–648. [Google Scholar] [CrossRef] [Green Version]
  10. Schläpfer, F.; Waltert, F.; Segura, L.; Kienast, F. Valuation of landscape amenities: A hedonic pricing analysis of housing rents in urban, suburban and periurban Switzerland. Landsc. Urban Plan. 2015, 141, 24–40. [Google Scholar] [CrossRef]
  11. Alonso, W. Location and Land Use; Harvard University Press: Cambridge, MA, USA, 1964. [Google Scholar]
  12. Helbich, M.; Brunauer, W.; Vaz, E.; Nijkamp, P. Spatial heterogeneity in hedonic house price models: The case of Austria. Urban Stud. 2013, 41, 390–411. [Google Scholar] [CrossRef] [Green Version]
  13. Hui, E.C.; Zhong, J.; Yu, K. Heterogeneity in spatial correlation and influential factors on property prices of submarkets categorized by urban dwelling spaces. J. Urban Plan. Dev. 2014, 142, 04014047. [Google Scholar] [CrossRef]
  14. Liu, X. Spatial and temporal dependence in house price prediction. J. Real Estate Financ. Econ. 2013, 47, 341–369. [Google Scholar] [CrossRef]
  15. Yuan, F.; Wu, J.; Wei, Y.D.; Wang, L. Policy change, amenity, and spatiotemporal dynamics of housing prices in Nanjing, China. Land Use Policy 2018, 75, 225–236. [Google Scholar] [CrossRef]
  16. Piketty, T.; Zucman, G. Capital is back: Wealth-income ratios in rich countries 1700–2010. Q. J. Econ. 2014, 129, 1255–1310. [Google Scholar] [CrossRef] [Green Version]
  17. Yang, Z.; Chen, J. Housing Affordability and Housing Policy in Urban China; Springer Science & Business Media: Berlin/Heidelberg, Germany, 2014. [Google Scholar]
  18. Goodman, A.C.; Thibodeau, T.G. Housing market segmentation. J. Hous. Econ. 1998, 7, 121–143. [Google Scholar] [CrossRef]
  19. Keskin, B.; Watkins, C. Defining spatial housing submarkets: Exploring the case for expert delineated boundaries. Urban Stud. 2017, 54, 1446–1462. [Google Scholar] [CrossRef] [Green Version]
  20. Watkins, C.A. The definition and identification of housing submarkets. Environ. Plan. A 2001, 33, 2235–2253. [Google Scholar] [CrossRef]
  21. Meen, G. Regional house prices and the ripple effect: A new Interpretation. Hous. Stud. 1999, 14, 733–753. [Google Scholar] [CrossRef]
  22. Chiang, S. Housing markets in China and policy implications: Comovement or ripple effect. China World Econ. 2014, 22, 103–120. [Google Scholar] [CrossRef]
  23. Zhang, L.; Hui, E.C.; Wen, H. The regional house prices in China: Ripple effect or differentiation. Habitat Int. 2017, 67, 118–128. [Google Scholar] [CrossRef]
  24. Holmes, M.J.; Otero, J.; Panagiotidis, T. Property heterogeneity and convergence club formation among local house prices. J. Hous. Econ. 2019, 43, 1–13. [Google Scholar] [CrossRef]
  25. Abbott, A.; De Vita, G. Pairwise convergence of district-level house prices in London. Urban Stud. 2012, 49, 721–740. [Google Scholar] [CrossRef]
  26. Holmes, M.J.; Otero, J.; Panagiotidis, T. A pair-wise analysis of intra-city price convergence within the Paris housing market. J. Real Estate Financ. Econ. 2017, 54, 1–16. [Google Scholar] [CrossRef] [Green Version]
  27. Bangura, M.; Lee, C.L. House price diffusion of housing submarkets in Greater Sydney. Hous. Stud. 2019. [Google Scholar] [CrossRef]
  28. Brzezicka, J.; Łaszek, J.; Olszewski, K.; Waszczuk, J. Analysis of the filtering process and the ripple effect on the primary and secondary housing market in Warsaw, Poland. Land Use Policy 2019, 88, 104098. [Google Scholar] [CrossRef]
  29. Jin, C.; Lee, G. Exploring spatiotemporal dynamics in a housing market using the spatial vector autoregressive Lasso: A case study of Seoul, Korea. Trans. GIS 2019, 24, 27–43. [Google Scholar] [CrossRef]
  30. Bhattacharjee, A.; Castro, E.; Maiti, T.; Marques, J. Endogenous spatial regression and delineation of submarkets: A new framework with application to housing markets. J. Appl. Econom. 2016, 31, 32–57. [Google Scholar] [CrossRef]
  31. Gupta, R.; Miller, S.M. “Ripple effects” and forecasting home prices in Los Angeles, Las Vegas, and Phoenix. Ann. Reg. Sci. 2012, 48, 763–782. [Google Scholar] [CrossRef] [Green Version]
  32. Cook, S.; Watson, D. A new perspective on the ripple effect in the UK housing market: Comovement, cyclical subsamples and alternative indices. Urban Stud. 2016, 53, 3048–3062. [Google Scholar] [CrossRef] [Green Version]
  33. MacDonald, R.; Taylor, M.P. Regional house prices in Britain: Long-run relationships and short-run dynamics. Scott. J. Polit. Econ. 1993, 40, 43–55. [Google Scholar] [CrossRef]
  34. Ho, L.S.; Ma, Y.; Haurin, D.R. Domino effects within a housing market: The transmission of house price changes across quality tiers. J. Real Estate Financ. Econ. 2008, 37, 299–316. [Google Scholar] [CrossRef]
  35. Shi, S.; Young, M.; Hargreaves, B. The ripple effect of local house price movements in New Zealand. J. Prop. Res. 2009, 26, 1–24. [Google Scholar] [CrossRef]
  36. Gupta, R.; Andre, C.; Gil-Alana, L. Comovement in Euro area housing prices: A fractional cointegration approach. Urban Stud. 2015, 52, 3123–3143. [Google Scholar] [CrossRef] [Green Version]
  37. Leung, C.K.Y.; Cheung, P.W.Y.; Tang, E.C.H. Financial crisis and the comovements of housing sub-markets: Do relationships change after a crisis? Int. Real Estate Rev. Asian Real Estate Soc. 2013, 16, 68–118. [Google Scholar]
  38. Meen, G. Spatial Housing Economics: A Survey; Sage Publications Sage UK: London, UK, 2016. [Google Scholar]
  39. Chiang, M.-C.; Tsai, I.-C. Ripple effect and contagious effect in the US regional housing markets. Ann. Reg. Sci. 2016, 56, 55–82. [Google Scholar] [CrossRef]
  40. Holly, S.; Pesaran, M.H.; Yamagata, T. The spatial and temporal diffusion of house prices in the UK. J. Urban Econ. 2011, 69, 2–23. [Google Scholar] [CrossRef] [Green Version]
  41. Geng, B.; Bao, H.; Liang, Y. A study of the effect of a high-speed rail station on spatial variations in housing price based on the hedonic model. Habitat Int. 2015, 49, 333–339. [Google Scholar] [CrossRef]
  42. Gong, Y.; Boelhouwer, P.; De Haan, J. Interurban house price gradient: Effect of urban hierarchy distance on house prices. Urban Stud. 2015, 53, 3317–3335. [Google Scholar] [CrossRef]
  43. Saphores, J.-D.; Aguilar-Benitez, I. Smelly local polluters and residential property values: A hedonic analysis of four Orange County (California) cities. Estud. Econ. 2005, 20, 197–218. [Google Scholar]
  44. Drake, L. Testing for convergence between UK regional house prices. Reg. Stud. 1995, 29, 357–366. [Google Scholar] [CrossRef]
  45. Holmes, M.J. How convergent are regional house prices in the United Kingdom? Some new evidence from panel data unit root testing. J. Econ. Soc. Res. 2007, 9, 1–7. [Google Scholar]
  46. Stevenson, S. House price diffusion and inter-regional and cross-border house price dynamics. J. Prop. Res. 2004, 21, 301–320. [Google Scholar] [CrossRef]
  47. Clapp, J.M.; Dolde, W.; Tirtiroglu, D. Imperfect information and investor inferences from housing price dynamics. Real Estate Econ. 1995, 23, 239–269. [Google Scholar] [CrossRef]
  48. Oikarinen, E. The diffusion of housing price movements from center to surrounding areas. J. Hous. Res. 2004, 15, 3–28. [Google Scholar] [CrossRef]
  49. Pollakowski, H.O.; Ray, T.S. Housing price diffusion patterns at different aggregation levels: An examination of housing market efficiency. J. Hous. Res. 1997, 8, 107–124. [Google Scholar]
  50. Zhu, B.; Füss, R.; Rottke, N.B. Spatial linkages in returns and volatilities among US regional housing markets. Real Estate Econ. 2013, 41, 29–64. [Google Scholar] [CrossRef]
  51. Hudson, C.; Hudson, J.; Morley, B. Differing house price linkages across UK regions: A multi-dimensional recursive ripple model. Urban Stud. 2018, 55, 1636–1654. [Google Scholar] [CrossRef]
  52. Holmes, M.J.; Grimes, A. Is there long-run convergence among regional house prices in the UK? Urban Stud. 2008, 45, 1531–1544. [Google Scholar] [CrossRef] [Green Version]
  53. Balcilar, M.; Beyene, A.; Gupta, R.; Seleteng, M. ‘Ripple’ effects in South African house prices. Urban Stud. 2013, 50, 876–894. [Google Scholar] [CrossRef] [Green Version]
  54. André, C.; Gupta, R.; Mwamba, J.W.M. Are housing price cycles asymmetric? Evidence from the US States and Metropolitan areas. Int. J. Strateg. Prop. Manag. 2019, 23, 1–22. [Google Scholar] [CrossRef] [Green Version]
  55. Cook, S.; Thomas, C. An alternative approach to examining the ripple effect in UK house prices. Appl. Econ. Lett. 2003, 10, 849–851. [Google Scholar] [CrossRef]
  56. Apergis, N.; Payne, J.E. Convergence in U.S. house prices by state: Evidence from the club convergence and clustering procedure. Lett. Spat. Resour. Sci. 2012, 5, 103–111. [Google Scholar] [CrossRef]
  57. Kim, Y.S.; Rous, J.J. House price convergence: Evidence from US state and metropolitan area panels. J. Hous. Econ. 2012, 21, 169–186. [Google Scholar] [CrossRef]
  58. Montagnoli, A.; Nagayasu, J. UK house price convergence clubs and spillovers. J. Hous. Econ. 2015, 30, 50–58. [Google Scholar] [CrossRef] [Green Version]
  59. Blanco, F.; Martín, V.; Vazquez, G. Regional house price convergence in Spain during the housing boom. Urban Stud. 2016, 53, 775–798. [Google Scholar] [CrossRef]
  60. Tomal, M. House price convergence on the primary and secondary markets: Evidence from Polish provincial capitals. Real Estate Manag. Valuat. 2019, 27, 62–73. [Google Scholar] [CrossRef] [Green Version]
  61. Apergis, N.; Simo-Kengne, B.D.; Gupta, R. Convergence in provincial-level South African house prices: Evidence from the club convergence and clustering procedure. Rev. Urban Reg. Dev. Stud. 2015, 27, 2–17. [Google Scholar] [CrossRef] [Green Version]
  62. Meng, H.; Xie, W.-J.; Zhou, W.-X. Club convergence of house prices: Evidence from China’s ten key cities. Int. J. Mod. Phys. 2015, 29, 1550181. [Google Scholar] [CrossRef] [Green Version]
  63. Lin, R.; Zhang, X.; Li, X.; Dong, J. Heterogeneous convergence of regional house prices and the complexity in China. Zb. Rad. Ekon. Fak. Rijeci Čas. Ekon. Teor. Praksu 2015, 33, 325–348. [Google Scholar] [CrossRef]
  64. Awaworyi Churchill, S.; Inekwe, J.; Ivanovski, K. House price convergence: Evidence from Australian cities. Econ. Lett. 2018, 170, 88–90. [Google Scholar] [CrossRef]
  65. Montañés, A.; Olmos, L. Convergence in US house prices. Econ. Lett. 2013, 121, 152–155. [Google Scholar] [CrossRef] [Green Version]
  66. Zhang, D.; Liu, Z.; Fan, G.-Z.; Horsewood, N. Price bubbles and policy interventions in the Chinese housing market. J. Hous. Built Environ. 2016, 32, 133–155. [Google Scholar] [CrossRef]
  67. Wu, W. City profile: Shanghai. Cities 1999, 16, 207–216. [Google Scholar] [CrossRef]
  68. Wu, Y.L.; Lu, C.L.; Chen, M.C.; Chu, F.N. What forces drive the dynamic interaction between regional housing prices? Int. J. Strateg. Prop. Manag. 2017, 21, 225–239. [Google Scholar] [CrossRef]
  69. Cook, S. The convergence of regional house prices in the UK. Urban Stud. 2003, 40, 2285–2294. [Google Scholar] [CrossRef]
  70. Holmes, M.J.; Otero, J.; Panagiotidis, T. Climbing the property ladder: An analysis of market integration in London property prices. Urban Stud. 2018, 55, 2660–2681. [Google Scholar] [CrossRef] [Green Version]
  71. Li, H.; Wei, Y.D.; Wu, Y.; Tian, G. Analyzing housing prices in Shanghai with open data: Amenity, accessibility and urban structure. Cities 2019, 91, 165–179. [Google Scholar] [CrossRef]
  72. Zhou, Z. Overreaction to policy changes in the housing market: Evidence from Shanghai. Reg. Sci. Urban Econ. 2016, 58, 26–41. [Google Scholar] [CrossRef]
  73. Roh, H.; Wu, C. Empirical analysis of Chinese and South Korean housing policies and their effects on housing prices change: Taking Shanghai and Seoul as example. In Proceedings of the 2015 International Conference on Sustainable Development, New York, NY, USA, 23–24 September 2015. [Google Scholar]
  74. Chen, W.; Yenneti, K.; Wei, Y.D.; Yuan, F.; Wu, J.; Gao, J. Polycentricity in the Yangtze River Delta Urban Agglomeration (YRDUA): More cohesion or more disparities? Sustainability 2019, 11, 3106. [Google Scholar] [CrossRef] [Green Version]
  75. Wu, J.; Wei, Y.D.; Li, Q.; Yuan, F. Economic transition and changing location of manufacturing industry in China: A study of the Yangtze River Delta. Sustainability 2018, 10, 2624. [Google Scholar] [CrossRef] [Green Version]
  76. Yang, Z.; Chen, J. Housing reform and the housing market in urban China. In Housing Affordability and Housing Policy in Urban China; Springer: Berlin/Heidelberg, Germany, 2014; pp. 15–43. [Google Scholar]
  77. Shih, Y.-N.; Li, H.-C.; Qin, B. Housing price bubbles and inter-provincial spillover: Evidence from China. Habitat Int. 2014, 43, 142–151. [Google Scholar] [CrossRef]
  78. Yuan, F.; Wei, Y.D.; Xiao, W. Land marketization, fiscal decentralization, and the dynamics of urban land prices in transitional China. Land Use Policy 2019, 89, 104208. [Google Scholar] [CrossRef]
  79. Wu, C.; Sharma, R. Housing submarket classification: The role of spatial contiguity. Appl. Geogr. 2012, 32, 746–756. [Google Scholar] [CrossRef]
  80. Ye, X.; Rey, S. A framework for exploratory space-time analysis of economic data. Ann. Reg. Sci. 2013, 50, 315–339. [Google Scholar] [CrossRef]
  81. Yang, J.; Liu, H.; Leatham, D.J. The multi-market analysis of a housing price transmission model. Appl. Econ. 2013, 45, 3810–3819. [Google Scholar] [CrossRef]
  82. Phillips, P.C.; Sul, D. Transition modeling and econometric convergence tests. Econometrica 2007, 75, 1771–1855. [Google Scholar] [CrossRef] [Green Version]
  83. Phillips, P.C.; Sul, D. Economic transition and growth. J. Appl. Econom. 2009, 24, 1153–1185. [Google Scholar] [CrossRef] [Green Version]
  84. Du, K. Econometric convergence test and club clustering using Stata. Stata J. 2017, 17, 882–900. [Google Scholar] [CrossRef]
  85. Chen, J.; Gao, J.; Yuan, F.; Wei, Y.D. Spatial Determinants of Urban Land Expansion in Globalizing Nanjing, China. Sustainability 2016, 8, 868. [Google Scholar] [CrossRef] [Green Version]
  86. Hodrick, R.J.; Prescott, E.C. Postwar US business cycles: An empirical investigation. J. Money Credit Bank. 1997, 29, 1–16. [Google Scholar] [CrossRef]
  87. Lean, H.H.; Smyth, R. Regional house prices and the ripple effect in Malaysia. Urban Stud. 2013, 50, 895–922. [Google Scholar] [CrossRef]
  88. Lee, C.-C.; Chien, M.-S. Empirical modelling of regional house prices and the ripple effect. Urban Stud. 2011, 48, 2029–2047. [Google Scholar] [CrossRef]
  89. Yuan, F.; Wei, Y.D.; Wu, J. Amenity effects of urban facilities on housing prices in China: Accessibility, scarcity, and urban spaces. Cities 2020, 96, 102433. [Google Scholar] [CrossRef]
Figure 1. Location of study area.
Sustainability 12 05073 g001
Figure 2. Housing submarkets in Shanghai.
Sustainability 12 05073 g002
Figure 3. Changes in housing prices across submarkets in Shanghai, 2006–2018.
Sustainability 12 05073 g003
Figure 4. CV and Gini coefficients of housing prices at submarket level in Shanghai, 2004–2018.
Sustainability 12 05073 g004
Figure 5. LISA time-paths of submarkets in Shanghai, 2004–2018.
Sustainability 12 05073 g005
Figure 6. Relative lengths of LISA time-paths across the submarkets in Shanghai, 2004–2018.
Sustainability 12 05073 g006
Figure 7. Interrelationship between submarkets in Shanghai, 2004–2018.
Sustainability 12 05073 g007
Figure 8. Distribution of convergence clubs in Shanghai.
Sustainability 12 05073 g008
Table 1. Classification of convergence clubs in Shanghai.
Initial ClassificationTests of Club MergingFinal Classification
Clubβ coeff.t-stat.Clubβ coeff.t-stat.Clubβ coeff.t-stat.
10.5088.6031 + 20.27519.02110.27519.021
20.0803.6832 + 3−0.014−2.59420.0911.649
30.0100.1983 + 40.0911.64930.2243.464
40.0080.0584 + 50.0641.825
50.0260.717

