Influence of Increasing Electrification of Passenger Vehicle Fleet on Carbon Dioxide Emissions in Finland


1
Department of Agricultural Sciences, University of Helsinki, Koetilantie 5, 00790 Helsinki, Finland
2
Department of Mechanical Engineering, School of Engineering, Aalto University, Otakaari 4, 02150 Espoo, Finland
*
Author to whom correspondence should be addressed.
Sustainability 2020, 12(12), 5032; https://doi.org/10.3390/su12125032
Submission received: 30 April 2020
/
Revised: 3 June 2020
/
Accepted: 13 June 2020
/
Published: 19 June 2020
(This article belongs to the Special Issue 2020 Perspectives on Electric Mobility Research, What’s Next?)
Abstract
:Different estimations have been presented for the amount of electric vehicles in the future. These estimations rarely take into account any realistic dynamics of the vehicle fleet. The objective of this paper is to analyze recently presented future scenarios about the passenger vehicle fleet estimations and create a foundation for the development of a fleet estimation model for passenger cars dedicated to the Finnish vehicle market conditions. The specific conditions of the Finnish light-duty vehicle fleet are taken into account as boundary conditions for the model development. The fleet model can be used for the estimation of emissions-optimal future vehicle fleets and the evaluation of the carbon dioxide emissions of transportation. The emission analysis was done for four different scenarios of the passenger vehicle fleet development in Finland. The results show that the high average age of the fleet and high number of older gasoline vehicles will slow down the reduction of carbon dioxide emissions during the next five to ten years even with a high adoption rate of electric vehicles. It can be concluded that lowering the average age, increasing biofuel mixing ratios, and increasing the amount of rechargeable electric vehicles are the most effective measures to reduce carbon dioxide emissions of the Finnish passenger vehicle fleet in the future.
1. Introduction
The potential of reducing greenhouse gas emissions by electrified vehicles has been widely studied in the literature. However, many studies often compare different vehicle technologies without taking into account the vehicle fleet and stock flow influence [1,2,3]. The impacts of wide-scale electric drive vehicle deployment on the well-to-wheel (WTT) emissions and cost implications of the European Union passenger car fleet were thoroughly studied by Thiel et al. [4]. Well-to-wheel emissions take into account energy production and delivery emissions while tank-to-wheel (TTW) emissions only consider the emissions of driving. Without significant car segment shifts towards smaller vehicles, the research results showed a minimum share of 11% of electric drive vehicles would be required for reaching a tank-to-wheel CO2 target of 70 g/km. The downside of the study is that the emission parameters were EU average values when e.g. CO2 emissions from the electricity production may have significant influence if taking into account the emission factors of each country. In addition, the impact of the new CO2 targets on vehicles sold in the EU area is still hard to predict. Especially the share of compressed natural gas (CNG) vehicles may not be as high as the predictions indicate because even if biogas could be used in these vehicles, the emission factor for the vehicle manufacturer is based on natural gas.
The uncertainties in the emission reduction potential of electric vehicles has been recognized in the literature [5,6] and they should always be carefully taken into account. Due to the differences in the electricity production by countries [7], the assessment of electric vehicles is better to carry out by focusing on an individual market area when the uncertainties can be better controlled [1,3]. Not only the local electricity production but also the electricity trade between the countries should be taken into account [8]. There are major differences between countries in the dynamics of the vehicle stock flow and distribution of the vehicle types in the stock. The latter was taken into account in the study by Kim and Heo (2019) when they analyzed the factors for the adoption of electric vehicles [9]. The research results indicated that the driving range is one of the major factors for the market growth of BEVs (Battery Electric Vehicle), and the countries that prefer larger cars are probably unlikely to replace conventional vehicles by BEVs due to the lack of larger electric vehicle models and limited driving range. When purchasing an electric vehicle, it is important to recognize that the potential customers have different priorities in relation to the inherent characteristics of electric vehicles [10]. The local climate conditions also have an important influence on the use patterns and energy consumption of electrified vehicles [11]. Moreover, different assessment methods may lead to quite different results in the CO2 reduction potential of electric vehicles [2]. This refers to the chosen use pattern of electric vehicles and especially their charging strategies. Another approach to evaluate vehicle fleet CO2 emissions is to carry out simulations at individual vehicle level and take into account the fleet composition data [12].
A major barrier for the large-scale adoption of electrified vehicles has been their higher purchase costs in comparison to conventional gasoline and diesel vehicles [13]. Recent studies show that the total cost of ownership (TCO) for battery electric vehicles is higher than that of conventional vehicles, but the TCO difference diminishes with the driving distance [14]. Many countries have been providing economic incentives for the purchase of electrified vehicles regardless of the CO2 intensity in their national electric power. Economic incentives naturally have a positive influence on the vehicle sales [9,15]. However, the influence can be disruptive if the incentives are not designed with a proper longevity.
Vehicle fleet model is a practical way of estimating changes in the vehicle stock flow over time. Several types of fleet models have been developed for vehicles depending on the research aspect such as energy consumption, emissions or market development. Some existing comprehensive transportation models usually include vehicle fleet model as an integrated module. Despite the past developments, the integrated fleet models may not be easy to use and may not correspond to a specific market area. Trost et al. developed a vehicle fleet model for estimating the long-term developments in terms of fleet structure, carbon dioxide emissions, and energy demand in Germany [16]. Their approach is based on individual vehicle purchase decisions influenced by the total cost of ownership (TCO). A special emphasis was given for electric vehicles and power-to-gas technology. Their simulated results showed a significant shift to alternative powertrain technologies and significant reduction of CO2 emissions by 2050. Although, the research assumed that electricity production was based on renewable energy sources without direct CO2 emissions. Another bottom-up approach is agent-based modeling, which is often highly complex and may involve many agent attributes but have been successfully used for evaluating the future market shares of electric vehicles [17]. The sector specific CO2 reduction targets were evaluated with an integrated multi-sectoral model that combined the European electricity production and road transport [18]. The model enabled estimating the required share of electrified vehicles and increased electric energy demand in the future.
The focus of this research is to collect necessary statistical data and understand the dynamic behaviors of the Finnish vehicle fleet for the development of a vehicle stock-flow model for the estimations of CO2 emissions with different adoption rates of electric vehicles. This way we were able to analyze the impacts of the presented estimations about the increasing electrification, which was one of the main interests for this research. We chose four different future scenarios having low, medium, high, and extensive amount of electric vehicles in the passenger vehicle fleet. All these scenarios correspond to specific estimations done by different interest groups in Finland.
Since the increase in the size of the electric vehicle fleet reduces emissions and reduces the amount of gasoline and diesel-powered vehicles, comparing these different predictions will give light to new insights regarding the uncertainty in the rate of increase in the number of electric vehicles. This uncertainty has not been studied before and the novelty of the work is also that the analysis is limited to a chosen geographical location, Finland. This limitation is important because it encapsulates a single area of governmental jurisdiction and supports in their decision-making regarding financial incentives for electric vehicle purchases and operation incentives for public charging infrastructure. Each of the future scenarios presented here alone does not provide an estimation on the growth variation of the electric vehicle fleet. Our research is necessary in order to meet the needs of electric vehicle users in the future, without over- or underestimating investments.
2. Materials and Methods
2.1. Background Information
The transport characteristics of the Nordic countries in Europe differ from those of the central and southern European countries. The distinct differences are lower population, large surface area in relation to the population, and cold climate conditions during winter season. In Finland, the present light-duty vehicle stock is considerably older than in the neighboring countries mostly due to historical and current vehicle and transport taxation policies [19]. Therefore, a dedicated vehicle fleet model is required for accurate and comprehensive analysis of the vehicle stock flow and its influence on emissions. The historical statistics of the Finnish vehicle fleet development are used as the starting point for the model development.
Figure 1 presents the development of the Finnish passenger vehicle fleet from 1980 until 2019. The amount of vehicles has been steadily increasing corresponding to an average yearly increase of 3% for the shown 40-year period and about 1% for the last ten years. The carbon dioxide emissions increased rapidly in the 1980s and have been slowly decreasing for the last ten years. A challenge of decarbonizing the Finnish passenger vehicle fleet is the high average age, which has been increasing at a pace of almost 2% per year during the last ten years.
Figure 2a shows the distribution of the vehicle technologies for the Finnish passenger vehicle fleet. By the end of the year 2019, 98% of the vehicles in use were either gasoline or diesel vehicles including charge-sustaining hybrid vehicles. The remaining 2% can be considered as alternative fuel vehicles (AFV) among which the gasoline plug-in hybrids are the most common types. Electric vehicles represent only a small fraction of the AFVs (Figure 2a). The distributions of vehicle technologies of the newly registered and individually imported vehicles is presented in Figure 2b. The total AFVs share of new vehicles is around 11% but it is rapidly increasing. The vehicle types used in the analysis included:
- gasoline vehicle (GAS),
- flexible-fuel vehicle (FFV),
- diesel vehicle (DI),
- compressed natural gas vehicle (CNG),
- gasoline plug-in hybrid electric vehicle (PHEVg),
- diesel PHEV (PHEVd),
- battery electric vehicle (BEV), and
- fuel cell hybrid electric vehicle (FCHEV).
2.2. Vehicle Technologies and Fleet Scenarios
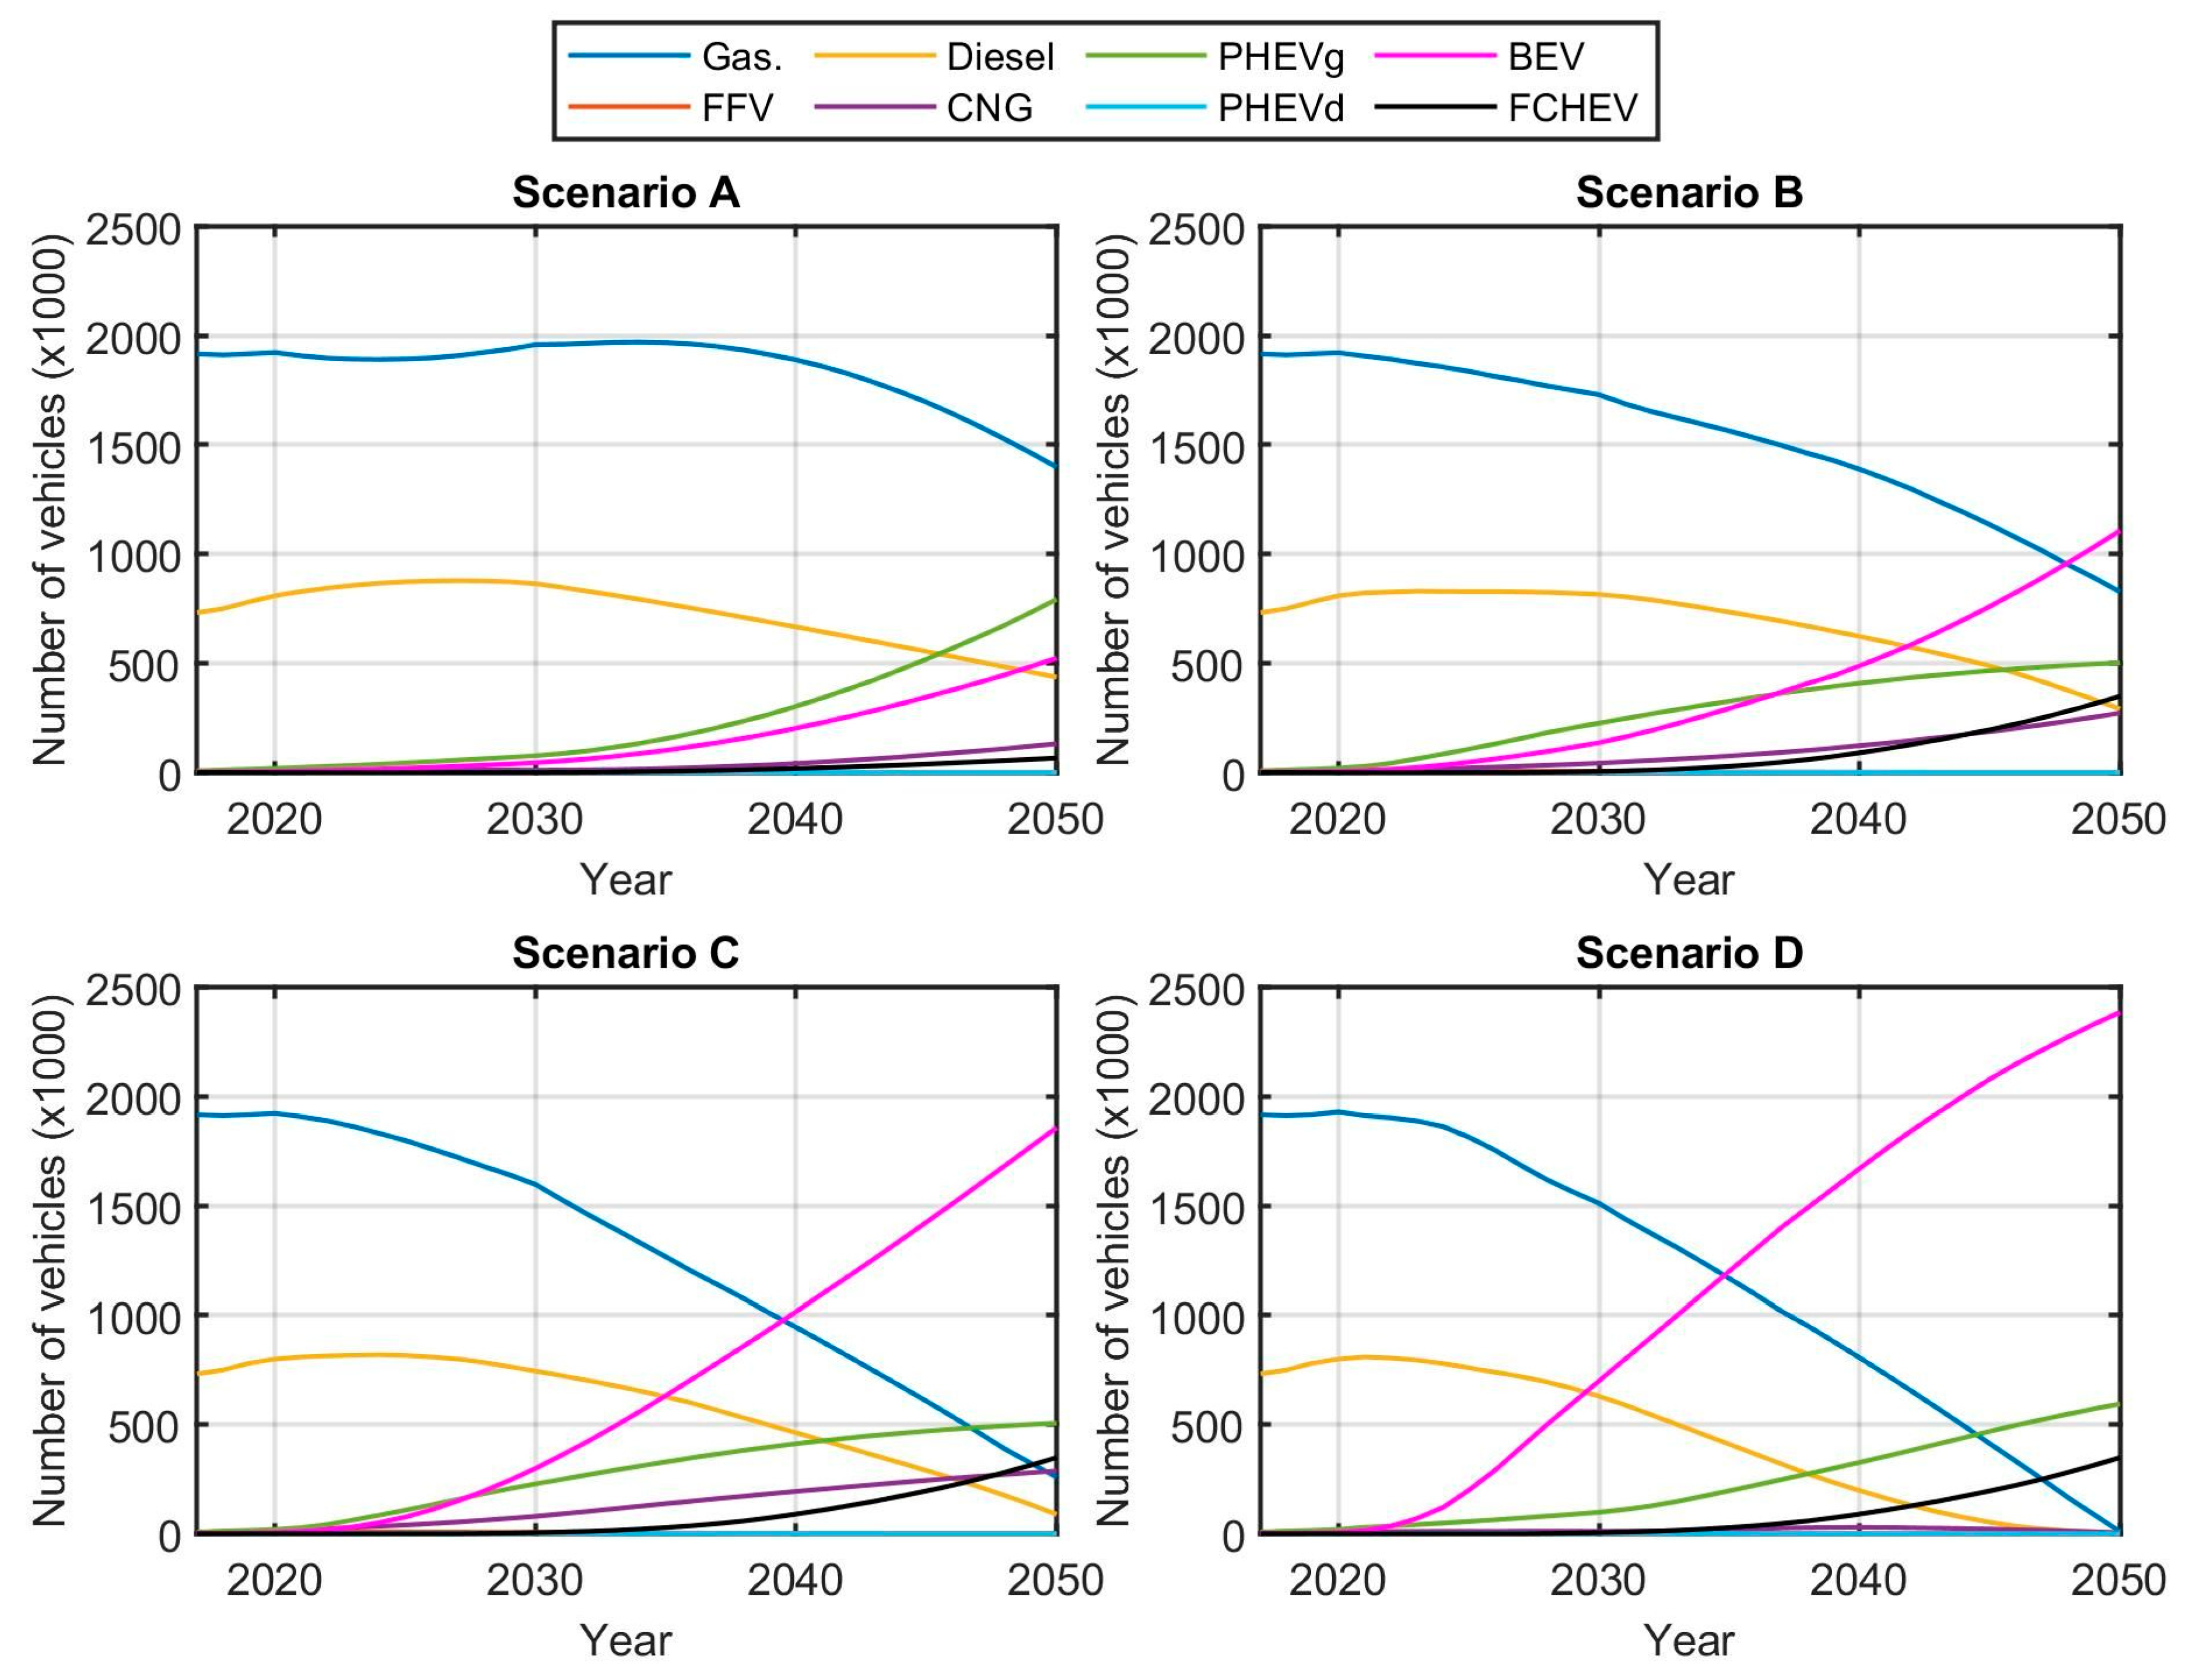
In order to examine the different scenarios for the development of the Finnish passenger vehicle fleet, the historical data of the vehicle stock flow was studied. Four different scenarios were chosen for the future vehicle fleets corresponding to low, medium, large, and extensive deployment of electric vehicles. These scenarios, called A [20], B [21], C [22] and D [23], are all based on the recently presented estimations about the future developments of the passenger vehicle fleet in Finland. The major difference between these scenarios is the amount of electric vehicles, which varies from a low growth (A) to large-scale adoption (D). Based on the information presented for each scenario, they were reconstructed by approximating the yearly shares of different vehicle technologies until 2050. The estimation for the total number of vehicles in the fleet in the future was taken from the reference [20], which estimates that the number of passenger cars in Finland will steadily rise from 2.66 million in 2017 to 3.35 million in 2050.
The four scenarios were made such that the number of new cars in the fleet would not have to exceed historical limits. Between the years 2014 and 2019, the yearly total number of new and imported vehicles varied between 125,000 and 160,000 [24]. The number of FFVs and diesel PHEVs was kept the same for all scenarios, as their share of the vehicle fleet is expected to be insignificant.
As was mentioned earlier, the total number of passenger cars in the fleet each year was the same in all scenarios. Similarly, the total distance driven each year was the same for all of the scenarios, with the values taken from reference [20]. The average yearly distance driven per vehicle is shown in Figure 3.
The four scenarios are depicted in Figure 4 in order from slowest rate of electric vehicle adoption to fastest. Scenario A was based on the Lipasto database where the development of the fleet has been estimated up to the year 2050 [20]. Lipasto is a calculation system for traffic exhaust emissions and energy use in Finland.
Scenarios B–D were more loosely based on other existing studies. Scenario B was created based on the base forecast of The Finnish Information Centre of Automobile Sector where the number of newly registered vehicles was approximated until the year 2040 [21].
Scenario C was developed using the results found in the final report of the GASELLI study as its basis. In the study, the effectiveness of different control measures on the rate of adoption of electric vehicles was considered up to the year 2030 [22]. The case in the report where all considered control measures were taken was used as the basis of the scenario. The number of FCHEVs and PHEVs was kept the same as in scenario B.
Scenario D was devised such that the target of 700,000 BEVs and 100,000 PHEVs in the year 2030 recommended in a report by Sitra would be reached [23]. The development of the FCHEV fleet was kept the same as in scenarios B and C. Table 1 presents the portions of each vehicle technology for all the scenarios.
2.3. Vehicle Fleet Data Sources
Various types of statistical data were used for the analysis of the vehicle fleet estimations. Most of the vehicle fleet related data was acquired from Lipasto [20]. Another important data source was Traficom (The Finnish Transport and Communications Agency) that provides the official statistics about the national vehicle fleet, new vehicle registrations, imported vehicles, etc. [24]. The historical and present data for the energy consumption of different vehicle technologies were acquired from Lipasto. The assumptions for the future energy consumptions were done based on the technology assessment done by ANL (Argonne National Laboratory) that has published extensive simulation studies about the technological developments of different vehicle technologies until the year 2045 [25]. The used values for energy consumptions as well as the well-to-tank (WTT) and tank-to-wheels (TTW) emissions of the different vehicle technologies are presented in Table 2 for the year 2016. These values were acquired from [20,25,26,27]. The energy consumption values correspond to the average consumption of the vehicle fleet of each vehicle technology. The TTW emission numbers take into account the biofuel mixing ratios, which were 4.8% for gasoline, 11.5% for diesel and 40% for CNG. The FFVs in Finland generally use the E85 ethanol fuel blend.
2.4. Estimation of the Distribution of Vehicle Use
The overall yearly distance covered by the passenger vehicles was acquired from Lipasto [20]. The distance driven with each vehicle technology was calculated based on the technology share of the yearly vehicle fleet. Within the technologies, the yearly driven distance was further divided into portions for each model year that have a specific energy consumption determined based on the historical data. Because some of the newer vehicle technologies have quite short historical data, it was decided to use an 11-year period distribution for the driven distance portions. In Lipasto, yearly energy consumption and distribution of vehicle use by model year was defined from 2006 to 2016 for conventional vehicle technologies. The distribution of vehicle use for the other vehicle technologies was calculated by using the yearly fleet data shares as the reference.
2.5. Estimation of Future Energy Consumption
The historical data for the energy consumption of each vehicle technology could be acquired from Lipasto database until model year 2016. An extensive study done by ANL provides estimations of energy consumption for different vehicle technologies until the year 2045. The results of the study were analyzed and a yearly decrease of energy consumption was calculated for each vehicle technology. Then, the acquired historical data was extended by calculating the reference energy consumption for each model year until 2050 by using the constant yearly decrease from the ANL study. Finally, the technology specific energy consumption of a vehicle fleet was calculated by using the 11-year period distribution of vehicle use.
2.6. Carbon Intensity of Energy Production
The carbon intensity for the production of different energy carriers was determined based on the recent literature and Finnish electricity production statistics [6,8,27]. The carbon intensity (CI) was divided into the production part (WTT) and consumption part (TTW) as shown in Table 2. It was assumed that the carbon intensity for the production of conventional fossil fuels would remain the same in the future. However, the carbon intensity of the vehicle fuels is impacted by the biofuel mixing ratio, which has been increasing over the years. At the moment, there is a national legislation for the minimum biofuel mixing ratio with future projections [28]. It was assumed that the mixing ratios would gradually increase in the future as follows:
- bioethanol blending with gasoline increases to 10% until 2030 and then remains the same,
- biodiesel blending with diesel up to 30% by 2050,
- biogas mixing ratio to CNG fixed to 40%.
Forecasts for the future carbon intensity of electricity production were found to be rather vague or non-existent. Therefore, it was considered that due to the increasing electricity demand, a moderate decrease was defined to be 1% per year and the same for hydrogen.
3. Results
3.1. Development of Total Carbon Dioxide Emissions
The total and TTW emissions in each of the four scenarios are presented in Figure 5. As can be seen in the figure, the total emissions would decrease from 7.26 million tons in 2017 to 4.08 million tons in 2050 in scenario A, meaning a reduction of approximately 44% compared to 2017. The TTW emissions would reduce by 49% in the examined period. In scenario A, the emissions reductions would start to pick up around 2030 partly due to the number of diesel vehicles in the fleet starting to decline and partly due to the number of electric vehicles starting to increase at a faster pace. Another factor contributing to 2030 being a turning point is that the distance driven per vehicle keeps increasing between 2020 and 2030, but after 2030 there is a continuous reduction in the yearly distance driven per vehicle (Figure 3), which affects all of the scenarios. Furthermore, the energy efficiency improvements of the different powertrain technologies as well as the reduction in the carbon intensity of electricity and hydrogen production contribute to the emissions reductions. Thus, significant emissions reductions can be achieved in longer time period even in scenario A despite the relatively slow adoption of electric vehicles.
In scenario B, the total emissions would reduce by 55% to 3.3 million tons by 2050. TTW emissions would reduce by 67% compared to 2017. The higher reductions compared to scenario A are explained by the higher number of BEVs, FCHEVs, and CNG vehicles.
The results of scenario C show even higher emissions reductions. The total and TTW emissions of the vehicle fleet would reduce by 69% and 84% compared to 2017 by 2050. In scenario C, there would be nearly 1.9 million BEVs in Finland in 2050 compared to 1.1 million in scenario B, which explains the difference in the emissions reductions.
As can be seen in Figure 5, scenario D would produce the highest emissions reductions. In the scenario, BEVs would comprise 71% of the entire fleet in the year 2050. The total emissions reductions would be 78% and the TTW reductions 94 % compared to 2017 levels.
3.2. Technology Specific Carbon Dioxide Emissions
Figure 6 shows the development of the total emissions of the different vehicle types in the four scenarios. As the figure shows, the majority of the emissions in 2050 would still be caused by gasoline vehicles in scenario A. Diesel and gasoline plug-in hybrid electric vehicles would each account for approximately 16% of the emissions in 2050. BEVs, CNG vehicles, and FCHEVs would account for 3.8%, 3.6%, and 1.7% of the emissions.
In scenario B, gasoline vehicles would comprise 43% of the emissions in 2050 even though they would only comprise 25% of the fleet. Gasoline plug-in hybrid and diesel vehicles would be roughly equal as the second largest polluters with a 13-percent share of the emissions each, while BEVs and FCHEVs would account for 10% and 11%. CNG vehicles would cause 9% of the emissions in 2050.
Scenario C would see the BEVs being the most-polluting vehicle type in 2050 with a 24-percent share of the emissions. However, they would also be the majority of the vehicle fleet with a 55-percent share. Gasoline vehicles would only comprise 7.7% of the fleet although they would still account for almost 20% of the emissions. Gasoline PHEVs would account for 19% and FCHEVs for 17% of the emissions in 2050. Scenario C would also feature the highest share of CNG emissions in 2050 in any of the scenarios with the share being 14%.
In scenario D, the fleet would mainly consist of BEVs, gasoline PHEVs, and FCHEVs in 2050. The respective emission shares would be 44%, 31%, and 23%. It is also worth noting that, despite the significant differences in the emission shares in 2050 between the different scenarios, the differences in 2030 are only minor. The emissions share of gasoline vehicles varies between 64% and 70% and the share of diesel vehicles between 25% and 28%. The 2030 results are indicative of the slow rate at which the Finnish vehicle fleet is capable of changing.
3.3. Reduction of TTW Carbon Dioxide Emissions
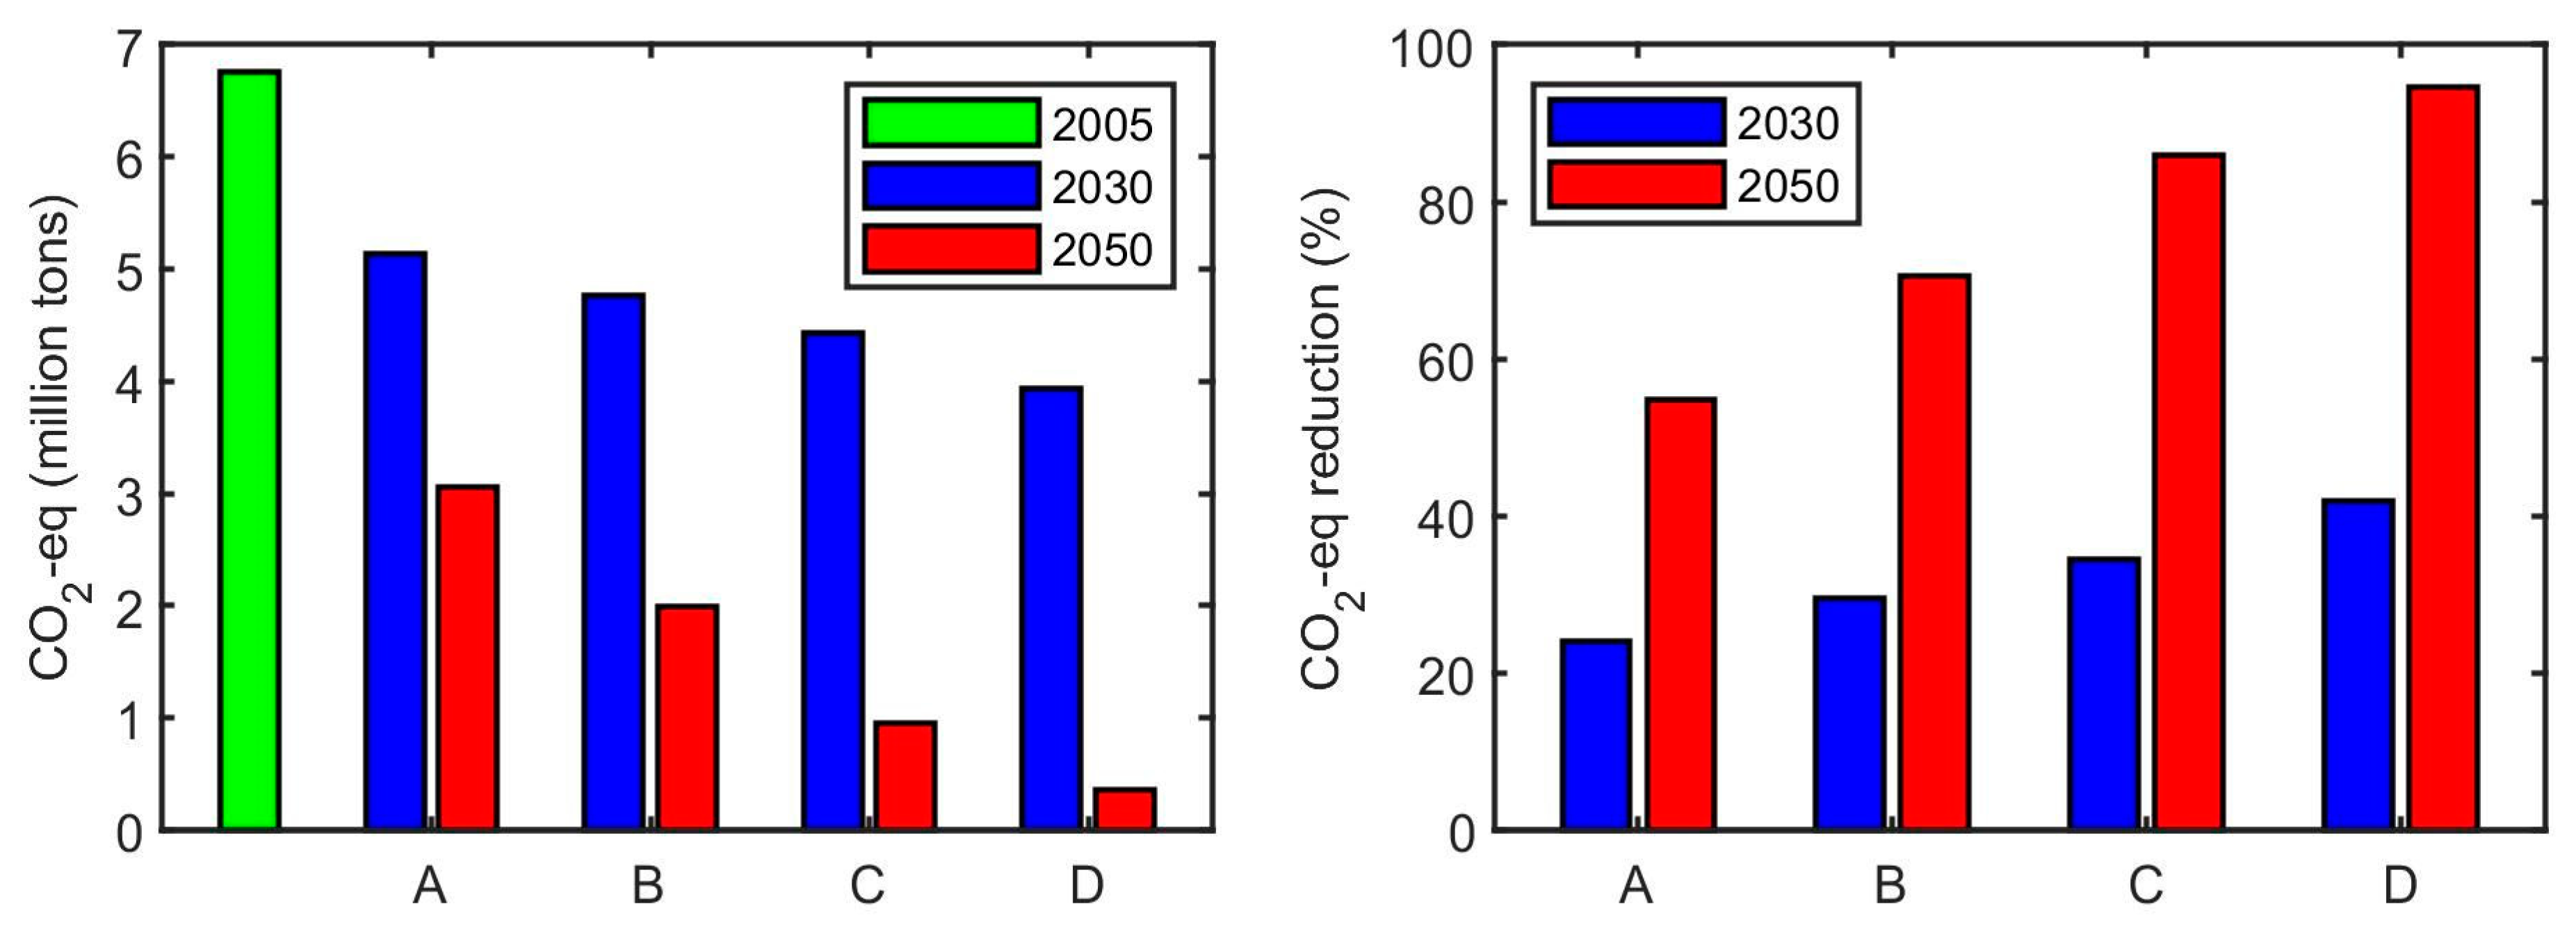
Figure 7 shows the TTW emissions of the entire fleet in the four scenarios in 2030 and 2050. The year 2030 was chosen for examination because the Finnish government has set a target to reduce traffic emissions by 50% by 2030 compared to 2005 levels [29]. The TTW CO2-eq emissions of the Finnish passenger car fleet were approximately 6.76 million tons in 2005 [20]. The overall target set for Finland by the EU commission is to reduce greenhouse gas emissions by 39% compared to 2005 levels by 2030 [29].
These results clearly show that reducing the tank-to-wheels CO2 emissions of passenger vehicle fleet would require drastic measures to reach the target set by the EU by 2030 and even more efforts for the targets of the Finnish government. In the long-term, the influence of the high average age of the Finnish passenger vehicle fleet will have been mitigated by the gradual adoption of alternative vehicle technologies. Generally, it has been considered that the CO2 reduction measures are less demanding for passenger vehicles than the other transport sectors such as aviation and long-distance freight. However, these results distinctly indicate that due to the specific characteristics of the Finnish passenger vehicle fleet, large deployment of electrified vehicles are required to accomplish already in the near future in order to reach the demanding targets.
4. Discussion
While the results demonstrate that significant emissions reductions can be achieved with the electrification of the vehicle fleet, it is also clear that the 50% target cannot be reached among passenger vehicle fleet with the presented scenarios. In scenarios A, B, C, and D, the TTW emissions reductions compared to 2005 levels would be 24.0%, 29.6%, 34.4%, and 41.8% in 2030. In order to achieve the 50-percent target among the passenger vehicle fleet, higher biofuel mixing ratios would be required compared to the values used in the model employed in this study. Nonetheless, the results show that the emissions reductions achieved by 2050 even in the most conservative scenario would be substantial despite a significant increase in the size of the fleet. In the most optimistic scenario, the TTW greenhouse gas emissions produced by the Finnish passenger car fleet would be close to zero by 2050. In the light of these results, multiple measures seems to be necessary for reaching the ambitious targets of reducing passenger vehicle emissions. There is often discussion about the vehicle taxation policies which is one the reasons for the high average age of the vehicle fleet. One measure that many countries have successfully used is the direct financial incentive for electric vehicle purchase. This also exist in Finland but being relatively low that not many consumers have been able to benefit from it.
The results demonstrate that the electrification of the passenger vehicle fleet does not have a significant adverse effect on the WTT emissions of the fleet. The WTT emissions would be approximately 20% lower in 2050 compared to 2017 in scenario A. In scenario D, the WTT emissions would be 2% lower in 2050 compared to 2017. The low impact of the electrification on the increase of the WTT emissions is mainly due to the relatively clean electricity production in Finland. The projected reduction in the yearly distance driven per vehicle, the continuously increasing efficiency of the different powertrain technologies, and the further reduction in the emissions of electricity production also contribute to the low impact the electrification of the fleet has on the WTT emissions.
Increasing the deployment of battery electric vehicles seems in many ways a sustainable approach, but a myriad of challenges arise as the share of battery-equipped electric vehicles grows. The main challenge is the sustainable and robust scale-up of battery manufacturing, renewable energy and charging infrastructure. Battery manufacturing significantly contributes to the carbon dioxide emissions. Raw material mining and refining, manufacturing of battery cells and their assembly to battery packs are still powered with fossil fuels by many battery manufacturers. These emissions can be lowered by utilizing renewable energy and by improving the energy efficiency of the manufacturing process and material recycling.
The increase of renewable energy production proportionally decreases the emissions of electric vehicle operation; however, renewable energy power is unpredictable. Reliance solely on renewable energy thus requires batteries. Furthermore, renewable energy plants have high initial investment costs and uncertain return of investment, due to uncertain weather conditions and electric grid load capacity. On top of the renewable energy load, the grid must endure the load and inconsistency of fast charging stations. All of these challenges are solvable with available technology but should not be taken lightly as their successful implementation requires great co-operation of companies and governments.
The calculation of CO2 emissions of transport may not always be straightforward especially when electricity production needs to be taken into account. The estimations of future emissions require a substantial amount of assumptions about the technological development of vehicles, energy production, vehicle fleet composition, and possible regulations by the government. These assumptions have a major influence on the calculation of the CO2 emissions especially at this moment, when battery electric vehicles are about to be deployed in large-scale in the coming years. Because these assumptions may differ significantly between different regions and countries, it is reasonable to carry out calculations for emission estimations based on regional characteristics.
The presented approach is assumed to be suitable to use in the context of other countries as long as the required input data is available. In our results, the WTT emissions for the electric vehicles were quite low which would be the same for other Nordic European countries, as they have a lot of available hydro and wind power. However, the results could be quite different in the countries that have higher emissions from the electricity production usually leaning on coal. On the other hand, the average age of the passenger vehicle stock is much lower in many European countries than in Finland. This can be an advantage in the future because the vehicle stock can be renewed faster and even the conventional vehicle technologies can decrease the CO2 emissions when using the latest engine technologies.
With our research approach we were able to compare different scenarios that have different penetration of electric vehicles until year 2050 in terms of WTT and TTW CO2 emissions. The results provided valuable information for the required rate of adoption of electric vehicles and also allows to further investigate the possible increasing amount of the biofuels. Unfortunately, the approach does not allow to analyze the yearly dynamics of vehicle sales and imports. This would be important information in making projections for the required amount of electric vehicles or other alternative powertrain technologies in order to reach specific targets in the future. This is the reason that we will continue our research by developing a dynamic vehicle stock flow model that allows for investigating also the influences of consumer behavior, purchase cost, and financial incentives.
5. Conclusions
This paper presents the potential of reducing carbon dioxide emissions of passenger vehicles by increasing the amount of electric vehicles in the Finnish vehicle fleet. Four different vehicle fleet development scenarios were determined until 2050 by using data presented in recent evaluation studies. Eight different vehicle technologies were considered. Based on the various statistical data of the Finnish car fleet, the scenarios were analyzed by defining fleet specific energy consumption factors for each vehicle technology. The carbon dioxide emission factors for each energy carrier and vehicle technology were defined based on the national energy production data taking into account a reasonable increase of biofuel mixing ratios. Finally, CO2 equivalent emissions were calculated for each scenario.
Practically, all the scenarios showed the impact of the rather high average age and high number of gasoline vehicles of the Finnish passenger vehicle fleet. This was recognized as a slow reduction of emissions in the early phases of adopting electric vehicles. However, after the fleet is renewed the emission reduction is significant in most of the scenarios by 2050. The obtained results also clearly indicated that even an extensive adoption of electric vehicles may not reduce the CO2 emissions of the passenger vehicle fleet in order to reach the ambitious targets set by the EU and Finnish government. With this in mind, it is reasonable to address the question whether there is another, more effective approach for the near future to decrease the transport emissions in the Finnish context. Obviously, there already has been speculation about the role of biogas and other biofuels, and these are the examples that should be thoroughly evaluated before leaning solely on transportation electrification.
Author Contributions
The authors have contributed to the paper based on their research focus and professional competence. A.L. developed the original research idea, collected statistical data, analyzed and reorganized the historical vehicle data, and wrote the original draft manuscript. K.K. developed the mathematical models for data analysis, elaborated the different vehicle fleet scenarios, carried out the calculations, produced and wrote the results. K.T. analyzed the different vehicle fleet scenarios, investigated alternative fuels, and participated paper review and editing. J.V. contributed to the discussion and overall development of the paper. All the authors participated in the methodology development and conceptualization. All authors have read and agreed to the published version of the manuscript.
Funding
This research was partly funded by Jenny and Antti Wihuri Foundation in Finland and Henry Ford Foundation Finland.
Acknowledgments
The authors would like to acknowledge the financial support from the Jenny and Antti Wihuri Foundation and Henry Ford Foundation. Nils-Olof Nylund is acknowledged for instruction and comments.
Conflicts of Interest
The authors declare no conflict of interest.
References
- Muneer, T.; Milligan, R.; Smith, I.; Doyle, A.; Pozuelo, M.; Knez, M. Energetic, environmental and economic performance of electric vehicles: Experimental evaluation. Transp. Res. Part D Transp. Environ. 2015, 35, 40–61. [Google Scholar] [CrossRef] [Green Version]
- Jochem, P.; Babrowski, S.; Fichtner, W. Assessing CO2 emissions of electric vehicles in Germany in 2030. Transp. Res. Part A Policy Pr. 2015, 78, 68–83. [Google Scholar] [CrossRef] [Green Version]
- Casals, L.C.; Laserna, E.M.; García-Peñalvo, F.J.; Nieto, N. Sustainability analysis of the electric vehicle use in Europe for CO2 emissions reduction. J. Clean. Prod. 2016, 127, 425–437. [Google Scholar] [CrossRef]
- Thiel, C.; Schmidt, J.; Van Zyl, A.; Schmid, E. Cost and well-to-wheel implications of the vehicle fleet CO2 emission regulation in the European Union. Transp. Res. Part A Policy Pr. 2014, 63, 25–42. [Google Scholar] [CrossRef]
- Manan, A.F.N.A. Uncertainty and differences in GHG emissions between electric and conventional gasoline vehicles with implications for transport policy making. Energy Policy 2015, 87, 1–7. [Google Scholar] [CrossRef]
- Lajunen, A. Evaluation of energy consumption and carbon dioxide emissions for electric vehicles in Nordic climate conditions. In Proceedings of the 2018 Thirteenth International Conference on Ecological Vehicles and Renewable Energies (EVER), Monte-Carlo, Monaco, 10–12 April 2018; pp. 1–7. [Google Scholar]
- Skrucany, T.; Kendra, M.; Stopka, O.; Milojević, S.; Figlus, T.; Csiszár, C. Impact of the Electric Mobility Implementation on the Greenhouse Gases Production in Central European Countries. Sustainability 2019, 11, 4948. [Google Scholar] [CrossRef] [Green Version]
- Moro, A.; Lonza, L. Electricity carbon intensity in European Member States: Impacts on GHG emissions of electric vehicles. Transp. Res. Part D Transp. Environ. 2018, 64, 5–14. [Google Scholar] [CrossRef] [PubMed]
- Kim, E.; Heo, E. Key Drivers behind the Adoption of Electric Vehicle in Korea: An Analysis of the Revealed Preferences. Sustainability 2019, 11, 6854. [Google Scholar] [CrossRef] [Green Version]
- Hidrue, M.K.; Parsons, G.R.; Kempton, W.; Gardner, M. Willingness to pay for electric vehicles and their attributes. Resour. Energy Econ. 2011, 33, 686–705. [Google Scholar] [CrossRef] [Green Version]
- Lajunen, A.; Tammi, K. Energy consumption of electric vehicles in different climate and driving conditions. In Proceedings of the EVS30 Symposium, Stuttgart, Germany, 9–11 October 2017. [Google Scholar]
- Tsiakmakis, S.; Fontaras, G.; Ciuffo, B.; Samaras, Z. A simulation-based methodology for quantifying European passenger car fleet CO2 emissions. Appl. Energy 2017, 199, 447–465. [Google Scholar] [CrossRef]
- Ayodele, B.V.; Mustapa, S.I. Life Cycle Cost Assessment of Electric Vehicles: A Review and Bibliometric Analysis. Sustainability 2020, 12, 2387. [Google Scholar] [CrossRef] [Green Version]
- Wu, G.; Inderbitzin, A.; Bening, C. Total cost of ownership of electric vehicles compared to conventional vehicles: A probabilistic analysis and projection across market segments. Energy Policy 2015, 80, 196–214. [Google Scholar] [CrossRef]
- Hardman, S.; Chandan, A.; Tal, G.; Turrentine, T. The effectiveness of financial purchase incentives for battery electric vehicles—A review of the evidence. Renew. Sustain. Energy Rev. 2017, 80, 1100–1111. [Google Scholar] [CrossRef]
- Trost, T.; Sterner, M.; Bruckner, T. Impact of electric vehicles and synthetic gaseous fuels on final energy consumption and carbon dioxide emissions in Germany based on long-term vehicle fleet modelling. Energy 2017, 141, 1215–1225. [Google Scholar] [CrossRef]
- Noori, M.; Tatari, O. Development of an agent-based model for regional market penetration projections of electric vehicles in the United States. Energy 2016, 96, 215–230. [Google Scholar] [CrossRef]
- Helgeson, B.; Peter, J. The role of electricity in decarbonizing European road transport—Development and assessment of an integrated multi-sectoral model. Appl. Energy 2020, 262, 114365. [Google Scholar] [CrossRef] [Green Version]
- Average Vehicle Age. ACEA. Available online: https://www.acea.be/statistics/tag/category/average-vehicle-age (accessed on 3 June 2020).
- LIPASTO Traffic Emissions. VTT. Available online: http://lipasto.vtt.fi/ (accessed on 1 June 2020).
- Kalenoja, H. Henkilöautojen Tulevaisuuden Käyttövoimat-Tiekartta Vuoteen 2040; Tieliikenteen Tietokeskus: Helsinki, Finland, 2019. [Google Scholar]
- Pihlatie, M.; Paakkinen, M.; Laurikko, J.; Laurikkala, M.; Ylén, P.; Peltola, V.; Pylsy, P. Cost-Effective Means for Advancing Electric Vehicle Market in Finland—GASELLI Final Report; Publications of the Government´s Analysis, Assessment and Research Activities 3/2019; Prime Minister’s Office: Helsinki, Finland, 2019.
- Granskog, A.; Gulli, C.; Melgin, T.; Naucler, T.; Speelman, E.; Toivola, L.; Walter, D. Cost-Efficient Emission Reduction Pathway to 2030 for Finland—Opportunities in Electrification and Beyond; Sitra Studies 140; Sitra: Helsinki, Finland, 2018. [Google Scholar]
- Statistics Database. Traficom. Available online: http://trafi2.stat.fi/PXWeb/pxweb/en/TraFi/ (accessed on 6 March 2020).
- Moawad, A.; Kim, N.; Shidore, N.; Rousseau, A. Assessment of Vehicle Sizing, Energy Consumption and Cost through Large Scale Simulation of Advanced Vehicle Technologies; Argonne National Laboratory: Lemont, IL, USA, 2016. [Google Scholar]
- Edwards, R.; Larivé, J.-F.; Rickeard, D.; Weindorf, W. Well-to-Tank Report Version 4.0; European Commission, Joint Research Centre: Luxembourg, 2013. [Google Scholar] [CrossRef]
- Finnish Energy. Available online: https://energia.fi/en/energy_sector_in_finland/energy_production/electricity_generation (accessed on 12 November 2019).
- Finlex 446/2007. Laki Biopolttoaineiden Käytön Edistämisestä Liikenteessä Annetun Lain Muuttamisesta; Finlex Data Bank, 2018; Available online: https://www.finlex.fi (accessed on 7 April 2020).
- Huttunen, R. Government Report on the National Energy and Climate Strategy for 2030; Ministry of Economic Affairs and Employment: Helsinki, Finland, 2017.
Figure 1.
Passenger vehicle fleet, its average age and CO2 emissions.

Figure 2.
Distribution of vehicle technologies: (a) The Finnish vehicle fleet in 2019; (b) Newly registered and individually imported vehicles in 2019.
Figure 2.
Distribution of vehicle technologies: (a) The Finnish vehicle fleet in 2019; (b) Newly registered and individually imported vehicles in 2019.
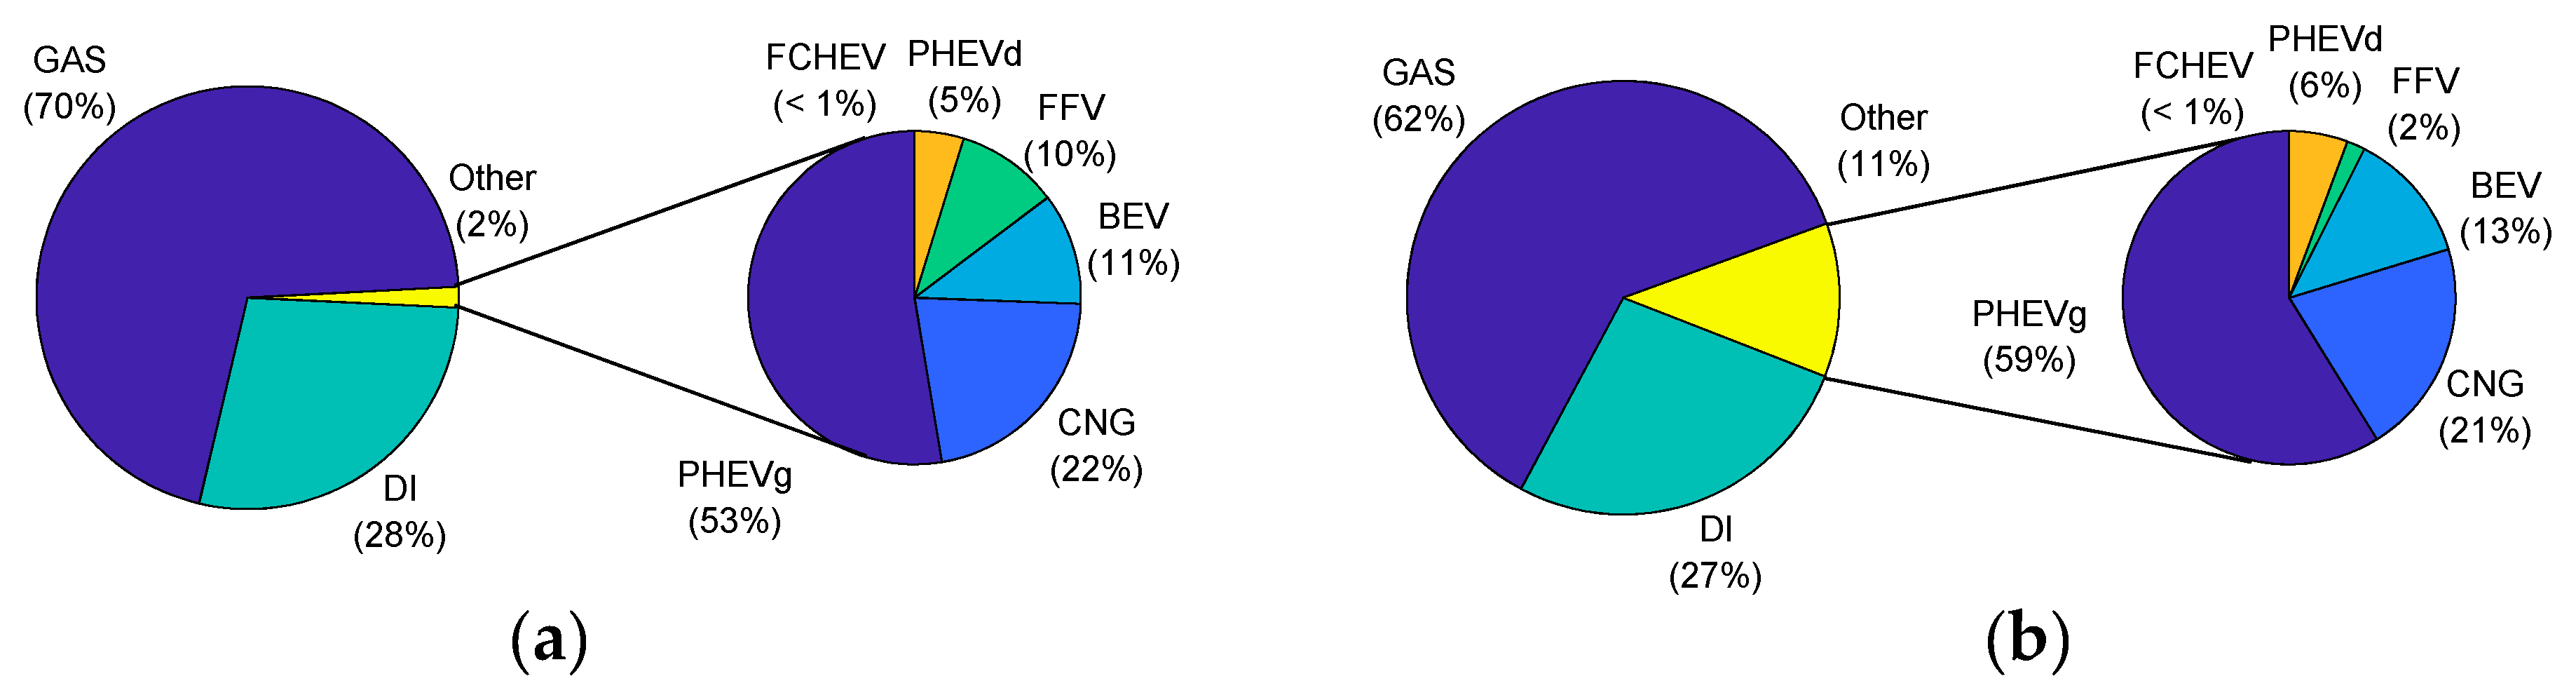
Figure 3.
Average yearly distance driven per vehicle in the four scenarios.

Figure 4.
Development of the different vehicle fleet in scenarios.

Figure 5.
Total and TTW emissions in different scenarios.
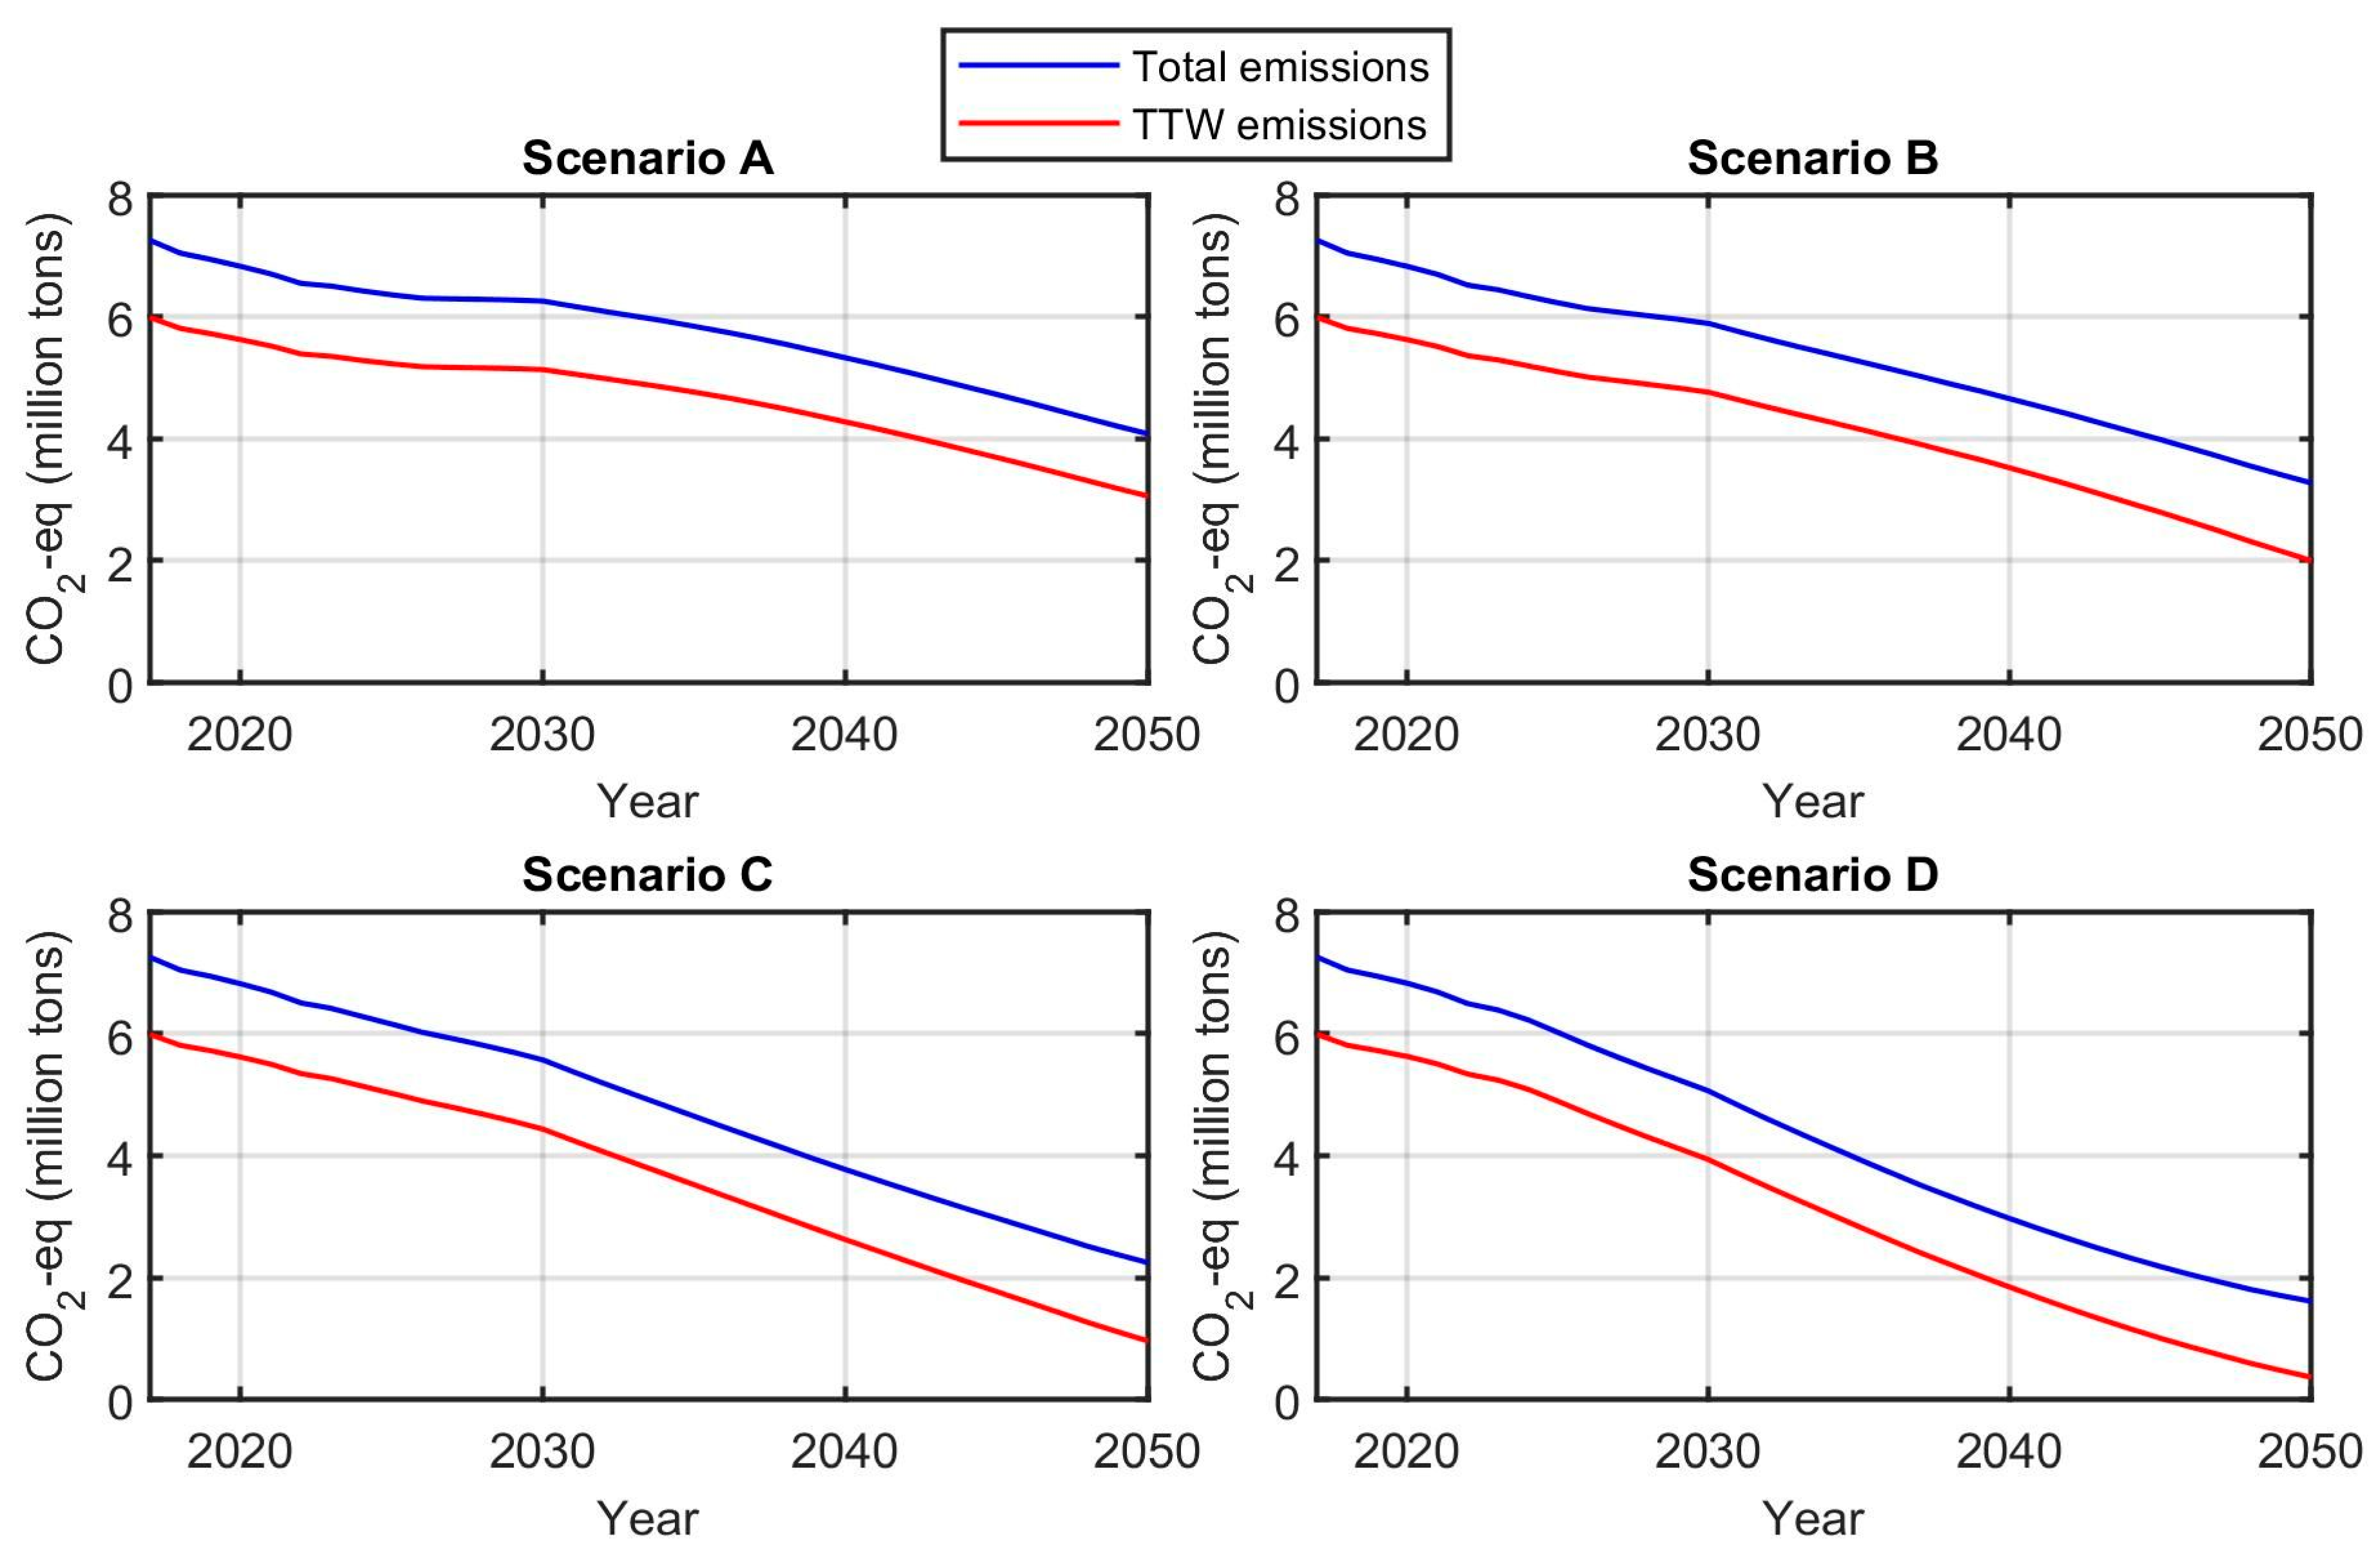
Figure 6.
Development of the total emissions of the different vehicle types in the four scenarios.
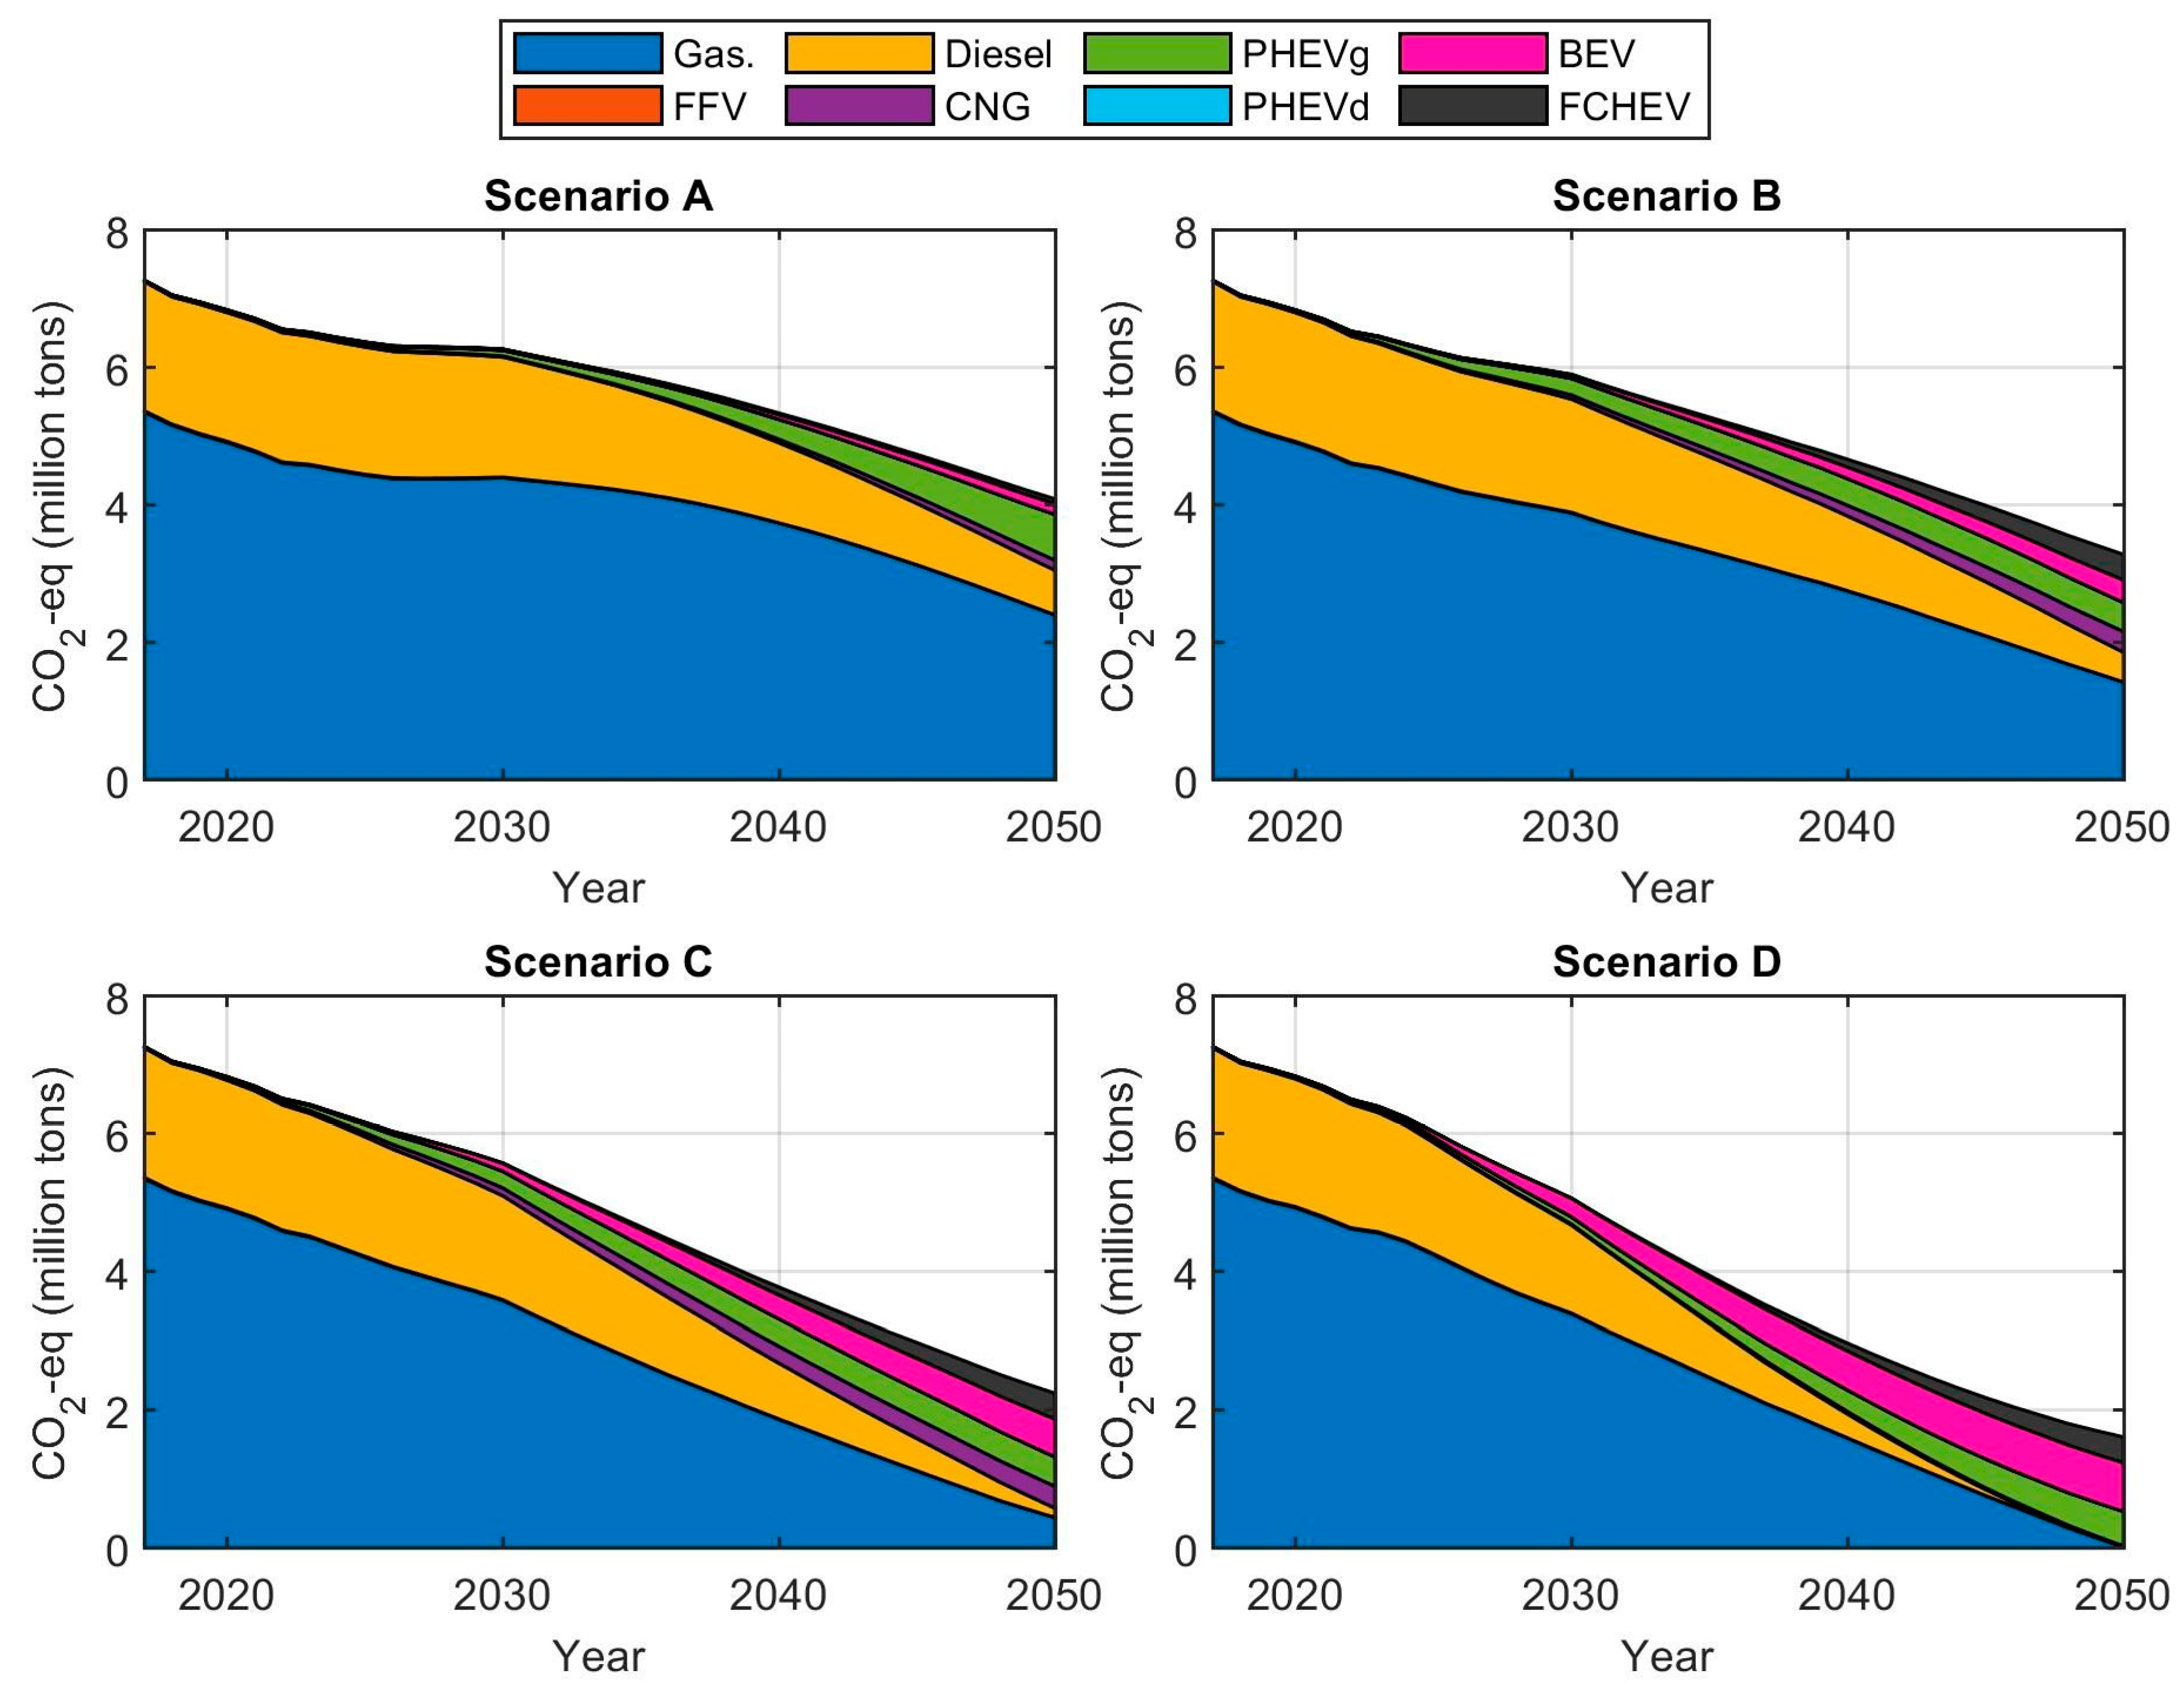
Figure 7.
Tank-to-wheels emissions of the entire fleet in 2030 and 2050 (left) and the reduction of TTW emissions relative to 2005 as a percentage (right) in the four scenarios.
Figure 7.
Tank-to-wheels emissions of the entire fleet in 2030 and 2050 (left) and the reduction of TTW emissions relative to 2005 as a percentage (right) in the four scenarios.

Table 1.
Percentage portions of each vehicle technology for all the scenarios in years 2030 and 2050.
Table 1.
Percentage portions of each vehicle technology for all the scenarios in years 2030 and 2050.
| 2030 | 2050 | |||||||
|---|---|---|---|---|---|---|---|---|
| A | B | C | D | A | B | C | D | |
| Gasoline | 66.09 | 58.38 | 53.90 | 51.00 | 41.75 | 24.70 | 7.74 | 0.30 |
| FFV | 0.20 | 0.20 | 0.20 | 0.20 | 0.00 | 0.00 | 0.00 | 0.00 |
| Diesel | 29.17 | 27.51 | 25.14 | 21.26 | 13.03 | 8.69 | 2.66 | 0.15 |
| CNG | 0.37 | 1.45 | 2.70 | 0.37 | 3.93 | 8.14 | 8.59 | 0.12 |
| PHEV gasoline | 2.58 | 7.64 | 7.71 | 3.32 | 23.67 | 14.99 | 15.12 | 17.77 |
| PHEV diesel | 0.05 | 0.05 | 0.05 | 0.05 | 0.00 | 0.00 | 0.00 | 0.00 |
| BEV | 1.52 | 4.61 | 10.13 | 23.63 | 15.64 | 33.06 | 55.47 | 71.23 |
| FCHEV | 0.02 | 0.17 | 0.17 | 0.17 | 1.98 | 10.42 | 10.42 | 10.42 |
Table 2.
Average energy consumption and emission factors of the different vehicle technologies.
| Type | Energy Cons. (MJ/km) | WTT Emissions (gCO2-eq/MJ) | TTW Emissions (gCO2-eq/MJ) |
|---|---|---|---|
| Gasoline | 2.3 | 13.8 | 69.4 |
| FFV | 2.1 | 35 | 25.8 |
| Diesel | 2.1 | 15.5 | 65.7 |
| CNG | 1.9 | 22.5 | 34.1 |
| PHEV gasoline | 1.1 | 22.5 | 47.9 |
| PHEV diesel | 1.07 | 23.6 | 45.6 |
| BEV | 0.69 | 42 | 0 |
| FCHEV | 1.0 | 125 | 0 |
© 2020 by the authors. Licensee MDPI, Basel, Switzerland. This article is an open access article distributed under the terms and conditions of the Creative Commons Attribution (CC BY) license (http://creativecommons.org/licenses/by/4.0/).
Share and Cite
MDPI and ACS Style
Lajunen, A.; Kivekäs, K.; Vepsäläinen, J.; Tammi, K. Influence of Increasing Electrification of Passenger Vehicle Fleet on Carbon Dioxide Emissions in Finland. Sustainability 2020, 12, 5032. https://doi.org/10.3390/su12125032
AMA Style
Lajunen A, Kivekäs K, Vepsäläinen J, Tammi K. Influence of Increasing Electrification of Passenger Vehicle Fleet on Carbon Dioxide Emissions in Finland. Sustainability. 2020; 12(12):5032. https://doi.org/10.3390/su12125032
Chicago/Turabian StyleLajunen, Antti, Klaus Kivekäs, Jari Vepsäläinen, and Kari Tammi. 2020. "Influence of Increasing Electrification of Passenger Vehicle Fleet on Carbon Dioxide Emissions in Finland" Sustainability 12, no. 12: 5032. https://doi.org/10.3390/su12125032
Note that from the first issue of 2016, this journal uses article numbers instead of page numbers. See further details here.