Article

Carbon Footprint Evaluation of the Business Event Sector in Japan

1
Graduate School of Environmental and Information Studies, Tokyo City University, Yokohama 224-8551, Japan
2
Research Institute of Science for Safety and Sustainability, National Institute of Advanced Industrial Science and Technology, Tsukuba 305-8569, Japan
*
Author to whom correspondence should be addressed.
Sustainability 2020, 12(12), 5001; https://doi.org/10.3390/su12125001
Submission received: 28 May 2020 / Revised: 15 June 2020 / Accepted: 16 June 2020 / Published: 18 June 2020

Abstract

:
The business event sector expects large economic impact as MICE (Meeting (M), Incentive Travel (I), Convention (C), and Exhibition and Event (E)). Some guidelines for MICE sustainability include the requirement for carbon management (carbon neutral, measurement of greenhouse gas emissions, carbon offset, etc.) as a positive contribution to mitigating climate change. According to the environmental guidelines for events updated by the Japanese Ministry of the Environment in 2019, goods should be procured after considering the environmental load items and life cycle stages from the life cycle assessment (LCA) perspective. In this study, we evaluated the business events sector, not only transportation but also accommodation of participants from overseas, as well as food and beverages, souvenirs and shopping, and entertainment and tourism expenses. These items were not included in the previous existing case studies. We evaluated the carbon footprint (CFP), calculated from consumption information using input-output analysis. In this study, the total CFP was 804.8 t-CO2eq (M, I, C-ICCA (Convention based on an international conference standard from the International Congress and Convention Association (ICCA)), and E) and transportation (Transp, 56.0%) contributed the most, followed by planning and preparation (Plan, 13.2%) and accommodation (Acc, 12.0%), souvenirs, shopping, entertainment and sightseeing (SE, 10.1%), and food and beverages (FB, 7.9%). In the case of M, I, C-JNTO (Convention based on an international conference standard from the Japan National Tourism Organization (JNTO)) and E, the total CFP was 1714.4 t-CO2eq and transportation (Transp, 54.3%) contributed the most, followed by planning and preparation (Plan, 14.3%) and accommodation (Acc, 12.9%), food and beverages (FB, 9.2%), and souvenirs, shopping, entertainment and sightseeing (SE, 8.2%). From this result, the CFP of this sector was found to be due to transportation, planning and preparation, accommodation, food and beverages, and souvenirs. Sustainability guidelines recommend that organizers procure products that contribute to lower CFP, and it is considered good practice to provide participants with such product and service choices. The providers themselves also need action to offer low CFP products. Assessing changes in consumption items in future studies may help to calculate environmental impacts and sustainability.

1. Introduction

1.1. Social Background

The United Nations (UN) designated 2017 as the International Year of Sustainable Tourism for Development [1]. Sustainable tourism is defined as “tourism that fully addresses the current, future economic, social and environmental impacts while meeting the needs of visitors, industries, the environment and the communities that accept them”. This is applicable to all types of tourism in all types of destinations [2]. Tourism is defined as a temporary leave in daily life and related events, followed by a move to a different place. This description can be applied to travel for individuals as well as business travelers. Business events are classified into meetings (M), incentive travel (I), conventions (C), and exhibitions and events (E). These are collectively referred to as MICE, which includes all international business events. For such business, tourism does not include sports tourism, which is large international events where spectators gather. According to the Japan Tourism Agency (JTA), one of the authorities responsible for tourism in Japan, the three expectations in the MICE sector as business tourism are creating opportunities for business innovation, supporting the economic spread to different regions, and improving the competitiveness of countries and cities [3]. In this way, the Government of Japan is aiming to economically expand the tourism and MICE sectors, expecting high economic effects [4]. Research is being conducted on the economic ripple effects to verify them, covering countries and regions that emphasize the MICE sector, such as the United States (U.S., 2012) [5], United Kingdom (U.K., 2013) [6], Denmark (2012) [7], Australia (2015) [8], Singapore (2016) [9], and Thailand (2018) [10].
Regarding the sustainability of an event, the International Organization for Standardization (ISO) 20121 [11] was established in 2012 as an international standard. Event management cycle stages and event activities (including products and services involved) start from research, conception, and planning through to implementation, review, and post-event activities. The main stakeholders are the event organizer and owner, the workforce, supply chain, participants, attendees, regulatory bodies, and community. The sustainability guidelines related to MICE have also received attention. The United Nations Environment Program (UNEP) published the Green Meeting Guide (2009) [12] and Sustainable Events Guide (2012). [13] With reference to these, Singapore (2013) [14], Thailand (2015) [15], and Taiwan (2016) [16] created their own sustainability guidelines. Taiwan’s guidelines are characterized by having a checklist required of visitors. It also calls on all stakeholders to provide information on carbon footprint (CFP). In Japan, the Ministry of the Environment published the “Recommendations for Environmentally Friendly Meetings” [17] in 2008. Tokyo also created its own sustainability guidelines (2019) [18], but negative to carbon management as carbon neutral, measurement of greenhouse gas emissions, carbon offset, etc. However, some of these global guidelines include the requirement for carbon management as a positive contribution to climate change, highlighting the importance of clarifying environmental impacts and efforts for each stakeholder. Meeting these guidelines involves many qualitative actions.
The Paris Agreement was adopted in 2015 with the agreement of 195 UN countries [19]. The UNEP annual Emissions Gap Report 2019 reported that global greenhouse gas (GHG) emissions will be needed to be cut by 7.6% every year in the coming decades [20]. In Japan, Intended Nationally Determined Contribution (INDC) has targeted a decrease of 26% by 2030 compared to 2013 [21]. The long-term strategy under the Paris Agreement announced that it will aim to reduce emissions by 80% by 2050 [22]. The Sustainable Development Goals (SDGs) are a universal language in terms of sustainability. In the SDG compass, which tracks the approach to the SDGs, life cycle assessment (LCA) is introduced as one of the means that can be used to map the high-impact areas in the value chain, identifying issues that should be prioritized [23]. The world tourism industry has also begun to implement tourism SDGs, aiming to contribute to the SDGs [24].

1.2. Existing Studies

Mair et al. stated that a potential issue for MICE is climate change [25]. Seraphin et al. studied the impact of climate change and other environmental problems on the MICE sector in relation to international and domestic tourism [26]. The carbon footprint (CFP) calculated at the Olympic and Paralympic London Games has been referenced and used in various subsequent events [27]. About 91% of the CFP at international conferences is due to the transportation of participants [28].
In Japan, case studies have been conducted for sports events [29], music concerts [30], and school festivals [31]. Large-scale event evaluation requires the acquisition of an enormous amount of information. Therefore, a simple evaluation method is required and a method developed that uses the basic unit of the event [32]. The evaluation of the Eco-Pro (2010) event, which is representative of large-scale events, did not target visitors from overseas [33]. The Ise-Shima Summit evaluation considered only the transportation of participants, use of venues by related parties, and use of facilities for accommodation [34]. The evaluation cases for the Meeting of the Institute of Life Cycle Assessment, Japan (ILCAJ) did not include participants’ food and beverages, souvenirs and shopping, and entertainment and tourism such as sightseeing [35]. According to environmental guideline for events [36] updated by Ministry of the Environment Government of Japan in 2019, goods should be procured after considering the environmental load items and life cycle stages from the LCA perspective.
From the previous description of the existing case studies, few studies have been conducted on environmental assessment for M, I, and C, with limited evaluations for E. Case studies targeting the entire MICE sector in Japan are lacking. Existing studies are evaluations of some stakeholders of individual MICE events. This study extends the evaluation to include organizers, exhibitors, and participants (domestic and overseas). The aim of this study is to evaluate the transportation and accommodation of the business participants from overseas, as well as food and beverage, souvenirs and shopping, and entertainment and tourism expenses. The environmental load for each MICE-event-related stakeholder is also determined.

2. Materials and Methods

2.1. System Boundaries

JTA reported the economic size of the domestic MICE sector. The target of this report was M, I, C, and E events held in Japan. Each event is defined as follows:
(1)
M: The number of participants is 10 or more, use of external facilities (hotels, MICE facilities, etc.), held for more than four hours, and including overseas participants;
(2)
I: Ten or more participants, use of external facilities (hotels, MICE facilities, factories, tourist facilities, etc.), held for more than four hours, and participants arrive from overseas for events in Japan;
(3)
C-ICCA: A standard international conference per the International Congress and Convention Association (ICCA), an international conference that rotates through more than three countries, the number of participants is 50 or more, and held regularly;
(4)
C-JNTO: A standard international conference per the Japan National Tourism Organization (JNTO). International organizations (including branch offices in each country), or national organizations and domestic organizations (not including private companies) with more than 50 participants is 50, participants from more than three countries including Japan, and held for a period of one day or more; and
(5)
E: Among domestic exhibition events, the ratio of overseas participants and exhibitors is high, an event certified as an international exhibition.
Table 1 shows the system boundaries of this study. The stakeholders included organizers, exhibitors, and participants. Itsubo et al. [33] included the venue as a stakeholder within the system boundaries. In this study, items related to the venue were included in each item. For example, part of the venue usage in M and I were included in planning and management. The cost of using electricity, gas, and water was included in this item. Decoration and construction, equipment rental, and extraordinary personnel required for preparation at the venue were also included, as were shipping, printing, promotion, and advertisement necessary for preparation. Transportation (international transport (flight) and domestic transport (flight, train, bus, taxi, gasoline etc.)), accommodation, and food and beverages were included in all stakeholders. Also included were souvenirs, shopping costs, and tourism and entertainment costs that participants would pay for their stay at the destination. Participants were separated into domestic and overseas. The existing studies did not include participants’ food and beverages or organizer planning costs and did not divide the participants into domestic and overseas. We included these factors in our study.
Table 2 shows the results of consumption amounts for organizers, exhibitors, domestic participants, and overseas participants [37,38]. The scope of evaluation in this study is shown in Table 2. More details concerning consumption are listed in Appendix A, Table A1. The amount of consumption in M occurred in the following order: accommodation, domestic transport, food and beverages, planning and management of meetings and events, and parties paid for by the organizer. Souvenirs and shopping and food and beverages by overseas participants also contributed. The amount of consumption in I was in the following order: international transport, accommodation, domestic transport, food and beverages that the organizer paid for. Souvenirs and shopping, food and beverages, and entertainment and tourism paid for by overseas participants also contributed. The organizer paid for international transportation for the participants of M and I. We assumed that participants did not pay for these items. The amount of consumption in C-ICCA occurred in the following order: conference decoration and construction paid for by organizer; conference decoration and construction, equipment rental, promotion and advertisement paid for by exhibitors; international flights paid for by overseas participants; and accommodation. C-JNTO consumed the following in large amounts: conference decoration and construction; venue usage by organizer; accommodation and train transport, paid for by domestic participants; and international flights, paid for by overseas participants. The amount of consumption in E occurred in the following order: parties, such as post-convention parties held by the organizer; conference decoration and construction paid for by exhibitors; train transport paid for by domestic participants; and international flights and accommodation, paid for by overseas participants.
This survey included non-transport assessments. Extensive research is required to evaluate individual events. However, public statistical data were used here. By using input–output analysis (input-output LCA), which is often used in LCA evaluation, we evaluated the supply chain.
Similar data were applied to domestic participants because only overseas participants’ consumption information was available. According to the Japan Tourism Agency (JTA) report [37,38], domestic participants (DP) did not include participants in the events surveyed. Therefore, OP was information only. In case of C-ICCA and C-JNTO, organizer and exhibitor informations were not available in the JTA report, so the percentage was applied referencing the U.K. report [6].

2.2. CFP Calculation

In this study, the Japanese input–output table was used. The principles of this method are based on the work by Leontief [39] and are often used in the LCA research field. The formula used in this method is:
Environmental loads = d (IA)1 f,
where d is the direct environmental loads and the environmental loads per production value, (IA)1 is the Leontief inverse matrix that can be used to consider the direct and indirect economic ripple effects caused by the consumption of one type of goods, and f is the amount of activity. This method helps to evaluate the entire supply chain.
We calculated the CFP using the input–output LCA. The calculation formula is:
k = 1 5 C F P k = d i ( I A ) 1 f i + D E i   ( i = 1 ,   ,   n ) ,
where di is the direct GHG emission intensity provided for each sector by the Inventory Database for Environmental Analysis version 2 (IDEAv.2), as developed by the National Institute of Advanced Industrial Science and Technology (AIST) [40]; A is the direct input coefficient matrix. We used the 2011 waste input–output table (WIO) developed by Kondo et al. (2019) [41] to provide a broad overview. I is an identity matrix and fi is the amount of activity obtained from the statistics of the JTA [37,38], as detailed previously. Using data focusing on the same year would have been more effective; however, the last waste input–output table available focused only on 2011. DEi is the direct emission from fuel combustion added to the calculation to cover the full cradle-to-grave aspects of products and services; k indicates the number of event categories to be evaluated, which was M, I, C, and E in this study. Using this equation, the calculation was extended from cradle-to-gate to cradle-to-grave. Using these calculations, Kitamura et al. [42] calculated CFP for tourism in Japan. Based on this result, we compiled a list of GHG emissions of tourism products and services (Appendix A, Table A2).
According to the JTA’s report, the total consumption in Japan’s MICE sector was about 150.58 billion yen (ICCA standard) and about 323.97 billion yen (JNTO standard) [37,38], because the scale of events differs between the ICCA and the JNTO standards. The detailed consumption amount breakdown is shown in Table A1. These data were summarized using a survey method as follows: M (meeting): a questionnaire survey was administered to agents handling corporate meetings. The consumption amount was estimated from the questionnaires administered to the organizers and participants. We collected 456 responses, and the share of handling agents was 73% (72 samples); I (incentive travel): A survey was administered to agents and participants dealing with rewards and training trips. From this, the consumption amounts of the organizer and participants were estimated. We collected 706 responses, and the share of handling agents was 73% (71 samples); C (conventions per ICCA and JNTO standards): The number of events covered by the survey was 429 (2016) by the ICCA standard and 3114 events (2016) by the JNTO standard [43]. Samples were collected by administering an interview-type questionnaire survey for participants, an oral questionnaire for organizers, a fill-in questionnaire survey for industry groups, and a mailed questionnaire survey for exhibitors. For the participants, we administered an interview-type questionnaire at the international conference (17 events) and mailed questionnaire for exhibitors (228 samples). After conducting the interview-type questionnaire survey, the collected samples were analyzed and the consumption amount per participant was calculated; E (exhibition and event): At exhibitions and events, the total consumption was estimated by calculating the amounts of consumption by the organizer, exhibitors, and participants. We collected 39 responses.
However, some information was missing. Therefore, we chose to supplement our data with data from similar countries. First, we confirmed the economic scale of the MICE sector. Direct spending rankings in the top 50 countries in the business event sector [44] showed that Japan has a similar economic scale to the U.K. [6] compared to other countries. Then, based on these U.K. data, the breakdown of direct spending by the organizer and exhibitor was checked against the JTA data. Part of the data were aggregated and totaled. For the exhibitor information, we paid attention to floor space rental. According to the JTA report, floor space rental is the organizer’s income, and the organizer spends more than the budget including it, so it was not counted to avoid double counting. Table A3 shows how the coefficients were applied to consumption and expenditure items.

3. Results

3.1. CFP of MICE

The calculation results of CFP are shown here. Figure 1 shows the CFP in each category. Total emissions were 804.8 t-CO2eq (M, I, C-ICCA, and E) and 1714.4 t-CO2eq (M, I, C-JNTO, and E). In the case of Figure 1a, transportation (Transp, 56.0%) contributed the most, followed by planning and preparation (Plan, 13.2%), and accommodation (Acc, 12.0%), souvenirs, shopping, entertainment and sightseeing (SE, 10.1%), and food and beverages (FB, 7.9%). In the case of Figure 1b, transportation (Transp, 54.3%) contributed the most, followed by planning and preparation (Plan, 14.3%) and accommodation (Acc, 12.9%), food and beverages (FB, 9.2%), and souvenirs, shopping, entertainment and sightseeing (SE, 8.2%). In both cases, (Figure 1a,b), Transp contributed the most, followed by Plan and Acc. In Figure 1a,b, the highest contribution of Transp in all categories occurred due to the volume of evaluated events. From this result, the CFP of the MICE sector is produced not only by transportation but also planning and preparation, accommodation, food and beverages, and souvenirs.
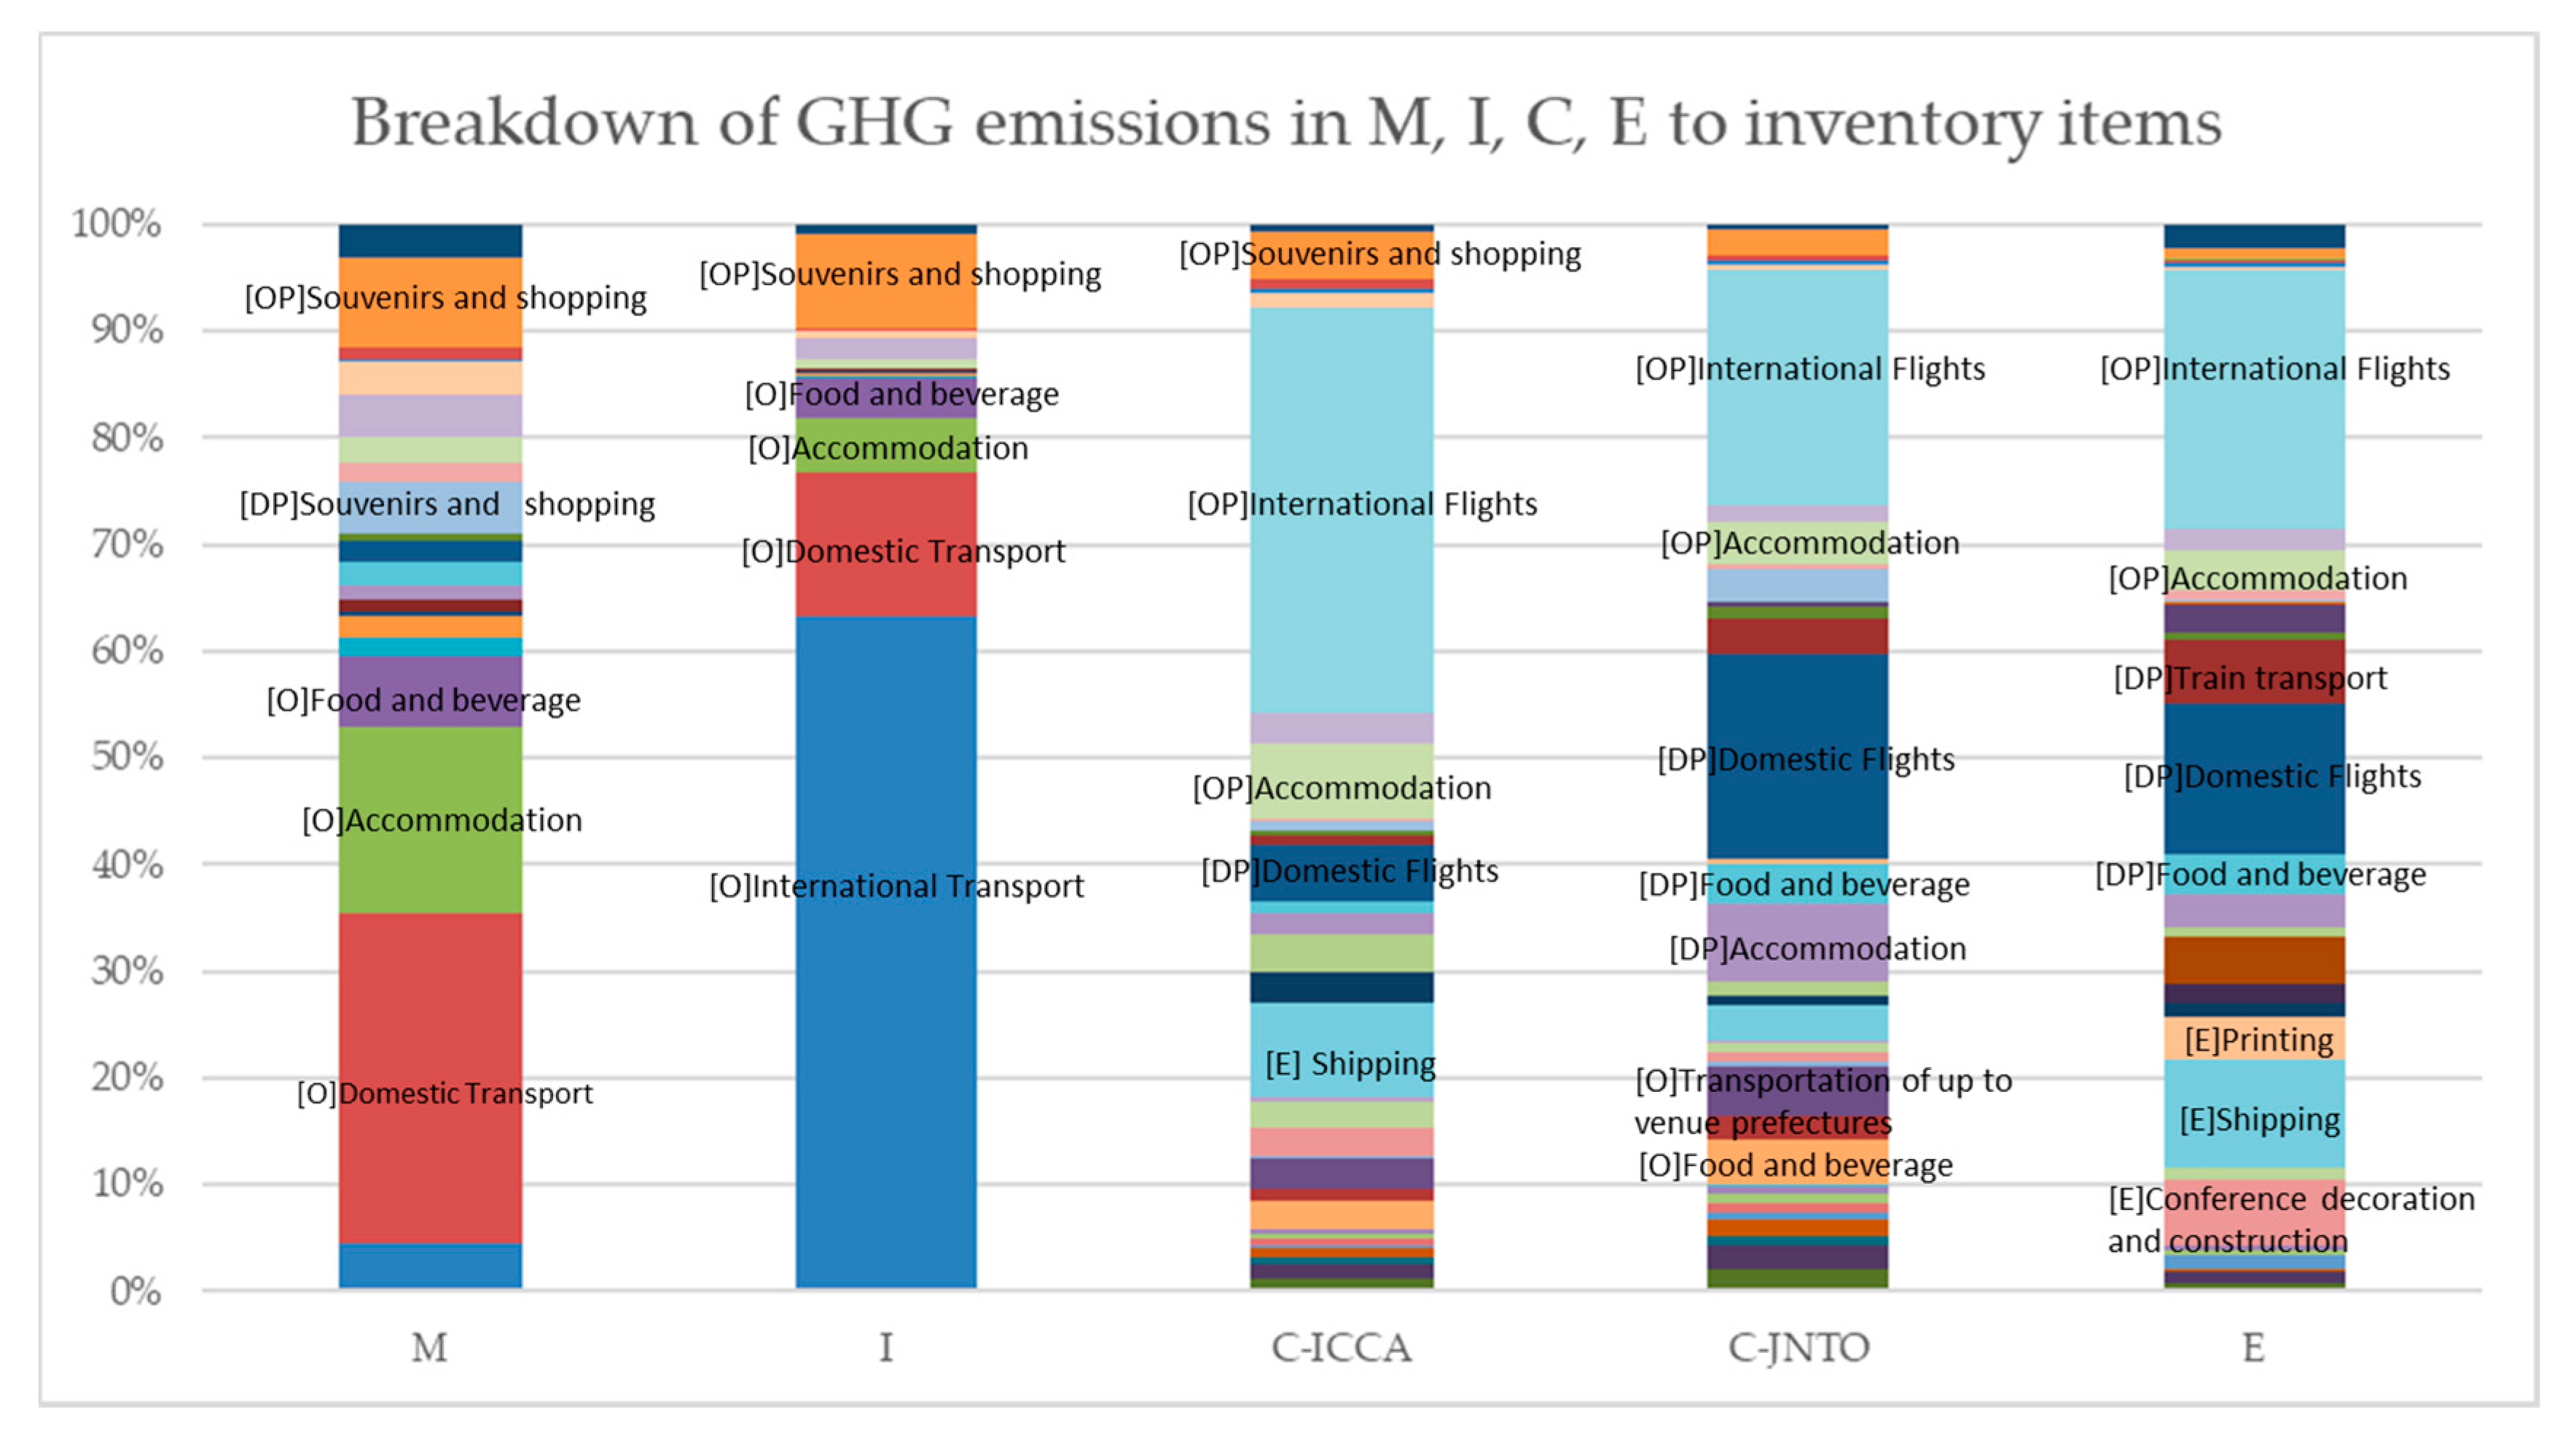
Figure 2 provides the breakdown of each M, I, C, E event by inventory item. The top five items with the highest contribution are arranged in order (Table 3). In M, contributions were provided in the following order: (organizer: O) domestic transport (including flight, train, bus, taxi, gasoline, etc.); (O) accommodation, (overseas participants: OP) souvenirs and shopping; (O) food and beverages; and (domestic participants: DP) souvenirs and shopping. In I, contributions were made in the following order: (O) international transport (including only flight), (O) domestic transport, (OP) souvenirs and shopping, (O) accommodation, and (O) food and beverages. In C-ICCA, contributions were made in the following order: (OP) international flights, (Exhibitor: E) shipping, (OP) accommodation, (DP) domestic flights, and (OP) souvenirs and shopping. In C-JNTO, contributions were made in the following order: (OP) international flights, (DP) domestic flights, (DP) accommodation, (O) transportation to venue, and (O) food and beverages. In E, contributions were made in the following order: (OP) international flights, (DP) domestic flights, (E) shipping, (E) conference decoration and construction, and (DP) train. The detailed consumption items and the CFP are listed in Table A4.

3.2. Meeting

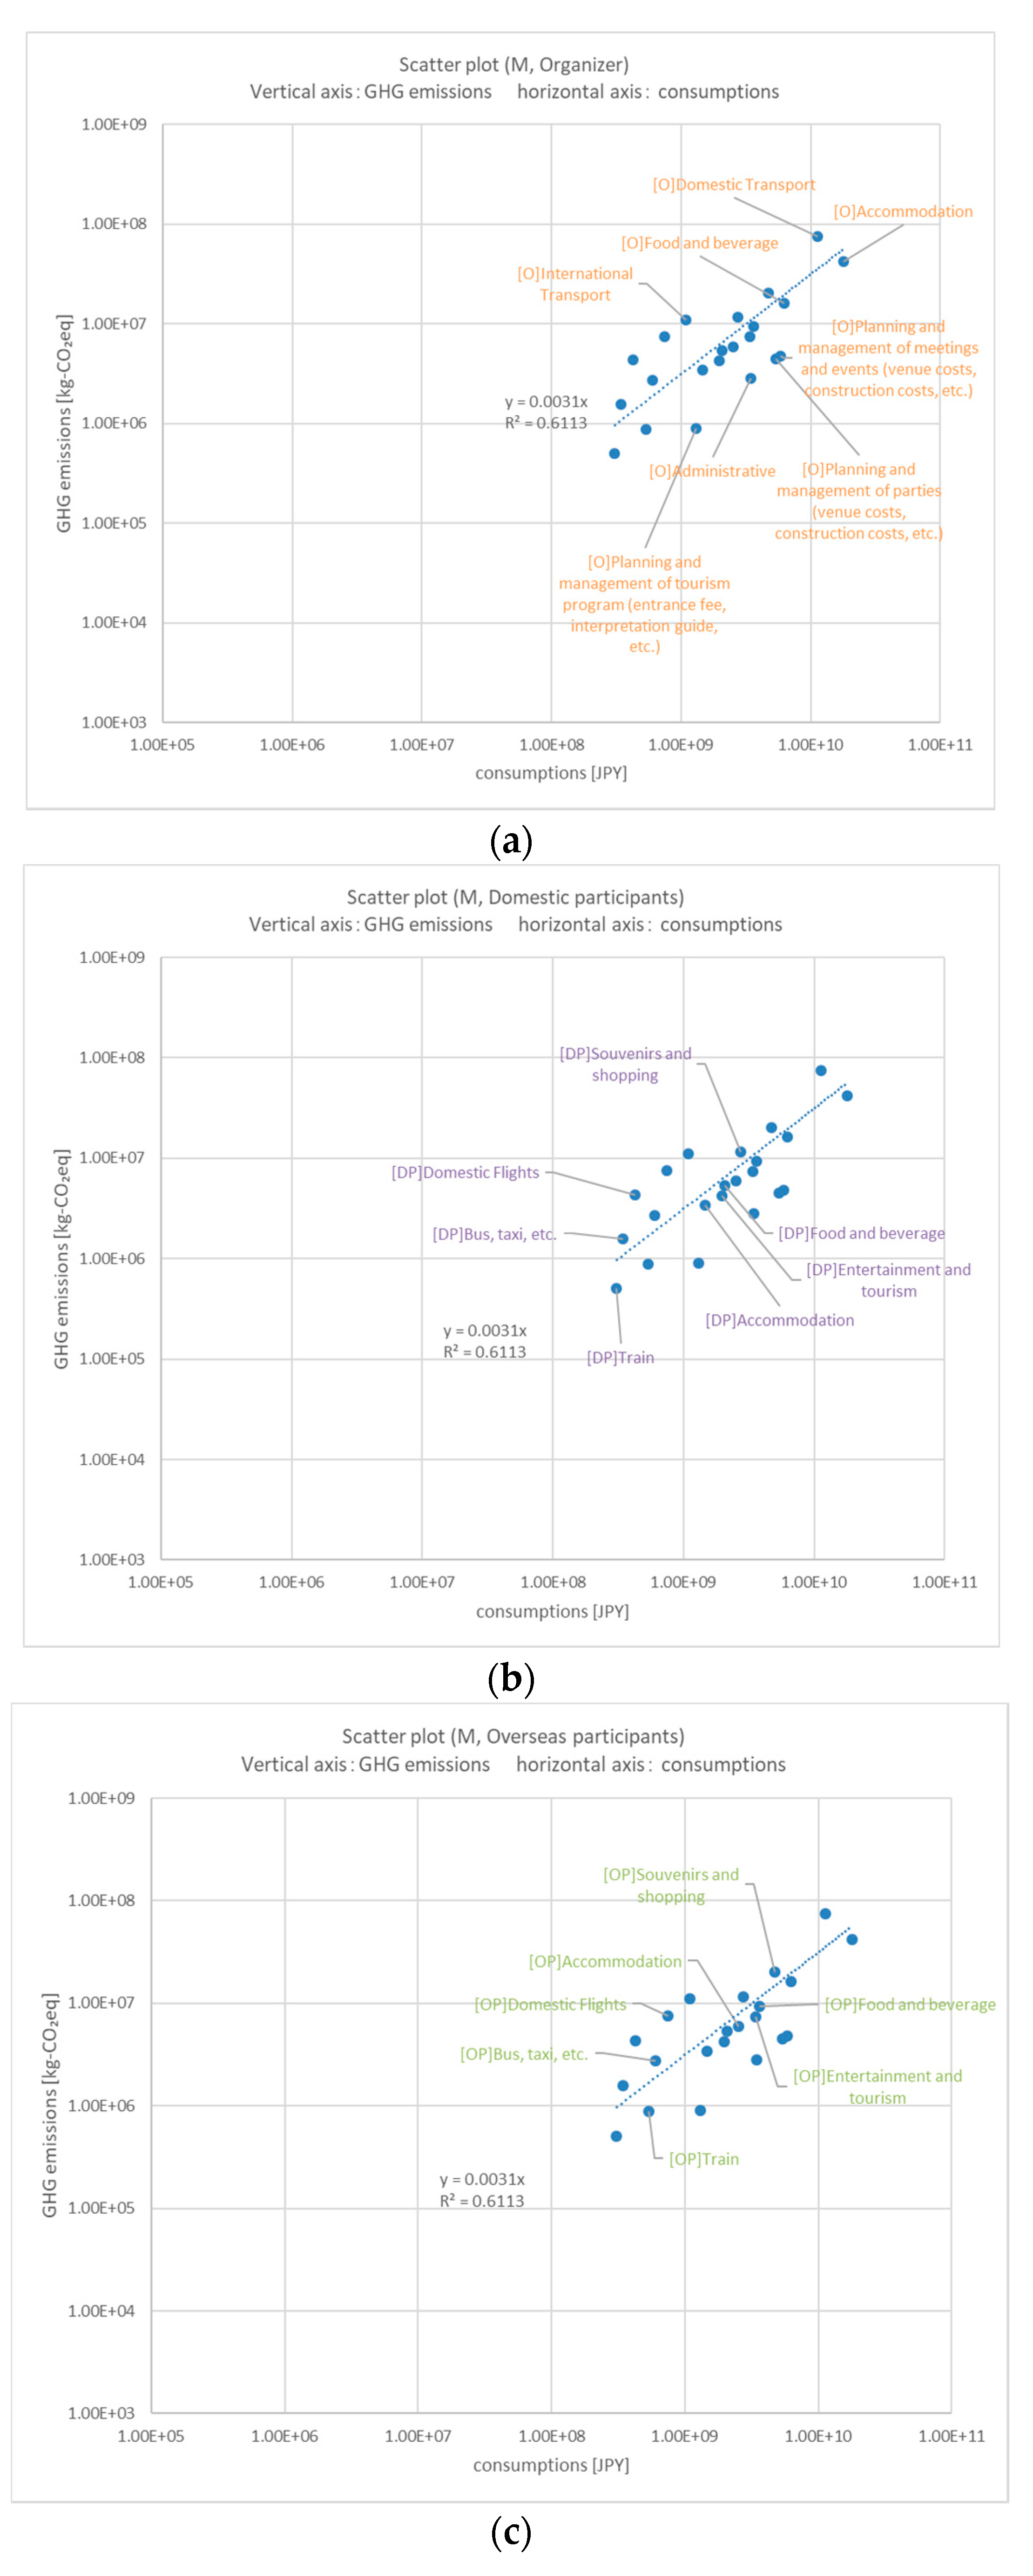
Figure 3 shows the relationship between the CFP (kg CO2 eq) and consumption amount (JPY) for each inventory item by group (organizer/participants) in Meeting (M). The right side of the horizontal axis shows the amount it contributes to the consumption. Similarly, the higher the point on the vertical axis, the greater the amount contributed to the CFP. According to these results (Figure 3a), the contribution by the organizers to transportation, accommodation, and food and beverage is large. Both domestic and overseas participants make a large contribution to souvenirs and shopping, food and beverages, and transportation (Figure 3b,c). Compared to other MICE events, the domestic transport of organizers, accommodation, and food and beverages are characteristic.

3.3. Incentive Travel

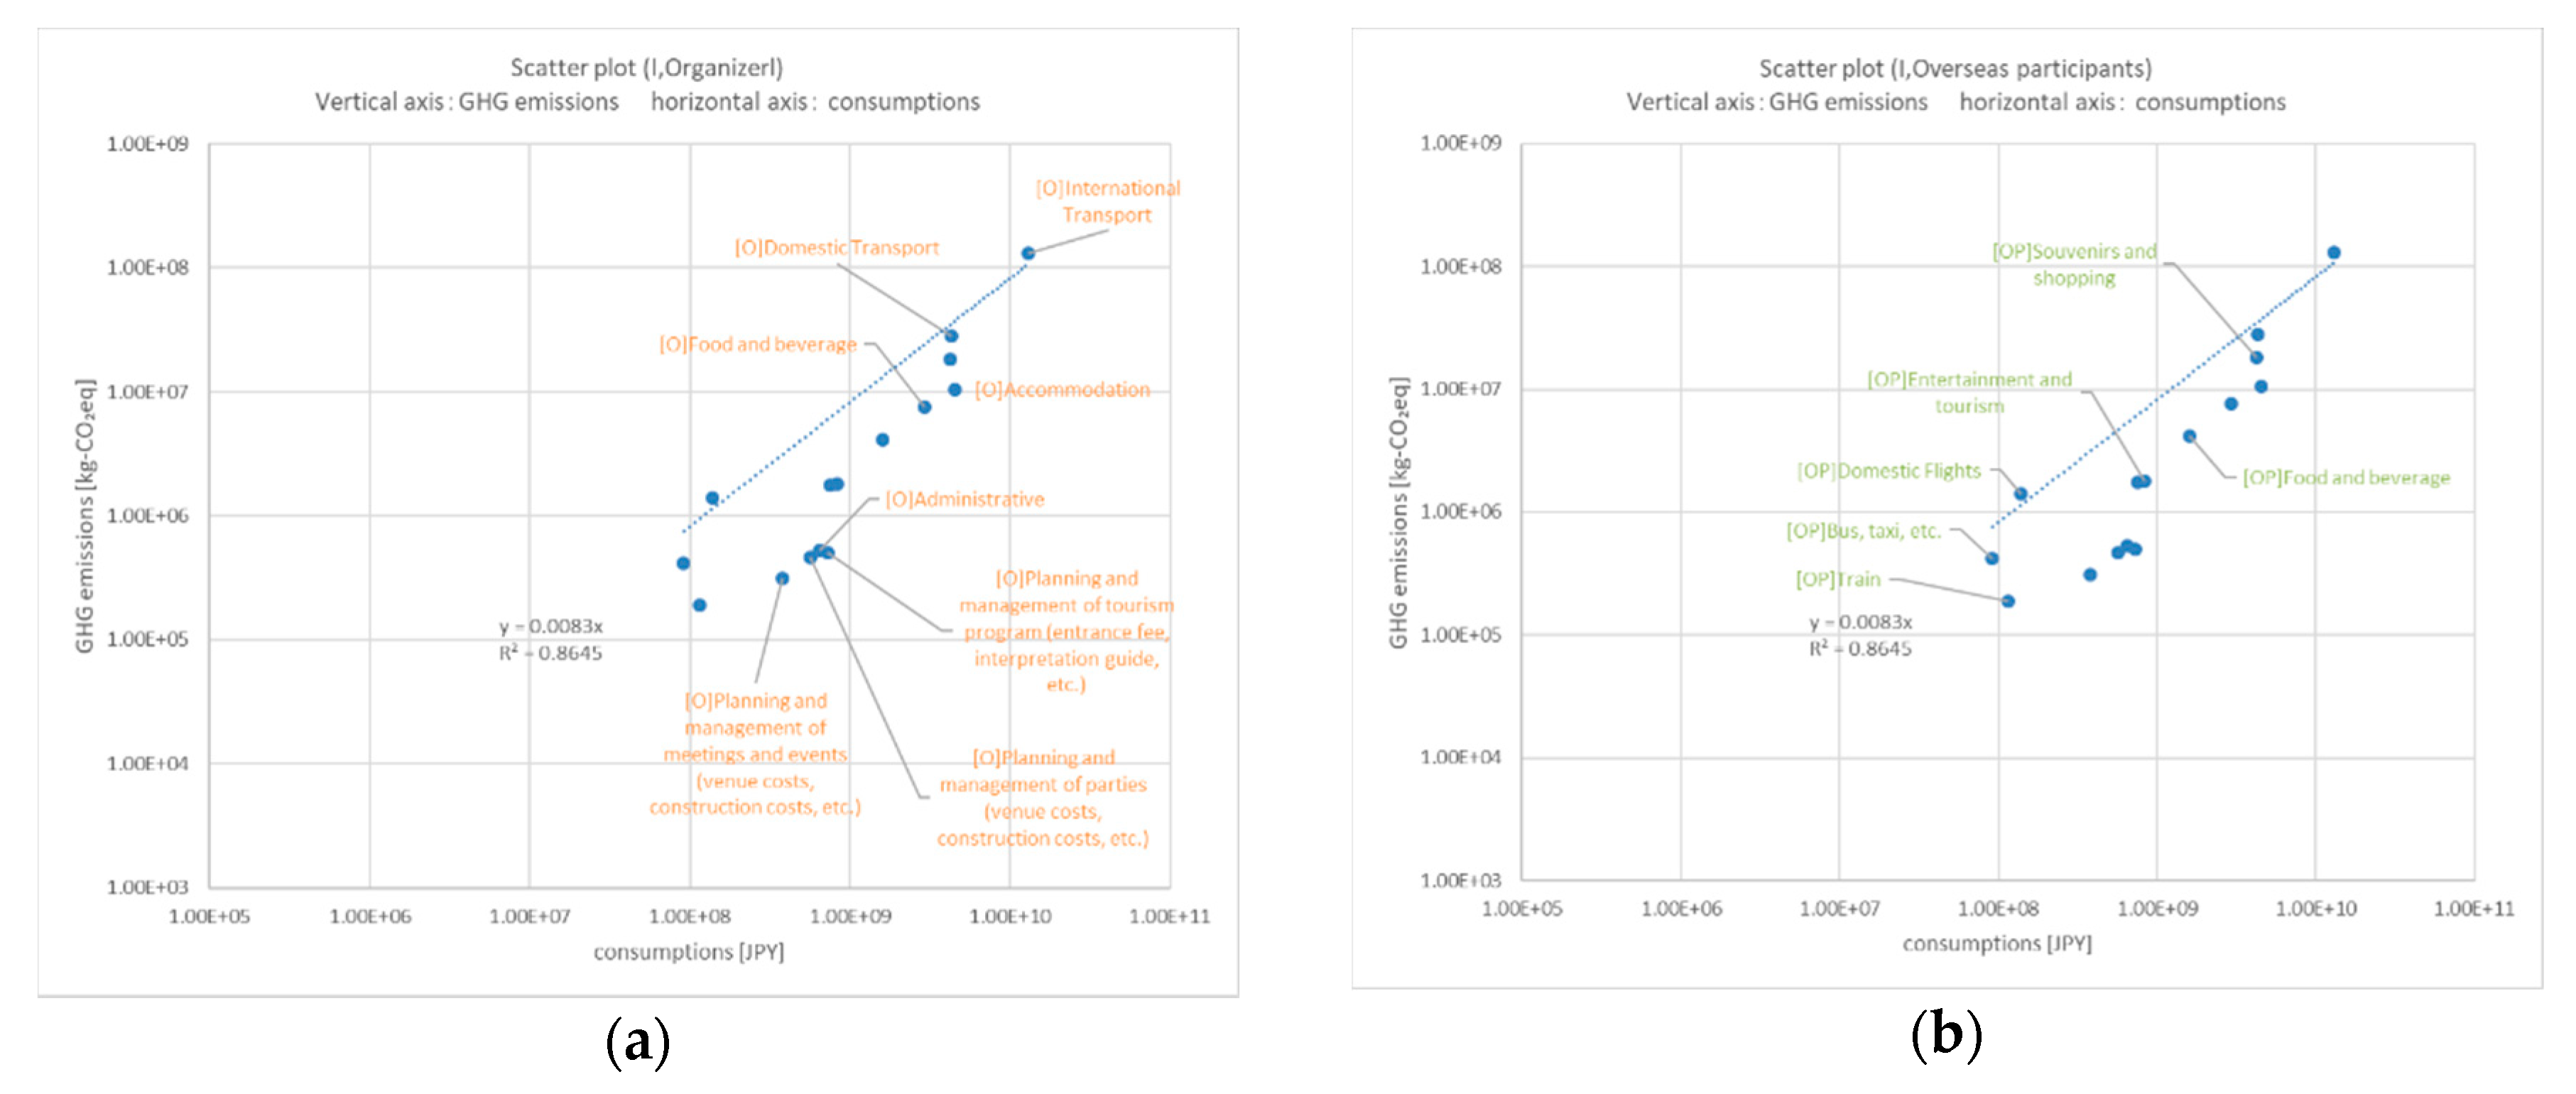
Figure 4 shows the relationship between the CFP (kg CO2 eq) and consumption amount (JPY) for each inventory item by group (organizer/overseas participant) in incentive travel (I). According to these results (Figure 4a), the organizers largely contribute to transportation. Overseas participants provide a large contribution to transportation, souvenirs and shopping, and food and beverages (Figure 4b). The slope of the regression line is large compared to the other MICE events. This is produced by the international transport of organizers. However, this is included in most cases due to the organizations’ expenditure on the international transportation of the participants.

3.4. Convention (ICCA Standard)

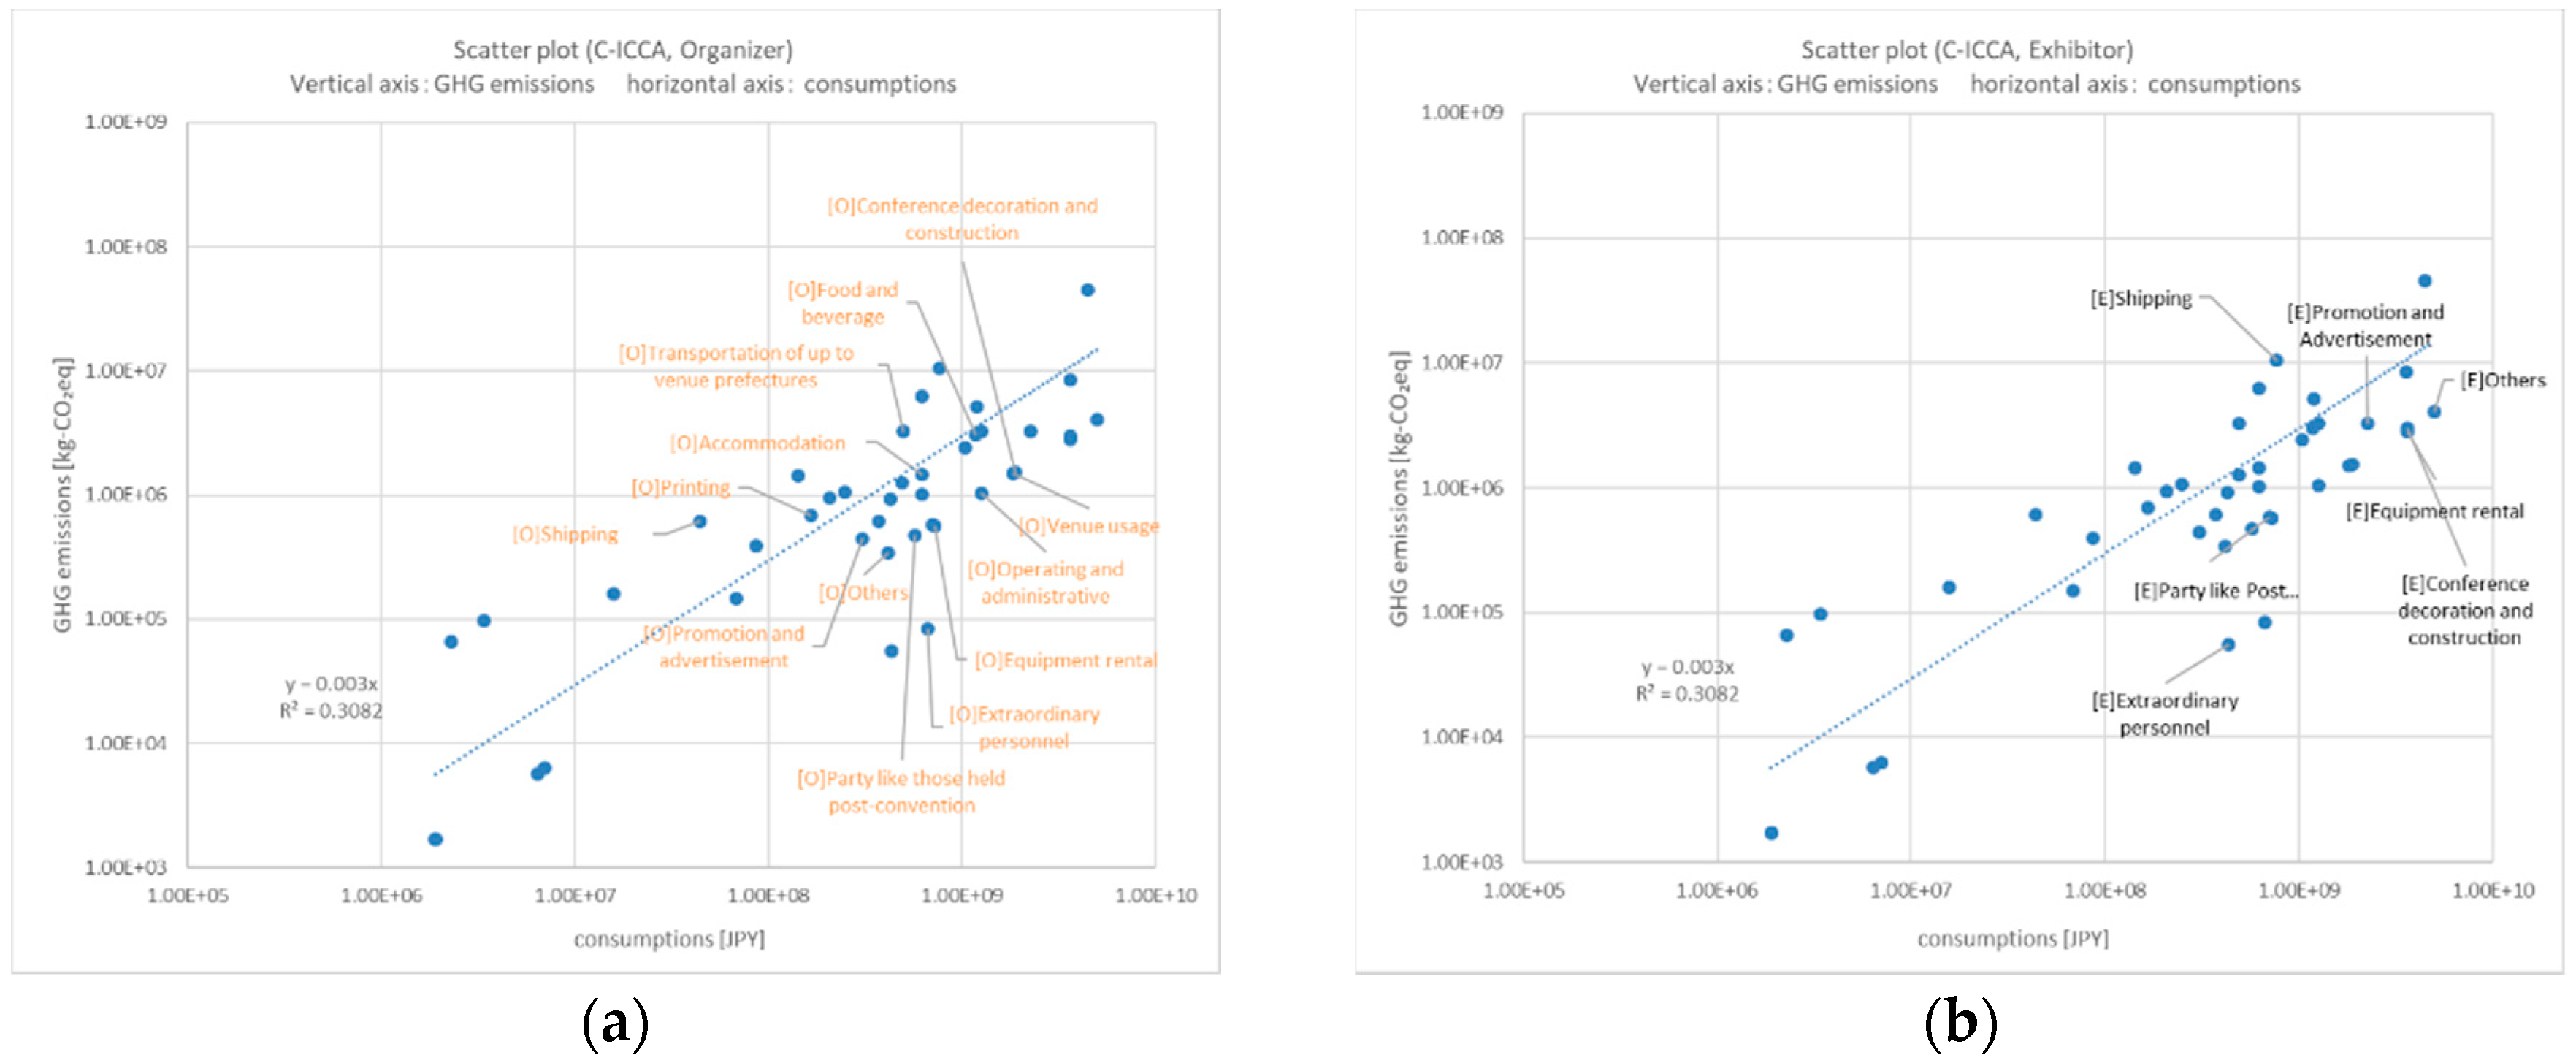
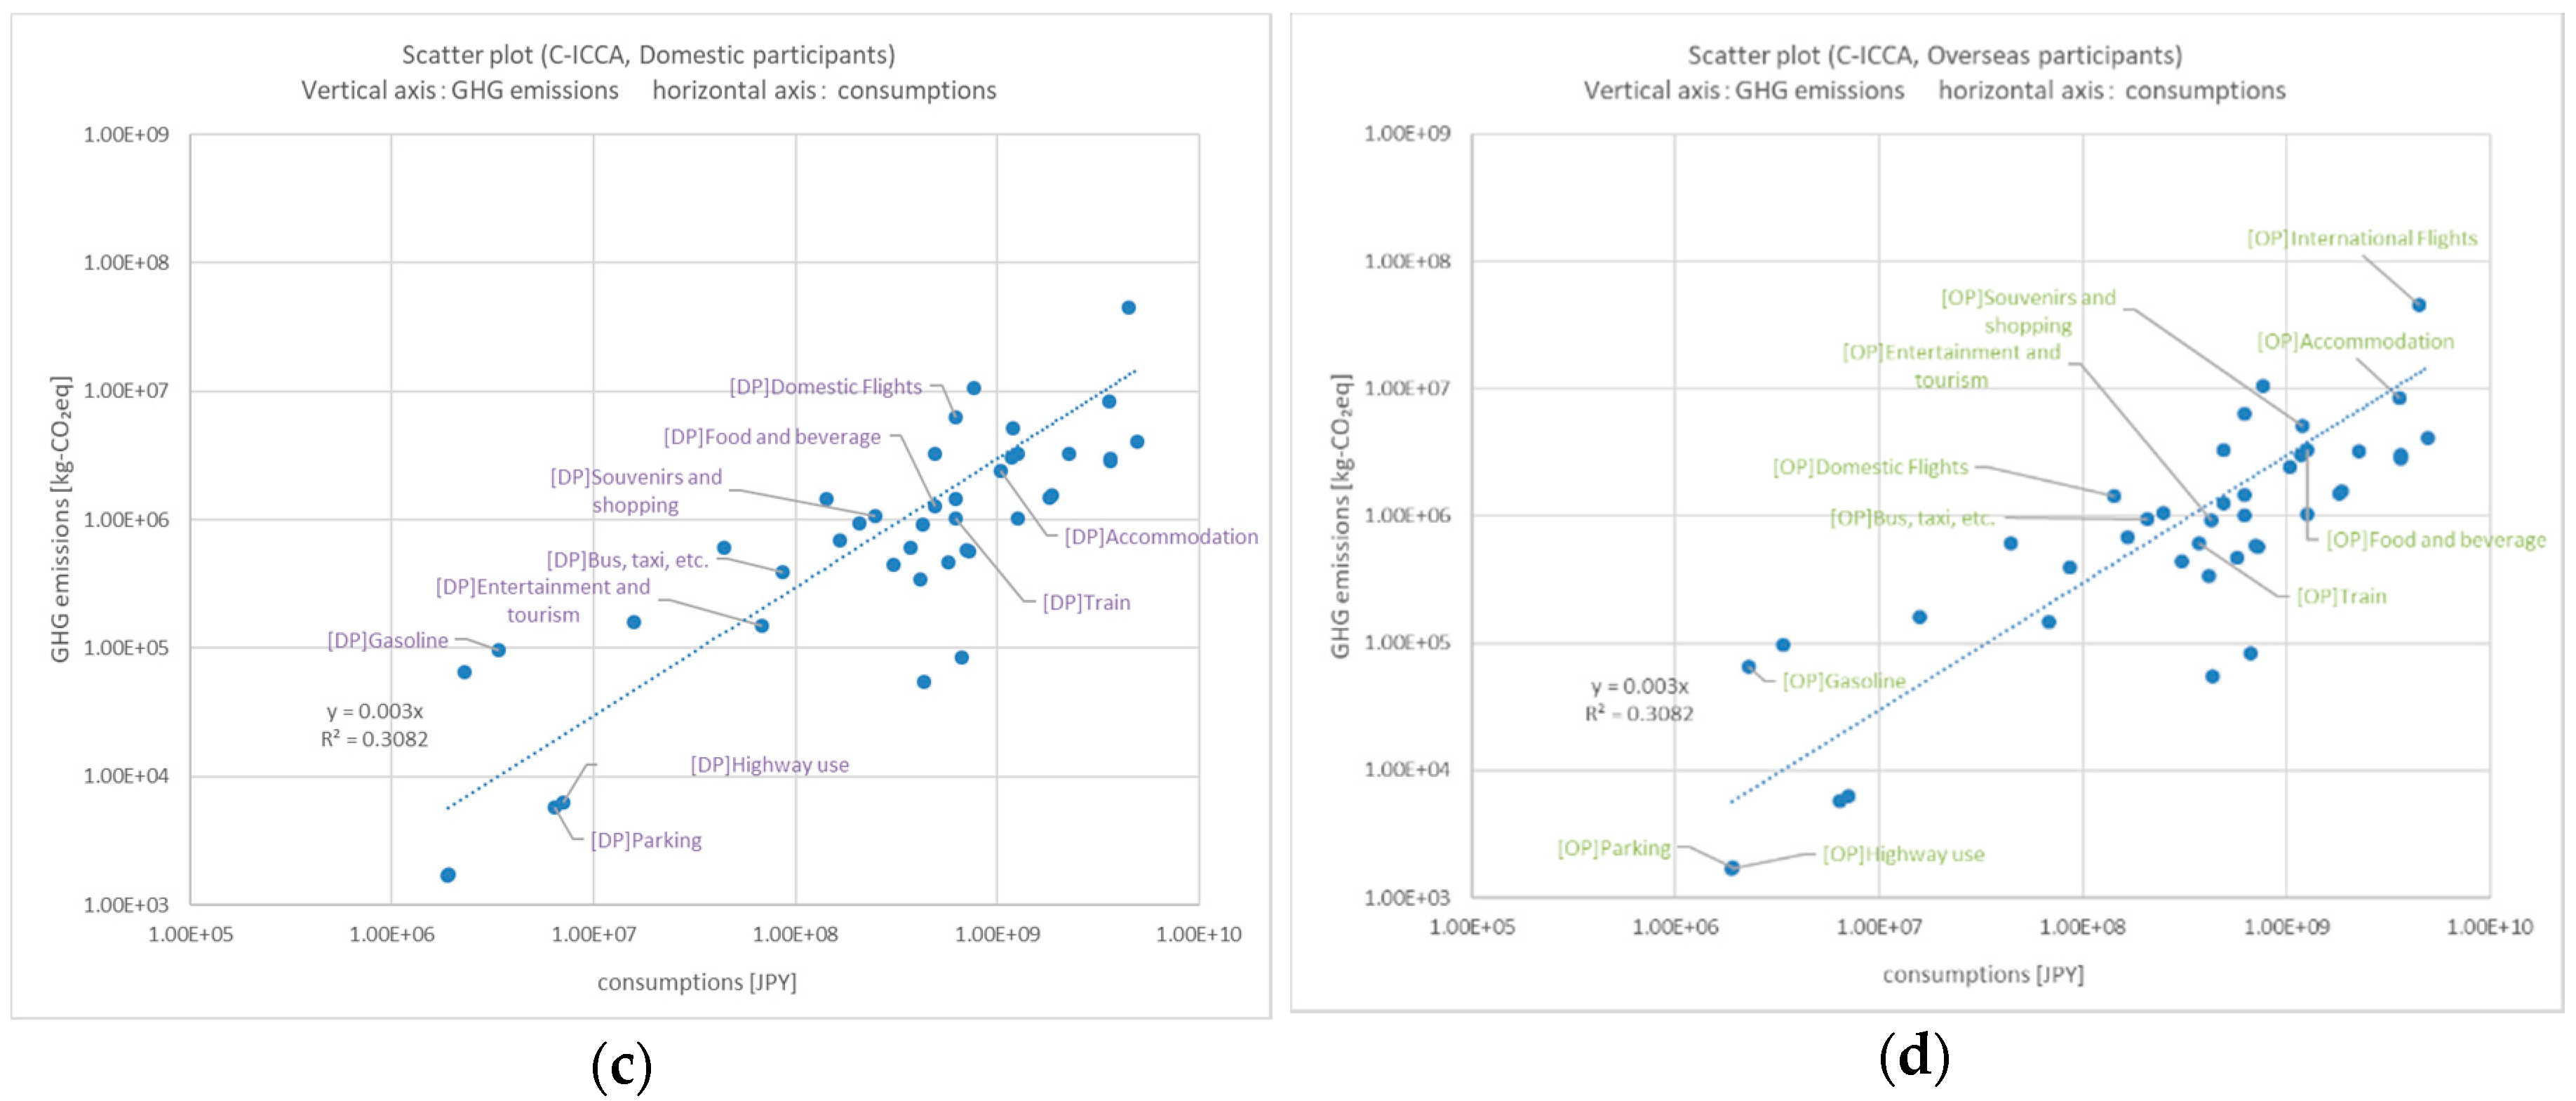
Figure 5 shows the relationship between the CFP (kg CO2 eq) and consumption amount (JPY) for each inventory item by group (organizer/exhibitor) per the ICCA Standard (C). According to these results (Figure 5a), the organizers provide a large contribution to transportation, food and beverages (for participants), accommodation, conference decoration and construction, and venue usage. The exhibitors provide a large contribution to shipping, promotion and advertisement, equipment rental, conference decoration and construction, and others (Figure 5b). Both domestic and overseas participants provide a large contribution to transportation, accommodation, food and beverages, and souvenirs and shopping (Figure 5c,d). Compared to other MICE events, the flights and accommodations of overseas participants and the shipping of exhibitors are the characteristics for this group.

3.5. Conventions (JNTO Standard)

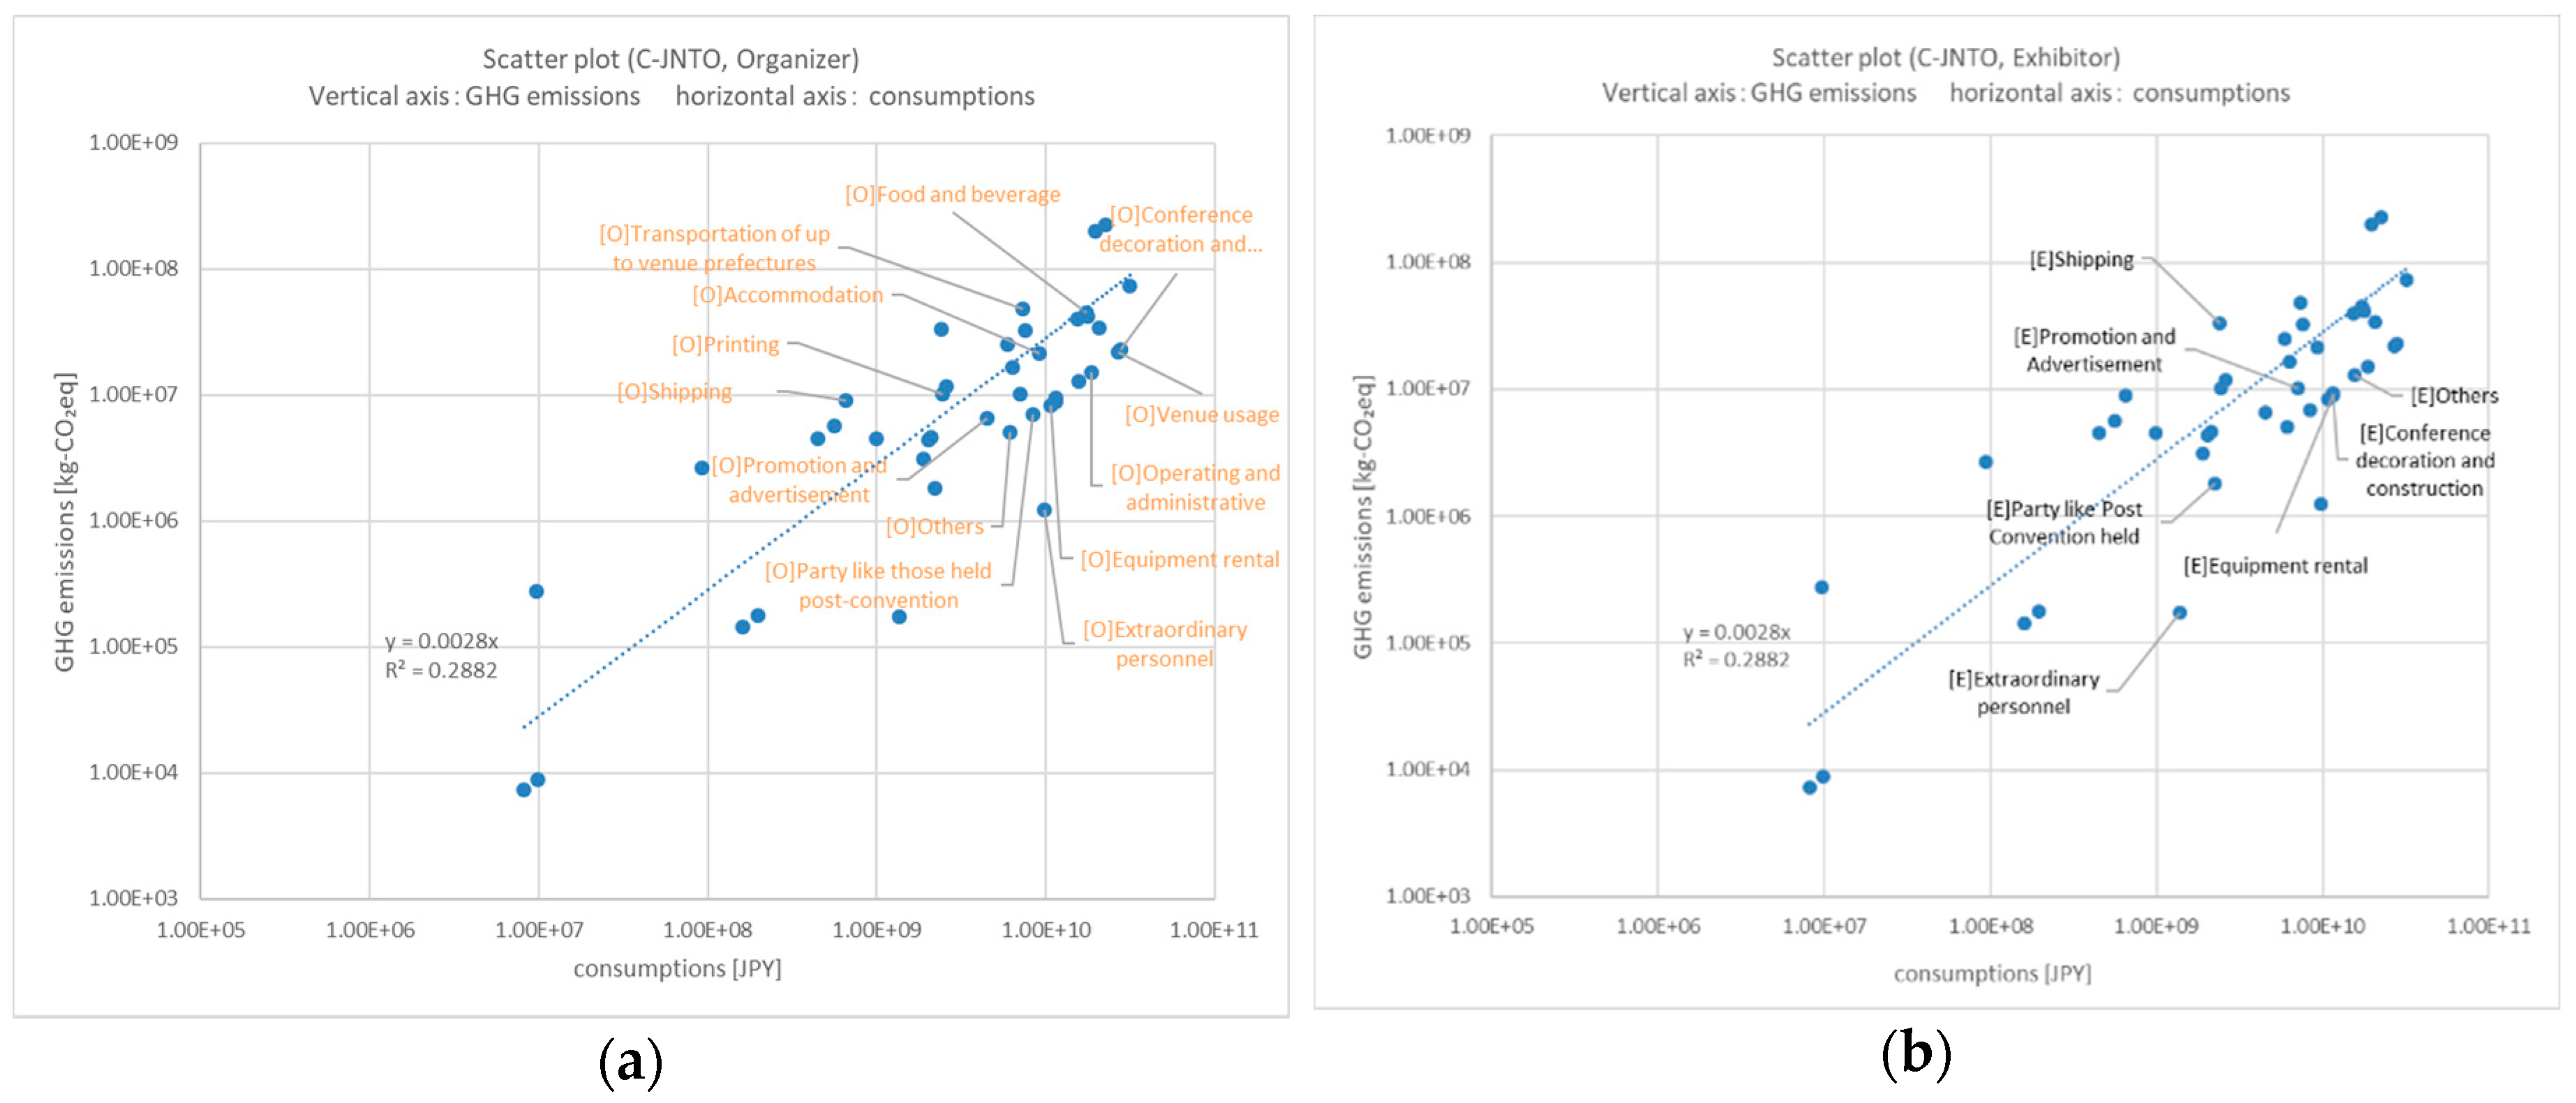
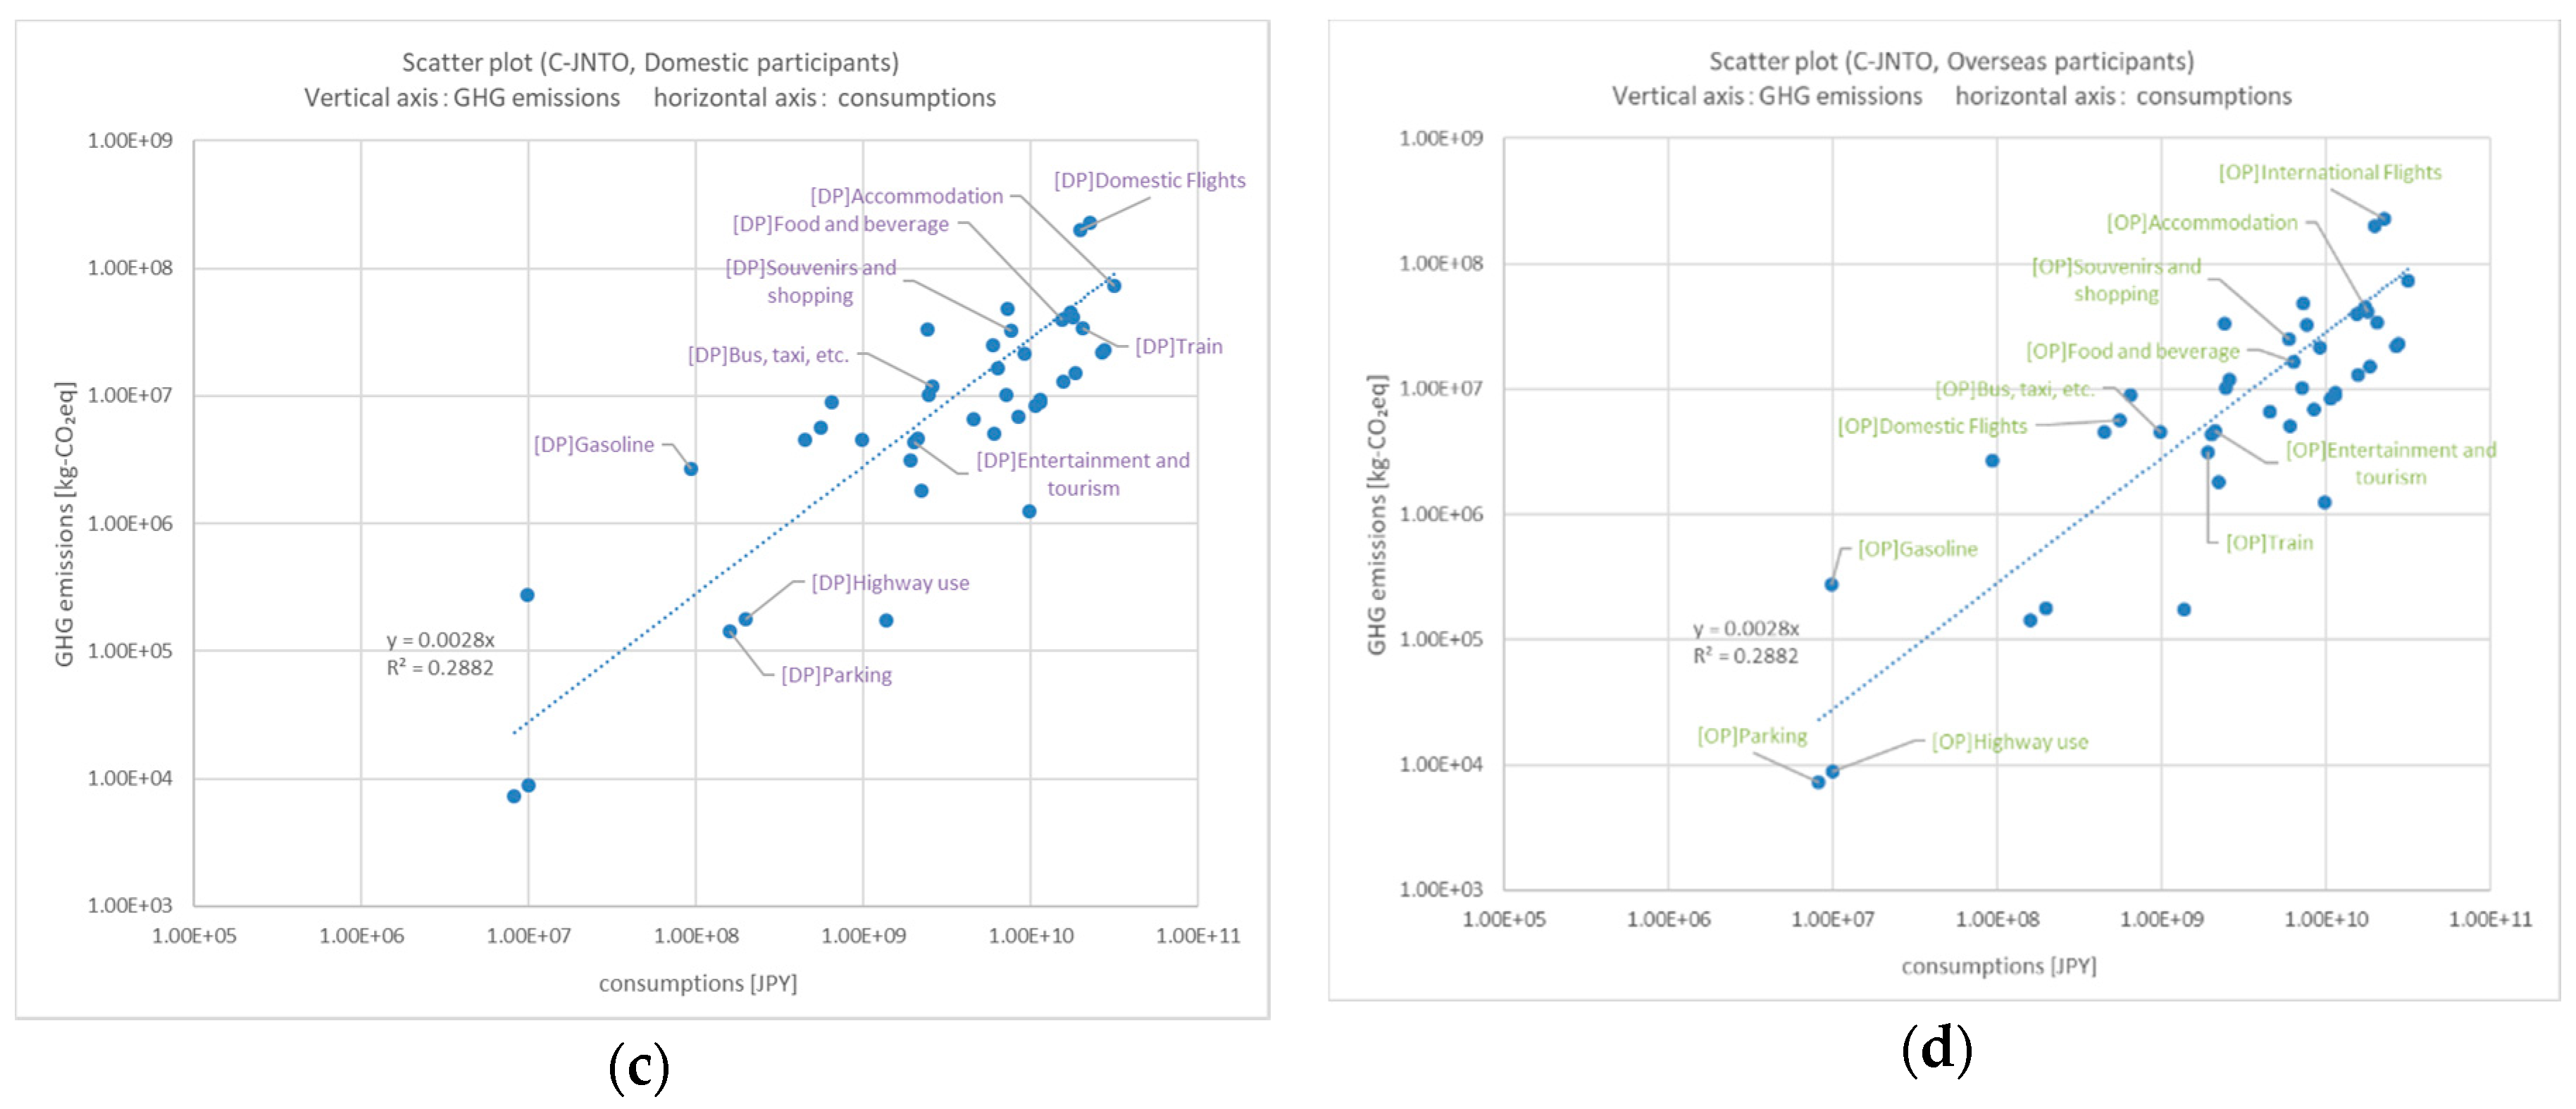
Figure 6 shows the relationship between the CFP (kg CO2 eq) and consumption amount (JPY) for each inventory item by group (organizer/exhibitor) per the JNTO Standard (C). According to these results, the organizers make a large contribution to transportation, accommodation, and food and beverages for participants, conference decoration and construction, and venue usage (Figure 6a). The exhibitors make a large contribution to shipping, promotion and advertisement, equipment rental, conference decoration and construction, and others (Figure 6b). Both domestic and overseas participants largely contribute to transportation, accommodation, food and beverages, and souvenirs and shopping (Figure 6c,d). Compared to other MICE events, the flight, accommodation, and food and beverages of domestic and overseas participants are characteristic of this group.

3.6. Exhibition and Event

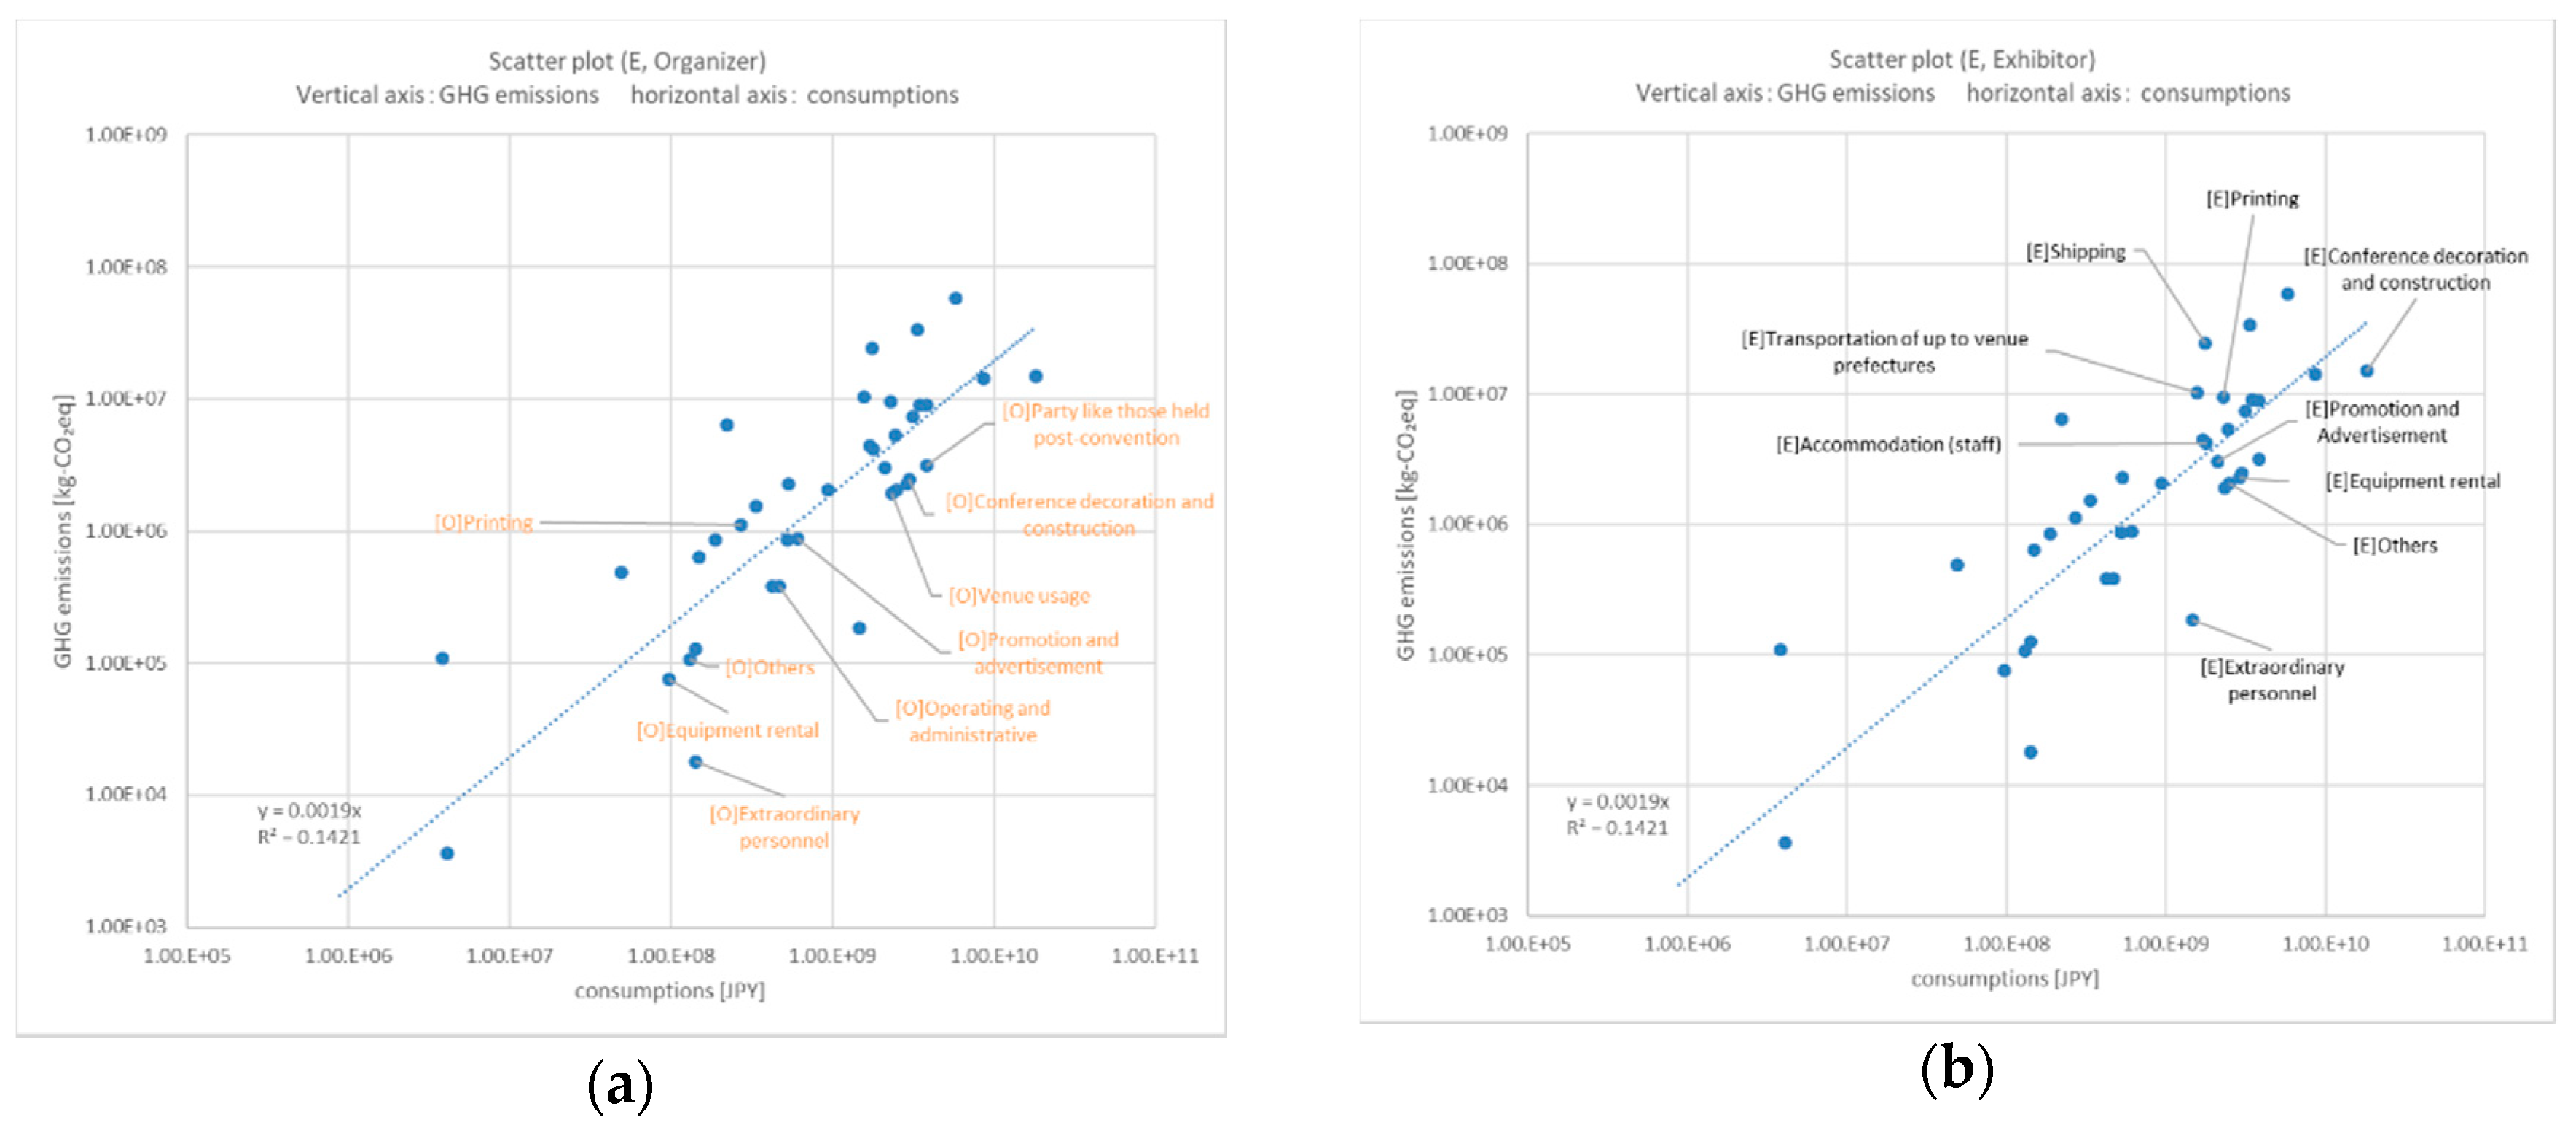
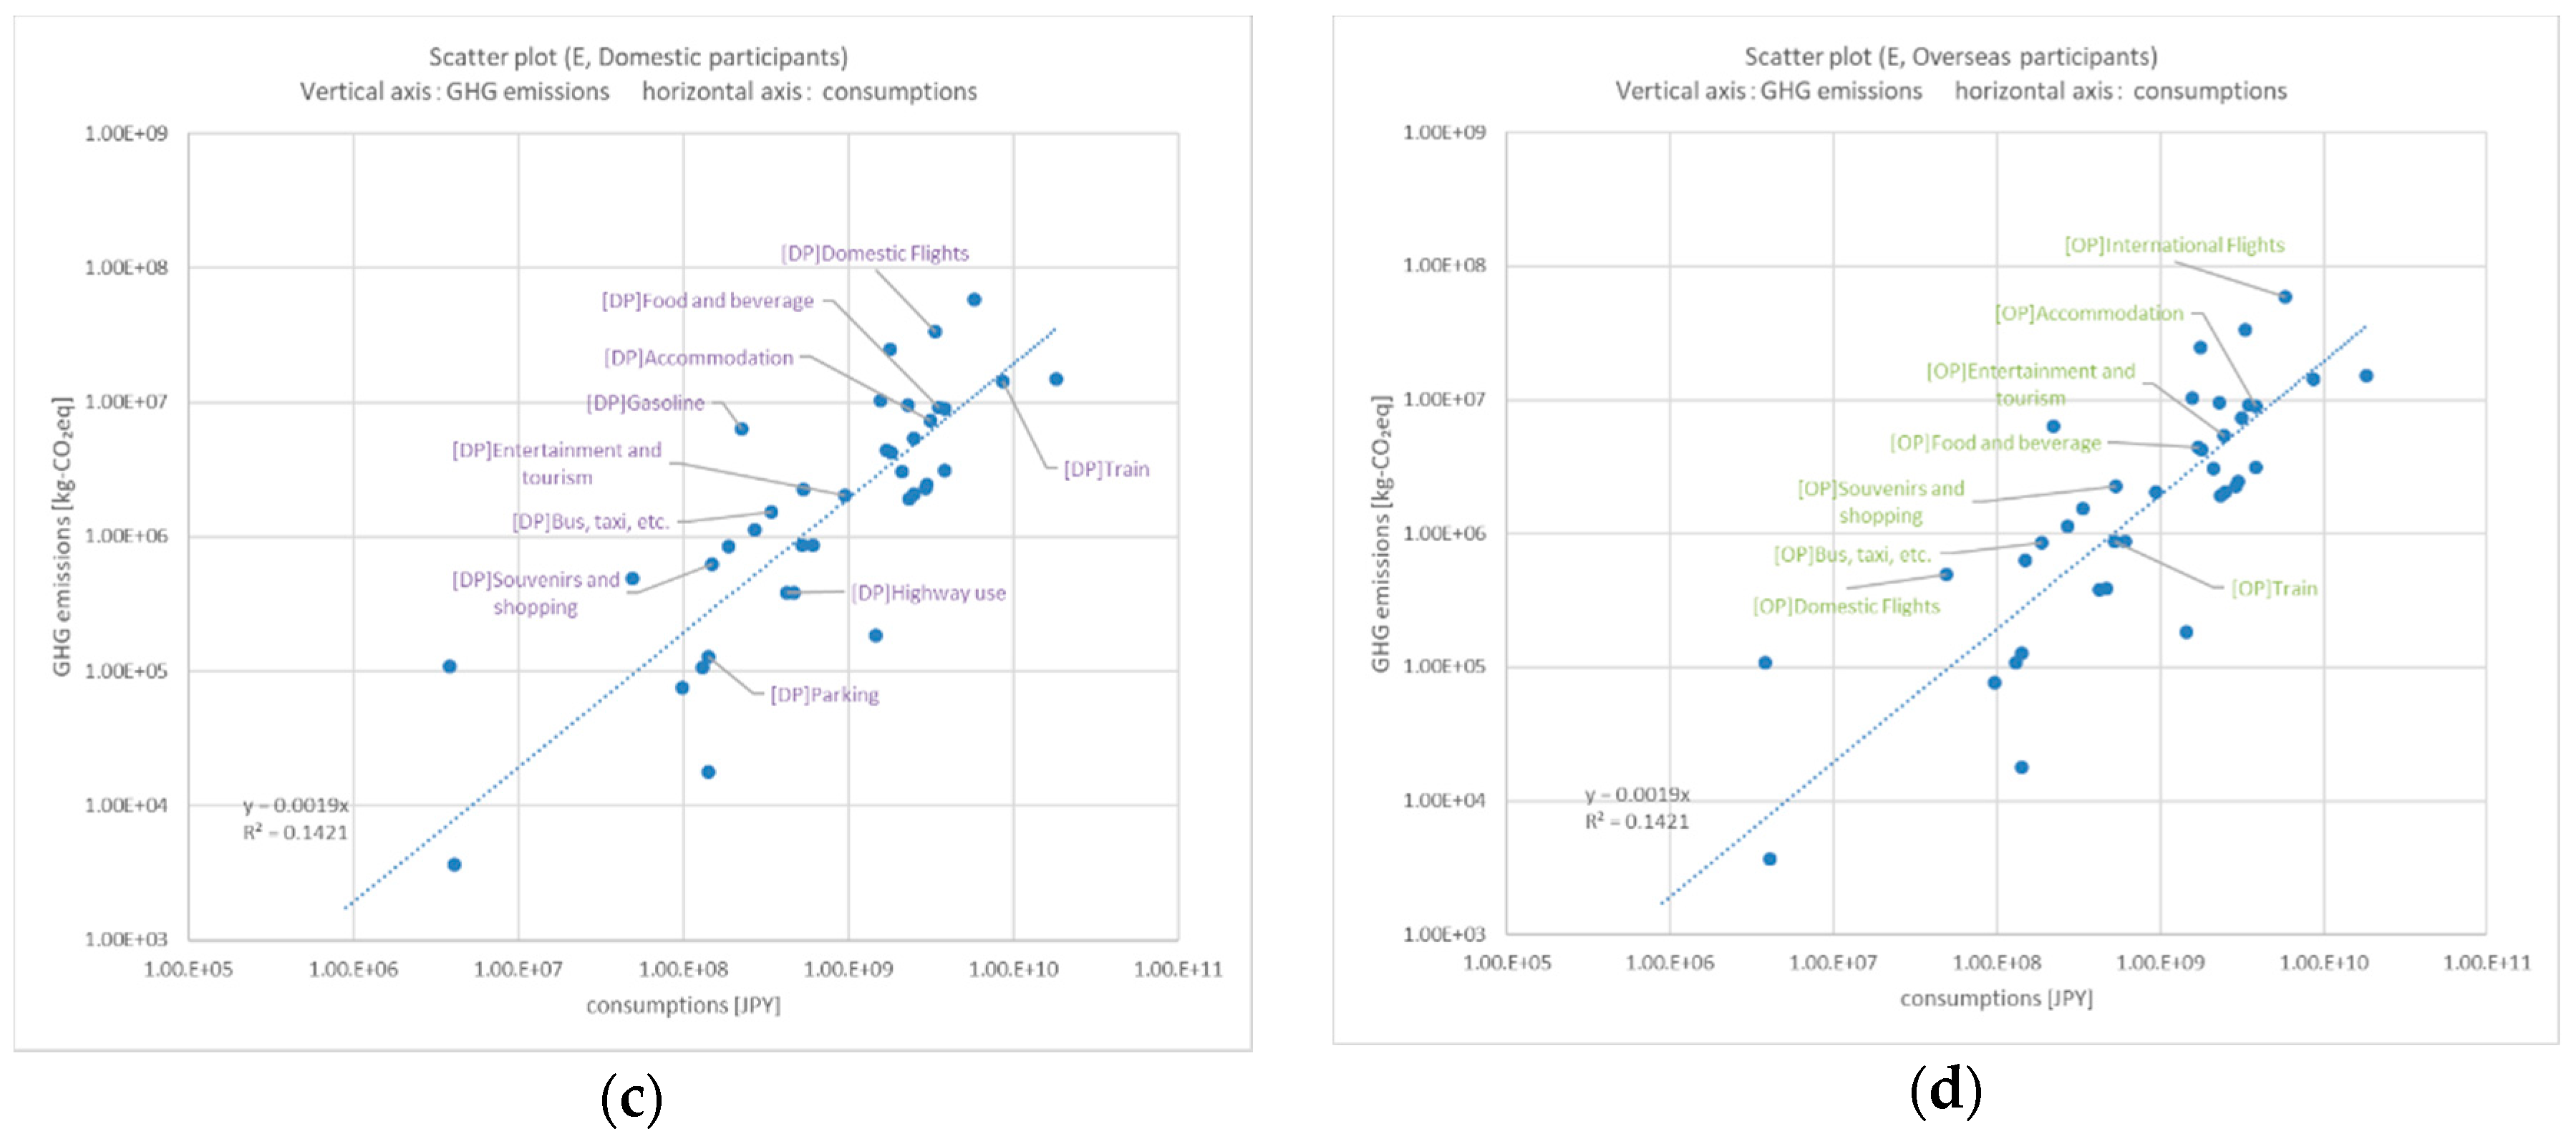
Figure 7 shows the relationship between the CFP (kg CO2 eq) and consumption amount (JPY) for each inventory item by group (organizer/exhibitor) for Exhibitions and Events (E). According to these results, the organizers largely contribute to parties like those held post-convention, conference decoration and construction, venue usage, and printing (Figure 7a). The exhibitors contribute to shipping, conference decoration and construction, transportation, and printing, and domestic participants contribute to transportation, food and beverages, and accommodation (Figure 7b). Domestic participants make a large contribution to transportation, food and beverages, accommodation (Figure 7c). Overseas participants make a large contribution to transportation, accommodation, entertainment and tourism, food and beverages, and souvenirs and shopping (Figure 7d). Compared to other MICE events, the flights, accommodation, and food and beverages of domestic and overseas participants characterize this group, which also includes trains taken by domestic participants, decoration and construction, and shipping paid for by exhibitors.

4. Discussion

4.1. Comparison with Existing Studies

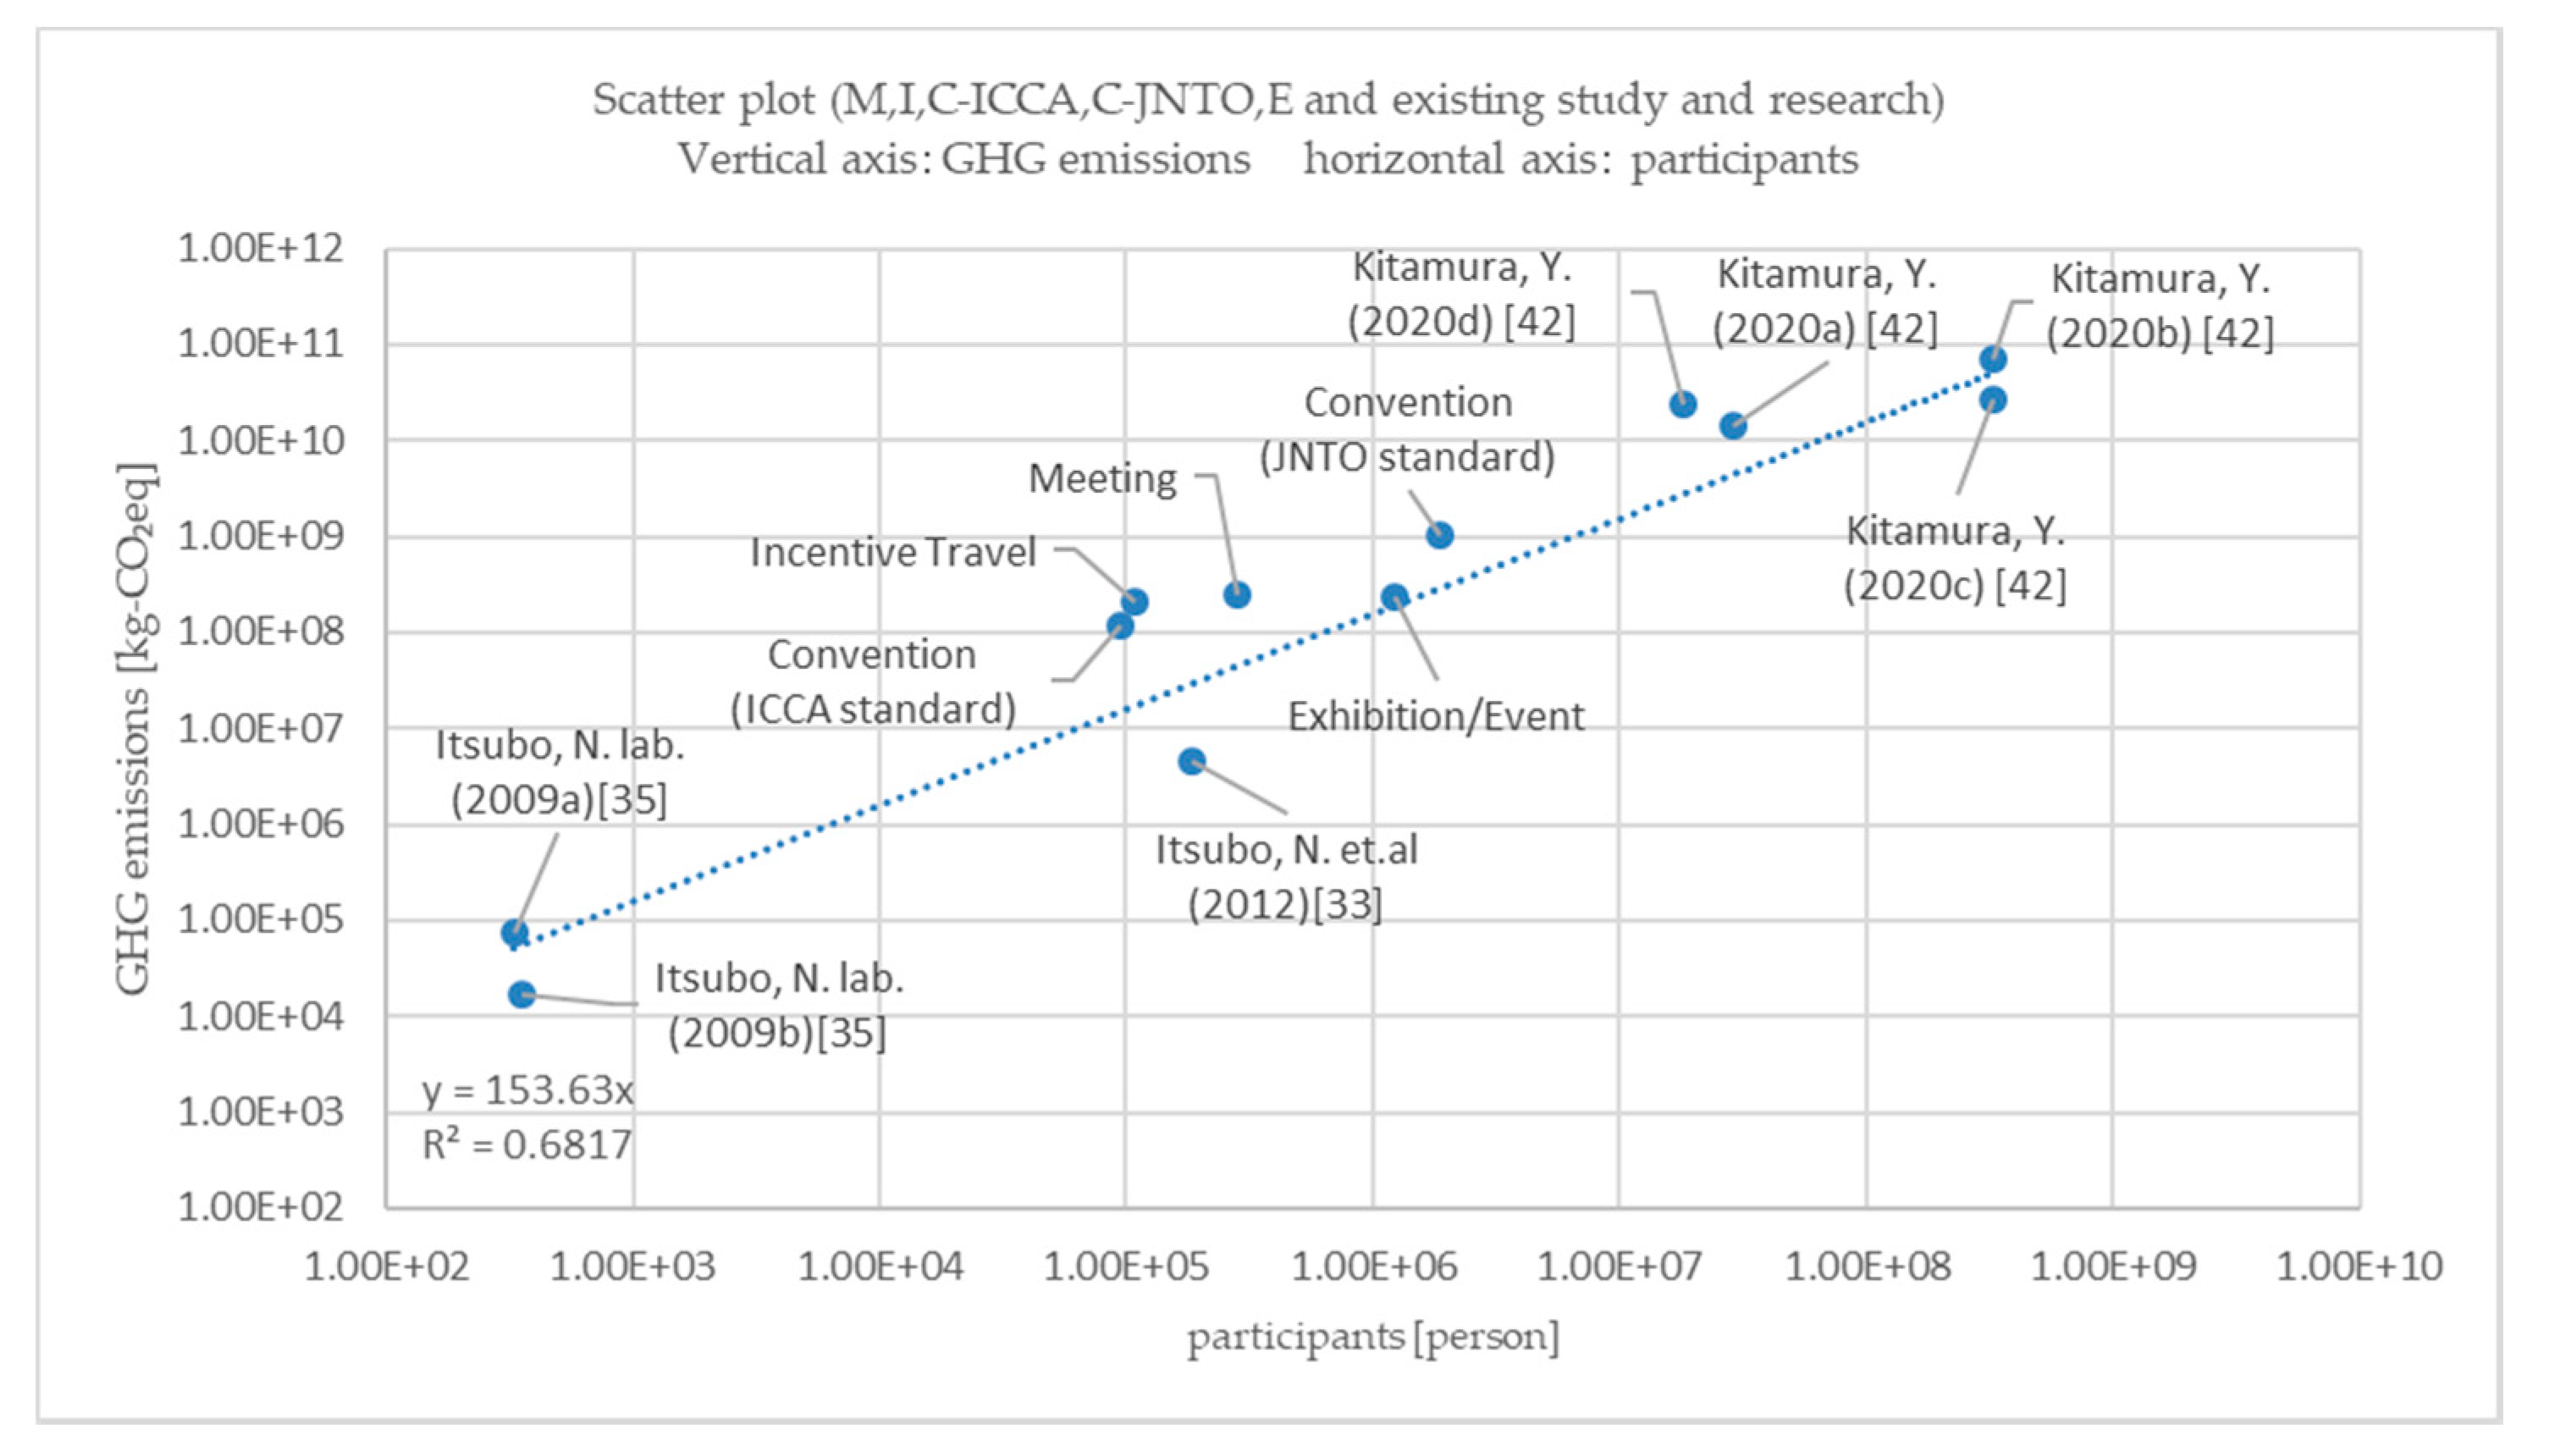
Figure 8 compares the results in this study with those of existing research. Only a few case studies evaluated MICE as business tourism in Japan. In MICE, carbon offset is often adopted as carbon management. This study and the three existing case studies adopted the life cycle approach. Tokyo City University-Itsubo Laboratory (2009a, 2009b) [35] was a convention and Itsubo et al. [33] was an exhibition/event (E). Itsubo Laboratory (2009a) [35] was a convention (C) organized by the same organizer, Itsubo Laboratory (2009b) [35], but the hosting area and location were different. The venue was an exhibition facility and many participants needed to use domestic flights. In addition, accommodation was also included. Itsubo Laboratory (2009b) [35] is an example of a meeting held in a place which was easy to access by a relatively large number of participants. The venue was rented from a university campus facility. However, these two cases did not include participants’ food and beverages and planning costs. In this case, the increase or decrease in environmental load can be found by selecting the venue especially given the influence by the transportation of the participants. The results of this study (C-ICCA, C-JNTO) are above the regression line. This indicates the characteristics of consumption, including the transportation of domestic and overseas participants. The participants’ accommodation also contributed to the organizers’ planning costs.
Itsubo et al. [33] evaluated the largest environmental exhibition in Japan. The scale of the event was close to that of the present study, but the percentage of overseas participants was low. The breakdown of domestic and overseas participants was not shown. In this case, most participants were domestic, and the transportation of overseas participants was not included. We covered events with many overseas participants, including transportation. The environmental load per participant is likely to be lower than that of other MICE events.
Kitamura et al. [42], in a Japan case, evaluated “a; inbound tourism, b; overnight stay of domestic tourism, c; day trip of domestic tourism, d; outbound tourism”. This case included the products’ consumption by participants in business events, but not that by the organizers of each event. Here, we included organizers and exhibitors as well as participants. The cases of “a” and “d” were above the regression line. This showed the contribution of international flights to the total CFP. It is also important to choose a location that travelers can easily access.
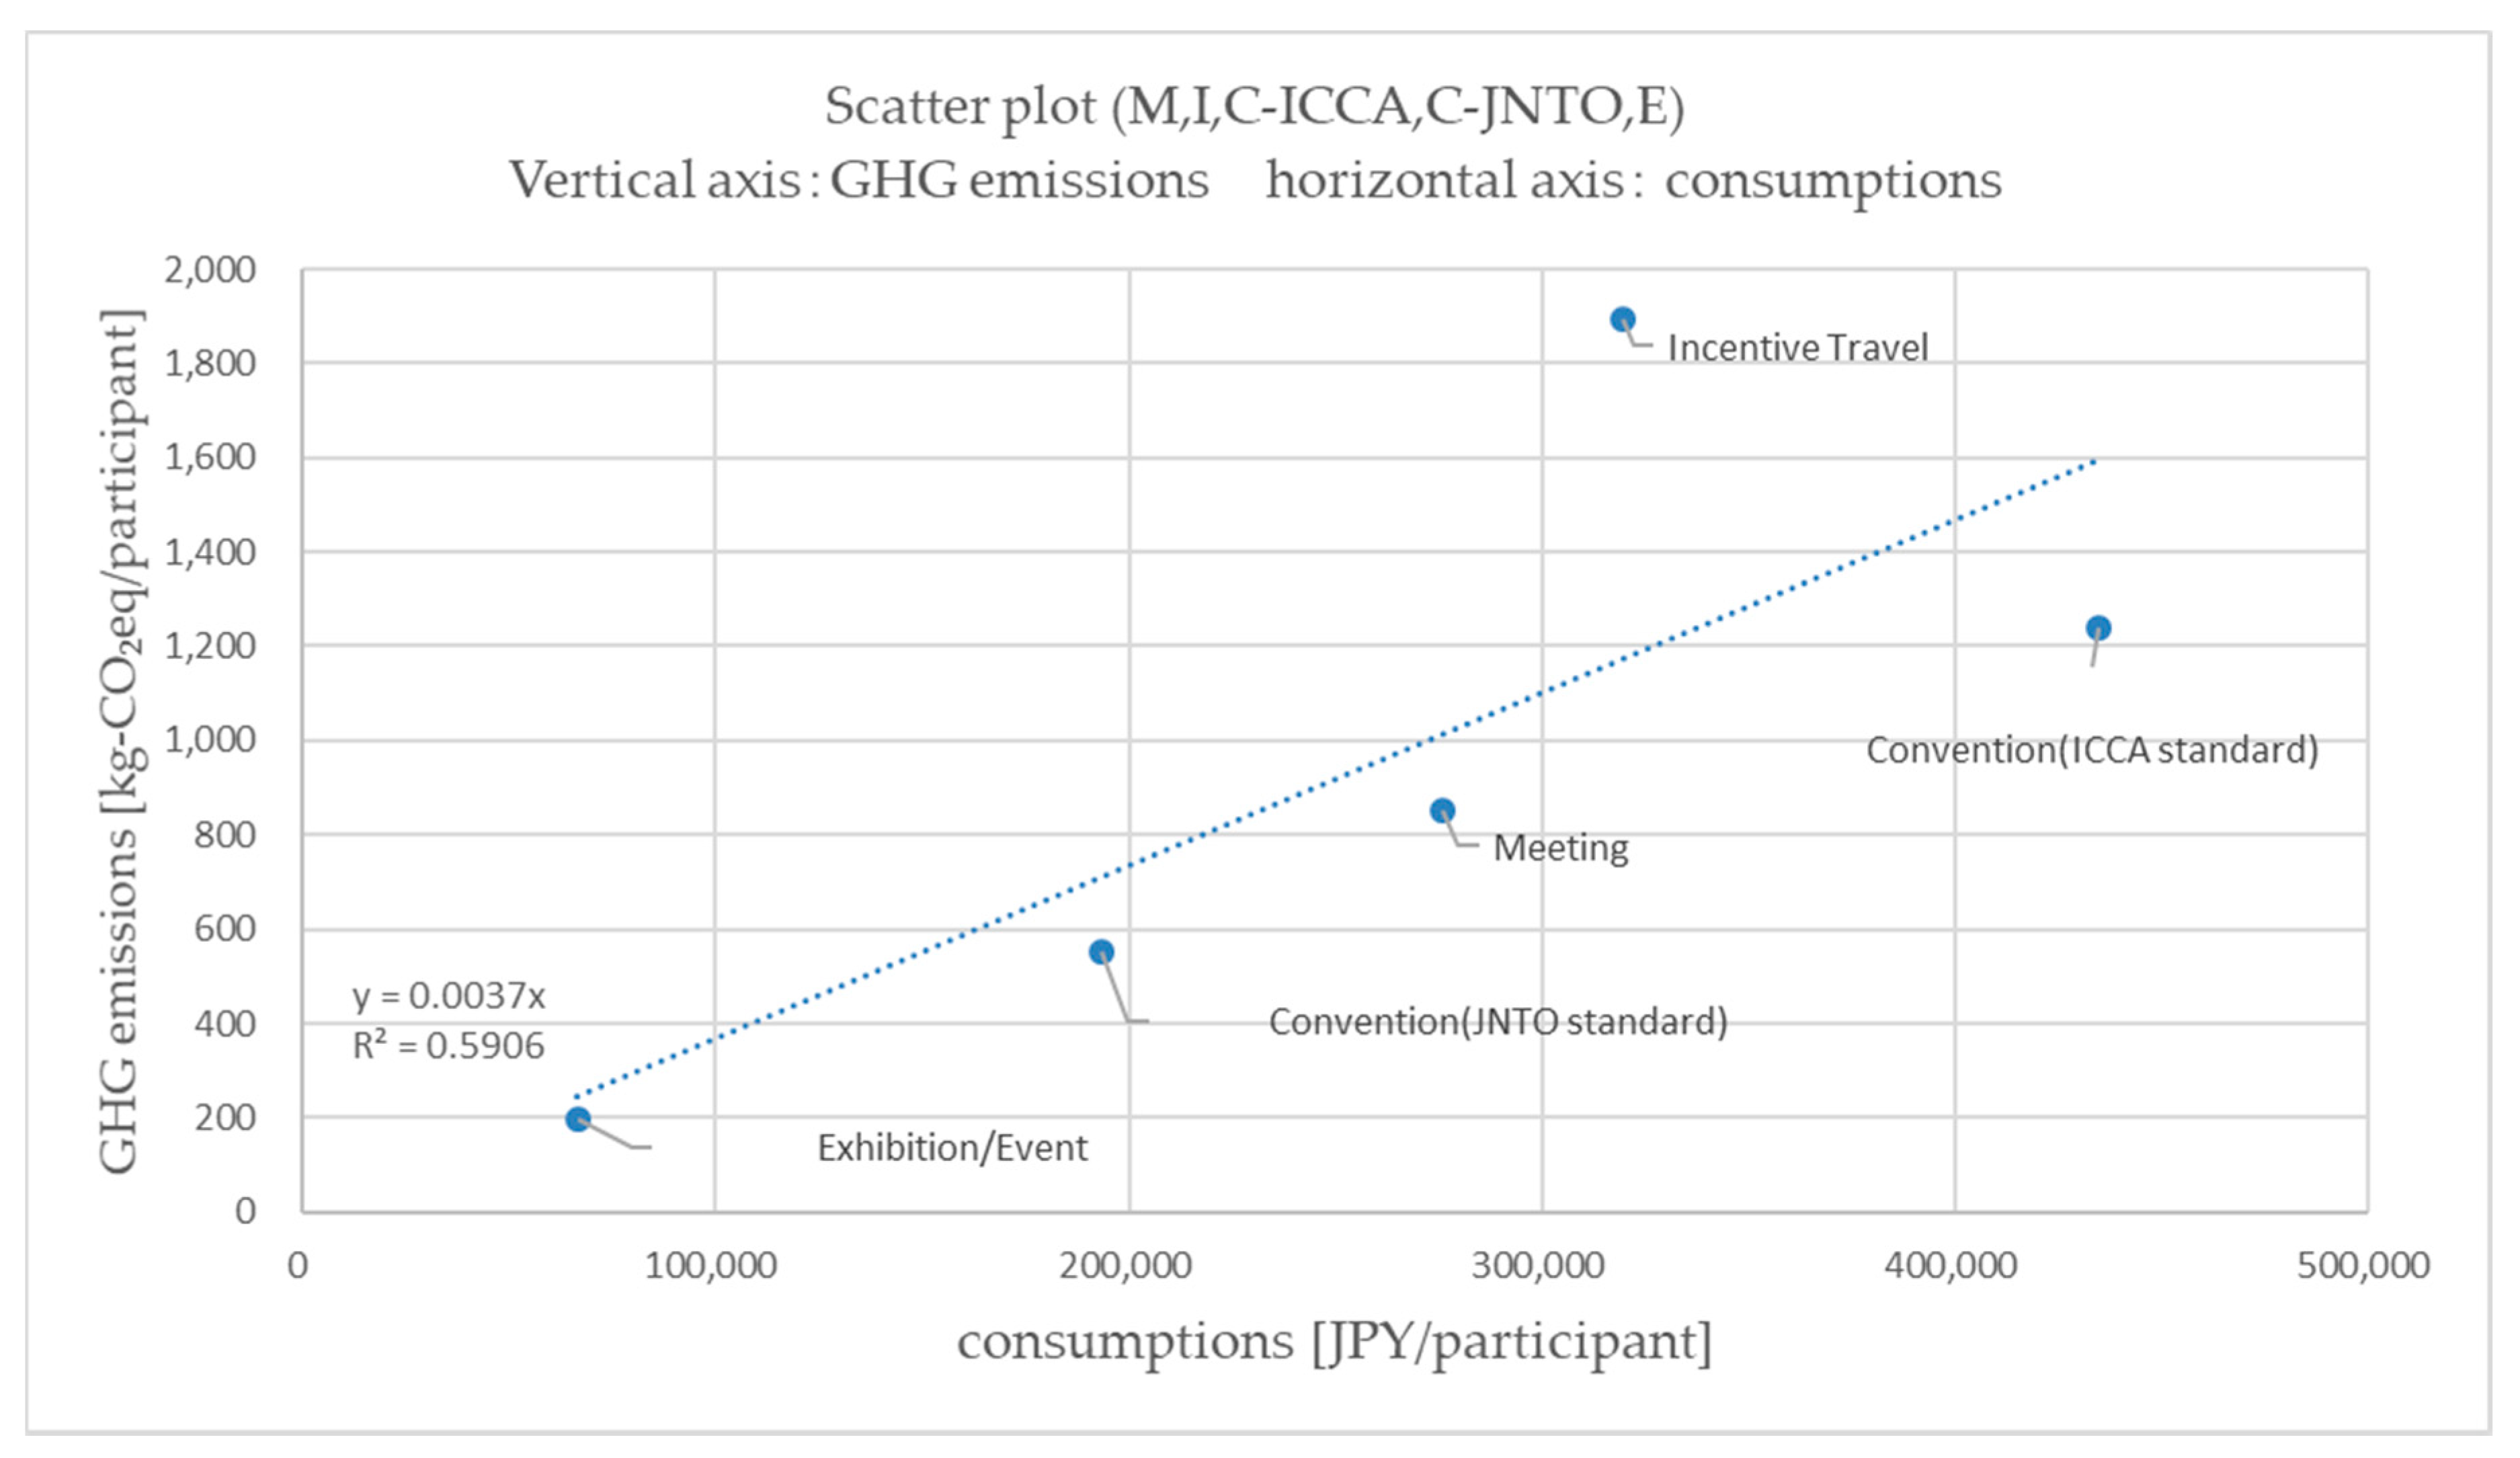
Figure 9 provides an environmental and economic analysis of MICE sector. The x-axis shows consumption (JPY). If the point is on the right side, the economic effect is high. The y-axis shows the CFP amount. The higher the point, the greater the contribution to the environmental load. Within the MICE sector, C-ICCA produces a low environmental load with respect to economic effects. Conversely, incentive travel has a high environmental impact with respect to economic effects. The Japanese government is particularly increasing invitations for internationals to attend conferences [45,46]. For this reason, a balance must be achieved between economic effect and environmental load. We determined CFP for the MICE sector, which is expected to increase given the government’s strategy to economically expand [3,4].

4.2. Toward the Sustainability of the MICE Sector

Some measures could be taken to reduce the CFP of MICE events. For example, MICE venues could be located near international airports to reduce the burden of transportation. For instance, a new MICE facility was built at New Chitose International Airport in Hokkaido, Northern Japan [47]. This facility is directly connected to the arrival lobby of the international passenger terminal building. For the organizers, no travel is required from the major transportation hubs to the MICE facility. In the case of food and beverages, the organizer often offers some local food. However, the organizers provide many national and non-local food menus to the participants, which could increase the environmental burden due to the transportation to the MICE site. Several projects of Japanese companies support sustainable transportation. Toyota’s project, for example, achieves zero emission of freight transportation by using fuel cell (FC) technology [48]. Hino’s project is transportation by joint consolidation to improve logistics [49]. A compact city that uses such a transportation method would be an example of a good location to host MICE events, which helps stakeholders at the destination of the MICE event to adopt low-carbon efforts.
Incentive travel has an especially high environmental impact with respect to economic effects. For example, organizers need to choose low-carbon transportation. Participants need to choose low carbon for transportation, souvenirs and shopping, and food and beverages. This measure also applies to meetings. At exhibitions, events, and conventions, greater attention could be paid to participant and exhibitor shipping, decoration and construction, and printing. Tinnish et al. [50] advocated important factors for a successful sustainable MICE event. Organizations should have a strategic focus on sustainability in their planning process and encourage changes in sustainability integration behavior into their products. Specifically, planners should procure environmentally friendly products and products that have received standards or certification. Next, online communication methods and digital signage should be used wherever possible, with minimal printing, and responsible selection. Participation in a donation program supported by the venue, convention bureau, etc., should be encouraged to support school programs and divert conference supplies. Other options include donating timber products from the exhibit, reusing name badges, and using recycled name badges. These actions are included in each sustainability guideline for MICE events to meet as many standards as possible to ensure more sustainable action at each MICE event.
Some of these good practices are included in sustainability guidelines developed in each country or city. It is necessary for product and service providers to further reduce their own CFP efforts, and it is important that participants can select those products and services.

4.3. Limitations and Future Investigations

Process-based LCA can reflect the reduction in the consumed physical quantities of resources. However, time and effort are required to review the supply chain. There, we adopted input–output LCA based on consumption. In this study, the boundary was expanded and evaluated more than the existing study. However, some items require more detailed classification. For conventions, reference values were used for the breakdown of organizers and exhibitors.
For future research, the boundary can be expanded to evaluate other sectors related to tourism (sports tourism, medical and health tourism, etc.). In addition, small- and medium-sized events not included in MICE can be evaluated individually. To get additional details, you need to implement a process based LCA, and it is partially recommended to use the amount spent and secondary data from the input-output LCA. We think the details should be evaluated using such a hybrid approach.

5. Conclusions

In these results, total emissions were 804.8 t-CO2eq (M, I, C-ICCA, and E) and 1714.4 t-CO2eq (M, I, C-JNTO, and E). In the case of M, I, C-ICCA, and E, transportation (Transp, 56.0%) contributed the most, followed by planning and preparation (Plan, 13.2%) and accommodation (Acc, 12.0%), souvenirs, shopping, entertainment and sightseeing (SE, 10.1%), and food and beverages (FB, 7.9%). In the case of M, I, C-JNTO, and E, transportation (Transp, 54.3%) contributed the most, followed by planning and preparation (Plan, 14.3%) and accommodation (Acc, 12.9%), food and beverages (FB, 9.2%), and souvenirs, shopping, entertainment and sightseeing (SE, 8.2%). In both cases, Transp contributed the most, followed by Plan and Acc. The highest contribution of Transp in all categories occurred due to the volume of evaluated events. From this result, the CFP of the MICE sector is produced not only by transportation but also planning and preparation, accommodation, food and beverages, and souvenirs. In this study, we used government statistical data as activity data. The potential environmental impact of medium-scale business conventions was determined. We found that it is possible to calculate the carbon footprint (CFP) of MICE events using joint consumption information and input–output LCA. Incentive travel has a high environmental impact with respect to economic effects. For example, organizers need to choose low-carbon transportation and participants need to choose low carbon or transportation, souvenirs and shopping, and food and beverages. Conventions (ICCA standard) have a low environmental impact with respect to economic effects. Therefore, attracting international conferences is an effective strategy to expand the MICE sector. From the results of this study, in the MICE sector, the contribution of CFP is not limited to the transportation of participants. Procurement of organizers and exhibitors, transportation of staff, and accommodation are also important. Participants need to be aware of the impacts of their activities during the participation period (food and beverages, accommodation, shopping and sightseeing, etc.). For example, organizers source products that contribute to low carbon, and it is considered good practice to serve participants. It takes a lot of staff to get a lot of information for carbon management. However, in recent years, the problem has been cleared in order to analyze the economic effect. It was shown that it is possible to apply the consumption information to the CFP calculation, as in this study. Evaluating changes in consumption items with future research could be useful for calculating environmental impacts and sustainability.

Author Contributions

Conceptualization, Y.K. and N.I.; methodology, Y.K., Y.I., and N.I.; writing—original draft preparation, Y.K. and S.K.; supervision, N.I. All authors have read and agreed to the published version of the manuscript.

Funding

This research received no external funding.

Acknowledgments

We would like to express our gratitude to Haruo Suzuki for his generous support of our study.

Conflicts of Interest

The authors declare no conflict of interest.

Appendix A

Table A1. The detailed consumption amount breakdown. (CY2016, unit: JPY, $1 = 113 JPY (2016 average)).
MIC-ICCAC-JNTOE
M, I, Organizer (O)
International transport1.09 × 1091.29 × 1010---
Domestic transport1.13 × 10104.26 × 109---
Accommodation1.80 × 10104.51 × 109---
Food and beverage6.25 × 1092.94 × 109---
Planning and management of the party
(venue costs, including construction costs, etc.)
5.43 × 1095.67 × 108---
Planning and management of such meetings and events (venue costs, including construction costs, etc.)5.80 × 1093.78 × 108---
Planning and management of such tourism programs (entrance fee, including the interpretation guide, etc.)1.30 × 1097.29 × 108---
Administrative3.45 × 1096.48 × 108---
C, E, Organizer (O)
Venue usage--1.82 × 1092.69 × 10102.33 × 109
Conference decoration and construction--1.88 × 1092.77 × 10102.99 × 109
Equipment rental--7.25 × 1081.07 × 10109.77 × 107
Operating and administrative--1.26 × 1091.85 × 10104.67 × 108
Parties like those held post-convention --5.72 × 1088.44 × 1093.82 × 109
Shipping--4.41 × 1076.50 × 108-
Printing--1.66 × 1082.45 × 1092.72 × 108
Promotion and advertisement--3.08 × 1084.53 × 1096.08 × 108
Extraordinary personnel--6.65 × 1089.80 × 1091.41 × 108
Food and beverage--1.17 × 1091.73 × 1010-
Accommodation (staff)--6.25 × 1089.21 × 109-
Transportation of up to venue prefectures--4.95 × 1087.29 × 109-
Others--4.14 × 1086.10 × 1091.30 × 108
Exhibitor (E)
Conference decoration and construction--3.64 × 1091.14 × 10101.83 × 1010
Equipment rental--3.64 × 1091.14 × 10102.92 × 109
Parties like those held post-convention (venue costs, including construction costs, etc.)--7.07 × 1082.22 × 109-
Shipping--7.66 × 1082.41 × 1091.77 × 109
Printing----2.29 × 10⁹
Promotion and advertisement--2.26 × 1097.11 × 1092.12 × 109
Extraordinary personnel--4.36 × 1081.37 × 1091.46 × 109
Accommodation (staff)----1.81 × 10⁹
Transportation of up to venue prefectures----1.56 × 10⁹
Others--4.97 × 1091.56 × 10102.50 × 109
Domestic participants (DP)
Accommodation1.46 × 109-1.04 × 1093.17 × 10103.15 × 109
Food and beverage2.09 × 109-4.90 × 1081.54 × 10103.51 × 109
International flights--1.58 × 1074.49 × 108-
Domestic flights4.28 × 108-6.24 × 1081.97 × 10103.34 × 109
Train3.07 × 108-6.19 × 1082.05 × 10108.68 × 109
Bus, taxi, etc.3.44 × 108-8.62 × 1072.60 × 1093.38 × 108
Gasoline--3.40 × 1069.30 × 1072.24 × 108
Parking --6.41 × 1061.60 × 1081.41 × 108
Highway use--7.02 × 1061.97 × 1084.24 × 108
Souvenirs and shopping2.74 × 109-2.49 × 1087.61 × 1091.48 × 108
Entertainment and tourism1.96 × 109-6.83 × 1072.01 × 1099.45 × 108
Overseas participants (OP)
Accommodation2.54 × 1097.53 × 1083.60 × 1091.78 × 10103.85 × 109
Food and beverages3.62 × 1091.60 × 1091.27 × 1096.34 × 1091.71 × 109
International flights--4.47 × 1092.24 × 10105.79 × 109
Domestic flights7.44 × 1081.39 × 1081.43 × 1085.58 × 1084.89 × 107
Train5.34 × 1081.16 × 1083.71 × 1081.90 × 1095.27 × 108
Bus, taxi, etc.5.99 × 1089.17 × 1072.07 × 1089.87 × 1081.87 × 108
Gasoline--2.29 × 1069.73 × 1063.82 × 106
Parking --1.91 × 1068.16 × 1064.07 × 106
Highway use--1.90 × 1069.89 × 1068.91 × 105
Souvenirs and shopping4.76 × 1094.26 × 1091.20 × 1095.92 × 1095.32 × 108
Entertainment and tourism3.40 × 1098.30 × 1084.26 × 1082.11 × 1092.47 × 109
Total7.82 × 10103.48 × 10104.15 × 10103.60 × 10118.16 × 1010
Table A2. Sector row code table of the input–output items by sector. Created based on Kitamura et al. [42].
Product and ServiceCoefficient
(kg CO2 eq/JPY)
Items
Low CodeCode Name
Travel agencies, tour operators, and tourist guide services
Travel agencies, tour operators, and tourist guide services6.88 × 1045789090Travel and other transportation incidental services
Passenger transport
Airplane (domestic, local)1.01 × 1025751010Air transport
Airplane (international flight)1.01 × 1025751010Air transport
Bullet train1.64 × 1035711010Railway transport
Railways (excluding bullet train)1.64 × 1035711010Railway transport
Bus4.16 × 1035721010bus
Taxi4.93 × 1035721020taxi
Ships (inner service, local)1.23 × 1025742010Marine and inland water
Ships (outbound)2.57 × 1035741010Ocean
Car rental fee7.86 × 1046612010Car rental
Gasoline cost7.55 × 1032111010Petrol
2.10 × 10²-Petrol(direct)
Parking lots, toll road charges (except for highway charge), highway charges8.98 × 1045789010Road
Highway charges8.98 × 1045789010Road
Accommodation services
Accommodation services2.33 × 1036711010Accommodation
Vacation home ownership (imputed)2.37 × 1045531010Vacation home ownership (imputed)
Food and beverage
Food and beverage serving services2.59 × 1036721010Food and beverage
Souvenirs and shopping
Agricultural products2.10 × 103116090Other non-food cropping crops
Agricultural processed products3.12 × 1031116020Agro-preserved food products (except bottles and cans)
Marine products6.07 × 103172001Inland fishery and aquaculture
Fisheries processed products5.04 × 1031113090Other seafood
Confectionery3.66 × 1031115030Confectionery
Other food items5.54 × 1031119090food items
Fiber products6.58 × 1031519090textile products
Shoes, bags3.05 × 1032229010footwear
Ceramics and glass products2.91 × 1032312020Bags, bags and other leather products
Publication3.43 × 1035951030Publication
Wood products and paper products5.62 × 1031649090Other pulp, paper and paper products
Medical supplies and cosmetics3.69 × 1032081020Cosmetics
Film6.18 × 1032083010Photosensitive material
Electrical equipment and related products3.61 × 1033321020Consumer electrical appliances (except air conditioners)
Camera, glasses, watch3.26 × 1033919090Other manufactured industrial products
Sports equipment, CD (Compact disc), stationery3.26 × 1033919090Other manufactured industrial products
Other manufactured products3.26 × 1033919090Other manufactured industrial products
Activity (cultural services, recreation, other entertainment services, and other services)
A day spa, warm-bathing facility, beauty salon3.81 × 1036731040Bathing
Museums, museums, zoos and gardens, aquariums2.30 × 1036312010Social education (public)
Watching sports, art appreciation1.01 × 1036741020Office space (except movie theaters) and entertainment companies
Amusement parks and expositions1.01 × 1036741020Office space (except movie theaters) and entertainment companies
Sports facilities1.34 × 1036741040Sports facility offer work, park, amusement park
Ski lift fee1.64 × 1035711010Railway
Camp site1.34 × 1036741040Sports facility offer work, park, amusement park
Exhibition and convention participation fee6.27 × 1046699090Other business services
Tourist farm4.56 × 103131020Agricultural services (except for veterinary services)
Fishing boat1.45 × 1036741090Other entertainment
Guide fee8.22 × 1046799090Other personal services
Rental charge7.80 × 1046611010Goods rental business (excluding rental cars)
Massage1.06 × 1036411050Medical (other medical services)
Photo shoot fee1.10 × 1036799010Photography
Mail and communication charges1.51 × 1035791010Postal and letter mail
Home delivery1.38 × 1025722010delivery
Travel insurance, credit card admission fee6.78 × 1045312010Life insurance
Passport application fee8.16 × 1046112010Government (local)
Visa application fee8.16 × 1046112010Government (local)
Hairdresser, barber9.50 × 1046731030Beauty industry
Develop and print photos8.22 × 1046799090Other personal services
Laundry service1.74 × 1036731010laundry service
Other8.22 × 1046799090Other personal services
Table A3. Sector row code table of the input–output items by sector in this study.
Product and Service SpendingCoefficient
(kg CO2 eq/JPY)
Items
Low CodeCode Name
M, I, Organizer (O)
International transport1.01 × 1025751010Air transport
Domestic transport6.60 × 103-Average of transport
Accommodation2.33 × 1036711010Accommodation
Food and beverage2.59 × 1036721010Food and beverage
Planning and management of parties
(venue costs, including construction costs, etc.)
8.22 × 1046699090Other business services
Planning and management of meetings and events (venue costs, including construction costs, etc.)8.22 × 1046699090Other business services
Planning and management of tourism program (entrance fee, including the interpretation guide, etc.)6.88 × 1045789090Travel and other transportation incidental services
Administrative8.22 × 1046699090Other business services
C, E, Organizer (O)
Venue usage8.22 × 1046699090Other business services
Conference decoration and construction8.22 × 1046699090Other business services
Equipment rental7.80 × 1046611010Goods rental business
(excluding rental cars)
Operating and administrative8.22 × 1046699090Other business services
Parties like those held post-convention 8.22 × 1046699090Other business services
Shipping1.38 × 1025722010delivery
Printing4.14 × 1031911010Printing
Promotion and advertisement1.44 × 1036621010Promotion and Advertisement
Extraordinary personnel1.26 × 1046699030Worker dispatching service
Food and beverage2.59 × 1036721010Food and beverage
Accommodation (staff)2.33 × 1036711010Accommodation
Transportation of up to venue prefectures6.60 × 103-Average of transport
Others8.22 × 1046799090Other personal services
Exhibitor (E)
Conference decoration and construction8.22 × 1046699090Other business services
Equipment rental7.80 × 1046611010Goods rental business
(excluding rental cars)
Parties like those held post-convention (venue costs, construction costs, etc.)8.22 × 1046699090Other business services
Shipping1.38 × 1025722010delivery
Printing4.14 × 1031911010Printing
Promotion and advertisement1.44 × 1036621010Promotion and Advertisement
Extraordinary personnel1.26 × 1046699030Worker dispatching service
Accommodation (staff)2.33 × 1036711010Accommodation
Transportation to venue 6.60 × 10³-Average of transport
Others8.22 × 1046799090Other personal services
Domestic participants (DP)
Accommodation2.33 × 1036711010Accommodation
Food and beverage2.59 × 1036721010Food and beverage
International flights1.01 × 1025751010Air transport
Domestic flights1.01 × 1025751010Air transport
Trains1.64 × 1035711010Railway transport
Bus, taxi, etc.4.55 × 103-Average of Bus and Taxi
Gasoline2.86 × 1022111010Petrol and Petrol(direct)
Parking 8.98 × 1045789010Road transport facilities
Highway use8.98 × 1045789010Road transport facilities
Souvenirs and shopping4.26 × 103-Average of souvenir
Entertainment and tourism2.17 × 103-Average of Activity
Overseas participants (OP)
Accommodation2.33 × 1036711010Accommodation
Food and beverages2.59 × 1036721010Food and beverage
International flights1.01 × 1025751010Air transport
Domestic flights1.01 × 1025751010Air transport
Train1.64 × 1035711010Railway transport
Bus, taxi, etc.4.55 × 103-Average of Bus and Taxi
Gasoline2.86 × 1022111010Petrol and Petrol(direct)
Parking 8.98 × 1045789010Road transport facilities
Highway use8.98 × 1045789010Road transport facilities
Souvenirs and shopping4.26 × 103-Average of souvenir
Entertainment and tourism2.17 × 103-Average of Activity
Table A4. CFP calculation result in this study (unit: kg CO2 eq).
MIC-ICCAC-JNTOE
M, I, Organizer (O)
International transport1.10 × 1071.30 × 108---
Domestic transport7.48 × 1072.81 × 107---
Accommodation4.19 × 1071.05 × 107---
Food and beverage1.62 × 1077.61 × 106---
Planning and management of parties (venue costs, construction costs, etc.)4.47 × 1064.66 × 105---
Planning and management of meetings and events (venue costs, construction costs, etc.)4.77 × 1063.11 × 105---
Planning and management of tourism program (entrance fee, interpretation guide, etc.)8.94 × 1055.01 × 105---
Administrative2.84 × 1065.33 × 105---
C, E, Organizer (O)
Venue usage--1.50 × 1062.21 × 1071.92 × 106
Conference decoration and construction--1.55 × 1062.28 × 1072.46 × 106
Equipment rental--5.66 × 1058.34 × 1067.62 × 104
Operating and administrative--1.03 × 1061.52 × 1073.84 × 105
Parties like those held post-convention--4.71 × 1056.94 × 1063.14 × 106
Shipping--6.11 × 1059.00 × 106-
Printing--6.87 × 1051.01 × 1071.12 × 106
Promotion and advertisement--4.42 × 1056.52 × 1068.74 × 105
Extraordinary personnel--8.39 × 1041.24 × 1061.78 × 104
Food and beverage--3.04 × 1064.47 × 107-
Accommodation (staff)--1.46 × 1062.15 × 107-
Transportation of up to venue prefectures--3.26 × 1064.81 × 107-
Others--3.40 × 1055.01 × 1061.07 × 105
Exhibitor (E)
Conference decoration and construction--2.99 × 1069.41 × 1061.50 × 107
Equipment rental--2.84 × 1068.92 × 1062.28 × 106
Parties like those held post-convention (venue costs, construction costs, etc.)--5.81 × 1051.83 × 106-
Shipping--1.06 × 1073.33 × 1072.45 × 107
Printing----9.48 × 10⁶
Promotion and advertisement--3.25 × 1061.02 × 1073.05 × 106
Extraordinary personnel--5.50 × 1041.73 × 1051.84 × 105
Accommodation (staff)----4.21 × 10⁶
Transportation of up to venue prefectures----1.03 × 10⁷
Others--4.09 × 1061.28 × 1072.06 × 106
Domestic participants (DP)
Accommodation3.41 × 106-2.42 × 1067.38 × 1077.35 × 106
Food and beverage5.39 × 106-1.27 × 1063.98 × 1079.06 × 106
International flights--1.59 × 1054.53 × 106-
Domestic flights4.32 × 106-6.29 × 1061.98 × 1083.37 × 107
Train5.05 × 105-1.02 × 1063.38 × 1071.43 × 10
Bus, taxi, etc.1.57 × 106-3.92 × 1051.18 × 1071.54 × 106
Gasoline--9.72 × 1042.66 × 1066.39 × 106
Parking --5.75 × 1031.44 × 1051.27 × 105
Highway use--6.31 × 1031.77 × 1053.81 × 105
Souvenirs and shopping1.17 × 107-1.06 × 1063.24 × 1076.32 × 105
Entertainment and tourism4.24 × 106-1.48 × 1054.37 × 1062.05 × 106
Overseas participants (OP)
Accommodation5.92 × 1061.76 × 1068.41 × 1064.16 × 1078.97 × 106
Food and beverages9.37 × 1064.14 × 1063.27 × 1061.64 × 1074.42 × 106
International flights--4.51 × 1072.26 × 1085.83 × 107
Domestic flights7.50 × 1061.40 × 1061.44 × 1065.63 × 1064.93 × 105
Train8.78 × 1051.90 × 1056.10 × 1053.13 × 1068.67 × 105
Bus, taxi, etc.2.72 × 1064.17 × 1059.42 × 1054.49 × 1068.53 × 105
Gasoline--6.55 × 1042.78 × 1051.09 × 105
Parking --1.71 × 1037.33 × 1033.66 × 103
Highway use--1.70 × 1038.88 × 1038.00 × 102
Souvenirs and shopping2.03 × 1071.81 × 1075.11 × 1062.52 × 1072.27 × 106
Entertainment and tourism7.37 × 1061.80 × 1069.25 × 1054.59 × 1065.37 × 106
Total2.42 × 1082.06 × 1081.18 × 1081.03 × 1092.38 × 108

References

  1. 2017 International Year of Sustainable Tourism for Development. Available online: http://www.tourism4development2017.org/about/ (accessed on 13 May 2020).
  2. United Nations World Tourism Organization (UNWTO). Sustainable Tourism for Development Guidebook–Enhancing Capacities for Sustainable Tourism for Development in Developing Countries; UNWTO: Madrid, Spain, 2013. [Google Scholar]
  3. Japan Tourism Agency (JTA). Significance of MICE. Available online: http://www.mlit.go.jp/kankocho/shisaku/kokusai/mice.html#igi (accessed on 13 May 2020).
  4. Japan Tourism Agency (JTA). A Vision for Tourism That Will Support Japan Tomorrow. Available online: https://www.mlit.go.jp/kankocho/topics01_000205.html (accessed on 13 May 2020).
  5. Events Industry Council (EIC). The Economic Significance of Meetings to the U.S. Economy. 2012. Available online: https://insights.eventscouncil.org/Portals/0/2016.pdf (accessed on 13 May 2020).
  6. Li, S.; Bowdin, G.; Heslington, E.; Jones, S.; Mulligan, J.; Tara-Lunga, M.; Tauxe, C.; Thomas, R.; Wu, P.; Blake, A.; et al. The Economic Impact of the UK Meeting & Event Industry. 2013. Available online: https://www.researchgate.net/publication/277308949 (accessed on 13 May 2020).
  7. Kahn, K.; Andersen, C.; Dissing, S. The Economic Contribution of Meeting Activity in Denmark; Visit Denmark: Copenhagen, Denmark, 2012. [Google Scholar]
  8. Business Events Council of Australia. The Value of Business Events to Australia. 2015. Available online: https://www.businesseventscouncil.org.au/files/View_Report.pdf (accessed on 13 May 2020).
  9. International Congress and Convention Association (ICCA). Study on the Economic MICE in Singapore. 2016. Available online: http://www.iccaworld.org/dcps/doc.cfm?docid=1948 (accessed on 13 May 2020).
  10. Frost & Sullivan. The Study on the Economic Impact of MICE Industry in Thailand; Thailand Convention & Exhibition Bureau: Bangkok, Thailand, 2018. [Google Scholar]
  11. International Standard. Event Sustainability Management Systems—Requirements With Guidance for Use, 1st ed.; ISO 20121: 2012(E); ISO: Geneva, Switzerland, 2012. [Google Scholar]
  12. United Nations Environment Programme (UNEP). Green Meeting Guide 2009. Available online: https://www.greeningtheblue.org/sites/default/files/GreenMeetingGuide.pdf (accessed on 13 May 2020).
  13. United Nations Environment Programme (UNEP). Sustainable Events Guide—Give Your Large Event a Small Footprint. 2012. Available online: https://www.greeningtheblue.org/sites/default/files/Sustainable%20Events%20Guide%20May%2030%202012%20FINAL.pdf (accessed on 13 May 2020).
  14. Singapore Tourism Board. Sustainability Guidelines for the Singapore Mice Industry. 2013. Available online: https://www.visitsingapore.com/content/dam/MICE/Global/useful-downloads/sustainability-guidelines-for-mice.pdf (accessed on 13 May 2020).
  15. Thailand Convention and Exhibition Bureau (TCEB). Thailand Sustainable Events Guide. 2015. Available online: http://www.micecapabilities.com/mice/uploads/attachments/Thailand_Sustainable_Events_Guide_(TH).pdf (accessed on 13 May 2020).
  16. Ministry of Economic Affairs, Bureau of Foreign Trade. 2016 Green MICE Guidelines. Available online: https://venweb.meettaiwan.com/static/download/2016-Green-MICE-Guidelines.pdf (accessed on 13 May 2020).
  17. Ministry of the Environment Government of Japan. Recommendations for Environmentally Friendly Meetings. 2008. Available online: https://www.env.go.jp/policy/kaigi_hairyo/tebiki.pdf (accessed on 13 May 2020).
  18. Tokyo Convention and Visitors Bureau (TCVB). Sustainability Guidelines for Business Events in Tokyo. 2019. Available online: https://businesseventstokyo.org/tokyo-mice-sustainability-guidelines/ (accessed on 13 May 2020).
  19. United Nations Framework Convention on Climate. Change (UNFCCC). The Paris Agreement. Available online: https://unfccc.int/process-and-meetings/the-paris-agreement/the-paris-agreement (accessed on 13 May 2020).
  20. United Nations Environment Programme (2019). Emissions Gap Report 2019. UNEP, Nairobi. Available online: https://www.unenvironment.org/resources/emissions-gap-report-2019 (accessed on 13 May 2020).
  21. Ministry of the Environment Government of Japan. Submission of Japan’s Nationally Determined Contribution (NDC). Available online: https://www.env.go.jp/press/files/jp/113675.pdf (accessed on 13 May 2020).
  22. The Long-Term Strategy Under the Paris Agreement. The Government of Japan, Tokyo. Available online: https://www.env.go.jp/press/111913.pdf (accessed on 13 May 2020).
  23. Global Reporting Initiative (GRI). United Nations Global Compact (UNGC). World Business Council for Sustainable Development (WBCSD). SDG Compass The Guide for Business Action on the SDGs. Available online: https://sdgcompass.org/wp-content/uploads/2015/12/019104_SDG_Compass_Guide_2015.pdf (accessed on 13 May 2020).
  24. United Nations World Tourism Organization (UNWTO). TOURISM FOR SDGs. Available online: http://tourism4sdgs.org/ (accessed on 13 May 2020).
  25. Mair, J.; Jago, L. The development of a conceptual model of greening in the business events tourism sector. J. Sustain. Tour. 2010, 18, 77–94. [Google Scholar] [CrossRef]
  26. Seraphin, H.; Nolan, E. Green Events and Green Tourism an International Guide to Good Practice; Routledge: London, UK, 2018. [Google Scholar]
  27. London Organising Committee of the Olympic Games and Paralympic Games. London 2012 Carbon Footprint Study—Methodology and Reference Footprint. 2010. Available online: https://www.mma.gov.br/estruturas/255/_arquivos/carbon_footprint_study_relat_255.pdf (accessed on 13 May 2020).
  28. Society of Environmental Toxicology and Chemistry (SETAC). SETAC Europe 30th Annual Meeting Sustainability Initiatives. Available online: https://dublin.setac.org/general-info/sustainability-2/ (accessed on 13 May 2020).
  29. Itsubo, N.; Horiguchi, K.; Tang, L.; Hiruma, M.; Sekiguchi, N. Environmental analysis for international marathon event based on the life cycle perspectives. J. Life Cycle Assess. Jpn. 2009, 5, 510–520. [Google Scholar] [CrossRef]
  30. Ap Bank Fes’08. Eco-Report. Available online: http://fes.apbank.jp/08/ecorepo/ (accessed on 13 May 2020). (In Japanese).
  31. Tokyo City University. Carbon Offset Student Project at the School Festival. Available online: https://www.comm.tcu.ac.jp/carbonoffset/ (accessed on 13 May 2020).
  32. Horiguchi, K.; Itsubo, N. Development of emission intensity database for event LCA. In Proceedings of the 4th Meeting of the Institute of Life Cycle Assessment, Kitakyushu, Japan, 5–7 March 2009; pp. 378–379. [Google Scholar]
  33. Itsubo, N.; Ii, R.; Morimoto, Y.; Horiguchi, K.; Yasui, M. Life cycle CO2 analysis for large-scale exhibition. J. Life Cycle Assess. Jpn. 2012, 8, 200–212. [Google Scholar] [CrossRef]
  34. Ministry of Foreign Affairs of Japan. Release of Carbon Offset Report for G7 Ise-Shima Summit. Available online: https://www.mofa.go.jp/mofaj/files/000199847.pdf (accessed on 13 May 2020).
  35. Itsubo, N. Laboratory. Tokyo City University. Life Cycle Assessment for ILCAJ Meeting. Available online: http://www.comm.tcu.ac.jp/itsubo-lab/research/results/files/case/cs2009-b.pdf (accessed on 13 May 2020).
  36. Ministry of the Environment Government of Japan. Environmentally Friendly Guidelines at Events (Premium Standards Development Guidelines Supplement). About Green Purchasing Law (reference). Available online: https://www.env.go.jp/policy/hozen/green/g-law/archive/pre/guide_201909.pdf (accessed on 13 May 2020). (In Japanese).
  37. Japan Tourism Agency (JTA). MICE Economic Ripple Effect and Market Research Project Report 2016. Available online: http://www.mlit.go.jp/common/001186651.pdf (accessed on 13 May 2020).
  38. Japan Tourism Agency (JTA). MICE Economic Ripple Effect and Market Research Project Report 2017. Available online: http://www.mlit.go.jp/common/001233265.pdf (accessed on 13 May 2020).
  39. Leontief, W.W. Input-Output Economics, 2nd ed.; Oxford University Press: New York, NY, USA, 1986. [Google Scholar]
  40. Tahara, K. Development of inventory database for environmental hotspot analysis using IDEA. J. Life Cycle Assess. Jpn. 2019, 15, 22–32. [Google Scholar] [CrossRef]
  41. Kondo, Y. Estimation of 2011 waste input-output table for Japan. J. Life Cycle Assess. Jpn. 2019, 15, 33–41. [Google Scholar] [CrossRef]
  42. Kitamura, Y.; Ichisugi, Y.; Karkour, S.; Itsubo, N. Carbon footprint evaluation based on tourist consumption toward sustainable tourism in Japan. Sustainability 2020, 12, 2219. [Google Scholar] [CrossRef] [Green Version]
  43. Japan National Tourism Organization (JNTO). International Conference Statistics 2016. Available online: https://mice.jnto.go.jp/documents/statistics.html#2016 (accessed on 13 May 2020).
  44. Events Industry Council (EIC). Global Economic Significance of Business Events. 2018. Available online: https://insights.eventscouncil.org/Portals/0/OE-EIC%20Global%20Meetings%20Significance%20%28FINAL%29%202018-11-09-2018.pdf (accessed on 13 May 2020).
  45. Japan Tourism Agency (JTA). Global MICE City. Available online: http://www.mlit.go.jp/kankocho/shisaku/kokusai/mice.html#global (accessed on 13 May 2020).
  46. Japan Tourism Agency (JTA). Promotion Policy at MICE. Available online: http://www.mlit.go.jp/kankocho/shisaku/kokusai/mice.html#promotion (accessed on 13 May 2020).
  47. New Chitose Airport Terminal Building Co., Ltd. News Release New Chitose Airport Portom Hall. Available online: http://www.new-chitose-airport.jp/ja/corporate/press/pdf/pdf-20190422_portom.pdf (accessed on 18 May 2020).
  48. Toyota Motor Corporation. Zero Emission of Freight Transportation. Available online: https://global.toyota/jp/newsroom/corporate/24578176.html (accessed on 18 May 2020).
  49. Hino Motors Ltd. Commercialize a New Trunk Transportation Scheme. Available online: https://www.hino.co.jp/corp/news/2019/20191204-002480.html (accessed on 18 May 2020).
  50. Tinnish, S.M.; Mangal, S.M. Sustainable event marketing in the MICE Industry: A Theoretical Framework. J. Conv. Event Tour. 2012, 13, 227–249. [Google Scholar] [CrossRef]
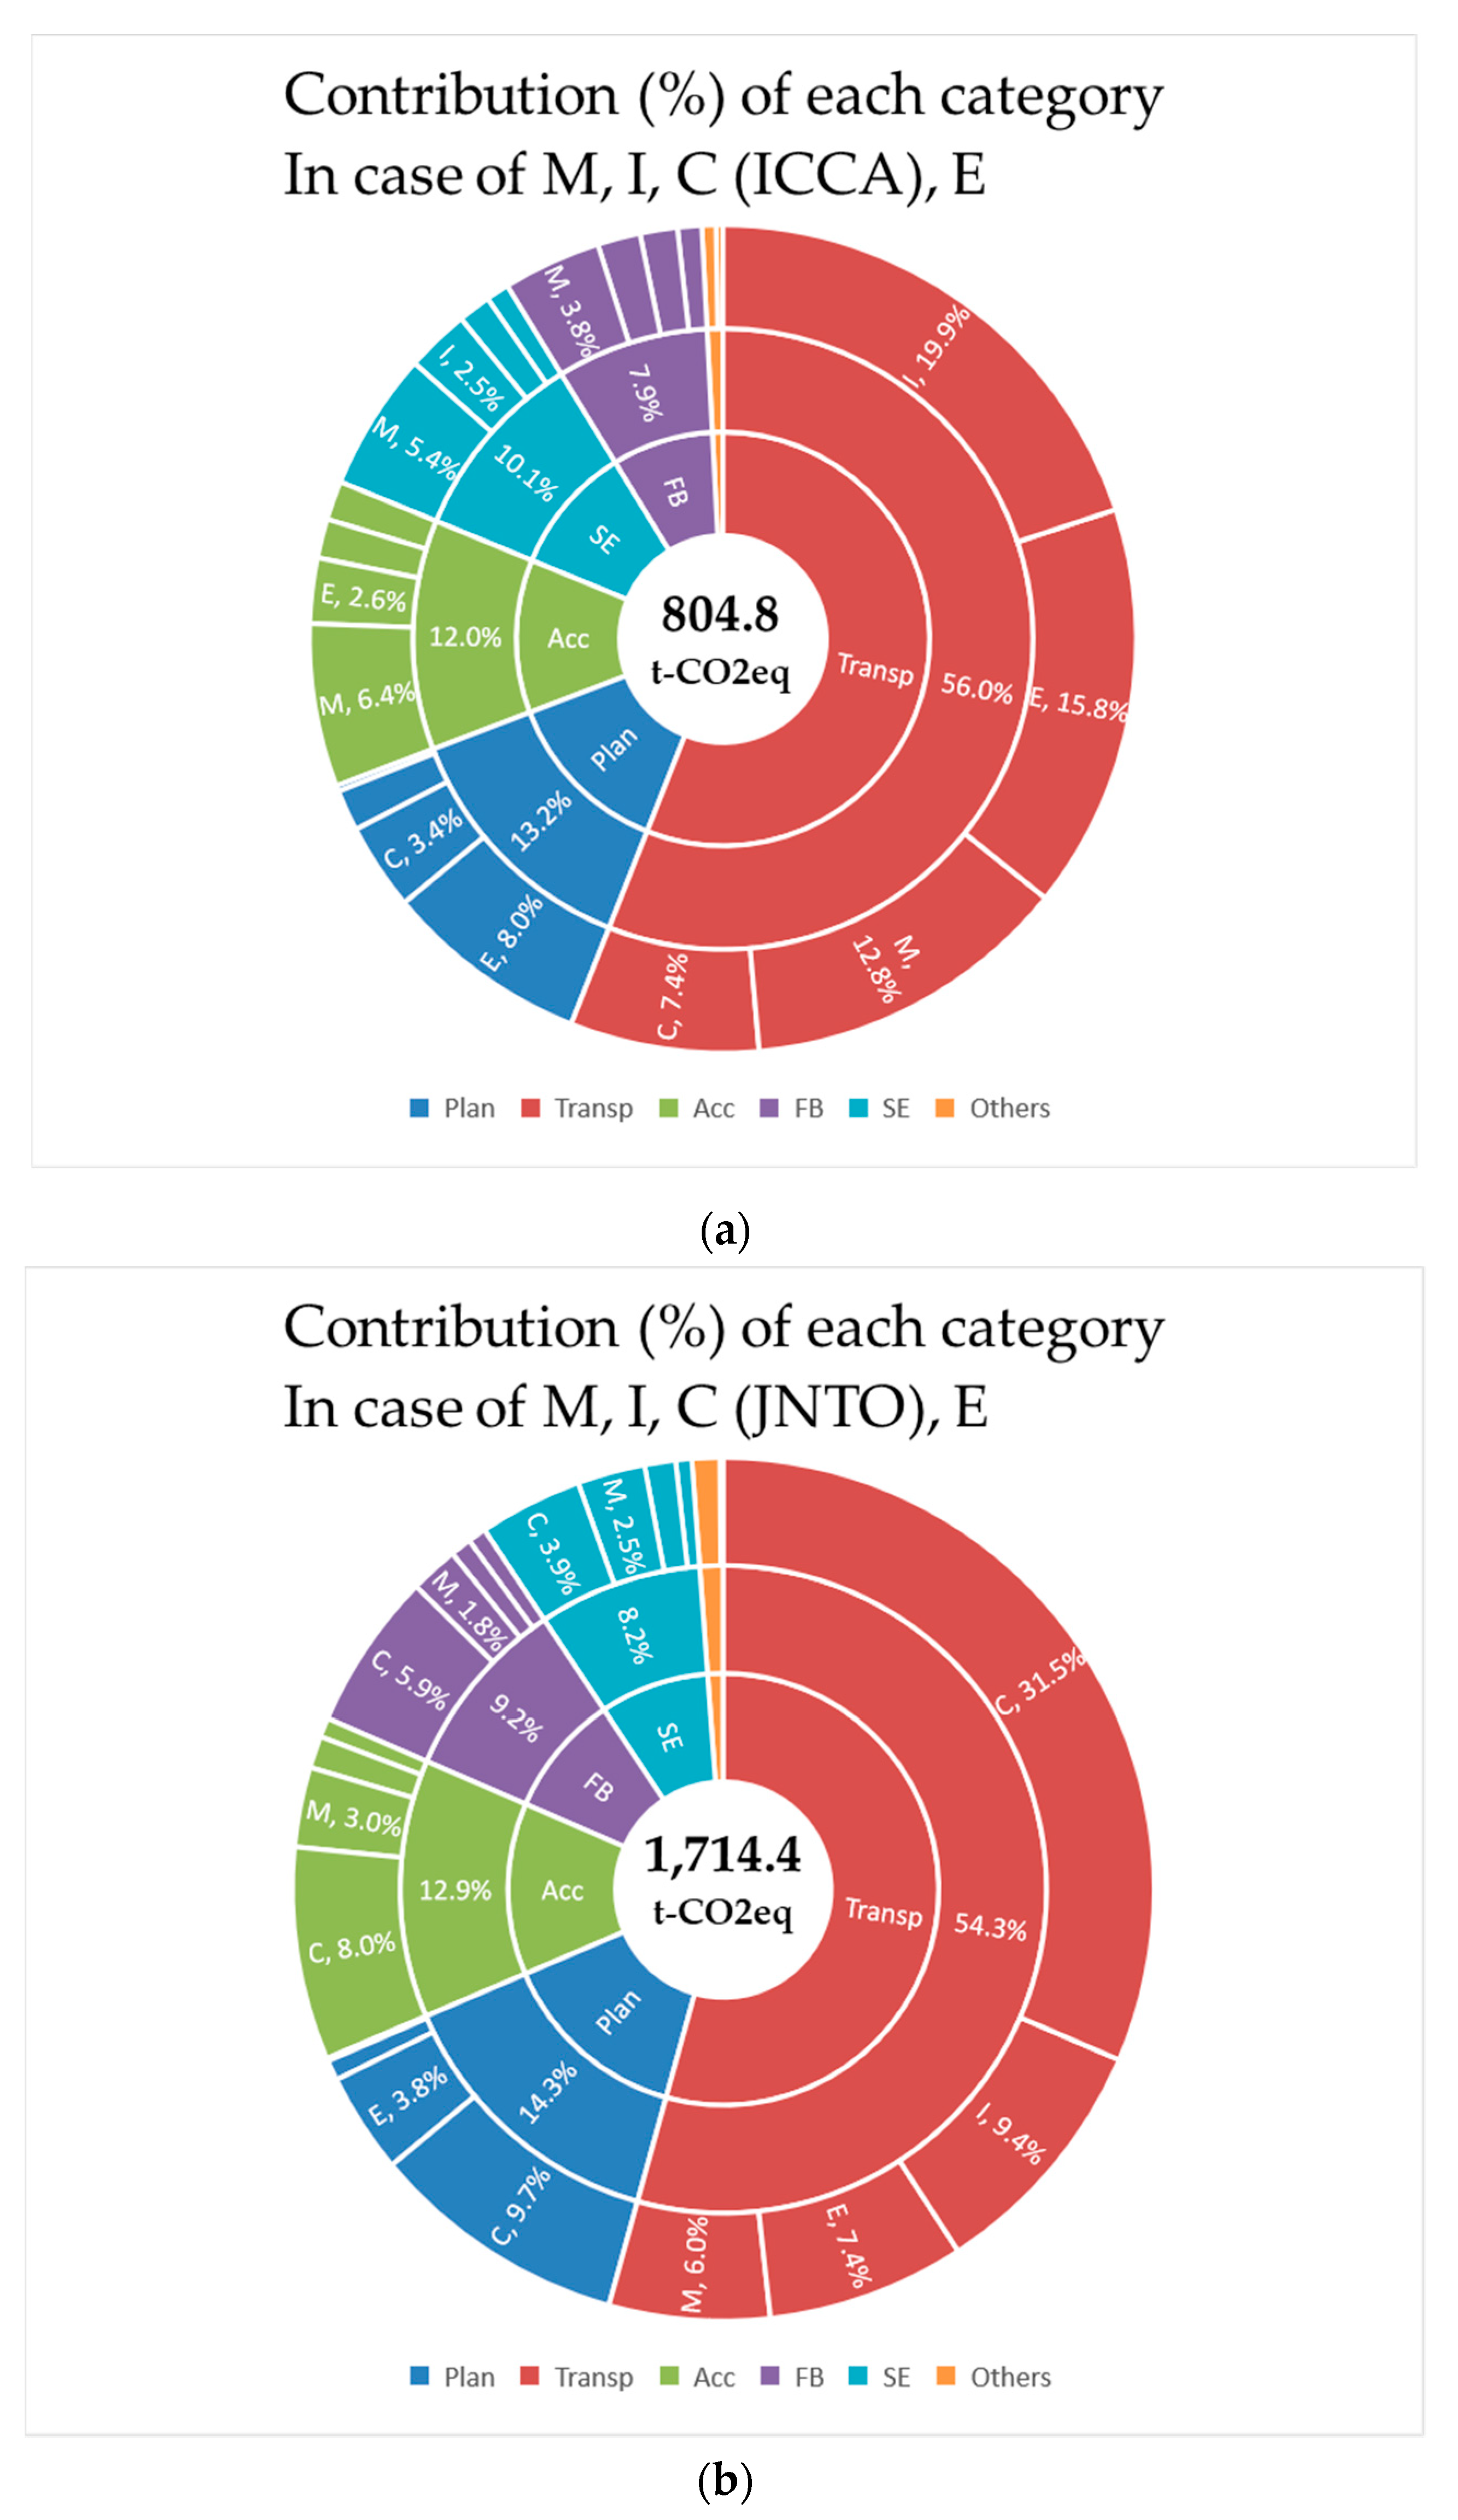
Figure 1. The carbon footprint (CFP) for each (a) Meeting (M), Incentive Travel (I), Convention (C), and Exhibition and Event (E) (MICE) (C-ICCA (Convention meeting the International Congress and Convention Association) standard) event and (b) MICE (C-JNTO (Convention meeting the Japan National Tourism Organization) standard) event. Contribution of each category (planning and preparation (Plan), transportation (Transp), accommodation (Acc), food and beverages (FB), and souvenirs, shopping, entertainment and sightseeing (SE)) to the CFP (%).
Sustainability 12 05001 g001
Figure 2. Breakdown of the CFP in M, I, C, and E by inventory items. O, organizer; E, exhibitor; DP, domestic participants; OP, overseas participants.
Sustainability 12 05001 g002
Figure 3. Relationship between the CFP (kg CO2 eq) and consumption amount (JPY) for each inventory item by group (organizer/participants) in meetings (M): the organizers (a), domestic participants (b), and overseas participants (c).
Sustainability 12 05001 g003
Figure 4. Relationship between the CFP (kg CO2 eq) and consumption amount (JPY) for each inventory item by group (organizer/overseas participants) in incentive travel (I): the organizers (a), and overseas participants (b).
Sustainability 12 05001 g004
Figure 5. Relationship between the CFP (kg CO2 eq) and consumption amount (JPY) for each inventory item by group (organizer/overseas participants) per the ICCA Standard (C): organizers (a), exhibitors (b), domestic participants (c), and overseas participants (d).
Sustainability 12 05001 g005aSustainability 12 05001 g005b
Figure 6. Relationship between the CFP (kg CO2 eq) and consumption amount (JPY) for each inventory item by group (organizer/overseas participants) per the JNTO standard (C): organizers (a), exhibitors (b), domestic participants (c), and overseas participants (d).
Sustainability 12 05001 g006aSustainability 12 05001 g006b
Figure 7. Relationship between the CFP (kg CO2 eq) and consumption amount (JPY) for each inventory item by group (organizer/overseas participants) for Exhibitions and Events (E): organizers (a), exhibitors (b), domestic participants (c), and overseas participants (d).
Sustainability 12 05001 g007aSustainability 12 05001 g007b
Figure 8. Comparison of the results of this study with those of existing studies on the CFP and participants. The Itsubo lab. (2009a) [35] and Itsubo lab. (2009b) [35] conventions had the same organizer, but the hosting area and location were different. Itsubo et al. (2012) [33] evaluated a large-scale event. Kitamura et al. [42] evaluated a Japanese case including “a; inbound tourism, b; overnight stay of domestic tourism, c; day trip of domestic tourism, and d; outbound tourism”.
Sustainability 12 05001 g008
Figure 9. A scatter plot of consumption and the CFP per M, I, C, and E participants.
Sustainability 12 05001 g009
Table 1. System boundary of this study evaluation.
OrganizerExhibitorParticipants
DomesticOverseas
PlanPlanning and management (meetings and events, party, tourism program, post-convention held), administrative, venue usage, decoration and construction, equipment rental, shipping, printing, promotion and advertisement, extraordinary personnel, etc.NN
TranspInternational transport (flight) and domestic transport (flight, train, bus, taxi, gasoline etc.)
AccAccommodation
FBFood and beverages
SENNSouvenirs and shopping
Entertainment and tourism
N means included are displayed as not applicable; Plan, planning and preparation costs; Transp, transportation costs; Acc, accommodation costs; FB, food and beverage costs; SE, souvenirs, shopping, entertainment, and sightseeing costs.
Table 2. The scope of the evaluation of consumptions in this study. Unit: JPY, $1 = 113 JPY (2016 average).
StakeholdersMIC-ICCAC-JNTOE
Organizer5.27 × 10102.70 × 10101.02 × 1010 1.50 × 10¹¹ 1.09 × 10¹⁰
ExhibitorNN1.64 × 1010 5.16 × 10¹⁰ 3.47 × 10¹⁰
Domestic participants9.32 × 109 N3.21 × 1091.00 × 10112.09 × 1010
Overseas participants1.62 × 10107.79 × 1091.17 × 10105.81 × 10101.51 × 1010
N, included elements are displayed as not applicable; M, meeting; I, incentive travel; C-ICCA, convention meeting ICCA standard; C-JNTO, conventions meeting JNTO standard; E, exhibition and event. The detailed consumption amount breakdown is shown in Appendix A Table A1.
Table 3. Top five contributors to the carbon footprint (CFP).
MIC-ICCAC-JNTOE
1(O) Domestic Transport(O) International Transport(OP) International Flights(OP) International Flights(OP) International Flights
2(O) Accommodation(O) Domestic Transport(E) Shipping(DP) Domestic Flight(DP) Domestic Flight
3(OP) Souvenirs and shopping(OP) Souvenirs and shopping(OP) Accommodation(DP) Accommodation(E) Shipping
4(O) Food and beverages(O) Accommodation(DP) Domestic Flights(O) Transportation of up to venue prefectures(E) Conference decoration and construction
5(DP) Souvenirs and shopping(O) Food and beverages(OP) Souvenirs and shopping(O) Food and beverages(DP) Train transport