Article

Exploring the Optimal Cost-Benefit Solution for a Low Impact Development Layout by Zoning, as Well as Considering the Inundation Duration and Inundation Depth

1
Key Laboratory for Urban Habitat Environmental Science and Technology, School of Urban Planning and Design, Peking University, Shenzhen 518055, China
2
Laboratory for Earth Surface Processes, Ministry of Education, College of Urban and Environmental Sciences, Peking University, Beijing 100871, China
*
Author to whom correspondence should be addressed.
Sustainability 2020, 12(12), 4990; https://doi.org/10.3390/su12124990
Submission received: 18 May 2020 / Revised: 30 May 2020 / Accepted: 16 June 2020 / Published: 18 June 2020
(This article belongs to the Special Issue Watershed Modelling and Management for Sustainability)

Abstract

:
Urban flooding now occurs frequently and low impact development (LID) has been widely implemented as an effective resilience strategy to improve storm water management. This study constructed the inundation curve to dynamically simulate the disaster, and established an inundation severity indicator (ISI) and cost-effectiveness indicator (CEI) to quantify the severity and cost effectiveness at each site. The study set 10 different density scenarios using a zonal approach. The results showed that LID could reduce the overall ISI value, but as the construction increased, the CEI exhibited a downward trend, showing that there is a marginal utility problem in LID. However, the performance of CEI differed slightly in areas of different severity. In the vulnerable resilience zone, the CEI increased initially and then decreased, and the optimal cost–benefit combination was 60% permeable pavement +20% green roof +50% vegetative swale. The mutual effects of LID measures in different zones led to synergistic or antagonistic effects on LID. This study explored the tradeoff between the resilience enhancement effect and strategy transformation cost, and determined the optimal combination of the LID strategy, thereby providing a new analytical perspective for the sustainable development of sponge cities.

Graphical Abstract

1. Introduction

Urban flooding disasters now occur frequently throughout the world due to the intensification of climate change and rapid development of urbanization [1,2,3]. These disasters cause enormous social and economic losses, and they severely threaten the safety and property of residents [4,5,6]. Frequent and serious urban rainstorms require the extensive adoption of low-impact development (LID) to supplement the traditional drainage infrastructures [7,8]. LID is a storm water management strategy based on distributed management and localized practices for controlling the runoff and pollution caused by storms in order to enhance the capacity for absorption, storage, and purification, and the recovery of the urban resilience system [9]. LID has been applied widely via the construction of source management measures for rainstorms [10,11].
To evaluate the capacity for resistance, absorption, adaptation, and recovery from disasters, the concept of “resilience” was proposed and it soon became the focus of academic attention [12,13]. Improving urban resilience is very important for the prevention and mitigation of urban disasters [14,15,16]. Due to the occurrence of increasingly severe urban rainstorms, many researchers regard the establishment of resilient cities as the ultimate target of rainstorm management, and “resilience” is considered as an indispensable attribute of cities [17,18].
The development of quantitative assessment methods and strategies for improving urban resilience are two academic research hotspots. Previous studies of resilience mostly focused on major natural disasters, such as earthquakes and hurricanes, and various theoretical frameworks have been proposed for the quantitative assessment of resilience [19,20,21]. Due to the increased public concern regarding flooding disasters, evaluating the flooding resilience of urban systems and assessing the effects of optimal measures are now the focus of scientific research [22]. Some studies have verified the ability of LID to improve resilience based on indicators such as delaying the time until the flood peak and reducing the inundation depth [23,24]. However, these static indicators are relatively weak and urban resilience is more concerned with the dynamic disaster recovery process. Attempts have been made to construct inundation resilience assessment frameworks, which provided useful references for follow-up studies [25,26], but the available quantitative evaluation methods are still inadequate.
In the actual implementation of LID, in addition to the benefits, cost is another significant factor that the government needs to consider [27]. The study on cost–benefit analysis is essential for the different LID strategies with different costs and benefits. The cost–benefit analysis of LID implementation involves making a tradeoff between the implementation effect and the input cost [28,29]. Studies have shown that LID practices have positive cost–benefit effects. In particular, Chui et al. (2016) compared the hydrological performance and cost-effectiveness of specific LID strategies, and concluded that all of the strategies considered were more cost-effective in Seattle than in Hong Kong [30]. Cheng et al. (2018) analyzed the tradeoff between the government and developers with respect to promoting the application of LID strategies in highly urbanized areas [31]. Xu et al. (2018) proposed a marginal cost and rational choice theory to solve the problem of LID multi-stage layout planning [32]. These studies all showed that the LID strategies were beneficial in terms of cost. Cost–benefit analysis aims to quantify the effects of LID implementation in terms of its environmental, economic and social benefits, thereby providing a good reference for the implementation scale and optimal location for an LID strategy. Clearly, this is particularly important for decisions regarding sponge cities.
However, there have been few quantitative cost–benefit analyses of LID. Thus, in the present study, we developed a new method for quantitatively evaluating the strength of inundation resilience by considering the inundation duration and inundation depth. In addition, from the cost–benefit perspective, we explored the optimal LID combination scenario with different degrees of resilience. Based on the study by Wu et al. (2017), we constructed a one-dimensional (1D)–two-dimensional (2D) coupled hydrological–hydrodynamic stormwater management model (SWMM) and integrated flood modeling system-urban (IFMS-Urban) to dynamically simulate the accumulation of inundation water in the southwest part of Maozhou River in Gongming, Shenzhen, China [33]. Ten different scenarios were considered for the construction of LID practices. An inundation partition matrix was constructed while considering the two inundation indicators. The inundation resilience was calculated in different scenarios and zones, and the cost-effectiveness was evaluated. Based on comparative analyses of the resilience with different optimization strategies, we explored the improvement benefits of LID practices among different resilience zones in order to identify the optimal scenario based on a cost-effectiveness indicator (CEI).

2. Materials and Methods

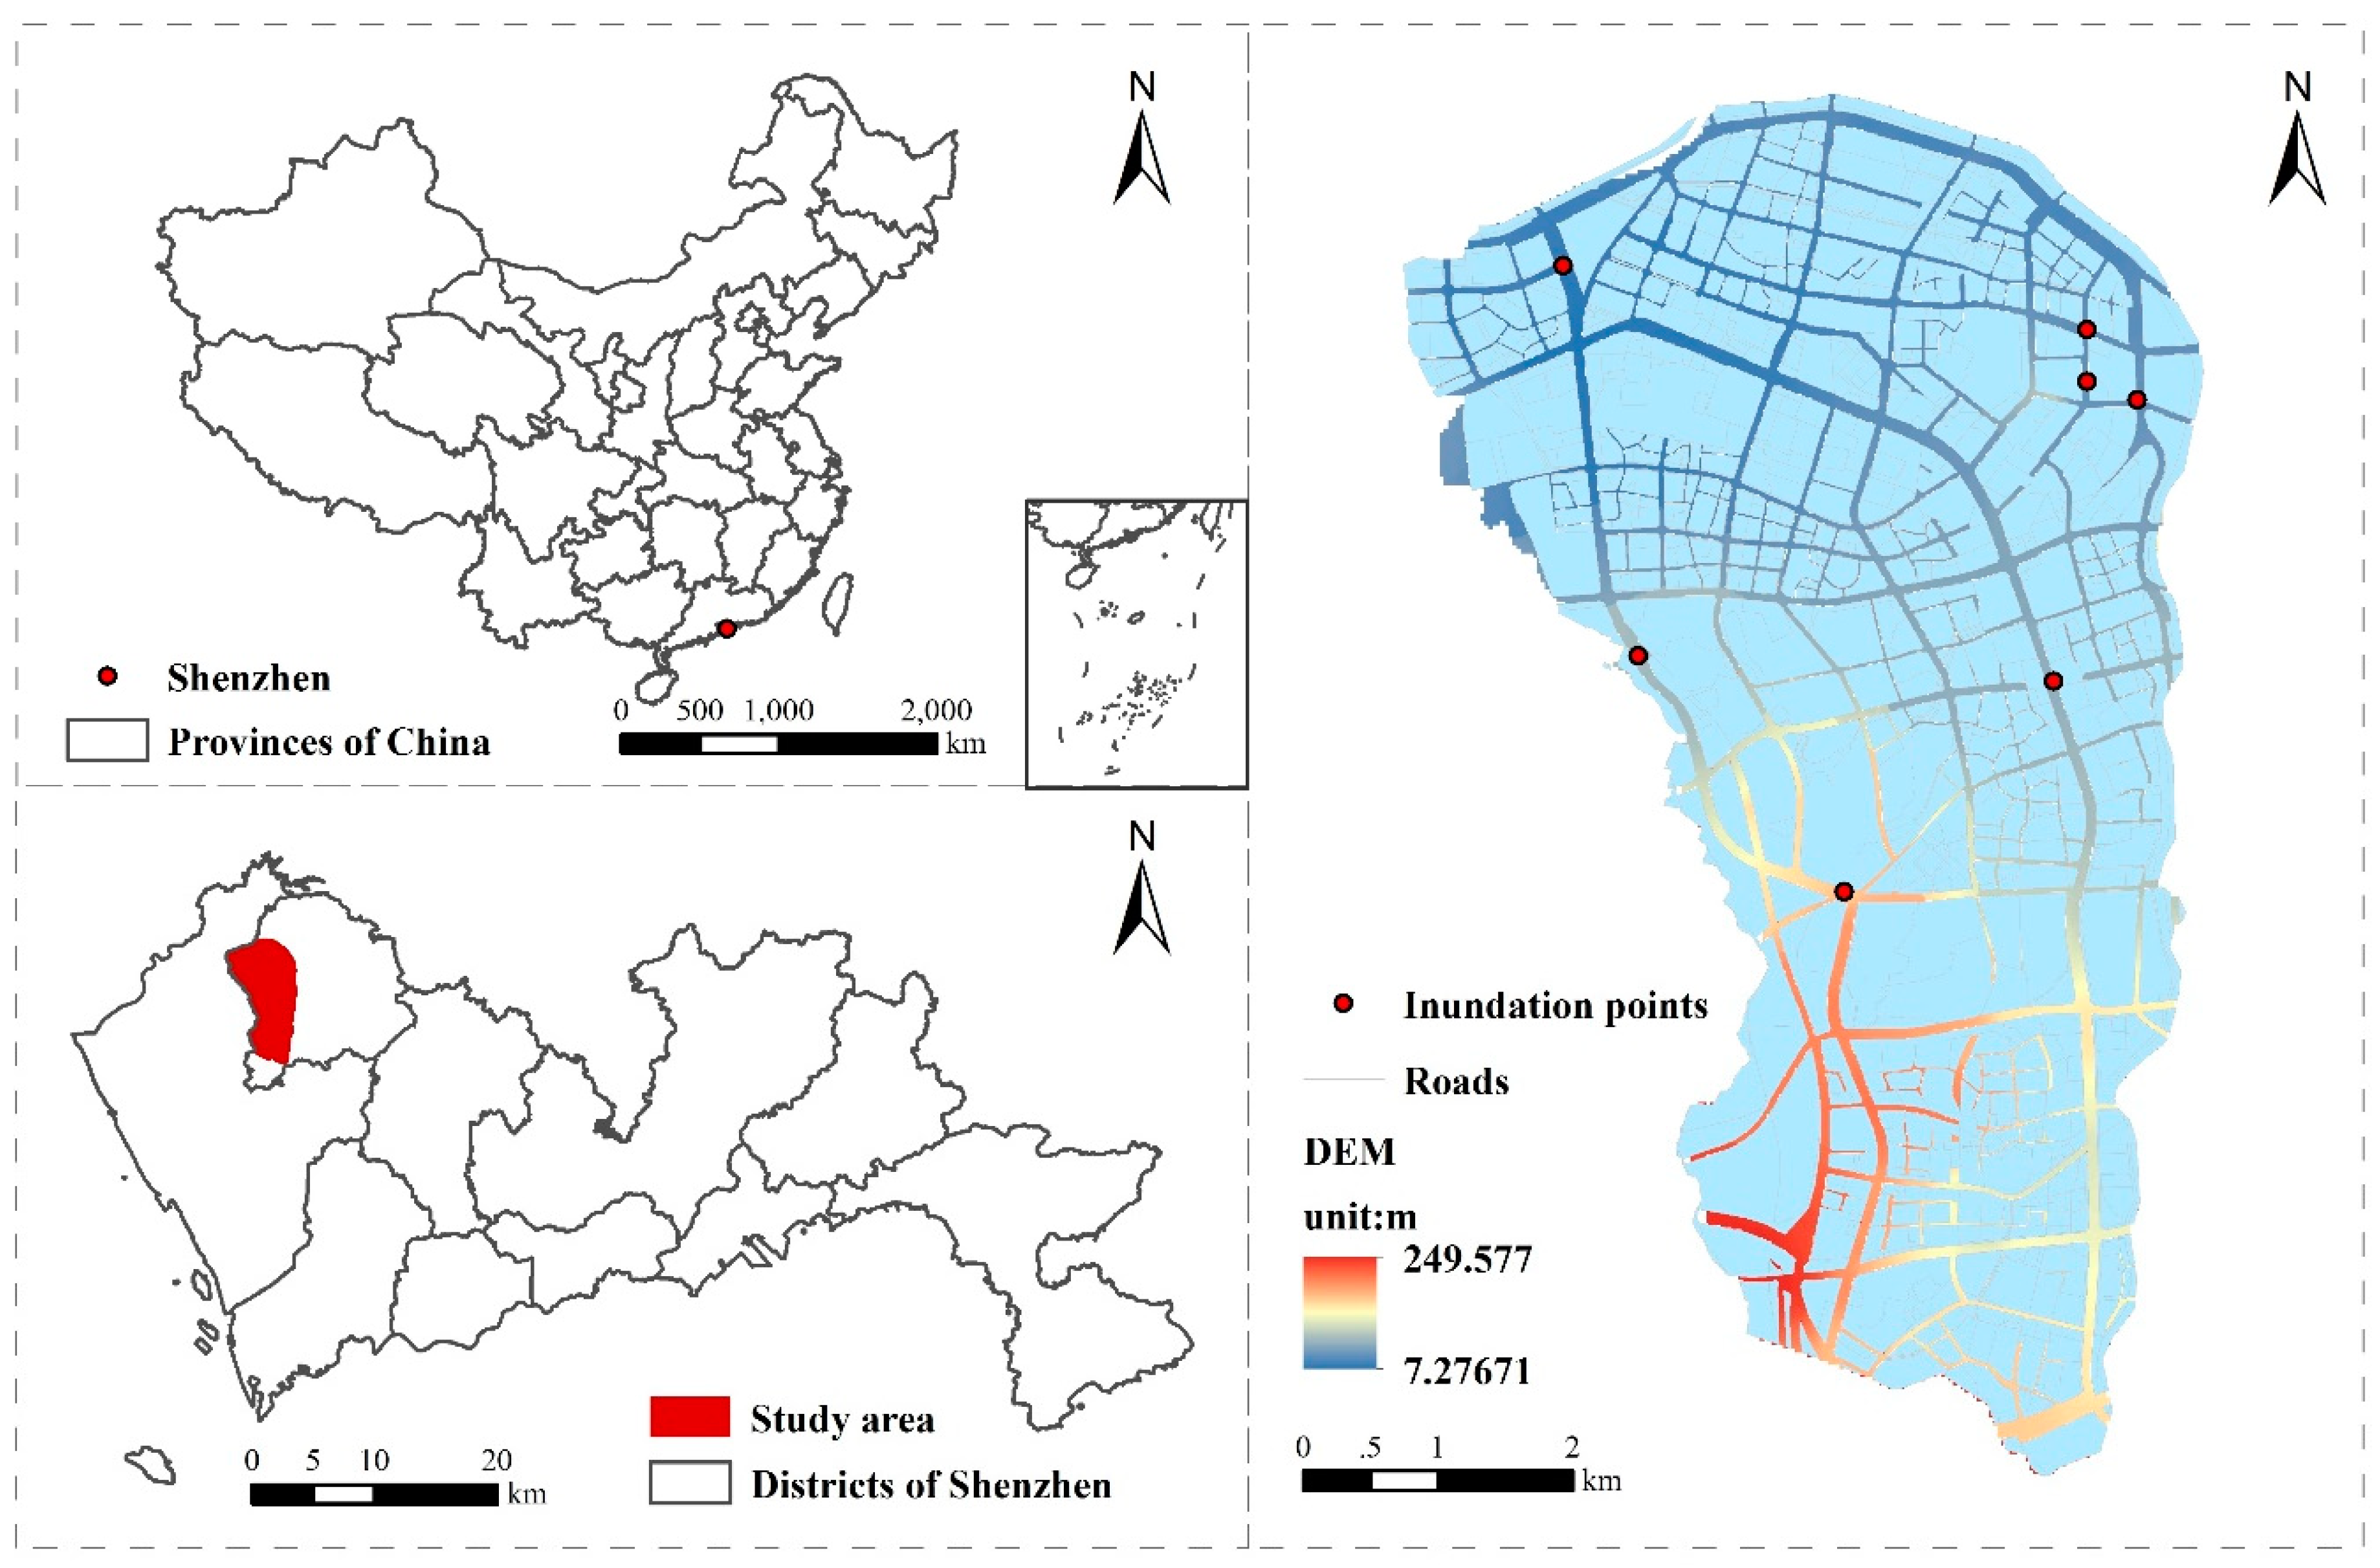
2.1. Study Area and Data Collection

The study area, Gongming, is located in the southwest of Guangming New District, Shenzhen, South China (Figure 1). The total area is 37.68 km2, where 26.31 km2 (69.8%) is construction land with a high development density and residential density. It is located in the coastal area, and has a subtropical maritime climate with concentrated precipitation and frequent short-term rainstorms. It has an advanced economy and large population but immature drainage systems [34]. Due to the poor geographic factors and drainage infrastructure, Gongming suffers severe flooding in the rainy season every year and the urban resilience requires much improvement [35,36]. Thus, Gongming was selected as a pilot project for the construction of Sponge City System, which is regarded as an effective mechanism to manage rainwater and reduce flooding severity due to its capacity to promoting infiltration and retaining rainwater in China. The comprehensive application of LID facilities has been applied widely in Guangming New District. The government has laid out dotted LID measures such as green roof, detention pond and reservoirs; linear LID measures such as permeable pavement, ecological grass ditch and buffer strip; and planar LID measures such as vegetative swale and estuary wetland [37,38]. These measures have obtained some benefits, and because of the terrain and building structure, green roof, permeable pavement and vegetative swale are the most popular strategies in the study area.
Considering the availability and feasibility of models, we selected the 1D–2D coupling method proposed by us in 2018 [33]. The general idea of model is combining a 1D pipe network model (SWMM) for simulating the dynamic precipitation-runoff process in urban areas and a 2D urban intrinsic analysis platform (IFMS Urban) for surface submergence analysis of urban rainstorms in order to simulate the dynamic urban flooding process and provide data to support the resilience assessment. The data used in this study are shown in Table 1. In order to verify the reliability of the model, data for the inundation points on May 11 in 2014 were used to calibrate the parameters and those on May 10 in 2016 were used to validate the adjusted model. The result showed that the errors in terms of the calibration and verification of the final model were both below 20%, which met the requirements of the Standard for Hydrological Information and Hydrological Forecasting in China (GBT_22482-2008), and the accuracy of the model agreed with the experimental expectations.

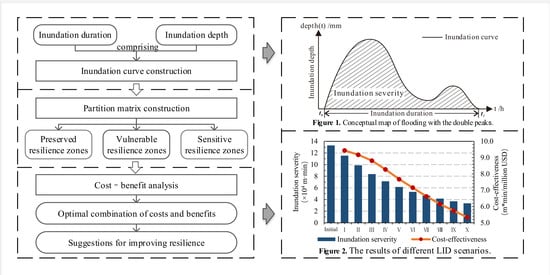
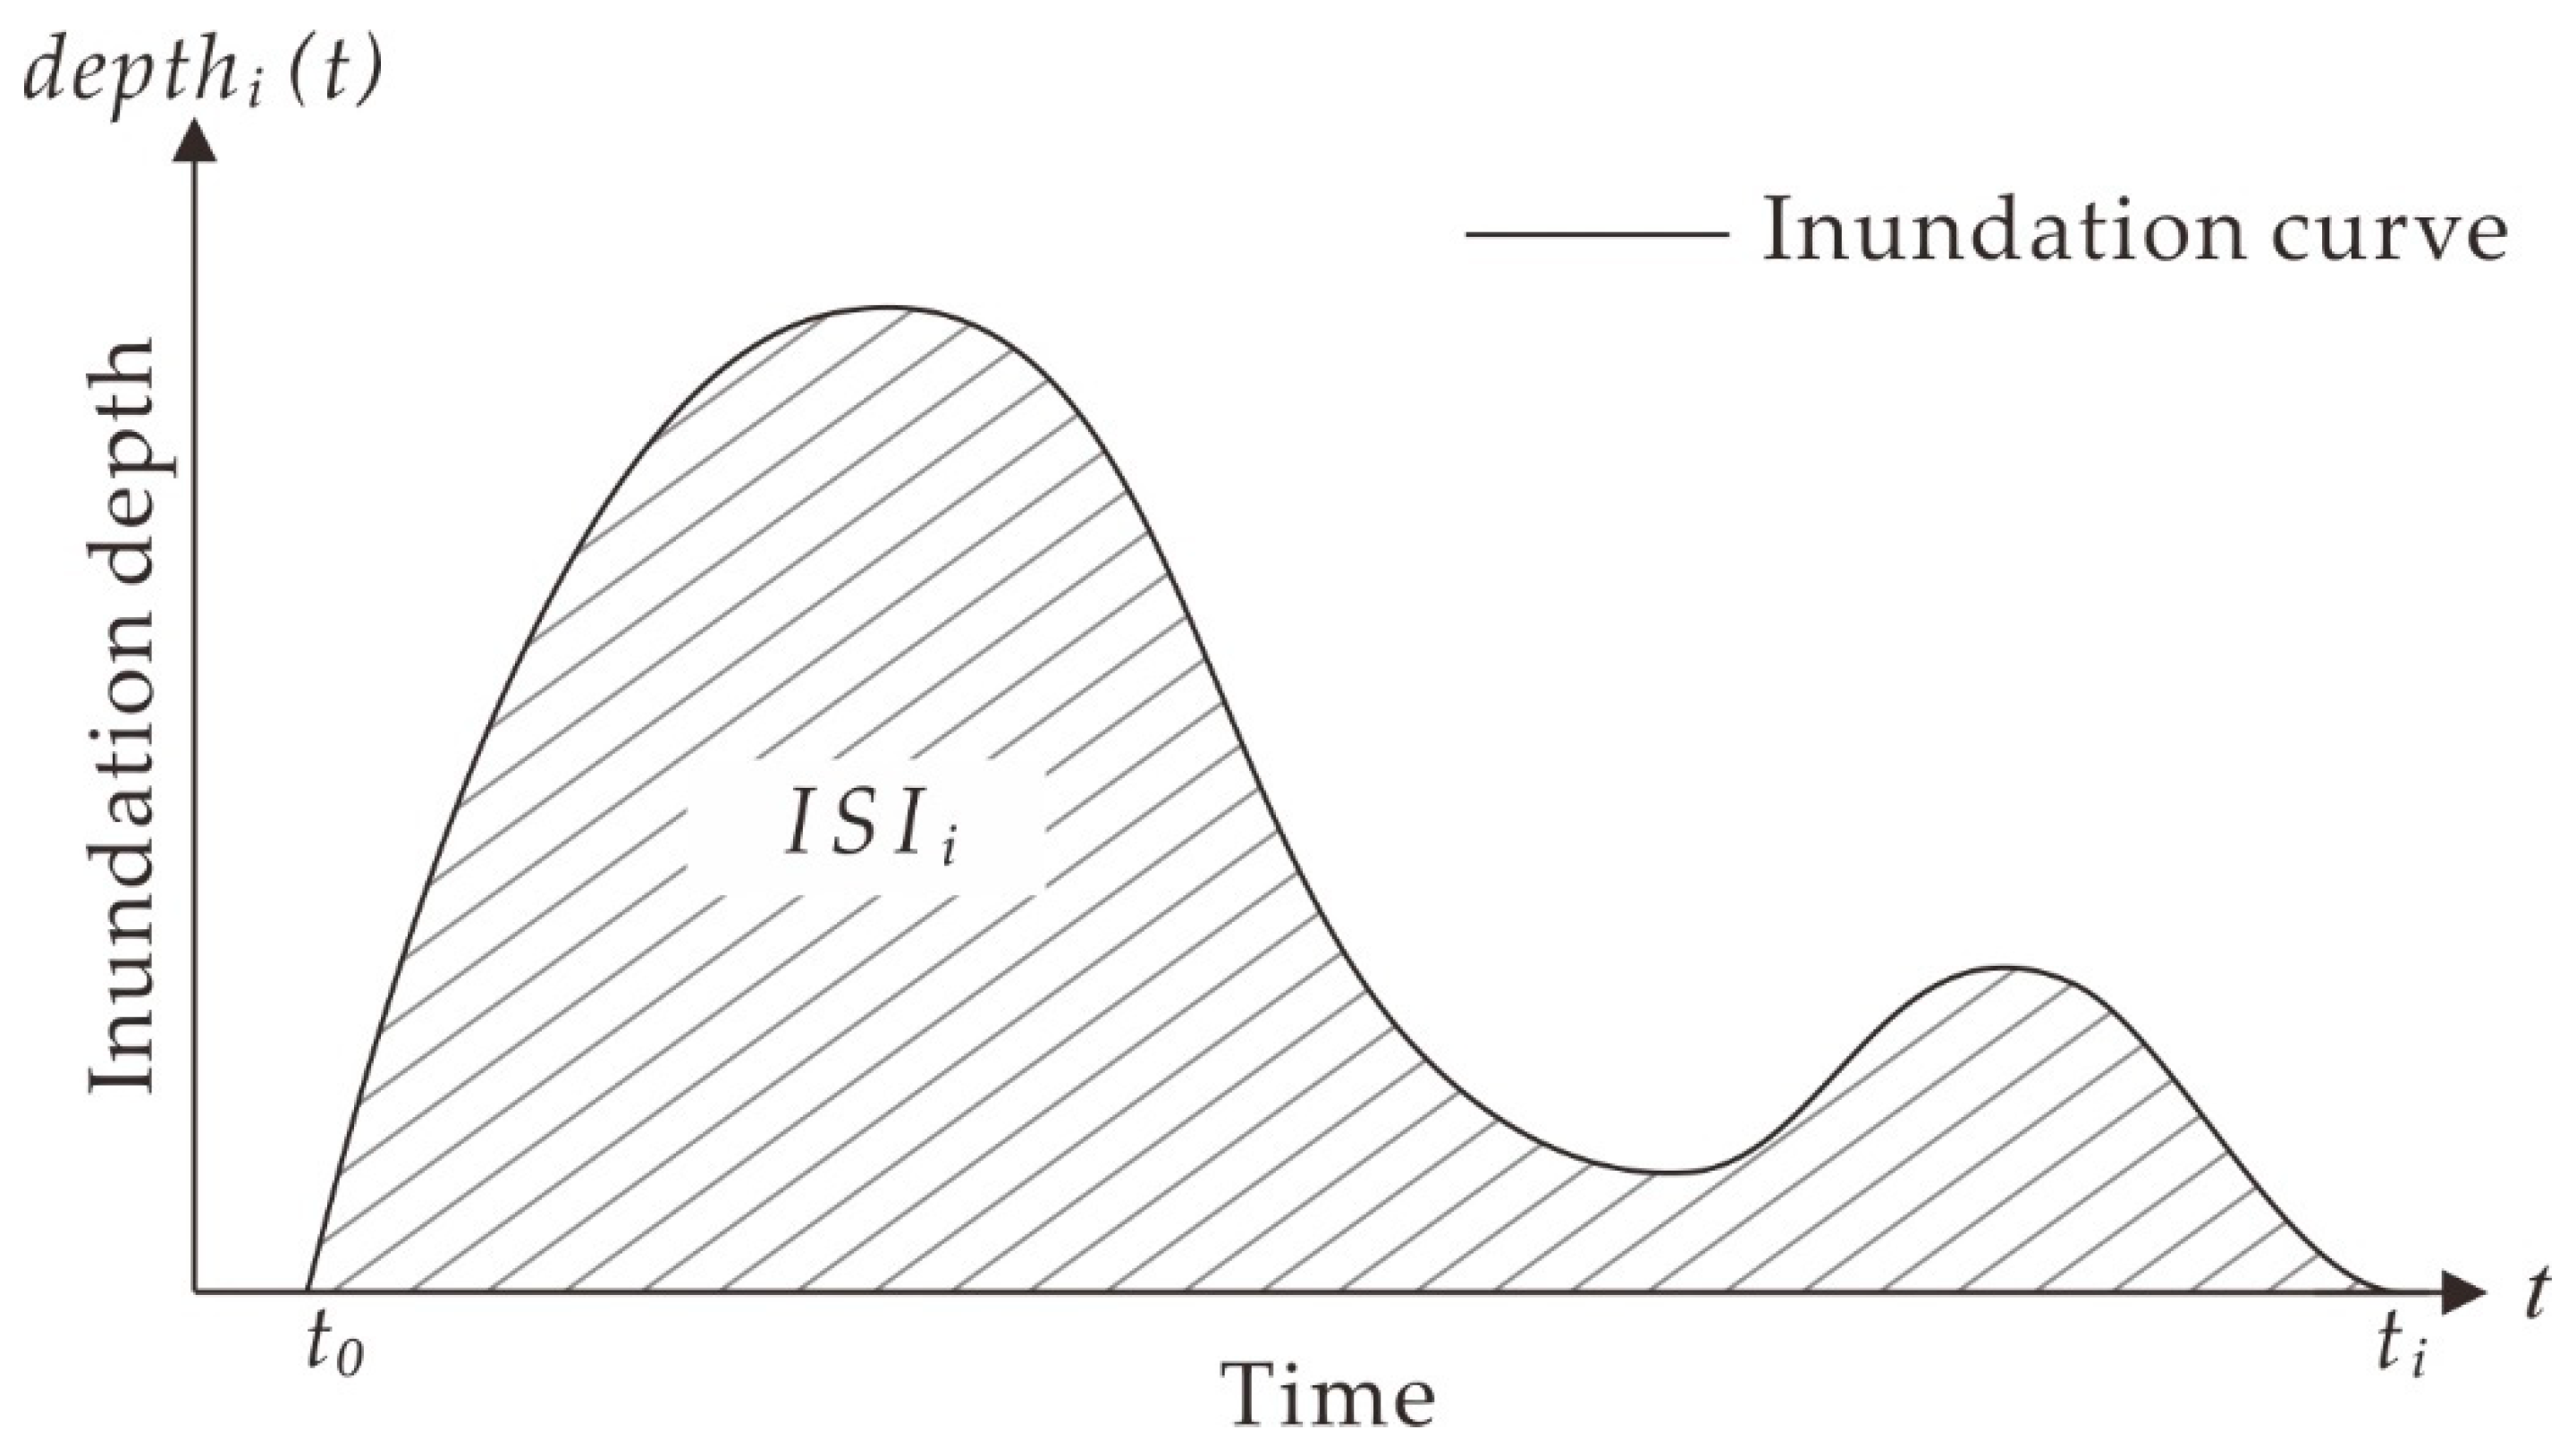
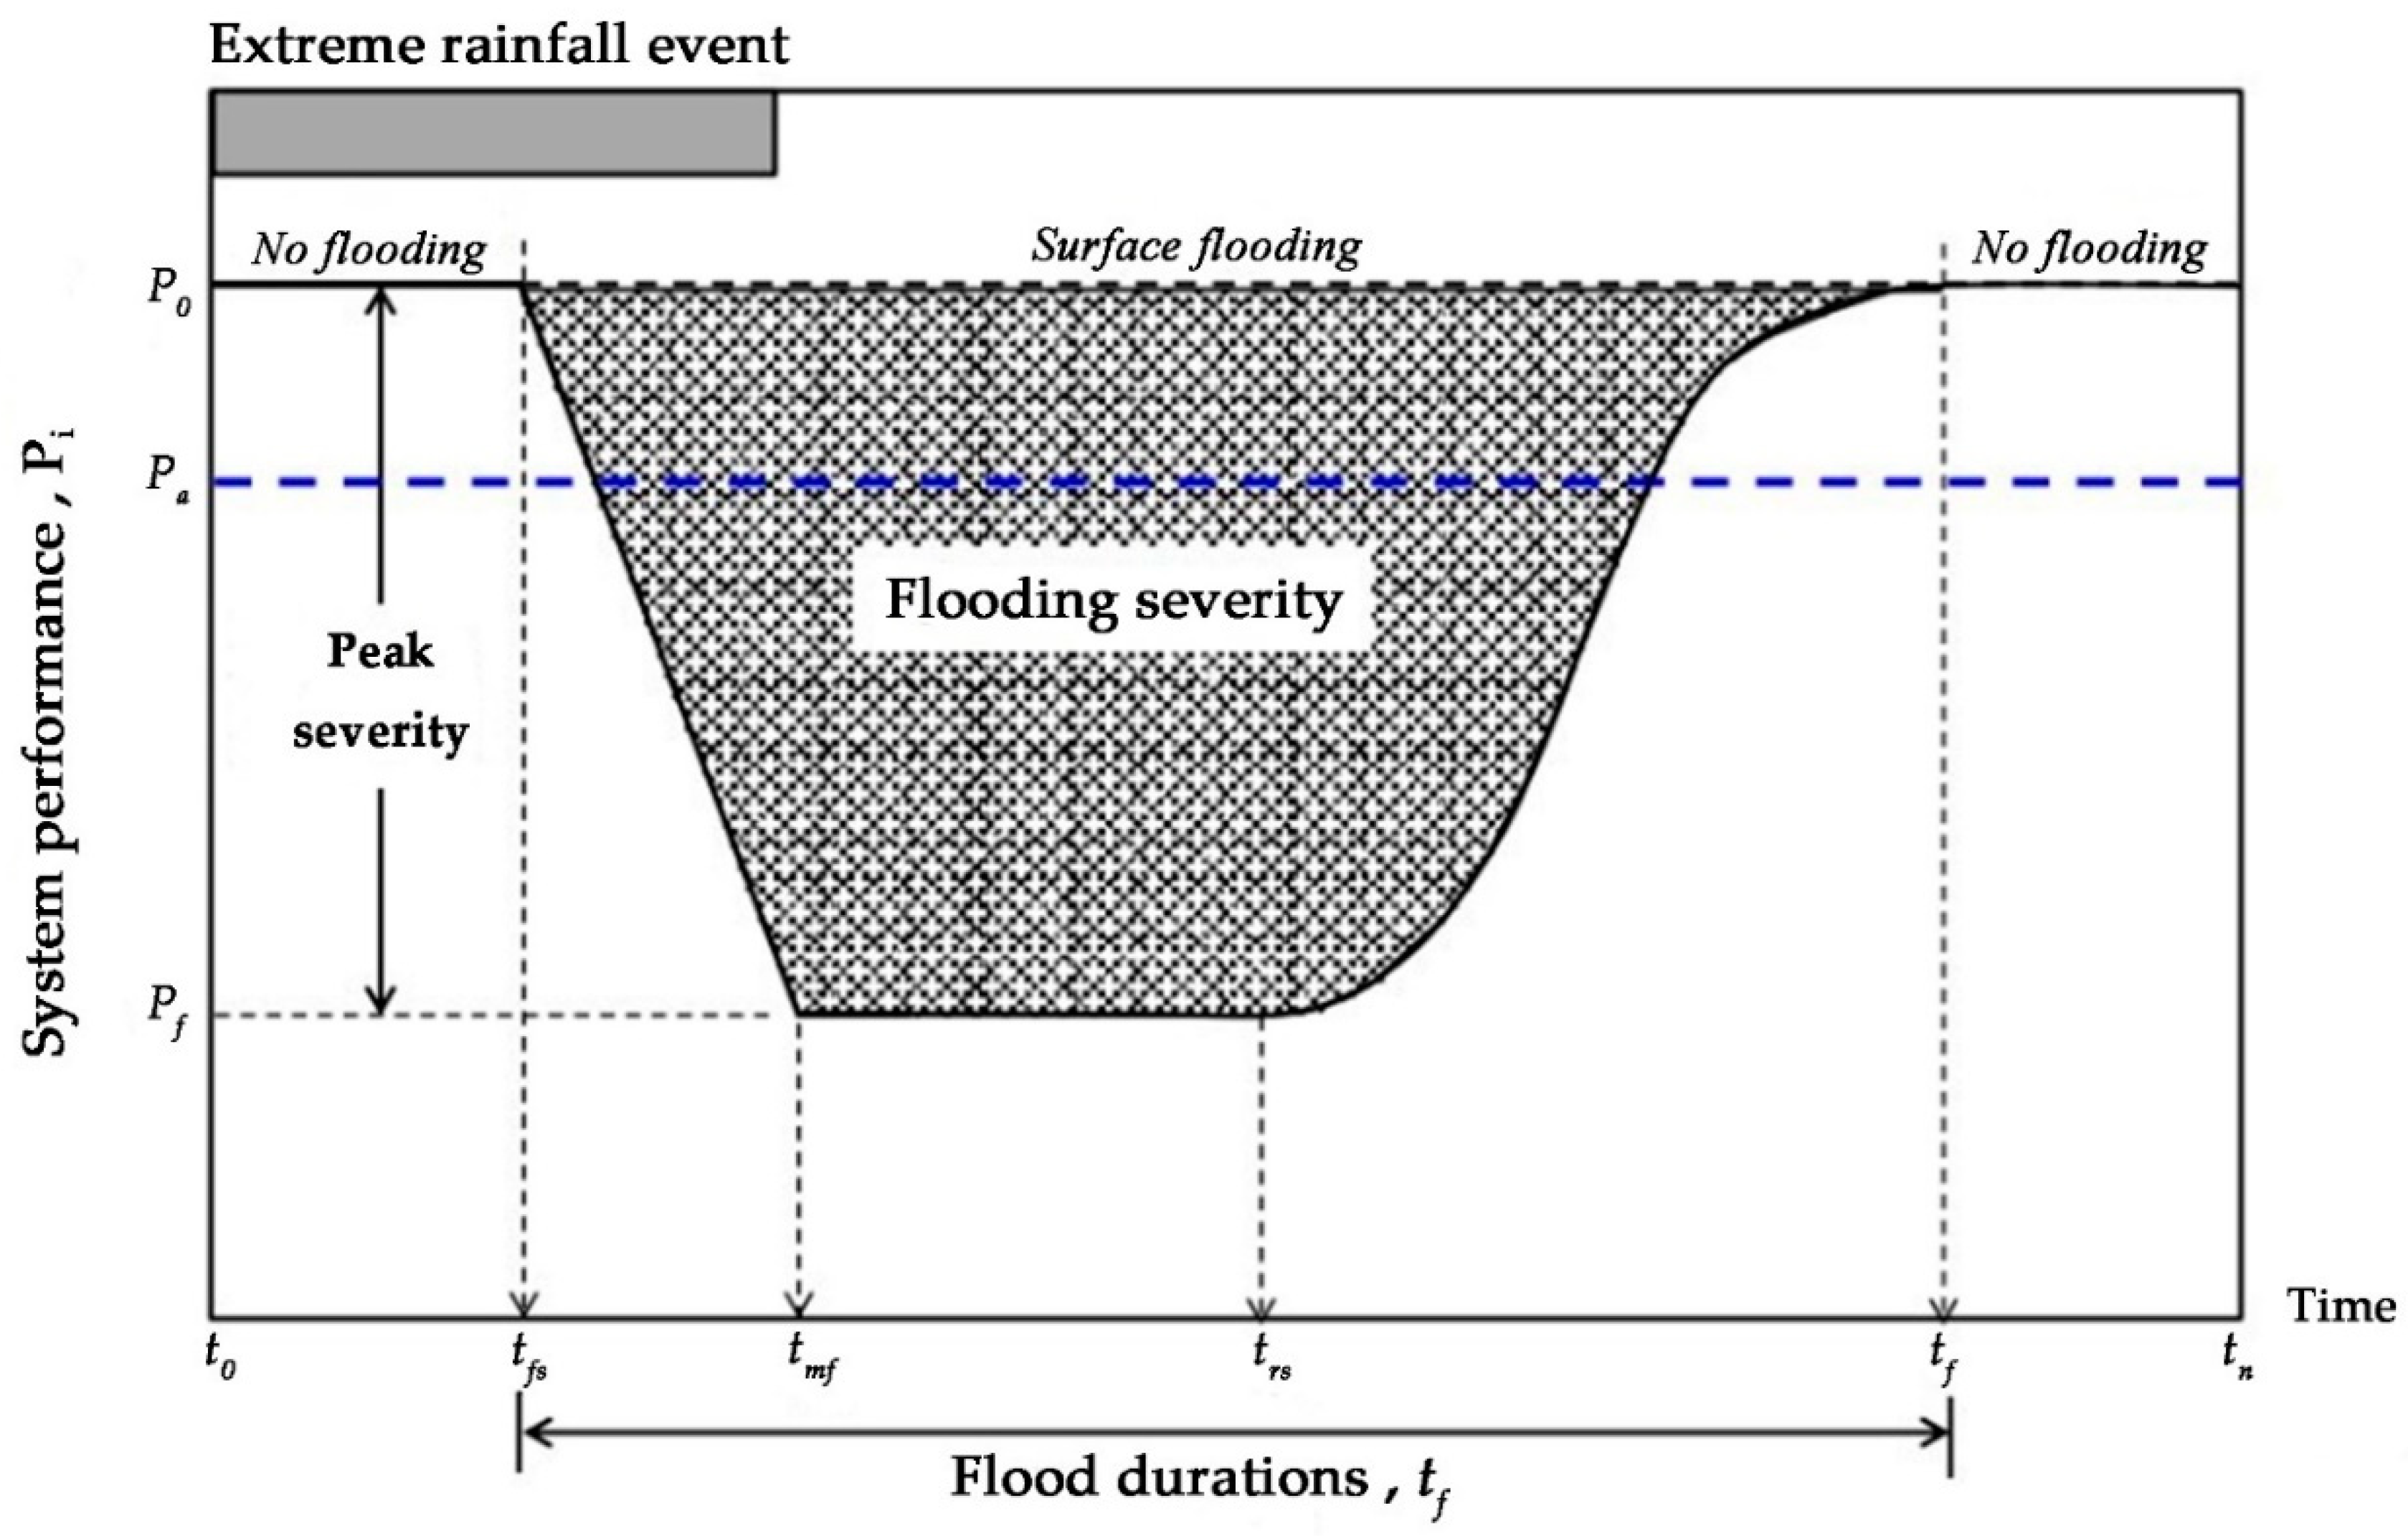
2.2. Analytical Framework

Quantitative assessments of urban resilience have facilitated the sustainable development of urban resilience research and some studies have investigated the nonlinear relationship between the inundation depth and disaster damage [22,39]. In particular, Mugume et al. (2015) proposed an important global analysis approach for investigating structural resilience in urban drainage systems [26]. In the study, based on the theoretical system performance curve (Figure A1, Appendix A), we constructed the inundation curve to quantitatively evaluate the severity of flooding (Figure 2) and we hypothesized that a flooding disaster would be more severe and the system’s functional loss would be greater when the inundation depth was deeper and the duration was longer. The time integral of the inundation curve at each inundation point was designated as the inundation severity indicator (ISI) with Equation (1) for the point. A higher ISI value denotes a greater system function loss, a more serious flooding disaster, and weaker resilience of the system, whereas a smaller value indicates a lower system function loss, a less severe flooding disaster, and the stronger resilience of the system.
I S I i = t 0 t i d e p t h i ( t ) d t
where t 0 represents the time when the rainstorm starts, t i represents the time when the rainstorm ends in scenario i, and d e p t h i ( t ) represents the inundation depth at time t in scenario i.
In order to reduce the disaster relief cost and improve the efficient use of limited resources, it was necessary to evaluate the benefits of flooding disaster relief. We employed the cost–benefit analysis method to explore the relationship between resilience improvement benefits and strategy costs [40,41]. We evaluated the project value by quantitatively comparing all the construction costs and benefits of the project, and then determined the maximum benefits with the minimum cost in the investment decision. In this study, the costs of LID refer to the construction input invested in the early stage of LID measures, excluding the maintenance costs. This is because different strategies have different life cycles and the maintenance costs may change as time goes on, and the maintenance costs are relatively low compared with the input costs. The benefits of LID are represented by the reduced value of the inundation severity compared with the initial scenario. Therefore, the CEI was constructed with Equation (2), where the numerator denotes the improved resilience relative to the initial scenario and the denominator is the corresponding cost for the scenario
C E I i = I S I 0 I S I i C o s t i , i = 1 , 2 , 3 , , 10
where I S I i represents the severity of flooding in scenario i, I S I 0 represents the severity of flooding in the initial scenario, and C o s t i represents the construction cost of the LID strategy in scenario i. A larger CEI value indicates the higher cost-effectiveness of the scenario.

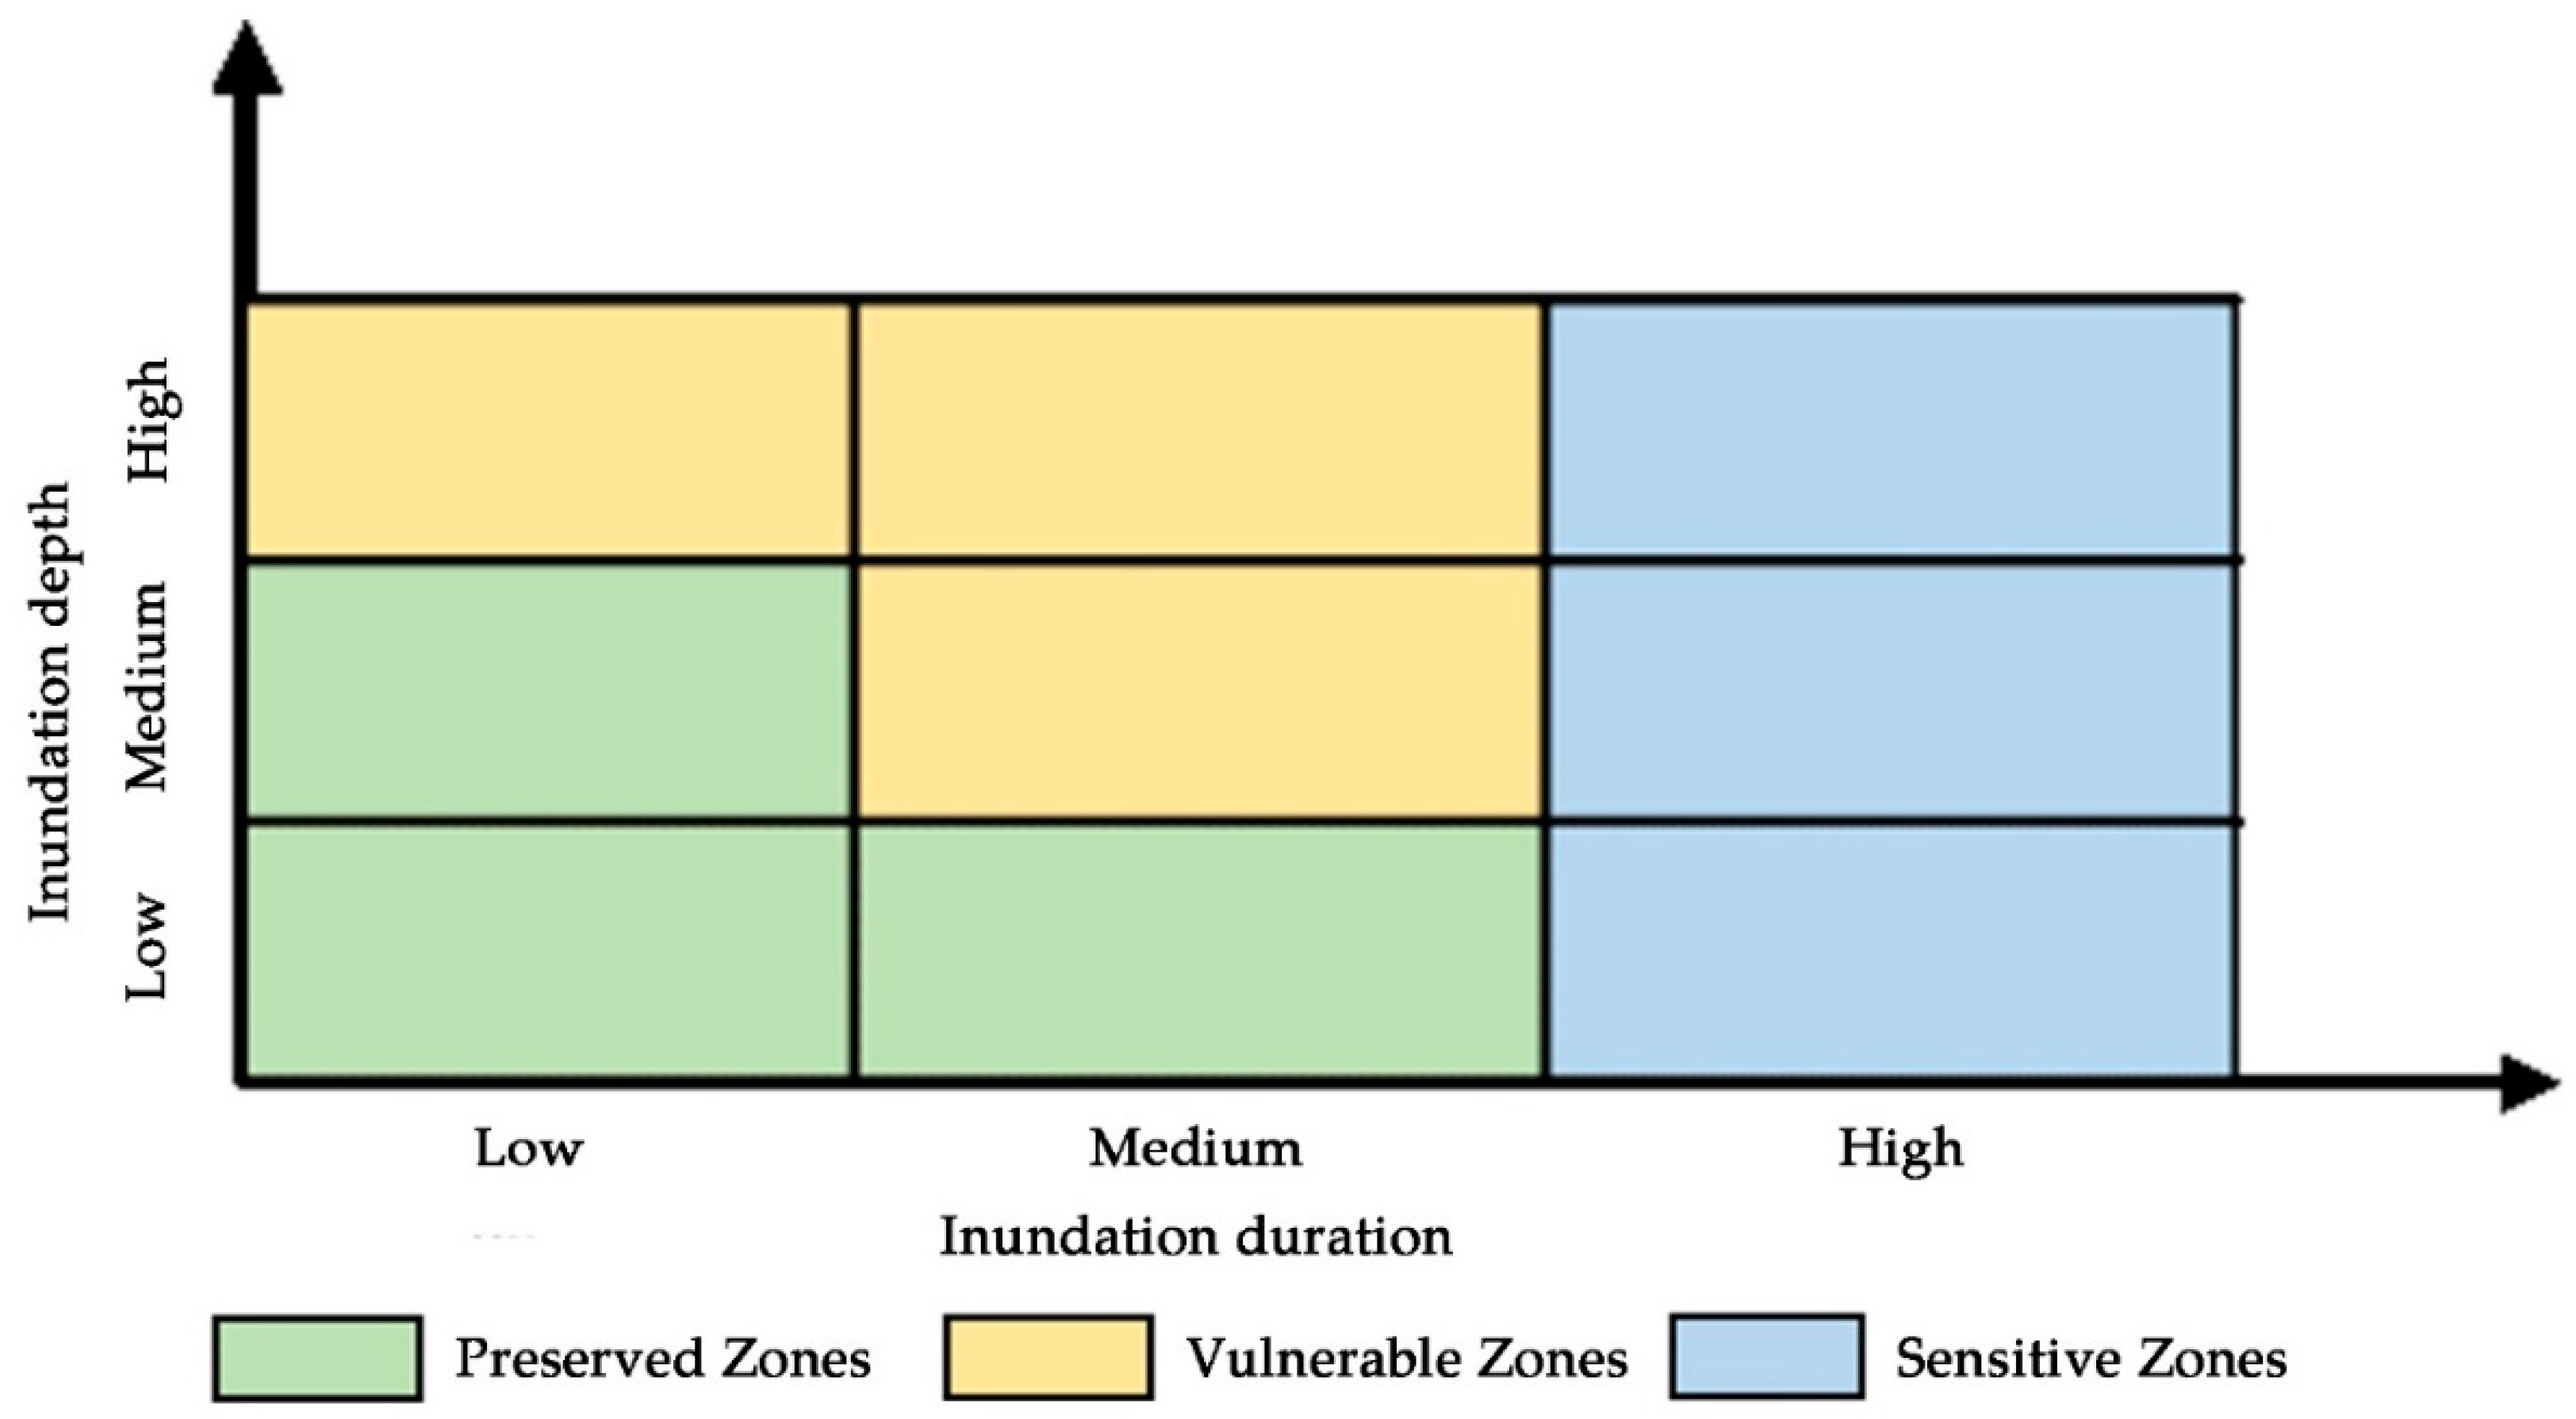
2.3. Partition Matrix Construction

According to the conceptual map of the inundation curve, the ISI was determined according to two dimensions comprising the inundation depth and inundation duration. Therefore, using the two factors, we divided the study area into three resilience zones to further explore the differences in the performance of the LID strategy among zones, before determining the optimal solution for improving the efficiency of LID practices.
First, we classified the degree of rainstorm events in 2014. In terms of the inundation depth and according to the relevant regulations in the Code for Design of Outdoor Wastewater Engineering (GB 500014-2006), three depth levels were set comprising 0–0.15, 0.15–0.35, and >0.35 m. The inundation duration was divided into three levels using the natural breaks method in ArcGIS: 0-5, 5–11, and >11 h. A risk matrix was constructed to partition the study area into three zones (Figure 3). Based on the initial scenario, low-low, medium-low, and low-medium regions were merged into Preserved Zones, which had relatively sound infrastructure with a low degree of inundation risk and a high degree of resilience. The medium-medium and medium-high regions were merged into Vulnerable Zones, which had higher ISI values and a greater risk of disaster. Therefore, they were vulnerable to inundation and their resilience to flooding needed to be improved urgently. The high-low and high-medium regions were merged into Sensitive Zones, which had poor infrastructure and relatively low terrain, and they suffered the most frequent disasters with the longest duration of flooding. The low-high and high-high regions were not considered as resilience partitions in this study.

2.4. Simulations of LID Combination Scenarios

Based on previous studies and considering the feasibility of LID practices in the study area [40,41,42], we selected three types of LID practices comprising green roof (GR), permeable pavement (PP), and vegetative swale (VS) to dynamically simulate the urban inundation process. Referring to previous studies [42,43,44], the parameters of the three LID strategies are shown in Table A1. GR refers to the use of plants on the roofs of buildings on the premise of full consideration of feasibility. PP refers to the engineering transformation from the originally impervious road in the residential or industrial area into permeable pavement to increase the penetration rate of the pavement. VS refers to the transformation of a park green space or community green space by sinking part of it to a certain depth in order to store and retain rainwater, where wetland plants are planted to increase the surface Manning coefficient and significantly reduce surface runoff in the area. During the field investigations, we found that there were significant differences in the roof structure and building shapes in urban villages, and the reconstruction of green roofs was more difficult. Therefore, the LID construction would follow the setting principles in Table A2.
A sponge city should be rationally planned and gradually constructed in the initial stage. Before determining the optimized LID scenarios, we combined the theoretical foundations referring to previous studies and field investigations to select suitable scenarios according to the land use type rules (Appendix A). With reference to the study of Zeng et al. (2019) [11], we chose the AVERAGE strategy—L% (L% is a predetermined percentage ranged from 0 to 100%) area of each catchment available area for LID construction. The density of LID construction in all transformable areas was regarded as 100% and various proportions ranging from 10% to 100% were set for the density of different types of LID combinations based on the rainstorm events in 2014. For example, in scenario I, 10% GR + 10% PP + 10% VS represents the implementation of 10% available area of GR, PP and VS for construction in each catchment. Considering the complexity of model and the workload of the research, we selected a scale of 10% intensity difference between adjacent scenarios. The settings for the scenarios were as follows:
  • Initial scenario: 0 GR + 0 PP + 0 VS
  • Scenario I (I): 10%GR + 10%PP + 10%VS
  • Scenario II (II): 20%GR + 20%PP + 20%VS
  • Scenario III (III): 30%GR + 30%PP + 30%VS
  • Scenario IV (IV): 40%GR + 40%PP + 40%VS
  • Scenario V (V): 50%GR + 50%PP + 50%VS
  • Scenario VI (VI): 60%GR + 60%PP + 60%VS
  • Scenario VII (VII): 70%GR + 70%PP + 70%VS
  • Scenario VIII (VIII): 80%GR + 80%PP + 80%VS
  • Scenario IX (IX): 90%GR + 90%PP + 90%VS
  • Scenario X (X): 100%GR + 100%PP + 100%VS

2.5. Cost-Benefit Analysis of Optimal LID Solution

According to the CEI values, a relatively superior scenario could be identified, but it might not be the best because of the same density of different LID measures. Therefore, it was necessary to determine the possible optimal combinations of the LID strategies in the study area. Different LID measures vary in terms of their performance at resilience improvement [45]. Thus, in order to determine the optimal combination, we calculated the reductions in the ISI and CEI values with the three different LID strategies by considering GR, PP, and BS separately as single resilience promotion strategies. Ten different resilience scenarios were tested for each LID strategy with a step size of 10% ranging from 10% to 100%, before conducting cost–benefit analysis for the 30 specified scenarios. After determining the optimal single LID strategy, we added two other LID strategies in turn until the optimal solution was found.
Based on previous studies and investigations of the actual situation in the study area [30,46], we obtained preliminary estimates of the costs of the LID strategies with the different settings, as shown in Table A3. The estimated costs of GR, PP and VS per square meter were 18.90, 23.80 and 9.68 USD, respectively. When the LID practice proportion was 100%, the areas transformed with GR, PP and VS were 7.84, 4.10, and 3.29 km2, respectively, and the corresponding estimated costs were 148.18, 97.58, and 31.85 million USD. Thus, we calculated the cost of each scenario with various proportions of different types of LID combinations.

3. Results

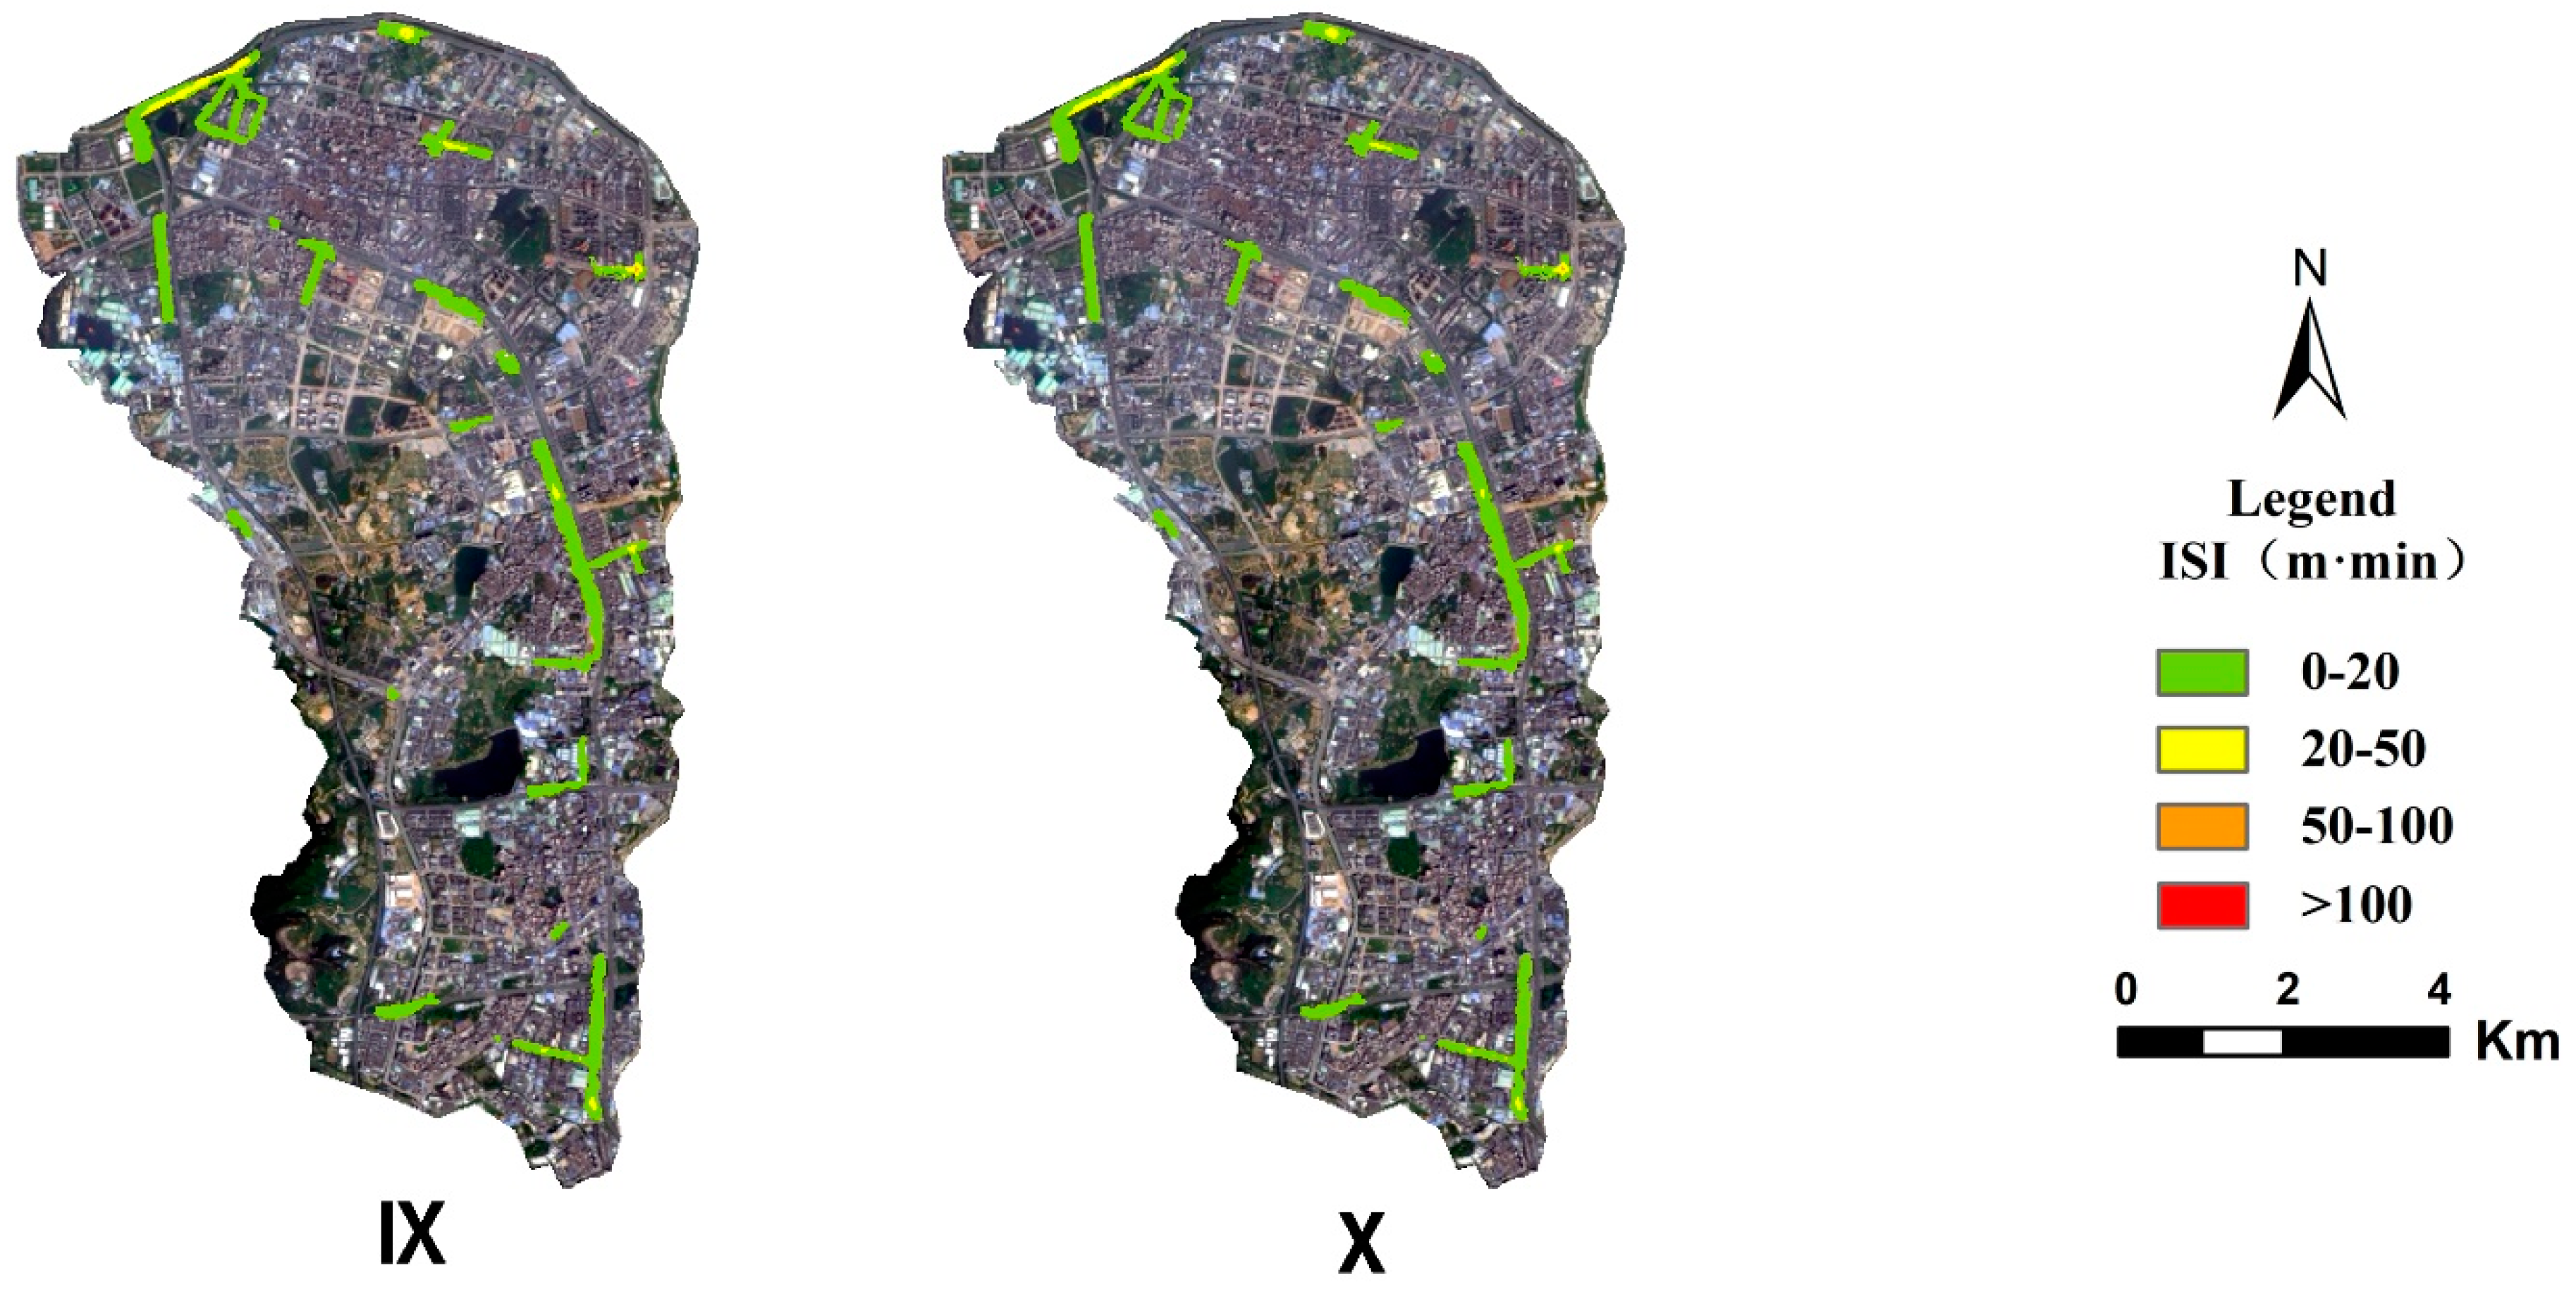
3.1. Spatial Distributions of Different ISI Values

The calibration and verification errors for the model were within 20%, which agreed with our expectations. The inundation curves for 7745 inundation points in different scenarios were integrated over time, and maps showing the distributions of the ISI values are presented in Figure 4. Based on the initial scenario, we found that the ISI values mostly ranged between 0 and 20 m·min, and a wide range of areas suffered from inundation disasters. The inundation disaster areas were mainly distributed at the intersections and by the sides of roads. The high-value areas were mostly distributed in the northeast of the study site. The intersection (point A) of Donghuan Road (south–north direction) and Bieshu Road (east–west direction) was most severely affected, and the ISI value was much higher than 100 m·min. The surrounding roads were similarly affected. In the northern part of the study area, Beihuan Road (northwest–southeast direction) was also severely affected, especially at the intersection (point B) of Beihuan Road and Fuli Road, where the ISI also exceeded 100 m·min. With the enhanced LID strategy, the flooding area decreased and the ISI value obviously decreased. Under scenario III, the flooding area decreased greatly compared with the initial scenario, and point A was the only point where the value was greater than 100 m·min. Under scenario VIII, only the ISI values at points A and B were in the range from 50 to 100 m·min, whereas the others were all less than 50 m·min. Under scenario X, the flooding area was 0.52 km2, which was 68% less compared with the initial scenario, and the ISI value was generally controlled at less than 20 m·min. The degree of inundation was alleviated greatly. Table 2 intuitively shows the changes of inundation area and average inundation depth from the initial scenario to scenario X. With the increase in LID construction, the value of inundation area and average inundation depth gradually decrease, but the deceleration rate slows down.

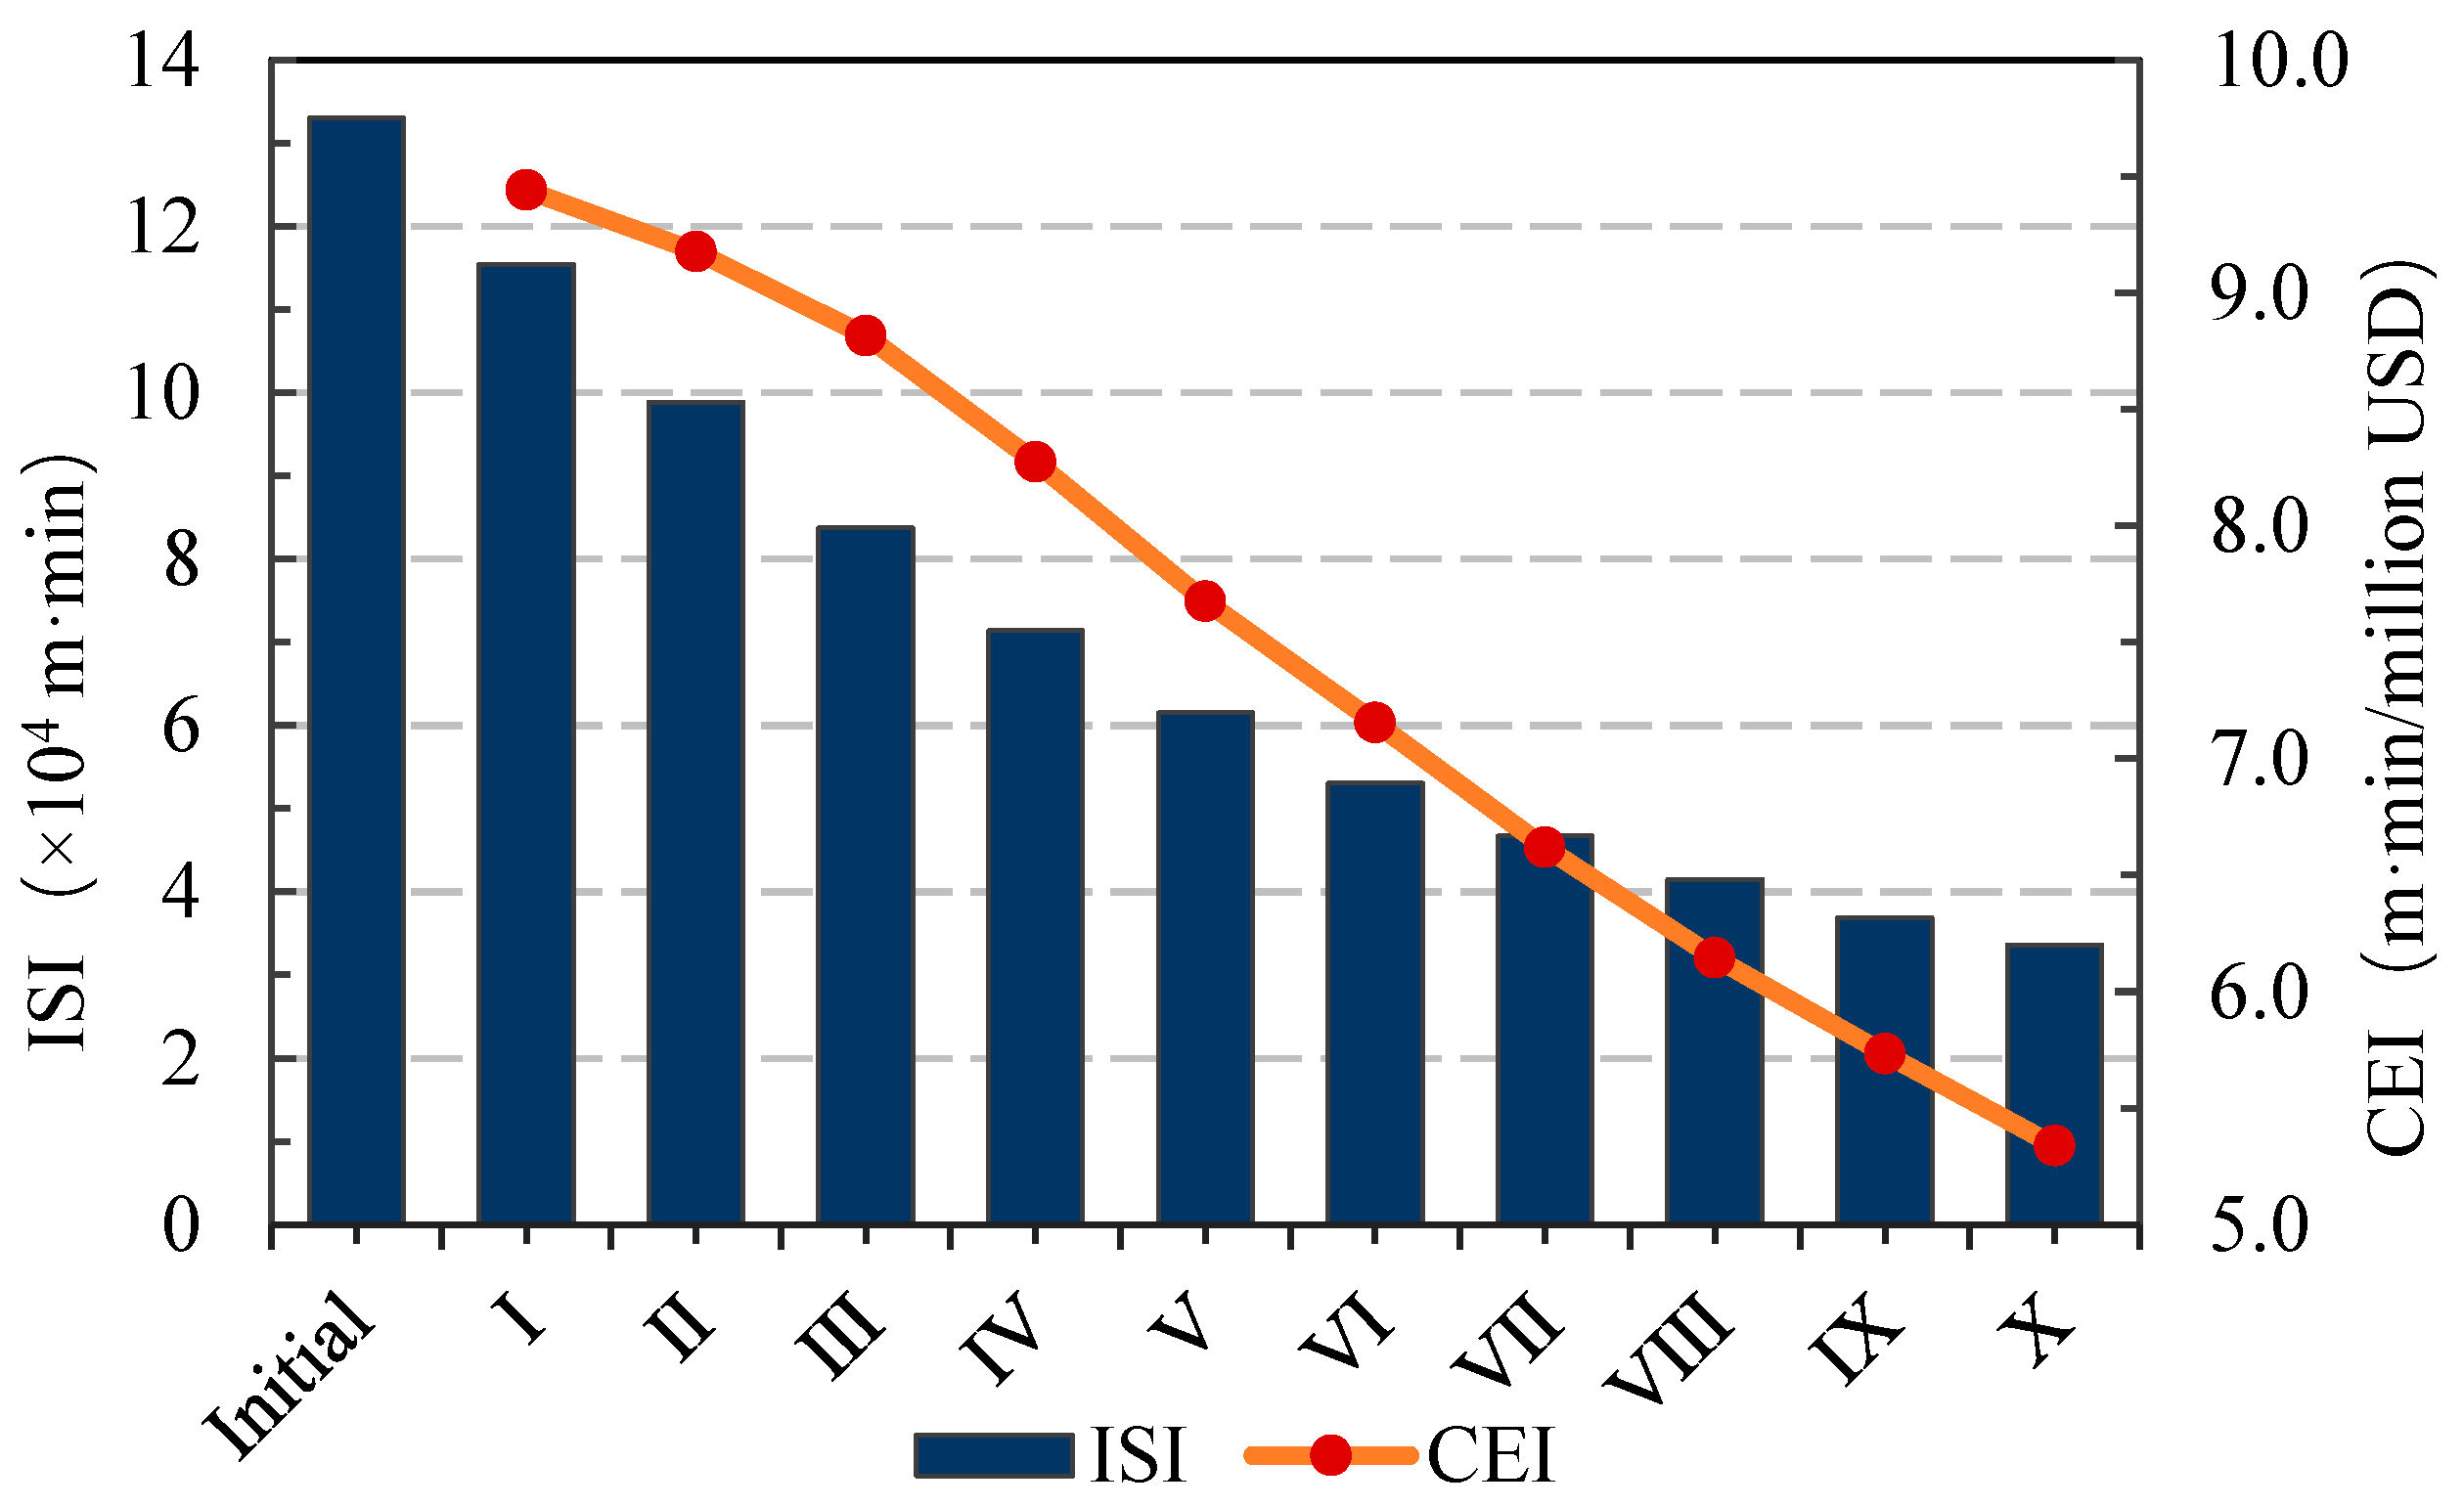
3.2. Overall Impact of LID

The LID construction results obtained under different scenarios are shown in Figure 5. We found that as the implementation density increased, the ISI value gradually decreased from 13.3 × 10⁴ m·min under the initial scenario to 3.4 × 10⁴ m·min under scenario X. However, the rate of ISI reduction decreased slowly as the rate of the implementation of the LID strategy increased, and the implementation of the resilience strategy exhibited diminishing marginal efficiency. Thus, in order to balance the strategy costs and effectiveness, we explored the optimal cost–benefit solution.
We calculated the reduction in the ISI value and the corresponding cost of LID construction in each scenario. The results showed that the reduction in ISI increased slowly initially from 1.8 × 10⁴ m·min under scenario I to 9.9 × 10⁴ m·min under scenario X, and the inundation resilience of the system steadily improved. However, the CEI value for the whole study area gradually decreased from 1.32 to 0.74 m·min/million as the LID implementation increased. Thus, the overall cost–benefit performance was higher in the early LID strategy implementation stage. The cost-effectiveness gradually decreased as the implementation of the resilience strategy increased.

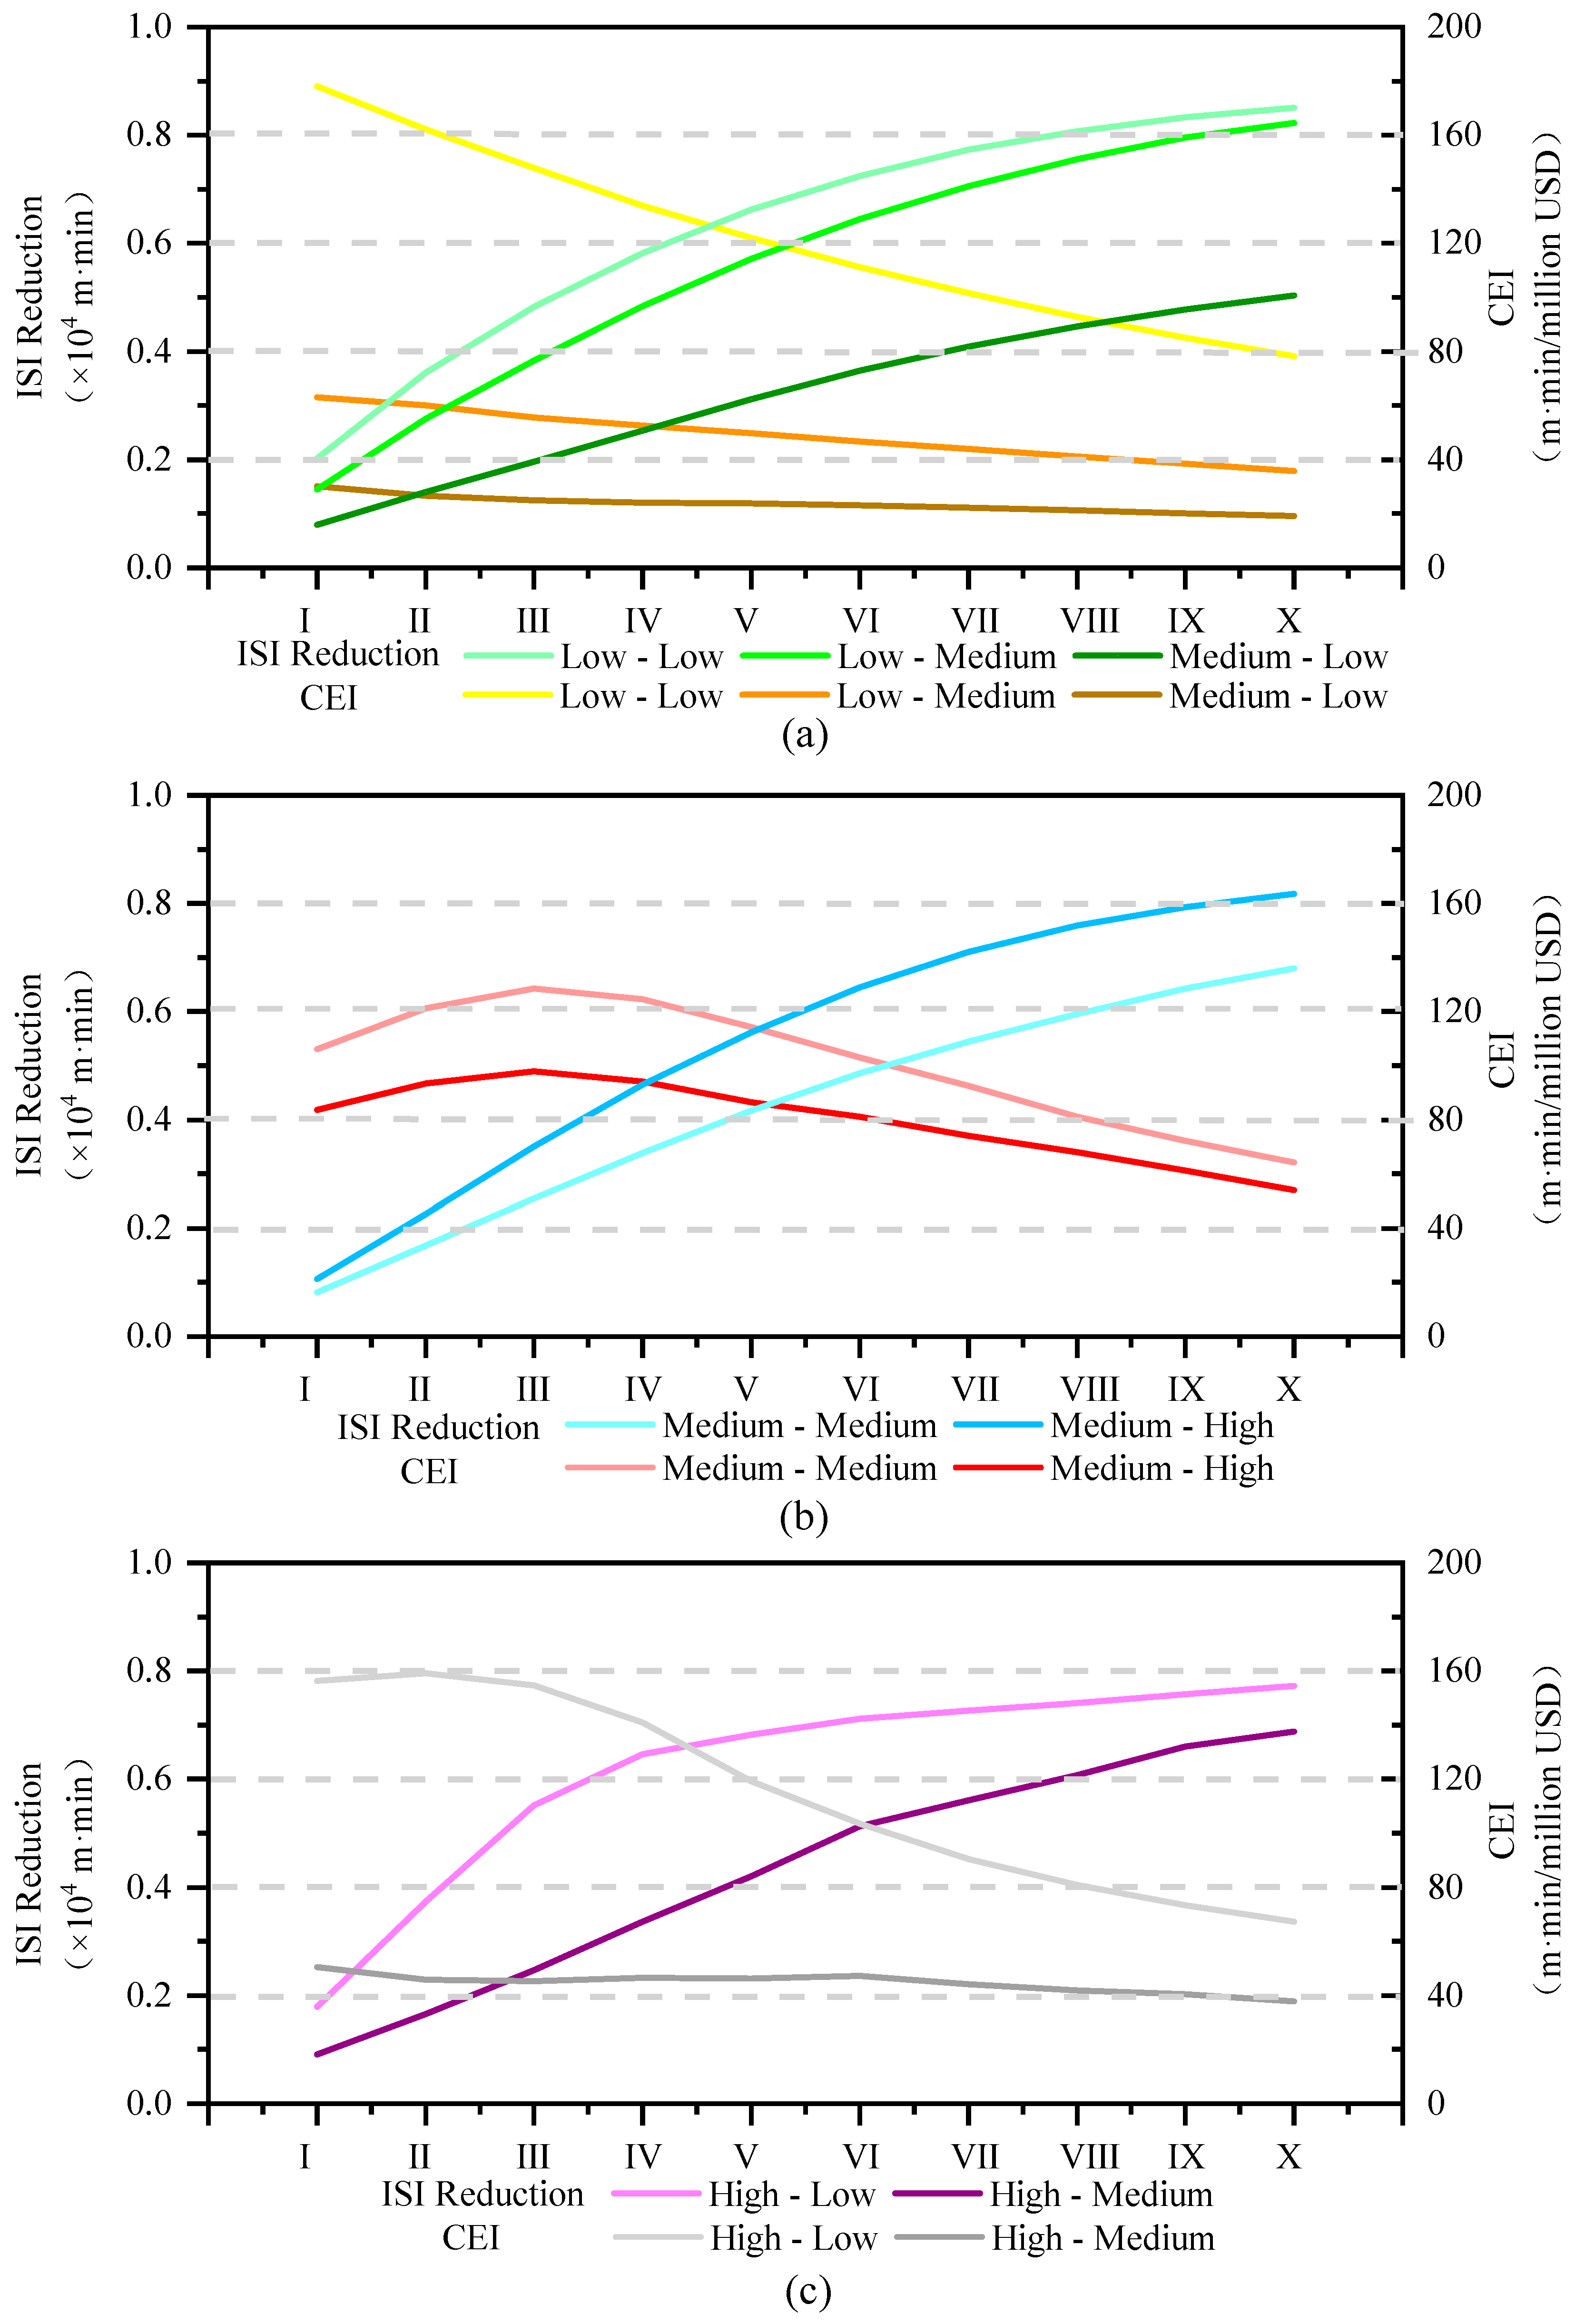
3.3. Performance of Different Zones

As shown in Figure 6, the changes in the three zones were generally similar. From scenario I to scenario X, the trends in the reduction rates for the ISI and CEIs in different zones were consistent with the overall trend. As the investment in LID transformation increased, the rate of reduction in the ISI improved but the growth rate slowed, and the overall trends in the CEI declined in all three zones. In addition, there were some differences in these three zones in terms of the shape of the curve, where the CEI varied greatly in each zone, as described in the following.
In the Preserved Zones, the reductions in the ISI values in the low-low, low-medium, and medium-low regions changed from 20%, 14%, and 8%, respectively, to 85%, 82%, and 50%. The LID strategy performed well in these zones and it significantly enhanced the inundation resilience, especially in the low-low and low-medium regions. The CEIs also gradually decreased as the LID strategy construction increased, where the CEIs in these three regions decreased from 177.86, 62.86, and 30.01 m·min/million USD, to 78.57, 35.71, and 19.29 m·min/million USD, respectively.
In the Vulnerable Zones, the reductions in the ISI values in the medium-medium and medium-high regions changed from 8% and 11% to 68% and 82%, respectively. Compared with the Preserved Zones, the disaster degree was more severe in the Vulnerable Zones, but the overall reductions were relatively lower. In addition, the CEIs in these two regions increased from 106.43 and 83.57 m·min/million USD under scenario I to 128.57 and 97.86 m·min/million USD under scenario III and then gradually decreased to 64.29 and 53.57 m·min/million USD under scenario X. Overall, the cost-benefit ratio increased initially and then decreased. Thus, compared with the other optimized resilience strategy combinations, the LID combination in scenario III obtained the highest resilience improvement effect per unit cost.
In the Sensitive Zones, the high-low and high-medium regions exhibited different trends. Similar to the other regions, the reductions in the ISI values changed steadily in the high-medium regions. However, the reductions in the ISI values increased rapidly to 64% under scenario IV in the high-low regions. Subsequently, the ISI reductions still increased, but at a lower rate, which differed greatly from the other partitions. In terms of the CEI, the reduction was relatively stable in the high-medium regions, and the CEI values varied little between each scenario. However, the CEI values in the high-low regions were relatively high under the early three scenarios, with a peak value of 159.29 m·min/million USD under scenario II. After scenario III, the cost-effectiveness declined rapidly to 65.07 m·min/million USD.

3.4. Optimal Combination of Costs and Benefits

The Vulnerable Zones were affected severely by flooding disasters and they were also the key areas for improving the resilience of the urban system. The obvious inflection points in the CEI curves obtained for the Vulnerable Zones indicated that there might be an optimal cost-benefit LID combination.
According to the results in Table 3, under the same conditions, the reduction rates in the ISI and CEI values did not differ greatly between GR and PP, but the values were both relatively low under VS. Therefore, in order to determine the optimal LID combination, we added GR at different levels based on the 60% PP scenario, which had the highest CEI among the 30 single LID scenarios, and the construction density of GR ranged from 10% to 100% with a step size of 10%. As shown in Table A4, increasing GR could improve the resilience in the area, but the highest CEI was obtained when the proportion increased to 20%, whereas the highest CEI occurred when the proportion was 70% in the single GR situation. Thus, the effects of the LID strategies on flood reduction were not a simple sum of the different effects; on the contrary, there could be synergistic and antagonistic interactions.
Next, based on the 60%PP + 20%GR strategy, we designed 10 scenarios with different levels of VS ranging from 10% to 100% in order to determine the CEI values. According to the results in Table A5 when the construction density of VS was increased to 50%, the cost–benefit ratio was highest for the Vulnerable Zones. Overall, the optimal combination scenario determined in this study was 60%PP + 20%GR + 50%VS.

4. Discussion

4.1. Optimal Combination of Costs and Benefits

In urban flooding research, resilience theory emphasizes the ability of the system to resist, absorb, adapt, and recover from inundation disasters, instead of using simple static indicators, such as the inundation depth, inundation duration, or inundation area, in order to facilitate the prevention and mitigation of urban flooding disasters [47]. Most previous studies in this area used a single evaluation index to assess the severity of inundation disasters, thereby ignoring the dynamic and complex aspects of the process [48]. In this study, the inundation curve was constructed to consider the duration and depth of inundations. This novel method significantly improves the quantification of the flooding severity.
According to the spatial distribution of the ISI values in the initial scenario, the high-value ISI areas were mostly distributed in the north and northeast of the study region, and mainly in the old town or low-lying areas. Field visits showed that the construction density was excessively high in the old town; where the density of the pipe network was lower, the green space was insufficient, and the spatial planning process was disordered, while the pipe network facilities could not totally absorb the high-density surface runoff in the low-lying areas. Clearly, the areas with higher ISI values had a limited capacity to resist, absorb, adapt, and recover from inundation disasters, thereby indicating that the inundation resilience was relatively low in these areas. Thus, the ISI values reflected the areas of the urban system with weak resilience to some extent, thereby providing the basis to support further improvements to the urban resilience.

4.2. Necessity for Resilient Subdivisions

Most previous studies treated the study area as a single subject and they rarely considered that the flooded areas experienced variable disaster levels, which required the implementation of diverse strategies [49]. In the present study, the ISI and CEI values generally decreased gradually with the continuous implementation of the LID strategy because although the initial investment in resilience strategies was insufficient, it could significantly reduce the likelihood of flooding disasters and improve the urban resilience. However, after constructing the inundation partition matrix and dividing the study area into three zones, the results showed that there were obvious disparities between regions, thereby demonstrating the requirement for inundation partition.
The changes in the Preserved Zones were similar to the overall trend where a high cost–benefit ratio was maintained in the early stage of LID construction, but the CEI gradually decreased as the LID density increased. Due to the greater resilience of the early LID strategy, it was difficult to find an optimal solution with greater cost–benefit outcomes. The results demonstrated the highly efficient improvement in the resilience under a low improvement density, because the Preserved Zones were not affected severely by the disaster, and the implementation of LID could control the runoff generated by heavy rain through distributed small-scale source control, where the rainwater would be retained to supply groundwater. However, as the implementation of the LID strategy increased, the remaining inundation points were more difficult to eliminate, which indirectly reflected the limitations of the LID strategy, where the lower flooding risk depended on LID measures, but also on the coordinated implementation of multiple measures.
In Vulnerable Zones, the CEI first increased and then decreased, and the optimal solution in terms of the cost–benefit ratio was obtained. Compared with the initial scenario, the ISI reduction was 39% with the optimal combination, while the construction cost was 102.48 million USD and the CEI was 177.86 m·min/million USD, as shown in Table 4. Compared with scenario III described above, the reduction in the ISI and the CEI were both larger with the optimal combination scenario, so the urban resilience improved greatly. The optimal solution has various explanations, as shown in Section 4.3.
The Sensitive Zones had the longest disaster durations. The points in these areas were not effectively connected to the drainage network. Thus, the inundation severity did not decrease gradually and continuously. For example, the high-low regions had shallower inundation water levels, which responded rapidly to the effects of the initial LID practices, so the ISI decreased rapidly. However, the reduction in the ISI was more stable in the high-medium regions because the risk was relatively high. As the density of the LID strategy increased, the inundation depth decreased accordingly, but most of the inundation points still accumulated water and the inundation duration was not obviously shortened. The resilience enhancement effect was only reflected by the reduced inundation depth, and the relative reduction rates and cost–benefit ratios did not differ among the scenarios. In fact, the main problem was the poor infrastructure in the Sensitive Zones. Although the LID strategy had a positive effect on improving the urban resilience, implementing appropriate infrastructure and integrating it into the pipe network would be an effective measure for increasing the resilience in these areas.

4.3. Reasons for Cost–Benefit Analysis of LID Construction

With limited resources, there is a tradeoff between the effect on improving the resilience and the input cost. In addition, measures implemented to improve resilience adaptability will encounter various bottlenecks in practice [32]. LID is an adaptive improvement measure and its performance is worthy of attention. In particular, determining the optimal combination of LID strategies is the ultimate issue addressed in the resilience cost problem [50,51]. In this study, the single LID scenarios and combined LID scenarios both obtained optimal cost–benefit solutions, but their explanations differed.
The results obtained for the 30 single LID scenarios showed that there were significant differences in the resilience improvement benefits obtained with each strategy. We identified the scenario with the highest cost–benefit construction density based on the changes in the CEI values. The CEI was relatively high for PP, followed by GR and VS. In particular, the unit cost of PP obtained relatively high reductions in the ISI values in each scenario, thereby indicating its superior performance at efficiently improving the resilience. In addition to the strategy parameters and quantitative distribution, the spatial distribution pattern was also closely related to the superior performance of PP. However, the VS strategy had little obvious effect on reducing flooding in the study region, mainly because the proportion of impervious surfaces was relatively high in the vulnerable areas, and the sites available for transformation with GR were extremely limited and generally scattered in high resilience areas. In these regions, rainstorm management had limited effects on retaining, storing, and purifying the local surface runoff, but it could not deal effectively with surface runoff from the surrounding impervious surfaces, so VS had very limited effects on mitigating flooding.
For the combined LID scenarios, when the GR was combined with PP, which had the highest CEI, the optimal scenario was 20%GR instead of 70% GR which had the highest CEI in GR single scenarios (as shown in Table A4 and Table A5), thereby indicating that PP and GR interacted with each other. Similarly, VS interacted with PP and GR. Moreover, the ISI reduction under different combinations was not a simple numerical sum, thereby demonstrating that there were synergistic or antagonistic effects between the LID strategies. Several explanations can account for the optimal combination in terms of the cost–benefit ratio. In contrast to the single LID scenarios, the urban flooding water was derived from surface runoff in the surrounding catchment area, but also from the runoff in other catchments transferred by pipe networks or roads. The application of the LID strategy in the present study did not achieve full coverage of the whole river basin. The LID facilities could not be fully constructed due to the difficulty and high cost of modifying large-scale roofs and other construction sites in urban villages, and thus scenarios were designed according to the construction status in resilient cities. The LID strategy could not handle surface runoff from areas where LID measures were not implemented. This is one of the main reasons why the density of the LID measures could not cope with all of the flooding water and why the optimal scenario in terms of the cost–benefit ratio had to be determined.

4.4. Limitations and Future Directions

In this study, we quantified the levels of inundation disasters by constructing ISI and CEI indicators, as well as identifying the optimal scenario for resilience improvement, thereby enriching the quantitative study of inundation resilience to some extent. However, there were some limitations. Firstly, it was subjective to divide the zones according to the inundation duration and inundation depth. In addition, we ignored the resilience improvements due to the joint actions of multiple parties such as individuals, communities, governments, and developers. Moreover, the final cost would include that of the LID infrastructure, but also other costs, such as land purchasing and daily maintenance charges. If we consider the cost–benefit ratio problem for LID from the perspective of a game, then determining the optimal scenario for all of the interested parties would be more conducive to in-depth investigations of the practical problem. LID aims to reduce the runoff and pollution caused by flooding via decentralized and small-scale source control [52], but the implementation effect of LID is limited and it cannot eliminate floods in areas with low ISI values completely. It is not possible to depend solely on LID to solve flooding problems and more traditional water management measures are needed to improve urban resilience, such as laying drainage pipes and constructing appropriate landscape security patterns.

5. Conclusions

Sponge city construction is relatively focused on urban stormwater management, which can be considered as an important part of an aquatic ecological civilization city, and its core is to run stormwater management and LID strategies throughout urban planning and sustainable development. The main innovations of this study are the construction of the inundation disaster curve and inundation partition matrix. This approach is different from other common methods based on single and static inundation indicators. We also divided the study area into various zones with different implementation rates for LID practices. Comparing the reductions in the severity and the construction costs for LID in different regions may provide feasible solutions regarding the construction of sponge cities and resilient cities in the study area. The main conclusions of this study are as follows:
  • Overall, the degree of inundation reduction increased, but the rate of reduction decreased slowly as the density of LID construction increased. These findings demonstrated that the implementation of LID strategies obtained cost benefits;
  • Optimal cost–benefit solutions exist for single LID strategies. When multiple LID strategies were implemented, the effect was not simply the sum of both, but instead synergistic or antagonistic effects were obtained;
  • Dividing the study area based on the degree of flooding severity is essential because of the difference in performance in different zones at the urban watershed scale. We found the optimal solution in terms of the cost-benefit ratio in the Vulnerable Zones. However, the main purpose of this study was to find different optimal combinations for diverse study areas and to identify a universal law rather than determining specific values;
  • The LID strategy achieved effective results at improving the inundation resilience, but it was unable to completely prevent flooding at all of the inundation points due to various factors, such as the construction scope, distribution pattern, and the type parameters. In future research, the comprehensive application of multiple resilience improvement strategies will be the main approach employed to build a resilient city by maximizing the resilience enhancement effect.

Author Contributions

Conceptualization, J.W.; methodology, J.W. and Y.C.; software, R.Y.; validation, R.Y.; writing—original draft, Y.C.; visualization, Y.C. and Y.Z.; supervision, J.W.; project administration, Y.Z.; funding acquisition, J.W. All authors have read and agreed to the published version of the manuscript.

Funding

This research was supported by the National Natural Science Foundation of China (No. 41671180) and the Science and Technology Planning Project of Shenzhen Municipality (JCYJ20170412150910443).

Acknowledgments

We acknowledge the constructive comments of anonymous reviewers.

Conflicts of Interest

The authors declare no conflict of interest.

Appendix A

The inundation curve to quantitatively evaluate the severity of flooding was constructed based on the theoretical system performance curve.
Figure A1. Theoretical system performance curve for an urban drainage system. The black solid line P0 represents the initial performance level, the dotted blue line Pa represents a lower, but acceptable performance level, Pf represents the maximum loss level suffered by the system, Pi(t) represents the theoretical system performance curve, and the shaded area represents the severity of flooding.
Sustainability 12 04990 g0a1
Table A1. Parameters of LID.
TypesStructureParametersValueUnit
GRSurfaceBerm height3mm
Vegetation volume fraction0.1
Surface roughness0.017
Surface slope1%
SoilThickness100mm
Porosity0.5
Field capacity0.2
Wilting point0.024
Conductivity30mm/h
Conductivity slope5
Suction head60mm
Drainage matThickness3mm
Void fraction0.5
Roughness0.1
PPSurfaceBerm height2mm
Vegetation volume fraction0
Surface roughness0.014
Surface slope1%
PavementThickness100mm
Void ratio0.25
Impervious surface fraction0
Permeability250mm/h
Clogging factor0
StorageThickness150mm
Void ratio0.4
Seepage fate1.2mm/h
Clogging factor0
VSSurfaceBerm height80mm
Vegetation volume fraction0
Surface roughness0.24
Surface slope1%
SoilThickness20mm
Porosity0.5
Field capacity0.2
Wilting point0.1
Conductivity5mm/h
Conductivity slope10
Suction head3.5mm
The principles to be followed for LID construction are as follows:
  • Residences in urban villages would not be reconstructed with GR;
  • The highways would not be reconstructed by PP for considering the pressure resistance of permeated pavement and other factors;
  • PP could be used for reconstruction in several land use types with conditions such as the roads and parking lots in communities;
  • vs. would be used in the green space in urban villages, commercial residential land, industrial land and water-permeable surfaces in park and green land.
The specific applicable types were shown in Table A2.
Table A2. The rules of land use types with three types of LID strategies.
TypesCommercial Residential LandUrban VillageIndustrial LandPark and Green LandRoadsOthers
GR
PP
VS
Based on previous studies and filed investigations, the estimates costs of the LID strategies with the different settings were as follows.
Table A3. Estimated costs of LID implementation.
TypesStructuresCostsUnits
GRProtection layer1.88USD/m2
Plant6.57USD/m2
Soil86.30USD/m2
PPexcavation4.69USD/m2
Filter fabric1.88USD/m2
Disposal15.95USD/m2
Asphalt pavement182.91USD/m2
VSPlant6.57USD/m2
Soil86.30USD/m2
excavation4.69USD/m2
Table A4. CEIs under different GR scenarios based on 60%PP.
Intensity of GRISI (m·min)Reduction (m·min)Relative Cost (Million USD)CEI (m·min/Million USD)
0%33,371
10%31,130224114.84151.01
20%28,533483829.68163.01
30%26,861651044.52146.23
40%24,847852459.36143.60
50%22,94010,43174.20140.58
60%21,21912,15289.04136.48
70%19,67213,699103.88131.87
80%18,27415,097118.86127.01
90%17,04616,325133.70122.10
100%15,92617,446148.54117.45
Note: The bold number is the largest of this column which represent the optimal LID solution.
Table A5. CEIs under different vs. scenarios based on 60%PP + 20%GR.
Intensity of VSISI (m·min)Reduction (m·min)Relative Cost (Million USD)CEI (m·min/Million USD)
0%28,533
10%28,452822.9427.891
20%28,3861485.7425.784
30%28,3092248.6825.806
40%28,18534811.4830.314
50%28,09044314.4230.721
60%28,00452917.2230.720
70%27,93859520.1629.514
80%27,86367023.1029.004
90%27,79074325.9028.687
100%27,70882528.8428.61
Note: The bold number is the largest of this column which represent the optimal LID solution.

References

  1. Arnell, N.W. The effect of climate change on hydrological regimes in Europe: A continental perspective. Glob. Environ. Chang. 1999, 9, 5–23. [Google Scholar] [CrossRef]
  2. Arnold, C.; Gibbons, C. Impervious Surface Coverage: The Emergence of a Key Environmental Indicator. J. Am. Plan. Assoc. 1996, 62, 243–258. [Google Scholar] [CrossRef]
  3. Beckers, A.; Dewals, B.; Erpicum, S.; Dujardin, S.; Detrembleur, S.; Teller, J.; Pirotton, M.; Archambeau, P. Contribution of land use changes to future flood damage along the river Meuse in the Walloon region. Nat. Hazards Earth Syst. Sci. 2013, 13, 2301–2318. [Google Scholar] [CrossRef]
  4. Claessens, L.; Hopkinson, C.; Rastetter, E.; Vallino, J. Effect of historical changes in land use and climate on the water budget of an urbanizing watershed. Water Resour. Res. 2006, 42, 1–13. [Google Scholar] [CrossRef] [Green Version]
  5. Willems, P.; Arnbjerg-Nielsen, K.; Olsson, J.; Nguyen, V.T.V. Climate change impact assessment on urban rainfall extremes and urban drainage: Methods and shortcomings. Atmos. Res. 2012, 103, 106–118. [Google Scholar] [CrossRef]
  6. Bhattarai, R.; Yoshimura, K.; Seto, S.; Nakamura, S.; Oki, T. Statistical model for economic damage from pluvial floods in Japan using rainfall data and socioeconomic parameters. Nat. Hazards Earth Syst. Sci. 2016, 16, 1063–1077. [Google Scholar] [CrossRef] [Green Version]
  7. Coles, D.; Yu, D.; Wilby, R.L.; Green, D.; Herring, Z. Beyond ‘flood hotspots’: Modelling emergency service accessibility during flooding in York, UK. J. Hydrol. 2017, 546, 419–436. [Google Scholar] [CrossRef] [Green Version]
  8. Kristvik, E.; Johannessen, B.G.; Muthanna, T.M. Temporal downscaling of IDF curves applied to future performance of local stormwater measures. Sustainability 2019, 11, 1231. [Google Scholar] [CrossRef] [Green Version]
  9. Gu, C.; Cockerill, K.; Anderson, W.P.; Shepherd, F.; Groothuis, P.A.; Mohr, T.M.; Whitehead, J.C.; Russo, A.A.; Zhang, C. Modeling effects of low impact development on road salt transport at watershed scale. J. Hydrol. 2019, 574, 1164–1175. [Google Scholar] [CrossRef]
  10. Luan, Q.; Fu, X.; Song, C.; Wang, H.; Liu, J.; Wang, Y. Runoff effect evaluation of LID through SWMM in typical mountainous, low-lying urban areas: A case study in China. Water 2017, 9, 439. [Google Scholar] [CrossRef] [Green Version]
  11. Zeng, S.; Guo, H.; Dong, X. Understanding the synergistic effect between LID facility and drainage network: With a comprehensive perspective. J. Environ. Manage. 2019, 246, 849–859. [Google Scholar] [CrossRef] [PubMed]
  12. Holling, C.S. Resilience and stability of ecological systems. Futur. Nat. Doc. Glob. Chang. 2013, 4, 245–256. [Google Scholar] [CrossRef] [Green Version]
  13. Meerow, S.; Newell, J.P.; Stults, M. Defining urban resilience: A review. Landsc. Urban Plan. 2016, 147, 38–49. [Google Scholar] [CrossRef]
  14. Vis, M.; Klijn, F.; De Bruijn, K.M.; Van Buuren, M. Resilience strategies for flood risk management in the Netherlands. Int. J. River Basin Manag. 2003, 1, 33–40. [Google Scholar] [CrossRef]
  15. Liao, K.H. A theory on urban resilience to floods—A basis for alternative planning practices. Ecol. Soc. 2012, 17. [Google Scholar] [CrossRef]
  16. Vamvakeridou-Lyroudia, L.; Chen, A.; Khoury, M.; Gibson, M.; Kostaridis, A.; Stewart, D.; Wood, M.; Djordjević, S.; Savic, D. Assessing and visualising hazard impacts to enhance the resilience of Critical Infrastructures to urban flooding. Sci. Total Environ. 2019, 707, 136078. [Google Scholar] [CrossRef]
  17. Godschalk, D.R. Urban hazard mitigation: Creating resilient cities. Nat. Hazards Rev. 2003, 4, 136–143. [Google Scholar] [CrossRef]
  18. Valdes, H.M.; Purcell, P.H. Making cities resilient report 2012: A global snapshot of how local governments reduce disaster risk. Int. J. Disaster Resil. Built Environ. 2013, 4, 240–246. [Google Scholar] [CrossRef]
  19. Bruneau, M.; Chang, S.E.; Eguchi, R.T.; Lee, G.C.; O’Rourke, T.D.; Reinhorn, A.M.; Shinozuka, M.; Tierney, K.; Wallace, W.A.; Von Winterfeldt, D. A Framework to Quantitatively Assess and Enhance the Seismic Resilience of Communities. Earthq. Spectr. 2003, 19, 733–752. [Google Scholar] [CrossRef] [Green Version]
  20. Reed, D.A.; Kapur, K.C.; Christie, R.D. Networked Infrastructure. IEEE Syst. J. 2009, 3, 174–180. [Google Scholar] [CrossRef]
  21. Ouyang, M.; Dueñas-Osorio, L.; Min, X. A three-stage resilience analysis framework for urban infrastructure systems. Struct. Saf. 2012, 36, 23–31. [Google Scholar] [CrossRef]
  22. Hammond, M.; Chen, A.; Djordjević, S.; Butler, D.; Mark, O. Urban flood impact assessment: A state-of-the-art review. Urban Water J. 2015, 12, 14–29. [Google Scholar] [CrossRef] [Green Version]
  23. Hu, M.; Sayama, T.; Zhang, X.; Tanaka, K.; Takara, K.; Yang, H. Evaluation of low impact development approach for mitigating flood inundation at a watershed scale in China. J. Environ. Manag. 2017, 193, 430–438. [Google Scholar] [CrossRef] [PubMed]
  24. Chen, W.; Huang, G.; Zhang, H.; Wang, W. Urban inundation response to rainstorm patterns with a coupled hydrodynamic model: A case study in Haidian Island, China. J. Hydrol. 2018, 564, 1022–1035. [Google Scholar] [CrossRef]
  25. Hwang, H.; Lansey, K.; Quintanar, D.R. Resilience-based failure mode effects and criticality analysis for regional water supply system. J. Hydroinform. 2015, 17, 193–210. [Google Scholar] [CrossRef] [Green Version]
  26. Mugume, S.N.; Gomez, D.E.; Fu, G.; Farmani, R.; Butler, D. A global analysis approach for investigating structural resilience in urban drainage systems. Water Res. 2015, 81, 15–26. [Google Scholar] [CrossRef] [PubMed] [Green Version]
  27. Leimgruber, J.; Krebs, G.; Camhy, D.; Muschalla, D. Model-based selection of cost-effective low impact development strategies to control water balance. Sustainability 2019, 11, 2440. [Google Scholar] [CrossRef] [Green Version]
  28. Joksimovic, D.; Alam, Z. Cost efficiency of Low Impact Development (LID) stormwater management practices. Procedia Eng. 2014, 89, 734–741. [Google Scholar] [CrossRef] [Green Version]
  29. Li, Q.; Wang, F.; Yu, Y.; Huang, Z.; Li, M.; Guan, Y. Comprehensive performance evaluation of LID practices for the sponge city construction: A case study in Guangxi, China. J. Environ. Manag. 2019, 231, 10–20. [Google Scholar] [CrossRef]
  30. Chui, T.F.M.; Liu, X.; Zhan, W. Assessing cost-effectiveness of specific LID practice designs in response to large storm events. J. Hydrol. 2016, 533, 353–364. [Google Scholar] [CrossRef]
  31. Cheng, M.; Qin, H.; He, K.; Xu, H. Can floor-area-ratio incentive promote low impact development in a highly urbanized area?—A case study in Changzhou City, China. Front. Environ. Sci. Eng. 2018, 12. [Google Scholar] [CrossRef]
  32. Xu, T.; Engel, B.A.; Shi, X.; Leng, L.; Jia, H.; Yu, S.L.; Liu, Y. Marginal-cost-based greedy strategy (MCGS): Fast and reliable optimization of low impact development (LID) layout. Sci. Total Environ. 2018, 640, 570–580. [Google Scholar] [CrossRef]
  33. Wu, J.; Yang, R.; Song, J. Effectiveness of low impact development for urban inundation risk mitigation under different scenarios: A case study in Shenzhen, China. Nat. Hazards Earth Syst. Sci. Discuss. 2018, 18, 2525–2536. [Google Scholar] [CrossRef] [Green Version]
  34. Liu, Y.Y.; Li, L.; Liu, Y.-S.; Chan, P.W.; Zhang, W.H. Dynamic spatial-temporal precipitation distribution models for short-duration rainstorms in Shenzhen, China based on machine learning. Atmos. Res. 2020, 237, 104861. [Google Scholar] [CrossRef]
  35. Lancia, M.; Zheng, C.; He, X.; Lerner, D.N.; Andrews, C.; Tian, Y. Hydrogeological constraints and opportunities for “Sponge City” development: Shenzhen, southern China. J. Hydrol. Reg. Stud. 2020, 28, 100679. [Google Scholar] [CrossRef]
  36. Song, J.; Chang, Z.; Li, W.; Feng, Z.; Wu, J.; Cao, Q.; Liu, J. Resilience-vulnerability balance to urban flooding: A case study in a densely populated coastal city in China. Cities 2019, 95, 102381. [Google Scholar] [CrossRef]
  37. Ding, S.; Ren, X.C. Research on Economic Incentive Policy for Low Impact Development of Rainwater Utilization in Guangming New District. China Water Wastewater 2015, 31, 104–107. [Google Scholar]
  38. Zhou, J. The practice of the sponge city—Taking the green ring of Shenzhen Guangming New District as an example. Jiangxi Build. Mater. 2016, 18, 42–45. [Google Scholar]
  39. Penning-Rowsell, E.; Viavattene, C.; Pardoe, J.; Chatterton, J.; Parker, D.; Morris, J. The Benefits of Flood and Coastal Risk Management: A Handbook of Techniques—2010; Middlesex University: London, UK, 2010. [Google Scholar]
  40. Nurmi, V.; Ahtiainen, H. Distributional Weights in Environmental Valuation and Cost-Benefit Analysis: Theory and Practice. Ecol. Econ. 2018, 150, 217–228. [Google Scholar] [CrossRef]
  41. Liu, Y.H.; Liao, W.Y.; Li, L.; Huang, Y.T.; Xu, W.J.; Zeng, X.L. Reduction measures for air pollutants and greenhouse gas in the transportation sector: A cost-benefit analysis. J. Clean. Prod. 2019, 207, 1023–1032. [Google Scholar] [CrossRef]
  42. Qin, H.; Li, Z.; Fu, G. The effects of low impact development on urban flooding under different rainfall characteristics. J. Environ. Manag. 2013, 129, 577–585. [Google Scholar] [CrossRef] [PubMed] [Green Version]
  43. Kong, F.; Ban, Y.; Yin, H.; James, P.; Dronova, I. Modeling stormwater management at the city district level in response to changes in land use and low impact development. Environ. Model. Softw. 2017, 95, 132–142. [Google Scholar] [CrossRef]
  44. Ahiablame, L.; Shakya, R. Modeling flood reduction effects of low impact development at a watershed scale. J. Environ. Manag. 2016, 171, 81–91. [Google Scholar] [CrossRef] [PubMed]
  45. Eckart, K.; McPhee, Z.; Bolisetti, T. Performance and implementation of low impact development—A review. Sci. Total Environ. 2017, 607–608, 413–432. [Google Scholar] [CrossRef]
  46. Townshend, D. Study on Green Roof Application in Hong Kong. In Architectural Services Department; Urbis Limited: Wan Chai, Hong Kong, 2007; pp. 1–157. [Google Scholar]
  47. Hu, M.; Zhang, X.; Li, Y.; Yang, H.; Tanaka, K. Flood mitigation performance of low impact development technologies under different storms for retrofitting an urbanized area. J. Clean. Prod. 2019, 222, 373–380. [Google Scholar] [CrossRef]
  48. Song, J.; Yang, R.; Chang, Z.; Li, W.; Wu, J. Adaptation as an indicator of measuring low-impact-development effectiveness in urban flooding risk mitigation. Sci. Total Environ. 2019, 696, 133764. [Google Scholar] [CrossRef]
  49. Eckart, K.; Mcphee, Z.; Bolisetti, T. Multiobjective Optimization of Low Impact Development Stormwater Controls. J. Hydrol. 2018, 562. [Google Scholar] [CrossRef]
  50. Pyke, C.; Warren, M.P.; Johnson, T.; LaGro, J.; Scharfenberg, J.; Groth, P.; Freed, R.; Schroeer, W.; Main, E. Assessment of low impact development for managing stormwater with changing precipitation due to climate change. Landsc. Urban Plan. 2011, 103, 166–173. [Google Scholar] [CrossRef]
  51. Rezazadeh Helmi, N.; Verbeiren, B.; Mijic, A.; van Griensven, A.; Bauwens, W. Developing a modeling tool to allocate Low Impact Development practices in a cost-optimized method. J. Hydrol. 2019, 573, 98–108. [Google Scholar] [CrossRef]
  52. Ma, Y.; Gong, M.; Zhao, H.; Li, X. Contribution of road dust from Low Impact Development (LID) construction sites to atmospheric pollution from heavy metals. Sci. Total Environ. 2020, 698, 134243. [Google Scholar] [CrossRef] [PubMed]
Figure 1. Geographical location and locations of inundation points in the study area.
Sustainability 12 04990 g001
Figure 2. Conceptual map of flooding with the double peaks in scenario i. The inundation curve could have one or more peaks. The shaded area represents the inundation severity in scenario i, where a larger value indicates a more severe disaster.
Sustainability 12 04990 g002
Figure 3. Partitioning rules for inundation resilience.
Sustainability 12 04990 g003
Figure 4. Spatial distributions of flooding severity from the initial scenario to scenario X. Initial scenario is a scenario which LID is not implemented. The other 10 scenarios, from scenario I to scenario X, shows the spatial change of ISI with each 10% increase of LID construction.
Sustainability 12 04990 g004aSustainability 12 04990 g004b
Figure 5. The results of LID construction under different scenarios.
Sustainability 12 04990 g005
Figure 6. Variations in the two indicators in 10 scenarios under different partitions. (a) Preserved Zones; (b) Vulnerable Zones; (c) Sensitive Zones.
Sustainability 12 04990 g006
Table 1. Overview of data used in this study.
TypeUseSource
Land use dataSimplified to six types: commercial residential land, urban village, industrial land, park and green land, roads and othersShenzhen Municipal Government
Digital Elevation Model(DEM)Extracting slope and aspect, and identifying the catchment areaGeospatial Data Cloud
(http://www.gscloud.cn/)
Soil dataReference for soil infiltration rateNatural resource survey results in Shenzhen
Pipe network dataCharacterizing the drainage capacity of urban systemsShenzhen Municipal Government
Hourly rainfall dataInput for rainstorm modelShenzhen Meteorological Data System
(https://data.szmb.gov.cn/)
Building census dataIdentifying non-submerged areasShenzhen City Planning and Land Resources Committee
Inundation points in shapefile formatCalibrating and validating the model parametersShenzhen SanFang headquarters and Guangming New District Urban Construction Bureau
Table 2. Inundation reduction effects under different scenarios.
Inundation AreaAverage Inundation Depth
Value (km2)Reduction RateValue (m)Reduction Rate
Initial scenario1.5960.09
Scenario I1.38613%0.0815%
Scenario II1.23123%0.0728%
Scenario III1.12629%0.0638%
Scenario IV1.02636%0.0545%
Scenario V0.94141%0.0550%
Scenario VI0.88245%0.0453%
Scenario VII0.84247%0.0456%
Scenario VIII0.80150%0.0458%
Scenario IX0.76752%0.0460%
Scenario X0.74154%0.0362%
Table 3. CEIs for single LID measures in Vulnerable Zones under different scenarios.
DensityReduction RateCEI (m·min/Million USD)
GRPPVSGRPPVS
10%4%5%0.2%131.43215.0027.14
20%9%9%0.4%137.14212.1430.71
30%13%14%0.5%139.29215.0027.86
40%19%18%0.6%147.14219.2926.43
50%24%23%0.9%150.71221.2129.29
60%29%28%1.0%152.86221.7627.14
70%34%32%1.3%153.57220.0029.29
80%39%37%1.7%152.86218.5734.29
90%44%41%2.0%150.71216.4335.00
100%47%45%2.1%147.86212.8634.29
Note: bold numbers are the largest of their columns which represent the optimal LID solution.
Table 4. Comparison of the best combination and scenario III which had the highest cost-benefit in Vulnerable Zones.
ISI
(m·min)
Reduction
(m·min)
Reduction
Rate
Cost
(Million USD)
CEI
(m·min/Million USD)
Initial scenario46,308
Scenario III32,78113,52729%82.32164.29
Optimal solution28,09018,21839%102.48177.86

