1. Introduction
In the history of construction, wooden trusses are the main structures used to support timber roofs, commonly used to cover large halls and the naves of churches. These types of structures are conceived both as planar and three-dimensional systems, and they are made with solid wood beams having different cross-sections, depending on the span of the roof. The capability to redistribute the vertical load without producing a horizontal thrust on the side walls ensured the success of these structural configurations since the beginning of the 4th century.
Studies on large span roofs, particularly wooden trusses, are usually based on relevant handbooks from the 16th century [
1,
2]. At the turn of the 18th and 19th centuries, the theme was always present, and was at first addressed during the encyclopedic cataloging of traditional techniques [
3,
4,
5]; then, it focused on aspects related to the calculation and verification of static schemes [
6,
7,
8], following the development of the disciplines of Building Science and Civil Engineering. Nowadays, the analysis of timber roof structures is widely present in the scientific literature, in several contributions. On the one hand, the topic is systematically analyzed by building science, architectural technology, and restoration theory [
9,
10,
11]. On the other hand, only a few studies have systematically addressed the real specificity of these building systems relying on practical experience and on-site diagnoses [
12].
Academics usually simplify the construction design and static scheme of these artifacts. If they are still the original ones, they show signs of a long life; or, if they underwent structural problems, their configuration has probably been modified over time, if they have not been completely replaced. Their behavior is determined by precise construction specificities, such as the different ways of assembling linear elements to form tie-rods or beams with larger cross-sections, the more or less accentuated stiffness of the joints, which is determined by the timber notching, the presence or absence of metal brackets, and other details [
13,
14]. In other words, the topic seems to concern the art of construction and not the theory of construction. The theme is therefore reduced to a matter of minor importance for restoration activity. The roof structures are hidden and difficult to access and do not attract the attention of technicians and researchers unless there are severe problems of deterioration or damage due to poor maintenance or exceptional events. In addition, various factors highlight the lack of systematic and complete information: the wooden objects are no longer original or difficult to date, and their behavior eludes scientific and analytical interpretations, or is determined by means of great approximations.
However, the roof is an area of the building that bears many loads, which vary due to atmospheric phenomena, such as snow, wind, or earthquakes, and is particularly subject to material deterioration and fires. Moreover, the roofing systems are heavily affected by potential structural problems that may arise from the underlying structures. For these reasons, it is possible to obtain information on the “state of health” of the entire building by an accurate analysis of the wooden roof structures. An innovative form of investigation has been developed using innovative tools and following a structured methodological approach, after observing the interweaving of the historical, technological, and architectural aspects of the design of wooden trusses and considering the excessive simplification of the behavior of these building systems in the traditional literature.
The study of wooden trusses in the area of Bologna is of great importance, since the city has many significant ecclesiastical buildings with wooden roofs. After having been the papal seat in the 15th century, for a brief time, the city continued to have a strong bond with the Vatican. In 1575 Pope Gregory XIII (1502–1585), the Bolognese Ugo Boncompagni, commissioned a faithful representation of his city to be painted in the Vatican palaces. The result would be the so-called Bologna Room [
15], where the pope wanted all the religious buildings to perfectly depicted, with a golden roof [
16].
The case studies that have so far been studied have formed the basis for setting up and refining the research protocol by providing various static schemes, which were used to cover naves of different spans with construction solutions that were among the most advanced in the European context at the time [
17,
18]. While the previous studies examined only churches (St. Peter’s Cathedral, the church of San Giovanni in Monte, the Basilica of San Petronio, the Basilica of San Domenico, and the church of San Salvatore Maggiore), this case study extends the analysis to the roofing system of the Municipal Theater of Bologna. Its roof is a remarkable example in terms of size and structural design (about 25 m span, 6 m high, and almost 8 tons in weight). The theater, built in the year 1763, is one of the most important opera houses in Italy.
2. State of the Art
Nowadays, the awareness that the modeling of wooden trusses does not fit most simplified hypotheses has shown that increasing the knowledge behind these original static schemes and joints is a non-trivial procedure. The construction practice is often ignored in favor of handbook descriptions or regulatory verification. The choice to use digital techniques to better describe the behavior of wooden trusses is also due to the awareness that these techniques have recently reached high relevance and maturity. In particular, there are numerous studies and applications to the geometric survey of archaeological and architectural sites for the modeling of complex shapes, surfaces, and spaces [
19,
20,
21] and educational dissemination [
22,
23,
24,
25]. If digital acquisition is an established research field, the virtual photorealistic reconstructions for the qualification, evaluation, and control of building characteristics and pathologies seem less developed.
In recent years, as-built 3D models have been developed for the evaluation of building quality by using Terrestrial Laser Scanning (TLS) and photogrammetric techniques [
26]. Still-high costs, the operative expertise need, and time-consuming process dependence strongly limited their widespread use [
27]. If the use of TLS for the surveying of complex architectural surfaces is not new and is linked to many types of research in the field of restoration [
28], its application to the study of hidden spatial structures, such as wooden roofs, is rarer or even absent. An example can be found in the analysis of past interventions on the wooden roof of the “Castello del Valentino” [
29], where a TLS point cloud was manually rendered to obtain a finite element model useful for the numerical assessment of the roof.
Working without a 3D model could be the solution, and much scientific literature deals with cloud-to-cloud and mesh-to-cloud comparison [
30,
31]. Many modeling strategies allow the generation of 3D models in various formats, such as meshes that interpolate the acquired point cloud, NURBS-based reconstructions based on manual, semi-automated, or automated procedures and parametric objects for Building Information Modeling. For example, a recent method attempts to reconstruct the visible surface of a vault using neural networks [
32]. Even if the use of neural networks seems promising, treating wooden trusses with this approach would become quite complicated due to the three-dimensional and irregular shape of these structures.
Therefore, this research aims to demonstrate that digital sensing technologies lead to considerations that would be almost impossible by following the traditional investigation methods, usually based on direct observation and simplified architectural surveys. Furthermore, the intention is to develop a scientifically defined, coherent, repeatable, and standardizable monitoring protocol to preserve this type of building heritage by cyclically monitoring the state of each truss.
This paper describes the main steps of the protocol to achieve the transformation of the point cloud into 3D and BIM models using parametric modeling tools such as the Grasshopper® and Dynamo® generative algorithms. Once created for a single truss, these parametric algorithms allow for the automatic generation of 3D models of all the trusses, by modifying only the TLS input point cloud. Different generated 3D models can be used to reconstruct the roof, using computer-aided design (CAD) or BIM softwares, or to make a comparison with the point cloud itself to highlight deformations and displacements. The acquired data can then be used as an interpretative basis to evaluate the static safety of the analyzed elements from a holistic point of view, not limited to the compliance with specific regulations that these artifacts were not required to comply with at the time of their construction.
3. Materials and Methods
3.1. The Case Study: The Municipal Theater of Bologna
During the 18th century, the city of Bologna had a significant number of theatrical buildings, including public theaters and private villas in the urban surroundings. The Emilia Romagna Region, whose capital is Bologna, together with the Marche Region, currently offers one of the most formidable sets of theaters in Italy [
33]. In this context, the Municipal Theater of Bologna was born with the task of representing the municipal authority, replacing the Malvezzi Theater, which was destroyed by a fire in 1745 [
34] and was the favorite of citizens at the time.
The original construction (
Figure 1) was designed by Antonio Galli Bibiena (1697–1774), who belonged to a famous family of theater architects and who had just returned to Italy after about thirty years spent as an architect in Vienna, at the imperial court [
35]. However, Bibiena’s project was only partially completed in 1763 due to the great controversy raised by some Bolognese intellectuals and to serious financial difficulties, that led to the halving of the initial budget [
36,
37].
The economic hardships experienced during the theater’s construction led to an early structure deterioration at the beginning of the 19th century, and some inadequacies about the enjoyment of the theatrical performances were shown. Since then, the building has undergone various transformations to solve these critical issues. Between 1818 and 1820, the vault in the grand theater hall was rebuilt, as it appeared to be in a dangerous condition [
39]. At the time of this intervention, the theater was equipped with a fascinating wooden machine that served to raise the floor of the stalls, bringing it up to the level of the stage, to obtain a single large hall to host events and costume balls. In 1853 the architect Carlo Parmeggiani made a restyling of the whole building, and in 1866 the engineer Coriolano Monti designed the rear facade of the building in a post-unification style [
40].
In 1931 a fire destroyed the stage, so the engineer Armando Villa rebuilt it in a larger size using a reinforced concrete structure [
41]. After the new stage was built, in 1935, the architect Umberto Rizzi completed the unsafe entrance facade. Finally, in 1980 the restoration of the entire building was carried out, including the strengthening of all the wooden structures, the verification and reparation of the vault in the hall, the renovation of floors, plasters, and paintings, the restoration of stuccoes and frescoes, the installation of new technological systems, and the construction of new dressing rooms [
40,
42].
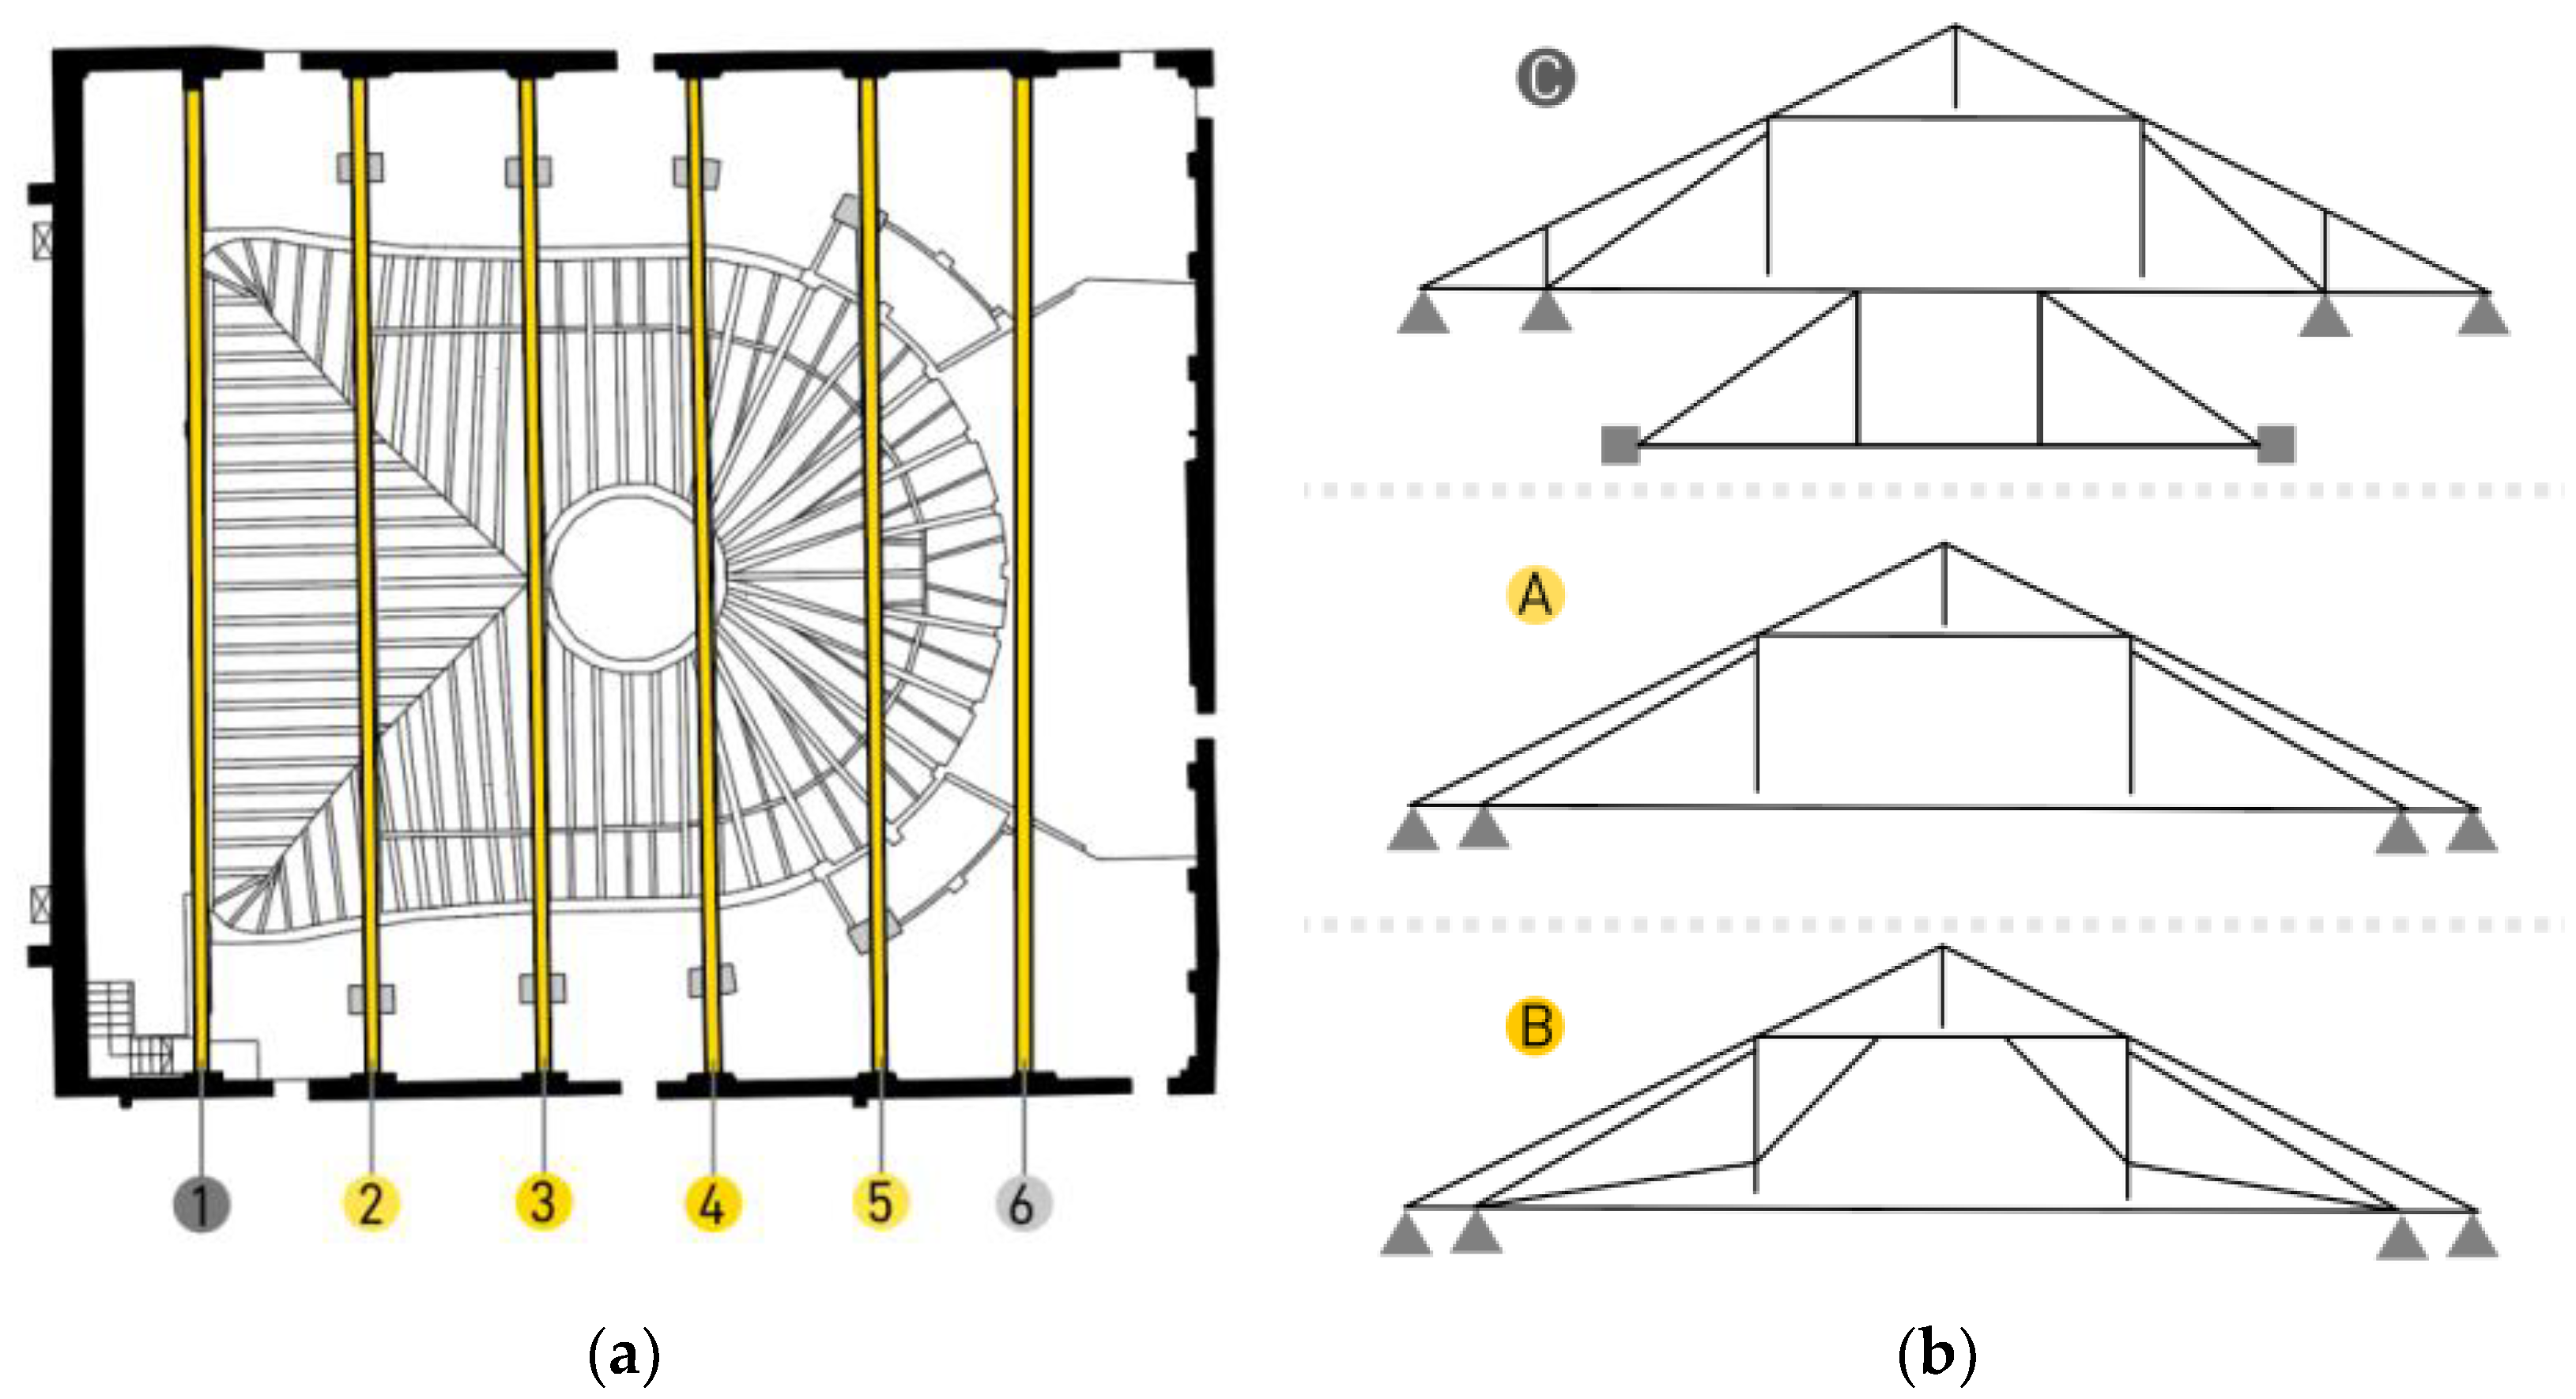
The building is currently located in the core of the city, in the strategic center of the University area, planned as an artistic and cultural district of Bologna. The complex is characterized by a floor plan with a depth of about 77 m and a width of about 54 m. Inside the theater, the great hall used for the shows is undoubtedly the most interesting area covered by the grand vault, which is supported by the roof system that is going to be discussed. It consists of a two-pitched roof with a low slope, arranged on a rectangular plan of 29 × 26 m, and is composed of six trusses dating back to around 1760, with a center to center spacing of about 4 m, covering a span of about 25 m.
The different static schemes that have been identified among the six trusses can be traced back to the primordial scheme of the “Palladian truss,” which includes principal rafters (
Figure 2).
Furthermore, new struts have been added to the primordial scheme over the centuries, differently for each truss. In fact, at the same time as the building, the trusses underwent various interventions, at first during the 19th century and later in 1980, when a substantial strengthening was carried out on the wooden structures of the roof (
Figure 3). Following the interventions of 1980, the trusses now support the vault with the aid of metal tie-rods [
42].
The wooden vault covers a bell-shaped plan with transverse and longitudinal spans, respectively of 18 m and 22 m. It consists of a double-curved membrane made of gypsum plaster, 8 cm thick [
42], with a layer of reeds supporting the plaster layer but also working as formwork during the construction [
43]. The membrane is stiffened by a series of wooden ribs placed at a distance of about 60 cm and presents a central hole where the chandelier of the great hall is hung [
44].
3.2. The Investigation Protocol Workflow
The previous case study analyses allowed us to define a procedure to systematize the assessment of the wooden structures’ behavior in terms of displacement and deformations over time. This research protocol (
Figure 4) includes an on-site instrumental acquisition phase using TLS survey techniques, followed by the digital rendering of the acquired data. This last step provides a useful information background (photos, drawings, diagrams, and models) that comprises the operational tools to correctly define and interpret the behavior of roof systems [
45]. Finally, the research protocol allows for a rapid and reliable digitization of wooden trusses by using parametric 3D and BIM modeling tools, while meeting the needs of monitoring, preservation, risk reduction, documentation, exploitation, and dissemination.
3.3. The Model Generation Procedure
The assumption behind the algorithmic generation procedure of 3D models is to exploit the vast amounts and the accuracy of spatial information provided by TLS devices, such as point clouds. These data allow for an extremely detailed analysis of wooden trusses and, therefore, for the processing both of specific and comparative information regarding their static behavior and their state of preservation.
The available geometrical data are very interesting. On the one hand, they allow for an accurate 3D rendering of each truss, on the other hand, they permit the comparison of static schemes and construction systems belonging to various wooden structures, used to arrange the roofs of different buildings. Besides, the parametric 3D models of the wooden trusses should become the starting point for future monitoring cycles regarding the displacements and deformations of these structures over time.
Another essential hypothesis is that the usual modeling methodologies, such as orthophoto vectorization or 3D modeling of “destructive geometries” using CAD or BIM softwares, strongly depend on the operator’s choices and execution modes and use workflows with a low degree of repeatability and accuracy. For these reasons, it was decided to transform the point cloud into 3D models using Grasshopper® generative algorithms. These tools, which are updated continuously, provide advantages when compared with manual modeling methods, both in terms of execution speed and elimination of inaccuracies.
Once the case study had been identified in the Municipal Theater of Bologna, an accurate TLS survey was carried out. The entire TLS survey of the roof of the theater was conducted with a FARO CAM2 FOCUS 3D
® laser scanner using a targetless approach. The survey campaign took one working day, and it was necessary to shoot more than 60 scans (
Table 1) with a resolution of 7.67 mm/10 m and a quality filter of 3× to get the whole roof system. In this case, many high-resolution scans were necessary due to obstacles between the trusses, for example, air conditioning systems, electric cables, and walkways for maintenance. The alignment was performed with the FARO SCENE 2019
® software using an interactive cloud to cloud registration with a subsampling average distance of 3 cm and a searching radius of 5 m. With a medium overlapping between the scans of 36% (
Table 2), despite the roof complexity and occlusions, it was possible to achieve an extremely accurate alignment, with an average standard deviation between corresponding points of 1.5 mm and a maximum deviation of 2.6 mm [
46].
The primary purpose was to use parametric modeling for the generation of the BASIC 3D MODEL, which represents the current state of the trusses. Starting from this first model, the IDEAL 3D MODEL was created through a series of automated operations, to reconstruct the hypothetical condition of the structure when it was initially built. This model has been compared with the TLS point cloud to evaluate the displacements and deformation states [
47].
The algorithmic generation procedure, used to obtain 3D models, has been divided into several subphases, to ensure better management and, above all, a more straightforward understanding of the adopted operating process (
Figure 5).
3.3.1. Automatic Generation of Cross-Sections
While the previous version of the protocol [
16,
17] required some manual operations in Geomagic Studio
® to generate cross-sections, the new updating transferred this phase to Grasshopper
®, saving much time and solving several inaccuracies deriving from the operator’s choices.
The cross-section generation was performed starting from the clipped point cloud of a single truss. Once the clipping boxes were created, the enclosed points were exported in .xyz format and then imported into Geomagic Studio®. In this environment, some quick editing operations were necessary to delete all the points not belonging to the beams (e.g., air systems, cables, etc.).
By clipping ample portions of points near the joints and at the centerline of the beams, it was possible to isolate three cross-sections for each element. These groups of points were then exported in .dxf format, imported in Rhinoceros
®, and associated with Grasshopper
® plug-in algorithms (
Figure 6).
By selecting each portion of the imported points, the “cross-section generation algorithm” recognized the angle of inclination of the rods in the vertical plane of the truss, identified the lying plane of the cross-sections, selected a 4-cm-wide parallel point slice (creating a sort of local clipping box), projected the enclosed points on the lying plane of the section, resorted them using a local polar coordinate system in the lying plane and interpolated all the resorted points through a third-degree curve. This “non-uniform rational basis-spline” (NURBS) curve was divided into 100 equal-length segments, and finally a new third-degree NURBS curve was created as the interpolation of the 100 points, obtaining the final cross-section curve (
Figure 7).
3.3.2. Basic Algorithm
The basic algorithm provided the BASIC 3D model of the truss starting from previously generated curves. It consists of applying the “
loft” command to the sections belonging to the same wooden beam to perform the creation of a surface only through the extremity and the centerline sections. Once the “
loft” operation on each truss element was completed, it was necessary to complete the modeling of the joints. Contrary to the previous versions of the protocol, that adopted differentiated procedures according to different connections between the wooden elements, the latest update uses a geometric-optimization algorithm to close the beams in correspondence with the joints (
Figure 8).
First of all, the algorithm automatically identified the “projection planes”: the vertical plane of the truss, the axial planes of the girders, the vertical planes passing through the lateral bearings, and the horizontal plane passing through the ridge, which were all perpendicular to the vertical plane of the truss. Subsequently, the centroids of the end sections were projected on the planes along the respective axes of the beams. Then, the end curves were extruded in correspondence with the projection planes. The correct association between the end sections and the projection planes was obtained through the Galapagos
® evolutionary solver using a parametric optimization principle (
Figure 9).
In evolutionary models, a population of candidate solutions is maintained and new candidate solutions are randomly generated by mutating or recombining variants in the existing population. Periodically, the population is pruned by applying a selection criterion (a fitness function) that allows only the better candidates to survive into the next generation. Iterated over many generations, the average quality of the solutions in the candidate pool gradually increases [
48].
After completing the automatic modeling of the rod parts at the joints, the beams were joined using the “bake” command on Rhinoceros®, and the so-called BASIC 3D model was obtained.
A first comparison between the model and the detected point cloud was carried out using Geomagic Studio® to evaluate the degree of compliance of the previous parametric modeling operations. In particular, the software detects and reports in a chromatic scale the distances between the point cloud, considered as the object reference, and the BASIC 3D model, considered as the test object.
The extracted summary reports derived by the comparison indicate the percentage of points within the nominal overlap threshold of the two compared objects. In this case, the highlighted row contains the points within the threshold of ± 5 mm, whose deviation is considered not significant, therefore treated as correctly overlapped points. The percentage of points within the threshold indicates that the total overlap degree between the point cloud and the 3D model is 75% on average for all the modeled trusses (
Figure 10).
3.3.3. Projection Algorithm
The following steps aim to generate the IDEAL 3D MODEL of the wooden trusses, which was created using a series of algorithms reconstructing the possible configuration of the truss at the time of its original construction, tracing the deformations and displacements that the structure has hypothetically undergone over time.
After running the “automatic cross-sections generation” algorithm (
Figure 11), the first phase consisted of applying the “projection algorithm” to the vectorized curves. This algorithm recovered the rotation of the wooden rods outside the vertical plane of the truss.
Once each cross-section centroid was created, the vertical plane passing through the centroids of the two external curves of the tie-beam was defined. This operation assumed that the lateral bearings of the tie-beam were still in their original position or resisted negligible movement throughout the life of the roof, particularly along the longitudinal axis of the building.
The barycenter of all other cross-sections was projected on this vertical plane using the “project” command. The connecting lines between the original and new centroids were used as reference lines to execute the “move” command. This geometrical operation simply moved the original curves from the old barycenter to the projected one. In other words, this algorithm managed the projection of the curves by moving their centroids to the hypothetical vertical plane of the truss.
3.3.4. Rectification Algorithm
The last step for the creation of the IDEAL 3D model of the trusses was mostly focused on the reconstruction of the main non-deformable outer triangle, consisting of tie-beams and rafters. This last phase was obtained by scripting the “rectification algorithm”, which eliminated the displacements of the joints and the flexural deformations of the wooden beams in the vertical plane of the truss (
Figure 12).
The main hypotheses to recover the theoretical displacements that the truss has undergone in its vertical plane over time were:
Lateral bearings of the tie-beam are still in their original position.
The bending deformation of the tie-beams is due to their weight and creep phenomena.
Inward translation and lowering of the joints between rafters and posts are due to roof loads.
Rotation of bottom rafters hinged to the lateral bearings.
Rotation of the queen posts happens toward the symmetry axis of the truss.
Rigid connection of the joint between the rafters and tie-beam is due to the presence of metal brackets.
Axial deformations of beams are disregarded.
The kinematic deformation system was based on precise geometrical assumptions, so a preparatory algorithm was initially needed. The “nodes individuation algorithm” allowed us to quickly recognize the point-like nodes and to apply the simplified planar hypothesis to a three-dimensional environment to evaluate the theoretical translations of the nodes. Besides, this algorithm, working as a first machine learning algorithm, should be fundamental for the generation of the BIM model that is going to be described in the next paragraphs.
The procedure was therefore developed by recovering to the following kinds of displacements (
Figure 13):
Displacements of the main joints: all cross-sections connected with the posts and the rafters were moved upwards by the same distance for each node.
Straightening of rafters: the top and bottom rafters were rotated to ensure that the centroids of their cross-sections lay on the same plane passing through lateral bearing and ridge nodes, orthogonal to the vertical plane of the truss.
Rectification of the posts: rotation of the posts in the direction of the symmetry axis of the truss.
Bending deformations: projection of the centroid of the centerline section on the straight line that joins the centroids of the two end sections of each element.
Once all the described operations were carried out, and the curves had been moved to the new position, all the wooden beams cross-sections of the truss reached their final position, the so-called “rectified” position.
After performing all the procedures for the “automatic generation of the cross-sections” and subsequently running the “projection” and “rectification” algorithms, all wooden beams of the truss could be modeled using the “loft” operation again and completing the rod parts at the joints, as in the “basic algorithm.” In the end, using the “bake” command on Rhinoceros
®, it was possible to generate the so-called IDEAL 3D model (
Figure 14).
3.4. Truss Analysis through 3D Models and Point Cloud Comparison
Once the IDEAL 3D model definition was reached, a comparative analysis was performed using Geomagic Control® software to evaluate the deviations between the outer faces of the robust geometric model and the point cloud. The IDEAL 3D model of each truss could be compared with the corresponding segmented portion of the original point cloud to highlight the differences. The minimum and maximum reference deviation threshold were manually set, in a chromatic scale, to have a better indication of the extent of the movements that occurred between the surveyed configuration and the IDEAL 3D model for all the trusses.
The graphic representation through the most appropriate chromatic scale clarifies the entities of the displacements. It is possible to select any position on each element of the truss to highlight the numerical value of the local deviations using the graphical representation. This representation provides both qualitative and quantitative information and facilitates an accurate and widespread understanding of all the displacement and deformations that each truss has undergone over time. In addition, the lowering, rotations, and deformations of each truss can be analyzed and locally highlighted.
Comparisons can be made in a 3D space (
Figure 15) and on 2D projection planes selected by the user according to the wooden element and the type of deviations that need to be highlighted. The software also allows for the precise quantification of deviations using control points. With the “annotation” tool, it is possible to report the exact value of the distance measured between the corresponding points of the two compared objects and its subdivision along the x, y, and z axes (
Figure 16).
The analysis allows for the highlighting of the typical displacements that the trusses manifest over time by choosing the most appropriate control points. Thanks to the IDEAL 3D model, it is possible to quantify with sufficient precision the rotations of the posts, the lowering of the rafters, and the deformation of the tie-beam and the straining beam inside and outside the truss plane. The collected numerical data can be organized in specific tables to obtain an overview of all the recorded values through the described analysis. Data collection, therefore, becomes a crucial step to guarantee the traceability of the acquired information; once it has been correctly systematized, it becomes the tool to correctly interpret the behavior of these structural systems from a quantitative and not only qualitative point of view.
3.5. The BIM Model and Calculation Model Generation Procedure
After the displacement analysis, based on the acquired data and the followed generative algorithm approach, it is possible to deepen the understanding of wooden trusses by automatically creating informative models. These models can maintain the gathered information already acquired and could be useful for further structural analyses.
The “axes generation algorithm” was scripted in Grasshopper® to obtain “line” elements corresponding to the axes of the rods. This algorithm could be applied to the previously modeled axes in the BASIC 3D model or the IDEAL 3D model to generate the BIM model in Revit® and the structural model in Robot Structural Analysis®. First, the “nodes individuation algorithm,” formerly adopted for the creation of the IDEAL 3D model, was run to solve some inaccuracies due to the previous modeling procedures. Then, the “axes generation algorithm” was applied. It consists of joining, rod by rod, the barycenter of the two end sections of the rod (coinciding with the truss joints) through the line component. The result is a set of lines that accurately represents the static scheme of the truss. Another algorithm was run to recognize the dimensions of the cross-sections automatically.
The Grasshopper’s algorithm was linked with the Dynamo®’s “BIM model generation algorithm” through the Speckle® plug-in. In Dynamo®, some lists were imported, containing:
A new “structural framing” family was created in Revit
® to model the girders. The family consisted of wooden beams with rectangular sections to add information about the material and physical characteristics (e.g., density, Young’s modulus, Poisson’s coefficient, resistance, and thermal properties). Using the list of bases and heights of the cross-sections, which were provided by Grasshopper
®, different family types were automatically created for each truss element (posts, tie-beams, struts, rafters, etc.) using the “Family Types” node in Dynamo
®. Then, the linear axes and the different family types were given as input to the “StructuralFraming.BeamByCurves” node, which automatically generates “Beam” elements in Revit
® (
Figure 17).
These “Beam” elements were not simple 3D objects (
Figure 18). They also contained some vital information for the structural analysis, forming, along with joints and connections between elements, the so-called analytical model. These elements could be used in external analyses, to determine how the beam conditions contribute to the static and lateral structural behavior.
The analytical model was completed with the missing information: external constraints, internal releases, and structural loads (
Figure 19). At this point, the model was sent to Robot Structural Analysis
®, a software performing advanced structural analysis using BIM-integrated workflows to exchange data with Revit
® continuously.
Summarizing the whole process, once the TLS survey is performed, the protocol makes available, truss by truss, the TLS point cloud, the BASIC 3D model, the IDEAL 3D model, the displacement analysis through the described method, the BIM model, and the calculation model through a single, fast, and integrated workflow.
4. Results
From the synthesis and integration of all the data deriving from the 3D models and the point cloud comparison, it was possible to provide some interesting interpretations regarding the overall displacement and behavior of the entire roof system of the Municipal Theater of Bologna. Each truss displacement proved to be related to the other ones both inside and outside the trusses’ vertical planes (
Figure 20).
4.1. Displacement Analysis in the Vertical Plane of the Truss
All the external triangles of the analyzed trusses showed a similarly asymmetrical behavior in their vertical plane, unbalanced toward the east side of the building. A careful visual analysis of the orthophotos and some measurements deriving from the point cloud highlighted that the eastern bearings of the tie-beams were about 10 cm lower than those on the western side. Since this was not compatible with the initial hypothesis, which assumed that the lateral bearings of the tie-beams were still in their original position, it was necessary to adjust the hypothesis of the static behavior of the trusses.
In general, the real static behavior reported by each studied truss provided (
Figure 21):
Inflection of the tie-beams unbalanced toward the east side of the building
Counterclockwise rotation of node B (bottom rafters-western queen post-straining beam) and consequent rotation of the western queen-post in the same direction.
Clockwise rotation of node C (ridge node), lower than the rotation of node B, and consequent rotation of the king posts in the same direction.
Clockwise rotation of node B’ (straining beam-eastern queen post-bottom rafter), quite more extensive than the rotation of node B, and consequent rotation of the eastern queen-post in the same direction.
Almost zero lowering of the B nodes.
Almost zero lowering of the C nodes.
Lowering of the B’ nodes with a value between 1–4 cm.
Lowering of node A’ (eastern lateral bearing), as anticipated.
Clockwise rotation of the straining beam, congruent with the movements of nodes B and B’.
These results have been attributed to two different causes. On the one hand, the difference in altitude between the eastern and western bearings seemed a small value if compared to the vast span of the trusses. So, it was probably caused by a tolerance error in the 18th-century construction site, which certainly could not benefit from the precision of modern instruments. On the other hand, the data could be related to the overall static behavior of the original structures of the entire building. Probably, there was a profound subsidence phenomenon along the eastern side of the historic building. The historical research provided information about an ancient water channel close to this area that might have involved ground movements. It would be necessary to analyze in detail the crack pattern of the walls of the theater to confirm this hypothesis.
4.2. Displacement Analysis Outside the Vertical Plane of the Truss
All data concerning the displacements outside the trusses’ vertical plane also proved to be compatible with the overall movement of the roof hypothesis. All the trusses rotated around their lateral bearings, in the theater proscenium direction (on the North). It was noted that, except for the second truss, while the western rafters have all undergone a rotation toward the theater proscenium (maximum displacement of 5 cm), the eastern ones have undergone a rotation in the opposite direction (
Figure 22).
In particular, the trusses’ displacement toward the proscenium was limited on the eastern side of the central trusses, probably due to the metal walkway located near this area. This platform, bound to the central tie-beams and the floor, worked as a brace element, allowing the central trusses to locally oppose the overall movement.
As we interpret these effects, the importance of integrating the historical research and the data from the new technologies used by the protocol emerges. If the interventions suffered by the building during its life cycle are known, it becomes easier to define the pathologies that currently threaten the health of the historic building. Some of the consulted archival documents reported that the proscenium area had always shown structural problems at the roof level since the construction of the theater. This area suffered the thrusts from the wooden vault, which has been connected to the trusses with metal tie-rods since 1980. The vault suffered displacements toward the proscenium area, which has always been a structural weakness of the theater. Therefore, the metal tie-rods dragged the joints of the trusses in the same direction.
5. Conclusions
The parametric 3D modeling protocol, aimed at evaluating and interpreting the deformation states of the 18th-century wooden trusses in Bibiena’s Theater, has proven to be an innovative and useful tool to deal with similar structures. On the one hand, the application of TLS systems and parametric software to this kind of historical structures has revealed a fascinating combination, which allows the research activity to focus on the field of building restoration. On the other hand, the research protocol helps to acquire information that is usually difficult to find through the classical methods of investigation.
The displacement analysis, carried out through the protocol, has proven a valid interpretation method for the overall kinematics of the roof system. Although the detected movements do not threaten the current state of the building, they highlighted the need for multi-year monitoring cycles. By simply updating the point cloud given as input for the generative algorithms, it is possible to understand if the currently identified movements are evolving and to assess the risk affecting the wooden trusses of the Municipal Theater of Bologna.
Regarding the structure of the algorithms, although the main goal was to automate as many manual operations as possible, it was not possible to mechanize all the processes. However, by combining the algorithms with artificial intelligence and machine learning tools, it is possible to streamline all the procedures and standardize the method.
The possibility of permanently checking the data on the trusses in the point cloud and the aim of scripting algorithms to create digital models that are compatible with the cloud have implicitly required a continuous comparison with the historic trusses of the theater. This has led to a complete knowledge of the studied wooden elements. Besides, the study has also revealed the extraordinary historical and construction values of the Municipal Theater of Bologna. The vast repertoire of technological and construction features, belonging to different historical periods, has highlighted the strong sense of identity of the building and the need to investigate all its parts in detail. Therefore, the archival research that has been conducted consists of a valid general framework for any further investigation.
After understanding the building’s construction peculiarities through proper historical research, conducting on-site inspections, digitally surveying the most exciting spaces of the theater, analyzing the trusses (their materials, their static schemes, their joints, and their transformations over the centuries), scripting three-dimensional modeling algorithms to digitize the wooden rods, and analyzing the displacements through the explained methodology, the protocol could be considered a valid tool for monitoring the wooden structures, for evaluating the need of restoration interventions, and for supporting the designers’ activity.
Finally, for the first time, the protocol has been integrated with BIM tools. In this case, the generation of a structural analysis model has been chosen among the countless applications that BIM methodologies could offer, to complete the structural analysis of the wooden trusses. However, BIM applications could further add significant value in terms of heritage digitization. For example, it is possible to improve the dissemination of built heritage by integrating BIM models with VR technologies. Another application could contribute to the generation of a “digital twin” of the historical building to manage the heritage at risk.
A digital twin is a digital model reproducing the behavior of a real system as a response to external physical data of various kinds. It might be interpreted as an opportunity to enhance asset performance, help in anticipating adverse environmental effects during the life cycle stages, forecast maintenance activities based on sensor data, and bring further benefits to built heritage. Currently, BIM technologies seem the most appropriate tool to promote this digital process. In the future, through the technological advancement of sensor technologies, the data deriving from the protocol might be added to the remote sensing measurements almost in real-time, to investigate other fundamental factors during the building life-cycle (e.g., humidity conditions, atmospheric conditions, solar radiation, structural vibrations, displacements, quantification of consumption, etc.). Nowadays, a similar process appears to have been set for new buildings. However, it also seems essential for monitoring the “state of health” of heritage at risk and for preserving its historical, architectural, artistic, social, and economic value both in terms of efficient conservation and of the enhancement and dissemination of historical heritage for its transmission to future generations.


