Article

Improvement of Indoor Thermal Environments through Green Refurbishment

Department of Architecture, Ajou University, Suwon 16499, Korea
Sustainability 2020, 12(12), 4933; https://doi.org/10.3390/su12124933
Submission received: 7 May 2020 / Revised: 28 May 2020 / Accepted: 15 June 2020 / Published: 17 June 2020

Abstract

:
This study investigates the performance of the “green refurbishment” of existing buildings. Two ordinary rooms in an existing building were chosen for examination. Refurbishment measures such as additional insulation, high-performance glazing, and air-tightening were applied to the control room. Temperature and electricity use were monitored to identify heating performance in winter and then compared with a baseline. The results of the field tests showed that green refurbishment significantly improved heating performance. Lowered heating load and electricity use with increased airtightness were also verified through building performance simulations. The empirical investigation suggests a predictive model to obtain indoor minimum temperatures as a function of outdoor temperature swings.

1. Introduction

Upgrading the energy efficiency of buildings has become a global issue; many governments have established goals for the reduction of greenhouse gas (GHG) emissions and energy use. In the construction sector, buildings account for 24% of total energy consumption [1,2]. The environmental performance of new buildings has been continuously improved due to consistent updating of regulations and green building certification standards. However, the majority of existing buildings, which make up 99% of the building sector, demonstrate relatively poor energy performance and thus have a negative impact on the energy consumption of the building sector [3]. It has been reported that newly built homes emit 0.86 tons of carbon dioxide on average, while existing homes produce 1.6 tons [4]. Additionally, the environmental impact of extending the life cycles of buildings is significantly less than that of demolition and new construction [5]. Regarding these issues, Sunikka [6] has argued that the real potential for sustainable construction and CO2 reduction lies in the management of existing buildings in the residential sector.
To address this issue, many countries and organizations have tried to increase energy efficiency in the existing building sector over the last decade. The U.S. federal government has financially supported the refurbishment of existing buildings, and Australia has also invested a significant amount of money into increasing the energy efficiency of existing buildings [3]. In 2014, the Korean government set the goal of reducing GHG emissions by 37%, relative to the business-as-usual (BAU) standard of 851,000,000 tons, by 2030 [2] and initiated a project supporting “green remodeling” to improve the energy performance of existing buildings. The Ministry of Land, Infrastructure, and Transport (MOLIT) and the Korea Land and Housing Corporation (LH) are supporting this project, which involves both the public and private construction sectors.
Many researchers have examined various aspects of green refurbishment. Numerous studies have investigated the current status and methodologies related to green refurbishment in various local environments. Methodologies and state-of-the-art techniques for retrofitting existing buildings have been investigated, as well as future directions in the field [3,7]. Some research has also focused on the impact of the green refurbishment of local historic buildings on real estate markets [8].
At present, the largest benefit of building refurbishment is considered to be energy savings. To maximize the effects of green refurbishment, many factors must be considered, proper decision-making processes must be employed, and appropriate tools must be used [9,10]. Thus, research has been conducted on decision-making methods and tools for green refurbishment to achieve optimum energy efficiency [11,12]. Some studies have focused on the hierarchy of refurbishment strategies to achieve zero-carbon buildings [13]. Korean researchers have also developed decision-making frameworks for green refurbishment, considering the government-funded Green Remodeling project, and investigated their applicability [14,15].
To achieve maximum energy efficiency for buildings, performance evaluation has been studied as a key factor for green refurbishment. Building energy simulation studies have been conducted as a common tool for pre-performance evaluation at the design stage [16,17,18]. Many researchers have used diverse building energy simulation programs to evaluate refurbishment settings, the performance of different design strategies, the performance of new materials, and economic feasibility in different local and climatic conditions [1,19,20,21]. Additionally, emphasis has been placed on the importance of field measurement as a post-performance evaluation method [22,23,24]. Various green refurbishment factors have been investigated to evaluate performance, such as airtightness, insulation, and building envelope, and many researchers have reported specific energy saving results based on field measurements in diverse countries [23,25,26]. The Korean government has developed a national building energy management system, based on which comparative performance evaluations have been conducted considering performance before and after green refurbishment [2,27,28,29]. Additionally, Ascione et al. [24] proposed a performance analysis methodology for green refurbishment based on the comprehensive evaluation methods of field measurement and energy simulation. In this context, The purpose of this study is to verify the heating energy reduction and to improve the indoor thermal environment via green refurbishment of an existing building (though passive house-level insulation, high performance windows, and an increase in air-tightness). To achieve this, one of two identical rooms in the existing building, with the same size and orientation, were refurbished to conduct comparative analysis. The indoor environment and heating energy consumption were monitored, and the data were analyzed.
Many studies have investigated the enhancement of performance through green refurbishment, but field studies on the improvement of thermal performance require further investigation regarding performance evaluation and variation across different climatic conditions. Therefore, this paper discusses the improvement and evaluation of performance through green refurbishment. An existing building (85 m2) that met the size requirements for the reception of government funding for a green refurbishment project was selected as the test site. The building’s energy performance was initially analyzed using an energy simulation program (DesignBuilder), after which refurbishment construction was conducted on the building. Multiple monitoring experiments were then performed to measure the building’s heating performance in winter, and a comparative analysis was conducted.

2. Materials and Methods

2.1. Test Building

The test building was constructed in 2006 and is located in Yangji-meon, Cheoin-gu, Yong-In City, South Korea, which is 40 km to the South-East of Seoul. The site is located in a rural area and is far enough from the neighboring houses that they will not be affected physically. It is a two-story residential building with a reinforced concrete structure, and the test rooms are on the first floor of the building. Although the building was registered as a residential building, the whole building was designed as a testbed for the research. In particular, two rooms on the first floor were designed to compare the building performances in terms of different materials, design, etc.
The building code for insulation in 2006 was much lower than that of the current requirements, and the windows and finishing materials have aged. Therefore, this building was selected as a test site to validate the performance improvement created by green refurbishment. Two rooms in the building were selected to compare and verify the thermal performance of green refurbishment.

2.2. Energy Simulation

An energy simulation was initially conducted on rooms in the building to analyze the performance improvement of green refurbishment, and the DesignBuilder software (using the EnergyPlus engine) was selected for energy simulation. Various combinations of different materials were analyzed, and final materials were selected considering energy performance improvement as well as economic feasibility. A climate data file (EPW) for Yong-In city (the building site) was obtained from the national weather station and applied in the energy simulation.

2.3. Test Building and Green Refurbishment

Green refurbishment construction was conducted based on the results of the simulation and material selections. One room was selected as the control site and remained in its original state. The other room was used as the experimental site for green refurbishment elements. The existing reinforced concrete structure and doors were reused in both units. To enhance the thermal performance of the green refurbishment site, additional insulation material was applied inside the walls, the existing windows were replaced with high-performance windows, and seals were installed around the windows. The inner partition wall between the two test rooms was also augmented with additional insulation to prevent thermal interference. The green refurbishment was completed on 28 January 2016, and the test sites were stabilized without any residents or use before the monitoring experiments.
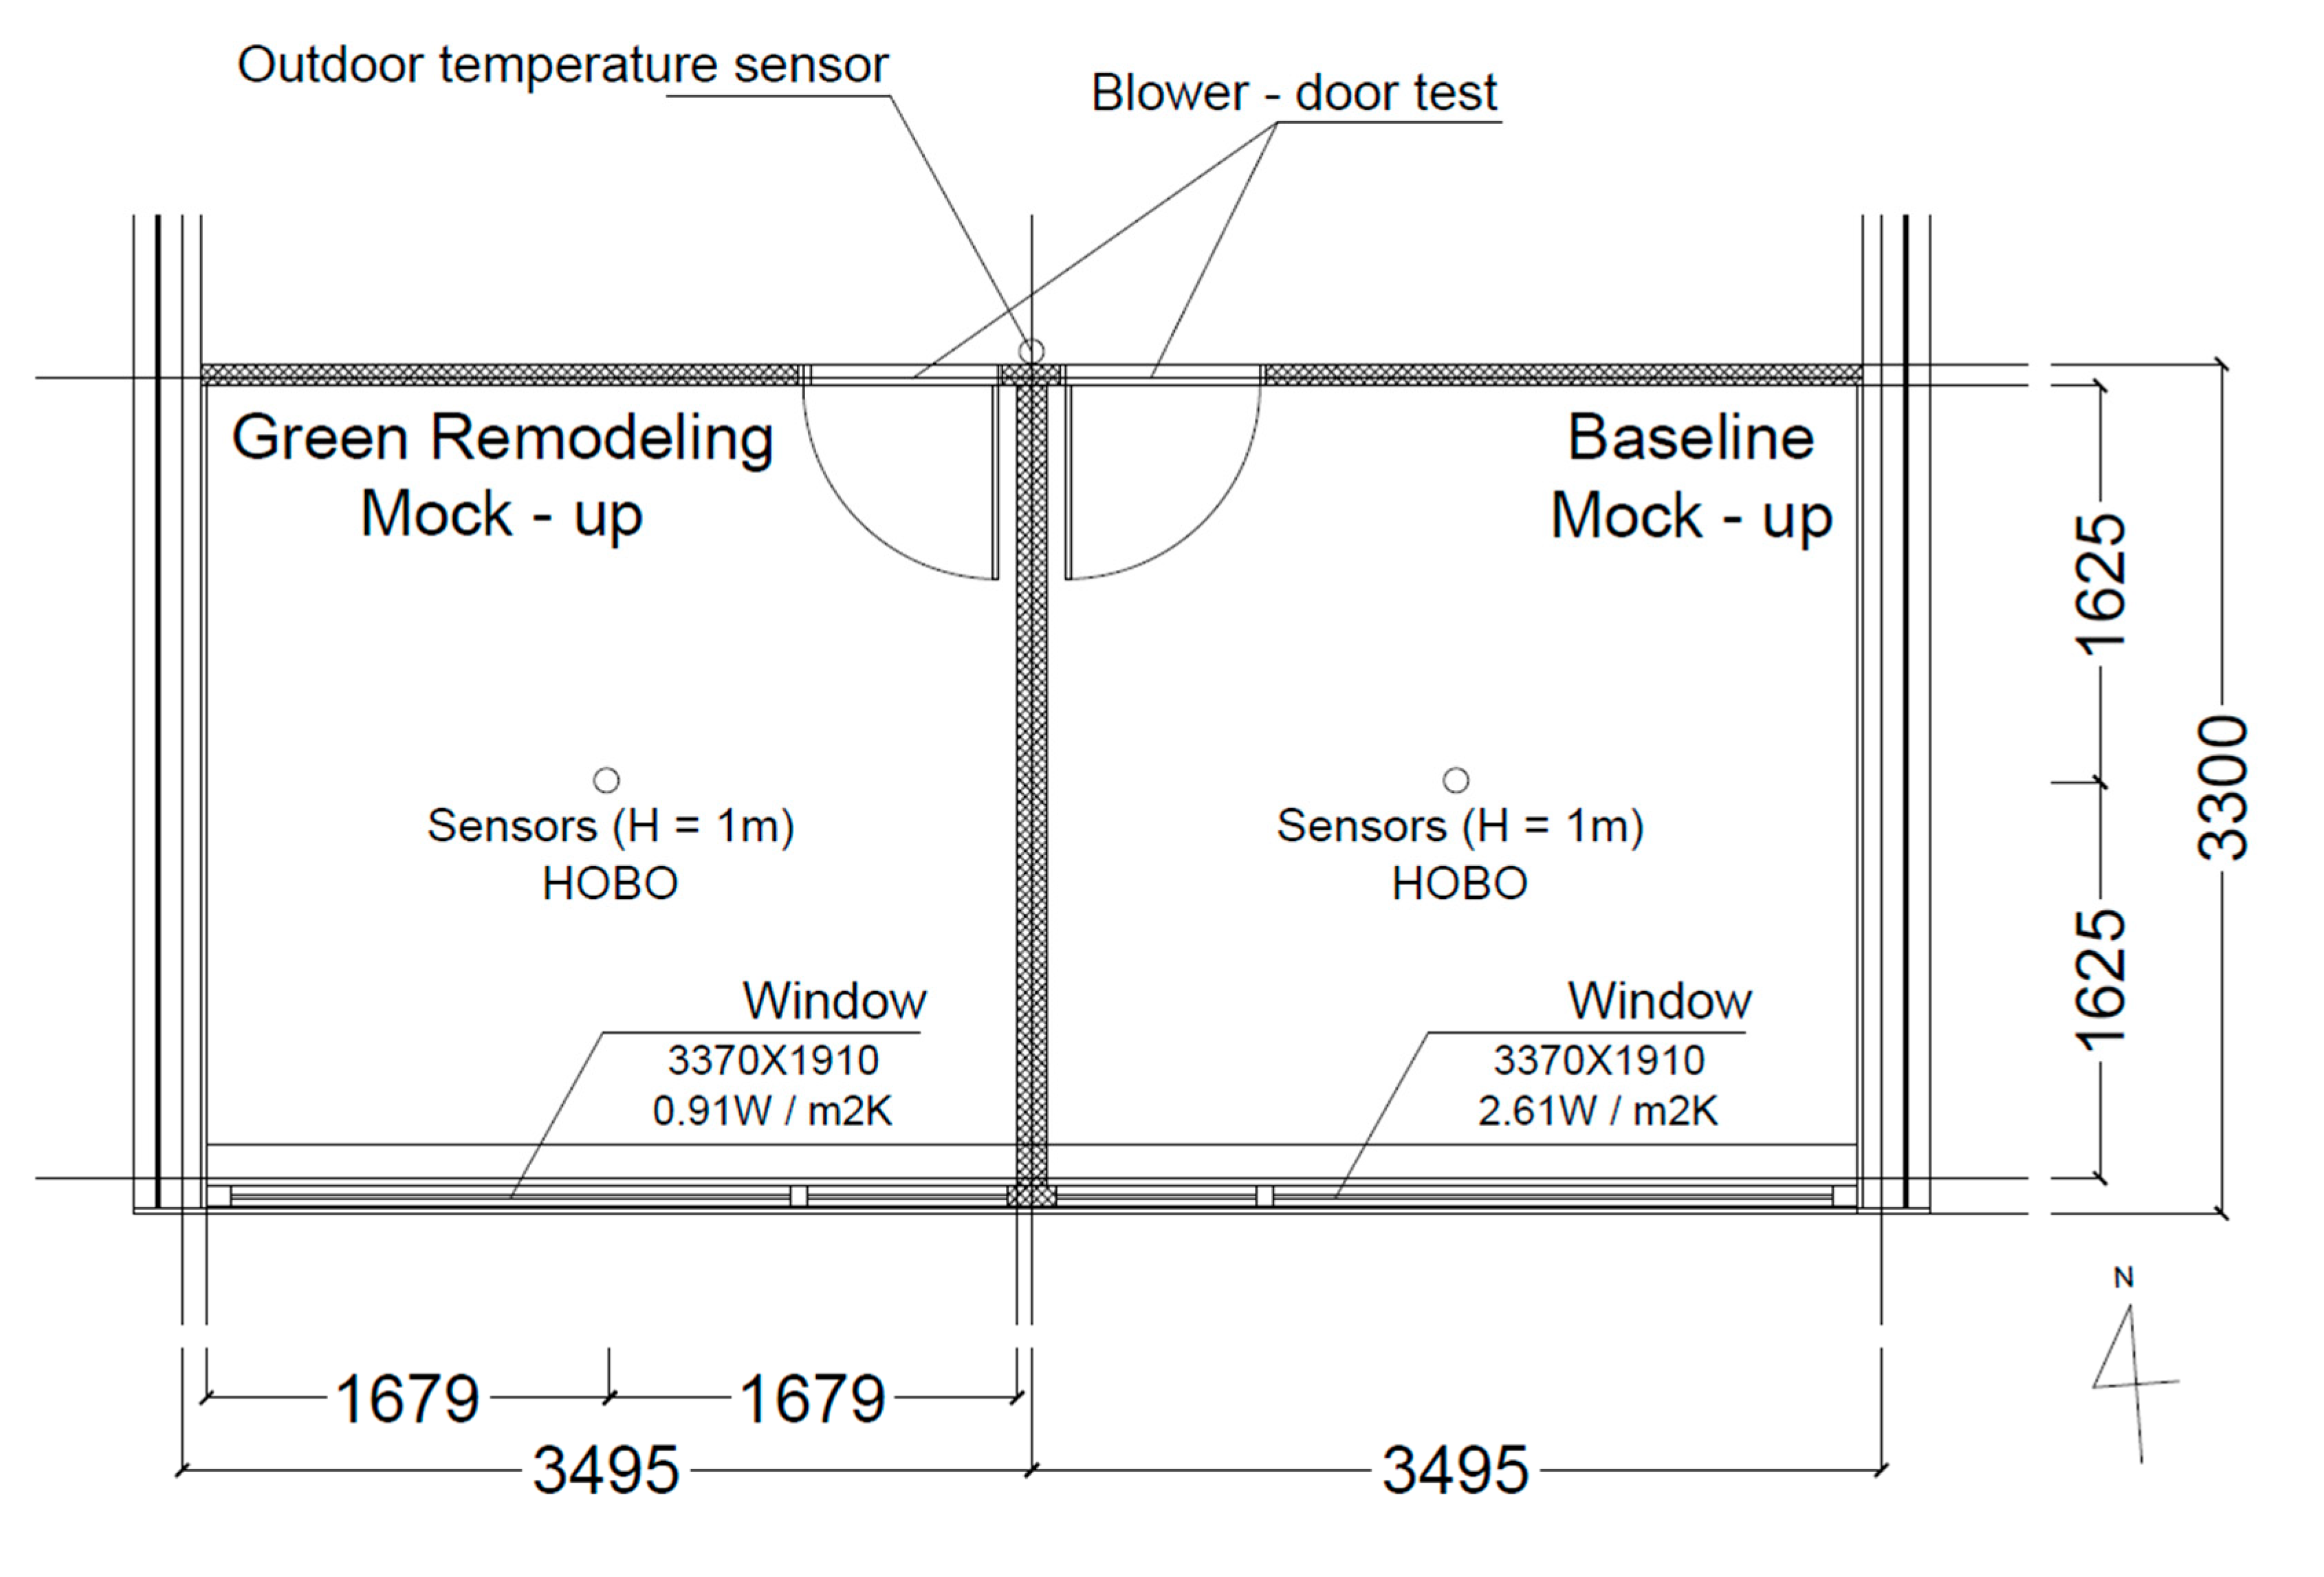
The two test rooms in the building faced south for optimum passive solar use. The east room was selected as a baseline (BL) room (control group), and the west room was selected as a green refurbishment (GR) room (experimental group). The rooms were identical in size and plans, with measurements of 3.495 m (W) × 3.3 m (D) × 2.4 m (H) and a floor area of 11.53 m2. The rooms were also separated from the common area by an insulated partition wall to minimize impact caused by the adjacent space (Figure 1).
The outer wall of the existing building is 404 mm and consists of drywall on the inside, a 180 mm reinforced concrete structure, 100 mm extruded polystyrene insulation with an air gap, and a lightweight soil block outside. The inner partition wall was planned with 70 mm glass wool insulation and drywall on each side (89 mm), and the U-value was 0.426 W/m2K. The floor of both sites consists of 100 mm of leveling concrete, 300 mm of reinforced concrete, and 120 mm of cement mortar. The thickness of the floor is 520 mm, and the U-value was 2.142 W/m2K. The ceiling consists of 300 mm of reinforced concrete, 120 mm of cement mortar, and 30 mm of wood siding (making a total of 450 mm), and the U-value was 1.448 W/m2K. The material property of the outer wall, floor, ceiling, and inner wall are demonstrated in Table 1, Table 2, Table 3 and Table 4.
The existing windows in the test rooms were installed on the south wall, and the entrance doors were located on the north inner walls, which were connected to the indoor corridor. A double-glazed window with poly vinyl chloride (PVC) frames, which was previously installed, remained in the baseline test room, and the window in the green refurbishment test room was replaced with a triple low-E window with a PVC frame (U-value: 0.91 m2K). The plan and specifications of the window are shown in Figure 2 and Table 5.

2.4. Monitoring Equipment and Method

Blower-door tests were conducted to measure the airtightness of the rooms following the KS L ISO 9972 regulation. The blower door test determines the average air infiltration under a certain atmospheric pressure and shows the indoor air changes that occur within an hour (1/h). In a German passive house, 60% indoor air changes per hour at 50 Pa is the standard, which is presented as 50 Pa = 0.6 (1/h). The Minneapolis Blower DoorTM DG-700: Model 3 blower door fan of TEC Co. was used in the experiment and was manufactured according to the DIN EN 13829 standard. TECTITETM building airtightness software was used for airtightness data analysis. Compression and decompression tests were conducted separately for each room, and the average value between the two tests was determined to validate the airtightness of each room. Specifications concerning the blower door test equipment are shown in Table 6.
HOBO type data loggers by Onset computer were used to measure indoor and outdoor temperature (Model: UX100-011). The measurement range is 20~70 °C with ± 0.21 °C accuracy (at 0~50 °C). All sensors were installed on 30 January 2016, and were tested before the start of the monitoring experiments. Indoor temperature sensors were placed at a height of one meter in the center of the floor in each room. Outdoor temperature sensors were installed on the north side of the building, and a shading cover was installed on each sensor to prevent direct solar radiation while providing ventilation around the sensor. The temperature was measured and recorded every 60 seconds, and data were collected after each experiment.

2.5. Test Method

The monitoring experiments were conducted from February 10th to 29th, 2016, which is late winter in Korea. Heating experiments were conducted to validate indoor thermal performance improvement. An electric fan heater (power consumption: 2500 W) set to 18 °C was used for heating. The heater was placed in the center of the room, 50 cm lower than the indoor temperature sensor to prevent interference. The heater operated 24 h a day during the heating experiment. A watt-hour meter was connected to the heater to measure electricity usage, and results for the BL room and GR room were compared.
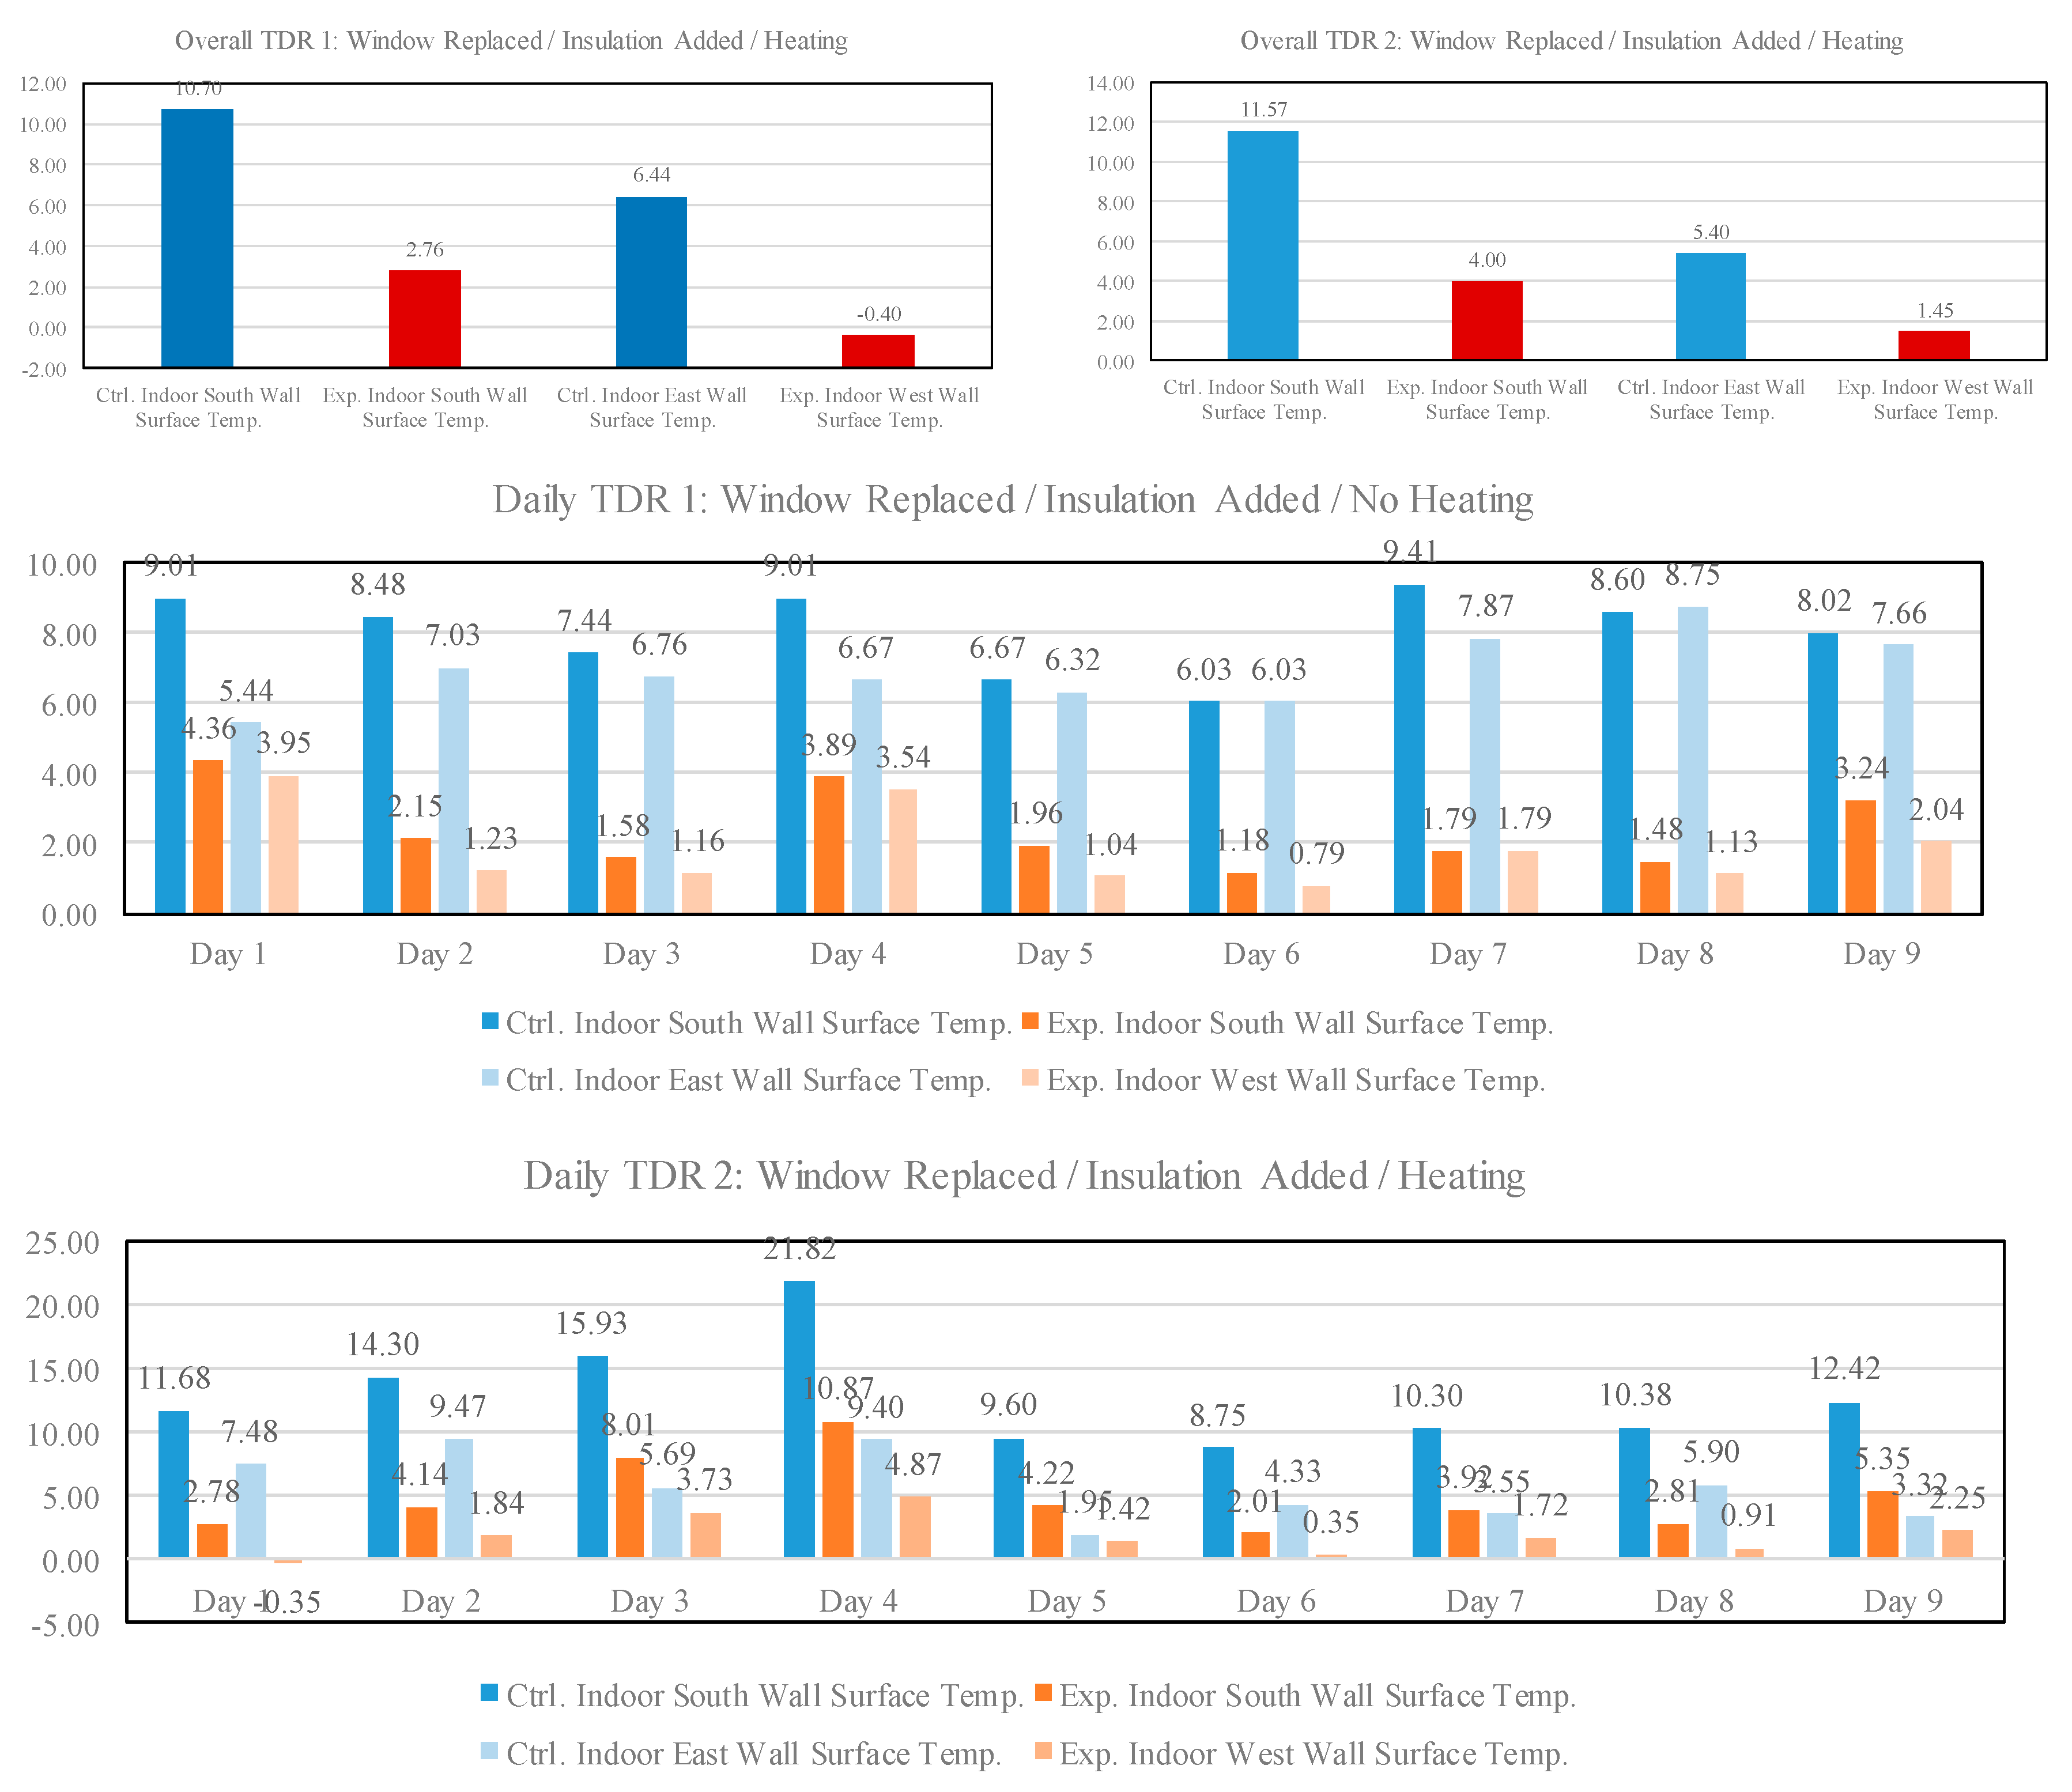
The collected data were analyzed using various statistical tools and methods. Minitab 17.0 and Microsoft Excel were used for data analysis, and statistical analysis was conducted at a 95% significance level. Multiple statistical methods, such as a paired t-test, two sample t-tests, and TDR (Time difference Ratio) were used to verify and compare the thermal performance of the two rooms. The procedure used in the study is illustrated in Figure 3.

3. Results

3.1. Blower Door Test

The blower door test results are shown in Table 7. In the BL room, the airtightness was 50 Pa = 25.19 (1/h), while the GR room showed 50 Pa = 18.345 (1/h). After green refurbishment, the airtightness of the refurbished room increased by 27.2% due to the replacement of the window, the addition of seal tape, and the installation of additional insulation material. The results thus show that the application of two green refurbishment factors (high-performance windows and insulation) significantly improved thermal performance by enhancing the airtightness of the room. However, in comparison with the airtightness of the German passive house standard, which is lower than 0.6 (1/h) at 50 Pa, the airtightness of the GR room appears to be very low. Therefore, it can be argued that additional augmentations are required to improve the overall airtightness of the building.

3.2. Building Energy Simulation

DesignBuilder software (Ver. 5.0.1.017) with the EnergyPlus analysis engine (Ver. 8.5.0) was used for the energy simulation of the building. This simulation was conducted to analyze the scheduled heating load from February 10th–19th (heating experiment schedule). The indoor temperatures of both rooms were set at 18 °C for heating (setback 16 °C). The number of occupants was set to two, and the basic template for residential buildings provided by DesignBuilder was applied for the occupancy schedule. Construction data such as the material properties, the thickness of the material, and the U-value of each part were applied using the values set out in Table 1, Table 2, Table 3, Table 4, Table 5 and Table 6 and Figure 2 and Figure 3 in the previous chapter. Additionally, it should be noted that the airtightness value was limited to a maximum of 5 ac/h in DesignBuilder. However, the actual airtightness values of the baseline (25.19 ac/h) and GR rooms (18.345 ac/h) were larger than the maximum value of the program (5 ac/h). Thus, it was not possible to accurately analyze energy performance in the simulation. As an alternative, the airtightness value of the BL room was set at 5 ac/h, and 3.64 ac/h was input for the air tightness of the GR room, which was calculated according to the proportions of the actual values. The simulation results are shown in Table 8.
It is very clear that the heating load of the GR room is lower than that of the BL room. In the scheduled heating simulation, which was run during the same period as the monitoring experiment (February 10th–19th), the heating load of the GR room was 103.85 kWh lower than that of the BL room, and the heating load per area (m2) of the GR room also appeared to be 11.6 kWh/m2 lower than that of the BL room. In the annual heating design load simulation, the GR room showed a 42~43% lower value than the BL room in both scheduled heating load and annual heating load. Therefore, the heating energy use decreased by 42~43% after the green refurbishment process, which included the installation of additional insulation and a high-performance window. However, the airtightness value in the simulation was not applied accurately due to the limitations of DesignBuilder; therefore, further studies are required to validate the influence of airtightness.

3.3. Experiment Results

3.3.1. Temperature Monitoring

Temperature monitoring experiments were conducted to validate the improvement of thermal performance through green refurbishment. The initial monitoring experiment was performed for ten days, from February 19th to 29th, without the operation of the heating device. Table 9 demonstrates the results, and Figure 4 illustrates temperature variation on the selected days.
The indoor temperature of both rooms was higher than the outdoor temperature during the experiment, even though the heating device was not operated. To compare the indoor temperature, a paired t-test was conducted by using data from each room (data observation = 2280 per room). The result demonstrated that the average temperature of the GR room was 1.35 °C higher than that of the BL room, with a significant p-value (t-statistics = −12.83, p < 0.001) (Table 9). However, the maximum temperature of the GR room was 5.39 °C lower than that of the BL room, and the minimum temperature of the GR room was 2.38 °C higher than that of the BL room. This indicates that the GR room had relatively small indoor temperature swings, and the standard deviation of the GR room was also smaller than that of the BL room. Therefore, thermal stability was improved by the green refurbishment process due to the installation of additional insulation and a high-performance window.

3.3.2. Heating Experiment

A heating experiment was conducted to compare the thermal performance and actual heating energy use of the two rooms. The experiment was performed from February 10th to 19th, 2016. The temperature monitoring results are shown in Table 10 and Figure 5.
During the heating experiment, the fan heater was set to 18 °C and operated 24 h a day. The indoor temperature of both rooms was maintained between 16~19 °C. The average indoor temperature in the BL room appeared to be 0.22 °C higher than that of the GR room. A paired t-test verified that the difference was statistically significant (p < 0.001); however, the difference between the two rooms appeared insignificant due to the instrument accuracy. Additionally, the maximum indoor temperature of the BL room was 5.24 °C higher than that of the GR room, while the minimum indoor temperature of the BL room was 0.58 °C lower than that of the GR room. This revealed a relatively small indoor temperature swing for the GR room, and the standard deviation of the GR room also demonstrated a smaller value than that of the BL room.
For further analysis, the electricity use of each fan heater was recorded, the results of which are shown in Table 11. The electricity use from the 10th to 14th of February was not recorded due to a malfunction in the equipment. It is clear that the operation of the fan heater in the GR room was significantly less than that of the BL room. The GR room showed 15~33% (Avg. 24%) less operation than that of the BL room. Similarly, the electricity use of the GR room was significantly smaller than that of the BL room. Both the daily average use and total use showed the same results, and the GR room used 51~68% less electricity than the BL room on a daily basis (Table 11). Additionally, Figure 2 shows that the indoor temperature of the BL room decreased faster than that of the GR room when the heater was not operating during the daytime due to the thermal performance difference created by the additional insulation and window replacement. Therefore, it was found that heating load can be decreased significantly through green refurbishment, which directly influences the economic feasibility of building operation and maintenance.

4. Discussion

4.1. Comparative Analysis of Thermal Performance

The average minimum temperature can provide an indication of the thermal performance of an indoor built environment. Less heating is required when the minimum temperature is higher than the outdoor minimum temperature and the control group [30]. Table 12 displays the daily indoor minimum temperature under non-heating and heating conditions, as well as temperature differences (ΔT = TGR − TBL).
During monitoring experiments, the outdoor minimum temperature was lower than the indoor minimum temperature of both rooms, with a 12~19 °C difference between outdoor and indoor minimum temperature. It is also clear that the indoor minimum temperature of the GR room was consistently lower than that of the BL room in both heating and non-heating conditions. In non-heating conditions, the minimum indoor temperature of the GR room was 2.43 °C higher than that of the BL room on average, and the minimum indoor temperature in heating conditions also showed a 0.48 °C difference on average between the GR and BL rooms. The Natural Research Council of Canada reported that 3.7~4.3% of heating energy can be reduced by differences of 1 °C [31], and Palmer et al. [32] have also argued that 13% of the heating load can be decreased by lowering the thermostat by 1 °C. Therefore, it can be argued that 2.43 °C of the minimum indoor temperature difference between the GR room and BL room accounts for the reduction of the heating load by 9~30%. However, this of course requires further experimentation with different factors such as insulation, airtightness, and the thermal performance of windows to determine the accurate performance of each refurbishment factor.
Temperature swing can also help indicate a system’s thermal performance. Smaller temperature swings indicate better thermal stability and performance. Table 13 demonstrates temperature swing in non-heating and heating conditions.
It is clear that the GR room demonstrated the most stable temperature swing in both heating and non-heating conditions. The indoor temperature swing of the GR room was 4.22 °C smaller than that of the BL room when the fan heater was not operating, and the temperature swing of the GR room under heating conditions was also 2.36 °C smaller than that of the BL room. Therefore, it can be argued that the additional thermal capacity of insulation material and enhanced window performance significantly improved the performance of the GR room.

4.2. Temperature Difference Ratio (TDR)

The simulation results and monitoring results showed significant differences due to the multiple indoor environmental variables as well as the limitations of the simulation program. To accurately predict the indoor temperature of the GR room, an empirical predictive equation was derived from the calculated TDR based on the field measurement results. The concept of TDR was proposed by Givoni to compare cooling strategies within the same system when tests occur in different periods of time [33,34]. TDR normalizes the capacity to reduce the indoor maximum temperature as a function of outdoor temperature swing [35]. The equation for TDR is demonstrated below and is valid when indoor temperature is affected by outdoor temperature swings.
TDR = T m a x , o u t T m a x , i n T m a x , o u t T m i n , o u t
where Tmax, out, Tmax, in, and Tmin, out are the outdoor maximum, indoor maximum, and outdoor minimum temperature, respectively. The same principle holds for the heating strategies, as formulated by:
TDR = T m i n , o u t T m i n , i n T m i n , o u t T m a x , o u t
where Tmin, in is the indoor minimum temperature. A higher TDR value indicates a larger difference between outdoor and indoor minimum temperature, which is normalized by outdoor swing (Tmax, outTmin, out) and indicates better heating performance. TDR values under both conditions were calculated and are demonstrated in Table 14.
TDR values revealed that the GR room has better heating performance than the BL room. In non-heating conditions, the average and daily TDR of the GR room were consistently higher than that of the BL room, from 0.23 to 0.40 (average: 0.29). However, the TDR of the GR room was still higher than that of the BL room (average: 0.05), which indicates that the GR room has better heating performance than the BL room.
TDR can be applied to generate predictive equations for minimum indoor temperature. A linear regression model was used to predict TDR for the GR room. Figure 6 shows the linear regression model of the GR room in non-heating conditions; the X-axis indicates daily outdoor swing, and the Y axis shows the TDR of the GR room. The regression model for GR is:
TDR = 0.1382 ( T m a x , o u t T m i n , o u t ) + 3.4066
and R2 is 0.867. Once TDR is calculated, it is possible to predict the indoor minimum temperature using (2). The predictive model for the GR room in non-heating conditions becomes:
T m i n , i n = T m i n , o u t T D R ( T m i n , o u t T m a x , o u t )
and introducing (3), (4) can be rewritten as:
T m i n , i n = T m i n , o u t + { 0.1382 ( T m a x , o u t T m i n , o u t ) 3.4066 } ( T m i n , o u t T m a x , o u t )
Outdoor maximum and minimum temperatures are required to predict indoor minimum temperature using Equation (5). Additionally, Figure 7 and Figure 8 illustrate the recorded and predicted indoor temperature of the GR room using Equation (5). Statistical analysis of the data samples (the recorded and simulated temperature) was carried out to validate this model. Although a p-value of 0.035 from a Brown–Forsythe’s test showed homogeneity of the variances (p < 0.05), p-values of 0.479 and 0.335 from Shapiro–Wilk tests indicated non-normality of the data. Accordingly, the Mann–Whitney U (MWU) test, a non-parametric method to compare two samples, was employed. A MWU test resulted in a p-value of 1, which verifies statistical similarity in the recorded temperature and the simulated sample (p > 0.05).

5. Conclusions

This study investigated the improvement of an indoor thermal environment through green refurbishment in Korea. An existing building was selected as a test site, and multiple monitoring experiments were conducted to measure and compare actual heating performance in winter. The results validated the significant improvement in heating performance created by green refurbishment. The green refurbishment process decreased heating load significantly in the simulation results, and the field measurement for electricity use in the heating experiment and the airtightness verified this result. Simulation results by DesignBuilder showed that 42–43% of heating energy consumption was decreased by the green refurbishment, however, the monitoring result showed 51~68% energy consumption. Additionally, the indoor temperature of the GR room was 4.22 °C lower than the other one so that it maintained a more stable indoor thermal environment. This result indicates that indoor thermal environment quality can be improved by the green refurbishment, and heating energy consumption can be reduced by more than 50%.
Regarding minimum indoor temperature and indoor temperature swing, the stability of the indoor thermal environment was enhanced by the green refurbishment process. This study also developed a simple equation to predict the indoor minimum temperature of the refurbished room using TDR. The methodology used to derive the empirical equation can be applied to other buildings, allowing the calculation of minimum indoor temperature as a function of outdoor temperature swing.
The findings of this study contribute to the understanding of thermal performance improvement created by green refurbishment. This technical result can be considered in green refurbishment projects to identify performance augmentation as well as differences between simulation results and field measurements.
Although the findings of this study are significant, the limitations of the research should be taken into account. First, more field measurement should be conducted to increase the accuracy of the results. Monitoring experiments in other seasons (e.g., summer) and extreme conditions will provide additional information about performance improvement and the limitations of green refurbishment. The application of other heating systems and different levels of airtightness will also increase the accuracy of the results. In addition, other simulation programs should be considered for further study. Finally, other green refurbishment factors need to be investigated using simulations and field measurement, which will help validate the accuracy of the differences between simulations and filed measurements.

Funding

This work was supported by the National research Foundation of Korea (NRF) grants funded by the Korean government (MEST) (NRF-2015R1A2A2A01008454 and NRF-2019R1A2C1009130).

Conflicts of Interest

The author declares no conflict of interest.

References

  1. Konstantinou, T.; Knaack, U. An approach to integrate energy efficiency upgrade into refurbishment design process, applied in two case-study buildings in Northern European climate. Energy Build. 2013, 59, 301–309. [Google Scholar] [CrossRef]
  2. Jang, M.; Kim, S.; Song, I.; Lee, H. The Energy Saving Effect of Existing Buildings according to the Green Remodeling. In Proceedings of the Society of Air-Conditioning and Refrigerating Engineers of Korea, Seoul, Korea, 25 November 2016; pp. 176–179. [Google Scholar]
  3. Ma, Z.; Cooper, P.; Daly, D.; Ledo, L. Existing building retrofits: Methodology and state-of-the-art. Energy Build. 2012, 55, 889–902. [Google Scholar] [CrossRef]
  4. Department for Communities and Local Government (DCLG). Existing Housing and Climate Change: Seven Repost of Session 2007-08 (HC 432-I); Department for Communities and Local Government (DCLG): London, UK, 2008.
  5. Thomsen, A.F.; van Der Flier, C.L. Replacement or reuse? The choice between demolition and life cycle extension from a sustainable viewpoint. Presented at ENHR International Research Conference Shrinking Cities, Sprawling Suburbs, Changing Country Sides, Dublin, Ireland, 6–9 July 2008; Available online: http://repository.tudelft.nl/assets/uuid:a670a506-74e6-4c4e-b7b6-71107fb9778d/219624.pdf (accessed on 3 December 2017).
  6. Sunikka, M. Sustainable housing policies and the environmental potential of the existing housing stock in Europe. Build. Res. Inf. 2002, 1, 1–10. [Google Scholar]
  7. Davies, P.; Osmani, M. Low carbon housing refurbishment challenges and incentives: Architects’ perspectives. Build. Environ. 2011, 46, 1691–1698. [Google Scholar] [CrossRef]
  8. Filippi, M. Remarks on the green retrofitting of historic buildings in Italy. Energy Build. 2015, 95, 15–22. [Google Scholar] [CrossRef]
  9. Zavadskas, E.K.; Kaklauskas, A.; Tupenaite, L.; Mickaityte, A. Environmental Decision-Making Model for Sustainable Buildings Refurbishment. Proc. 7th Int. Conf. Environ. Engieering. 2008, 7, 894–901. [Google Scholar]
  10. Balaras, C.A.; Dascalaki, E.; Kontoyiannidis, S. Decision support software for sustainable building refurbishment. Trans. Am. Soc. Heat. Refrig. Air Cond. Eng. 2004, 110, 592–601. [Google Scholar]
  11. Jaggs, M.; Palmer, J. Energy performance indoor environmental quality retrofit—A European diagnosis and decision making method for building refurbishment. Energy Build. 2000, 31, 97–101. [Google Scholar] [CrossRef]
  12. Gohardani, N.; Björk, F. Sustainable refurbishment in building technology. Smart Sustain. Built Environ. 2012, 1, 241–252. [Google Scholar] [CrossRef]
  13. Xing, Y.; Hewitt, N.; Griffiths, P. Zero carbon buildings refurbishment—A Hierarchical pathway. Renew. Sustain. Energy Rev. 2011, 15, 3229–3236. [Google Scholar] [CrossRef]
  14. Oh, J.; Hong, T.; Jeong, K. Framework for Development of Optimal Selection Model for Green remodeling in Multi-family housing Complex. In Proceedings of the Korea Institute of Construction Engineering and Management, Incheon, Korea, 11 November 2016; pp. 75–76. [Google Scholar]
  15. Choi, J.; Kim, G.-R.; Ko, J.; Shin, J.-W.; Lee, K. The Study of the Passive and Active Element Technique Classification System for Green-Remodeling. J. Korean Inst. Archit. Sustain. Environ. Build. Syst. 2016, 10, 266–274. [Google Scholar]
  16. Kim, Y.-A.; Jang, H.-I.; Park, C.-Y.; Jang, D.-H.; Lee, K.H. Comparison of Cooling and Heating Load Analysis Characteristics of the Energy Performance Assessment Tools for Green Remodeling. J. Korean Inst. Archit. Sustain. Environ. Build. Syst. 2016, 10, 449–455. [Google Scholar]
  17. Kim, Y.-A.; Jang, H.-I.; Park, C.; Koo, B.-K.; Lee, K.-H. Comparison of Characteristic of Existing Building Energy Performance Analysis Tools for Green Remodeling. In Proceedings of the Society of Air-Conditioning and Refrigerating Engineers of Korea, Seoul, Korea, 25 November 2016; pp. 874–875. [Google Scholar]
  18. Cho, J.-H.; Ko, J.-L.; Ahn, H.-J.; Kim, D.-B. A Study on the Energy Performance Improvement through Green-remodeling of Small Sized Buildings. In Proceedings of the Korean Institute of Architectural Sustainable Environment and Building Systems, Mokpo, Korea, 12 November 2016; pp. 61–62. [Google Scholar]
  19. Rabouille, M.; Wurtz, E.; Perrotin, P. Analysis of dynamic thermal simulation for refurbishment. In Proceedings of the BS2013: 13th Conference of International Building Performance Simulation Association, Chambéry, France, 26–28 August 2013; pp. 358–365. [Google Scholar]
  20. Ascione, F.; Bianco, N.; De Masi, R.F.; de’Rossi, F.; Vanoli, G.P. Energy refurbishment of existing buildings through the use of phase change materials: Energy savings and indoor comfort in the cooling season. Appl. Energy 2014, 113, 990–1007. [Google Scholar] [CrossRef]
  21. Bojić, M.; Djordjević, S.; Stefanović, A.; Miletić, M.; Cvetković, D. Decreasing energy consumption in thermally non-insulated old house via refurbishment. Energy Build. 2012, 54, 503–510. [Google Scholar] [CrossRef]
  22. Kim, S.-I.; Lee, H.-H.; Lim, J.-H.; Song, S.-Y. Field Measurements and Evaluation of Insulation Performance of Opaque Outer Walls for Green Remodeling of Old Commercial Buildings. J. Archit. Inst. Korea 2014, 30, 237–246. [Google Scholar]
  23. Bianco, L.; Serra, V.; Fantucci, S.; Dutto, M.; Massolino, M. Thermal insulating plaster as a solution for refurbishing historic building envelopes: First experimental results. Energy Build. 2015, 95, 86–91. [Google Scholar] [CrossRef]
  24. Ascione, F.; De Rossi, F.; Vanoli, G.P. Energy retrofit of historical buildings: Theoretical and experimental investigations for the modelling of reliable performance scenarios. Energy Build. 2011, 43, 1925–1936. [Google Scholar] [CrossRef]
  25. Hong, S.; Ian, R.; Oreszczyna, T.; The Warm Front Study Group. The impact of energy efficient refurbishment on the airtightness in English dwellings. In Proceedings of the 25th AVIC Conference, Prague, Czech Republic, 15–17 September 2004; pp. 7–12. [Google Scholar]
  26. Hong, S.H.; Oreszczyn, T.; Ridley, I. The impact of energy efficient refurbishment on the space heating fuel consumption in English dwellings. Energy Build. 2006, 38, 1171–1181. [Google Scholar] [CrossRef]
  27. Park, B.; Lee, K.; Koo, B.-K.; Kim, K. Green Remodeling Effects of Republic Building Energy Consumption Analysis. In Proceedings of the Autumn Conference of Architectural Institute of Korea, Busan, Korea, 5 October 2016; pp. 2–3. [Google Scholar]
  28. Son, W.; Chun, J.; Yoon, D.; Park, S. A study on the Energy Saving Techniques and Energy Performance Improvement through Green-Remodeling of Office Building. In Proceedings of the Society of Air-Conditioning and Refrigerating Engineers of Korea, Kangwon, Korea, 25 June 2015; pp. 374–377. [Google Scholar]
  29. Jung, S.; Yu, J. Tax Exemption Grant Proposal to Promote Green Remodeling Project Implementation. J. Korea Inst. Constr. Eng. Manag. 2016, 17, 66–75. [Google Scholar]
  30. Yeom, D.; La Roche, P. Experimental Research on the Cooling Performance of Green Roof with Radiant Cooling System. In Proceedings of the PLEA2016, Los Angeles, CA, USA, 11–13 July 2016; pp. 806–812. [Google Scholar]
  31. Manning, M.M.; Swinton, M.C.; Szadkowski, F.; Gusdorf, J.; Ruest, K. The effects of thermostat setback and setup on seasonal energy consumption, surface temperatures, and recovery times at the CCHT twin house research facility. ASHRAE Trans. 2007, 113, 630–641. [Google Scholar] [CrossRef]
  32. Palmer, J.; Terry, N.; Pope, P. How Much Energy Could be Saved by Making Small Changes to Everyday Household Behaviours? Camb. Archit Res. 2012, 1–31. [Google Scholar]
  33. Givoni, B.; La Roche, P. Incidence of the Distribution of Mass in the Air Temperature of a Simple Roof Radiator. In Proceedings of the PLEA 2001, Florianopolis, Brazil, 7–9 November 2001; pp. 803–807. [Google Scholar]
  34. La Roche, P.; Milne, M. Effects of window size and thermal mass on building comfort using an intelligent ventilation controller. Sol. Energy 2004, 77, 421–434. [Google Scholar] [CrossRef]
  35. La Roche, P. Green cooling: Combining vegetated roofs with night ventilation. In Proceedings of the ASME International Solar Energy Conference–Solar Engineering 2006, Denver, CO, USA, 9–13 July 2006; ASME: New York, NY, USA, 2006. [Google Scholar]
Figure 1. Test room plan.
Sustainability 12 04933 g001
Figure 2. Windows.
Figure 2. Windows.
Sustainability 12 04933 g002
Figure 3. Summary of research methods and procedure.
Sustainability 12 04933 g003
Figure 4. Temperature variation without heating (selective).
Sustainability 12 04933 g004
Figure 5. Indoor temperature profiles upon heating.
Sustainability 12 04933 g005
Figure 6. Linear regression model of green refurbishment (GR) and baseline (BL) rooms in non-heating conditions.
Sustainability 12 04933 g006
Figure 7. Comparison of the indoor minimum temperature (experimented vs. predicted).
Sustainability 12 04933 g007
Figure 8. Overall and daily TDR charts.
Sustainability 12 04933 g008
Table 1. Constitutive materials of the exterior wall.
CategoryMaterialHeat Conductivity
(W/mK)
Thickness
(mm)
Heat Resistance
(m2K/W)
BL 1Drywall 12T × 20.267240.089
Insulation (EPS)0.036100.278
Reinforced concrete1.5121800.119
Insulation (EPS)0.0361002.778
Air gap-100.15
Lightweight soil block1.385800.058
BL total 4043.497
GS 1Drywall 12T × 20.267240.089
Vacuum insulation0.004307.5
Reinforced concrete1.5121800.119
Insulation (EPS)0.0361002.778
Air gap-10-
Lightweight soil block1.385800.058
GR total 42414.706
1 BL: Baseline; GR: Green Refurbishment.
Table 2. Constitutive materials of the interior wall.
MaterialConductivity (W/mK)Thickness (mm)Resistance (m2K/W)
Drywall 9.5T × 20.267190.071
Glass wool insulation (24K)0.038892.342
Drywall 9.5T × 20.267190.071
Total 1272.654
Table 3. Constitutive materials of the floor.
MaterialConductivity (W/mK)Thickness (mm)Resistance (m2K/W)
Cement mortar1.4001200.086
Reinforced concrete1.5123000.198
Leveling concrete1.861000.054
Total 5200.338
Table 4. Constitutive materials of the ceiling.
MaterialConductivity (W/mK)Thickness (mm)Resistance (m2K/W)
Wood flooring0.128150.117
Cement mortar1.4001200.086
Reinforced concrete1.5122000.132
Total 3350.335
Table 5. Constitutive materials of the ceiling.
CategoryBLGR
Glass22 mm double glass window44 mm Low-E coated triple glass window
Size3370 mm × 1910 mm3370 mm × 1910 mm
FramePVCPVC
Section material thickness5 mm glass6 mm glass
12 mm gas infill14 mm gas infill
5 mm glass5 mm low-E glass
14 mm gas fill
5 mm low-E glass
GasAirArgon
SC0.860.60
SHGC0.750.52
U-value2.61 W/m2K0.91 W/m2K
Table 6. Equipment specification of Minneapolis Blower DoorTM DG-700: Model 3.
CategorySpecifications
Maximum Flow6300 CFM at free air/5340 CFM at 50 Pa/4900 CFM at 75 PA
Minimum Flow300 CFM with Ring B/85 CFM with Ring C/30 CFM with Ring D/11 CFM with E
Flow Accuracy±3% with DG-700/Ring D & E ±4% or 1 CFM
Table 7. Blower test results.
CategoryTest TypeAir Change Rate (1/hr, 50 Pa)Airtightness (1/hr, 50 Pa)
BLCompression26.0325.19
Decompression24.35
Compression18.4418.35
GRDecompression18.25
Table 8. Energy simulation results: heating load.
CategoryTypeHeating Load (kWh)Load Intensity (kWh/m2)Decrease Rate (%)
Scheduled heating loadBL243.727.3542.56
GR139.9815.71
Annual heating loadBL3565.09400.1243.77
GR2004.62224.99
Table 9. Indoor temperature without heating.
IndexOutdoor (°C)BL (°C)GR (°C)
Observation (n)288028802880
Mean (μ)−3.0617.3818.73
Max.2.4033.2727.88
Min.−11.4412.1314.51
SD (σ)3.245.093.13
t-test statistics −12.83
Significance p-value = 1.14E−16 (< 0.01)
Table 10. Indoor temperature with heating.
IndexOutdoor (°C)BL (°C)GR (°C)
Average0.9319.4419.22
Max.12.9235.9730.73
Min.−11.3313.6214.20
SD6.293.782.66
Table 11. Electricity use.
TimeNumber of Operations (Switched on)Electricity Use (kWh)
BLGRdr 1 (%)BLGRdr 1 (%)
10–11151033.33N/AN/AN/A
11–12181138.89N/AN/AN/A
12–13312616.13N/AN/AN/A
13–14282414.29N/AN/AN/A
14–1535282013.495.9855.65
15–16191426.326.071.9368.14
16–1732242510.204.6754.24
17–18181327.784.511.6363.91
18–19241729.176.733.2751.40
Total22016724.0941.0317.4957.36
Avg. / day24.4418.56 8.2063.49
1 dr: Decrease rate.
Table 12. Minimum daily indoor temperature under heating/non-heating conditions.
DayNo Heating (°C)Heating (°C)
OutdoorBLGRΔTOutdoorBLGRΔT
1−3.3811.0313.122.09−5.8113.6214.20.58
2−6.2811.0113.672.661.5217.1117.680.57
3−3.7312.4214.772.355.4717.3217.590.27
4−0.8911.0813.021.944.6217.1817.560.38
5−8.6110.4213.362.94−8.1816.1816.780.6
6−7.8211.0814.052.97−11.3316.1116.490.38
7−3.7610.8613.52.64−10.1416.3916.920.53
8−0.5312.7314.922.19−8.1416.2816.680.4
9−1.2312.114.22.1−4.3916.7517.350.6
10--- −1.616.5917.090.5
Table 13. Daily indoor temperature swing under heating/non-heating conditions.
DayNo Heating (°C)Heating (°C)
OutdoorBLGRΔTOutdoorBLGRΔT
16.456.014.54−1.4712.8322.3516.53−5.82
211.7211.0110.48−0.539.888.425.41−3.01
38.0918.5912.08−6.514.071.711.4−0.31
44.85.864.26−1.68.313.92.31−1.59
512.8317.6310.7−6.9312.772.812.24−0.57
69.4420.2312.48−7.757.9917.3212.78−4.54
78.3310.517.49−3.0210.393.433.05−0.38
86.9116.8710.71−6.1610.6317.6712.49−5.18
9611.767.75−4.019.915.313.64−1.67
10--- 4.112.051.48−0.57
Table 14. Temperature Difference Ratio (TDR) under non-heating conditions.
Day123456789Avg.
BL2.231.482.002.491.482.001.761.922.221.86
GR2.561.702.292.901.712.322.072.242.572.16
Δ0.320.230.290.400.230.310.320.320.350.29

