Applying Distributed Manufacturing to Product-Service System Design: A Set of Near-Future Scenarios and a Design Tool


Abstract
:1. Introduction
2. Methodological Framework
3. Results and Discussion
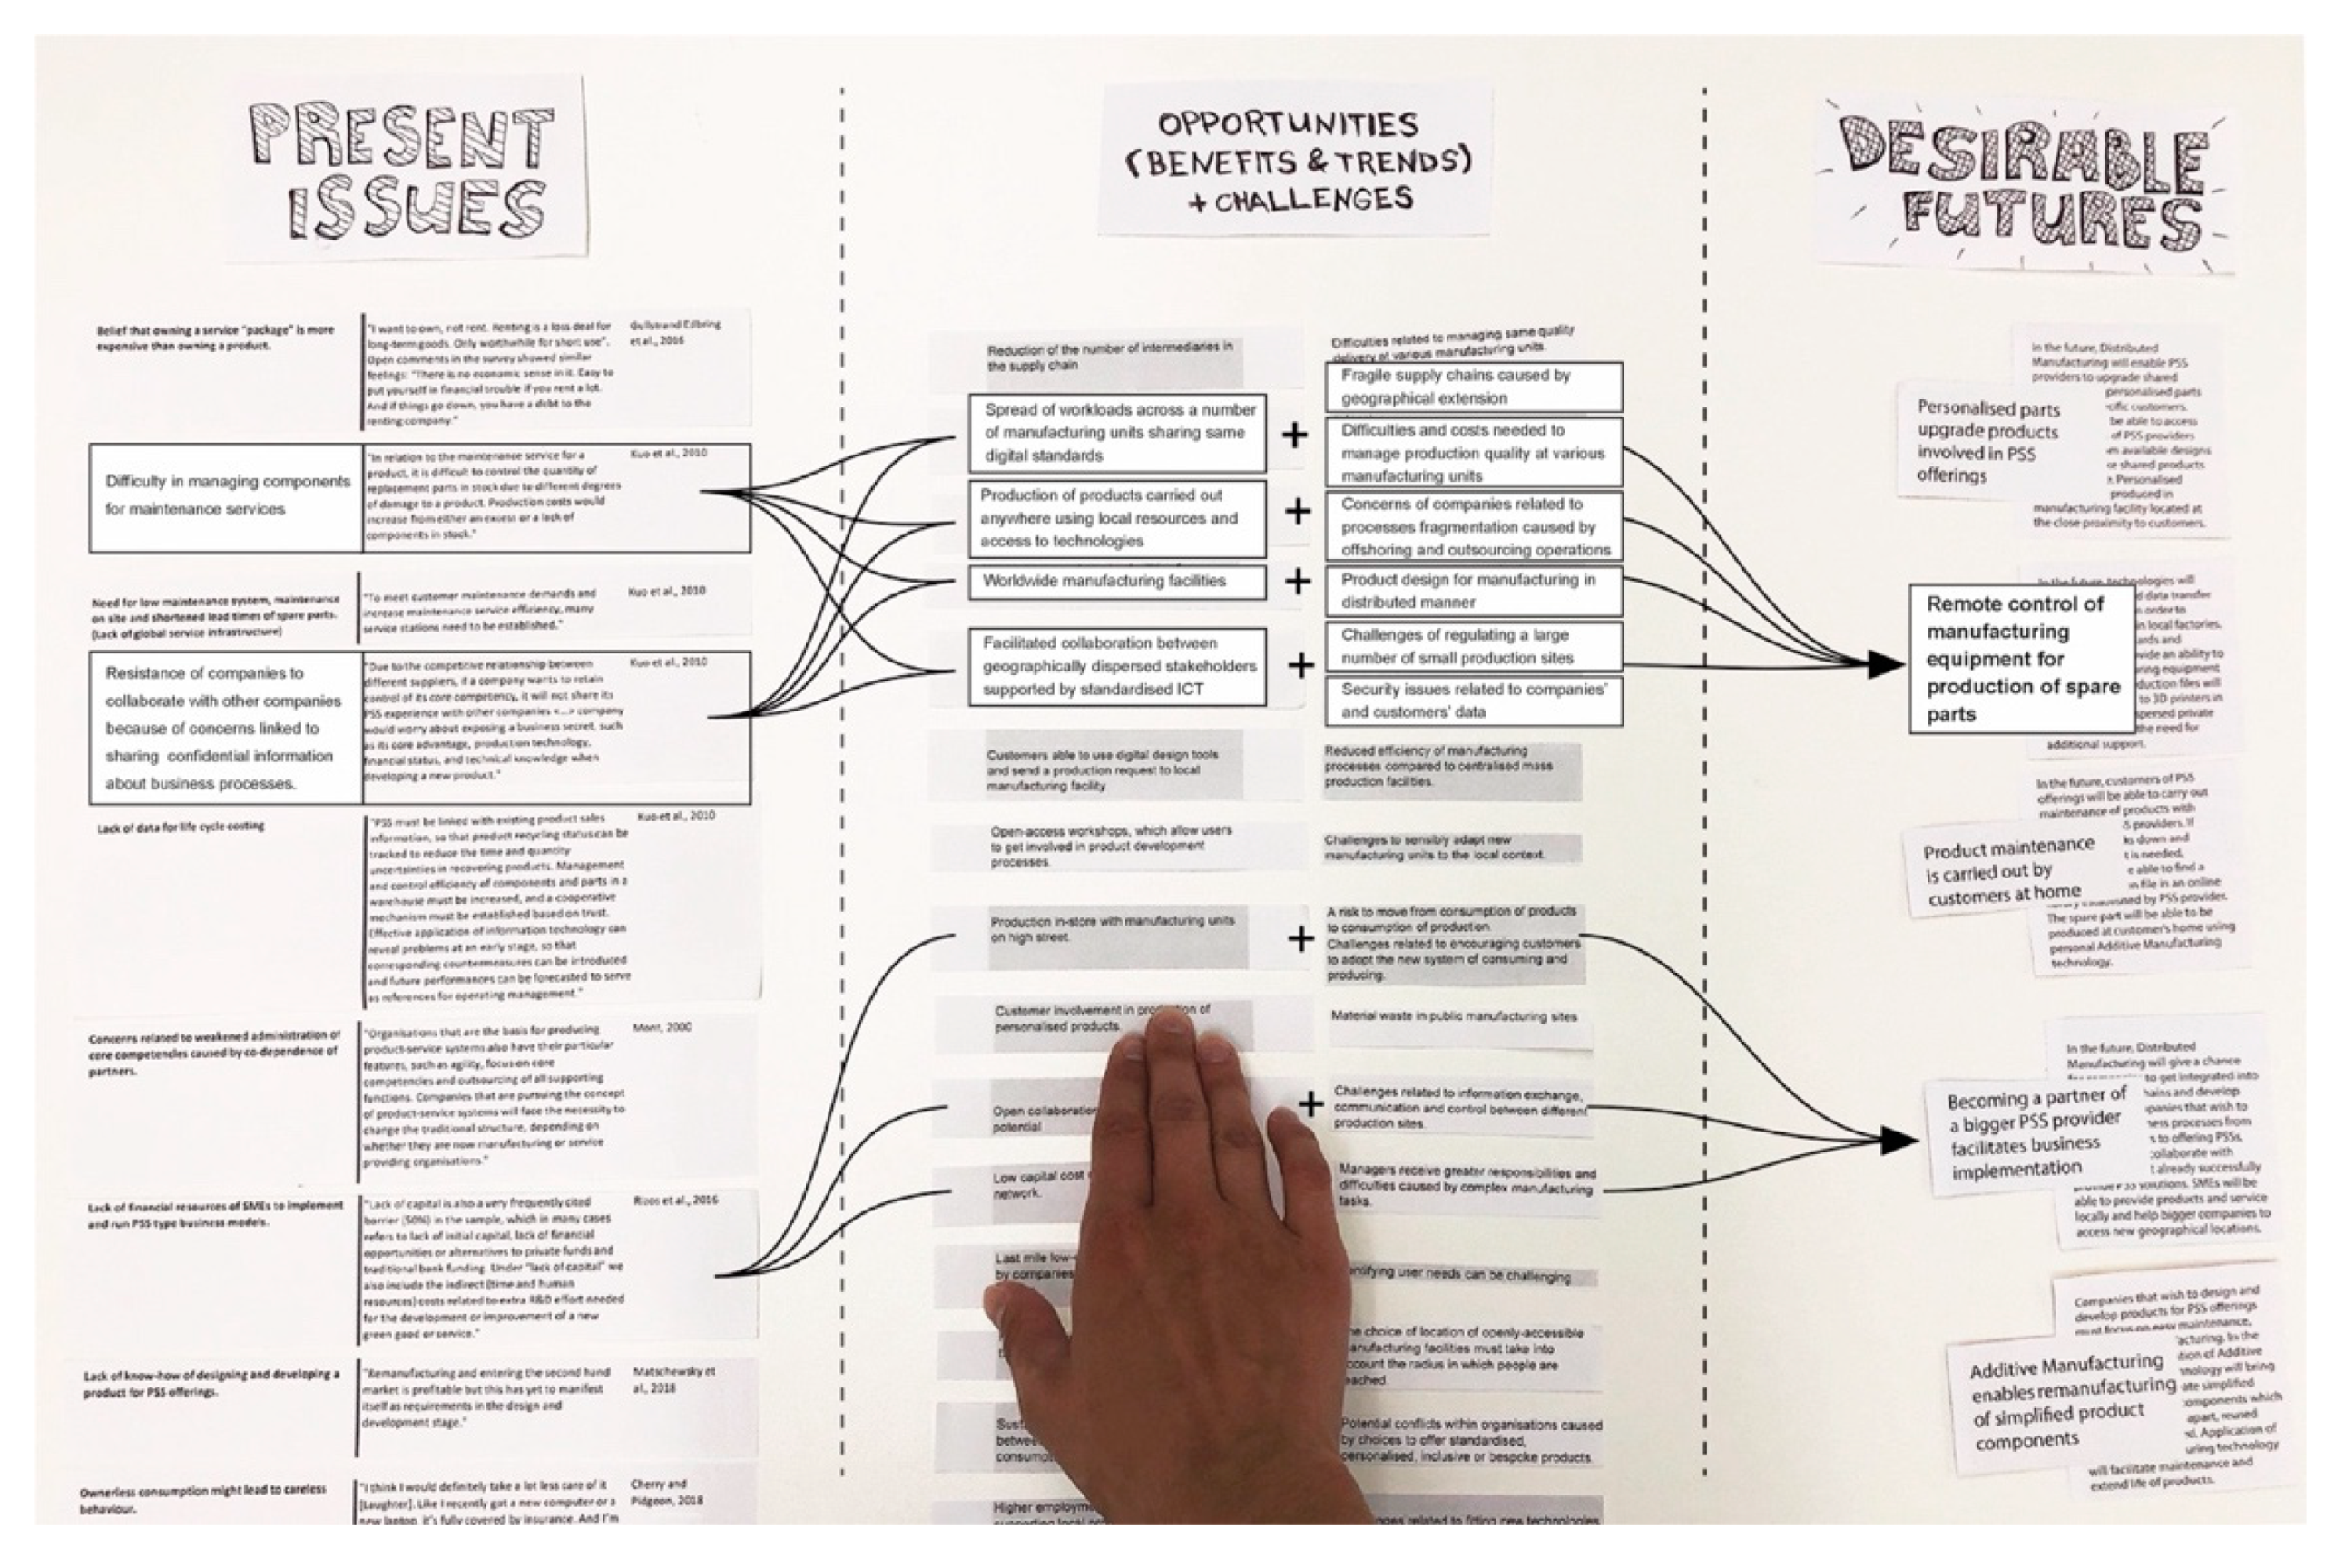
3.1. Research Clarification (RC): Analysis of Existing PSS Implementation Barriers
3.2. Descriptive Study I (DS-I): Collection of Promising DM Opportunities
3.3. Prescriptive Study I (PS-I): Development of PSS+DM Near-Future Scenarios and the PSS+DM Design Tool Version 1.0
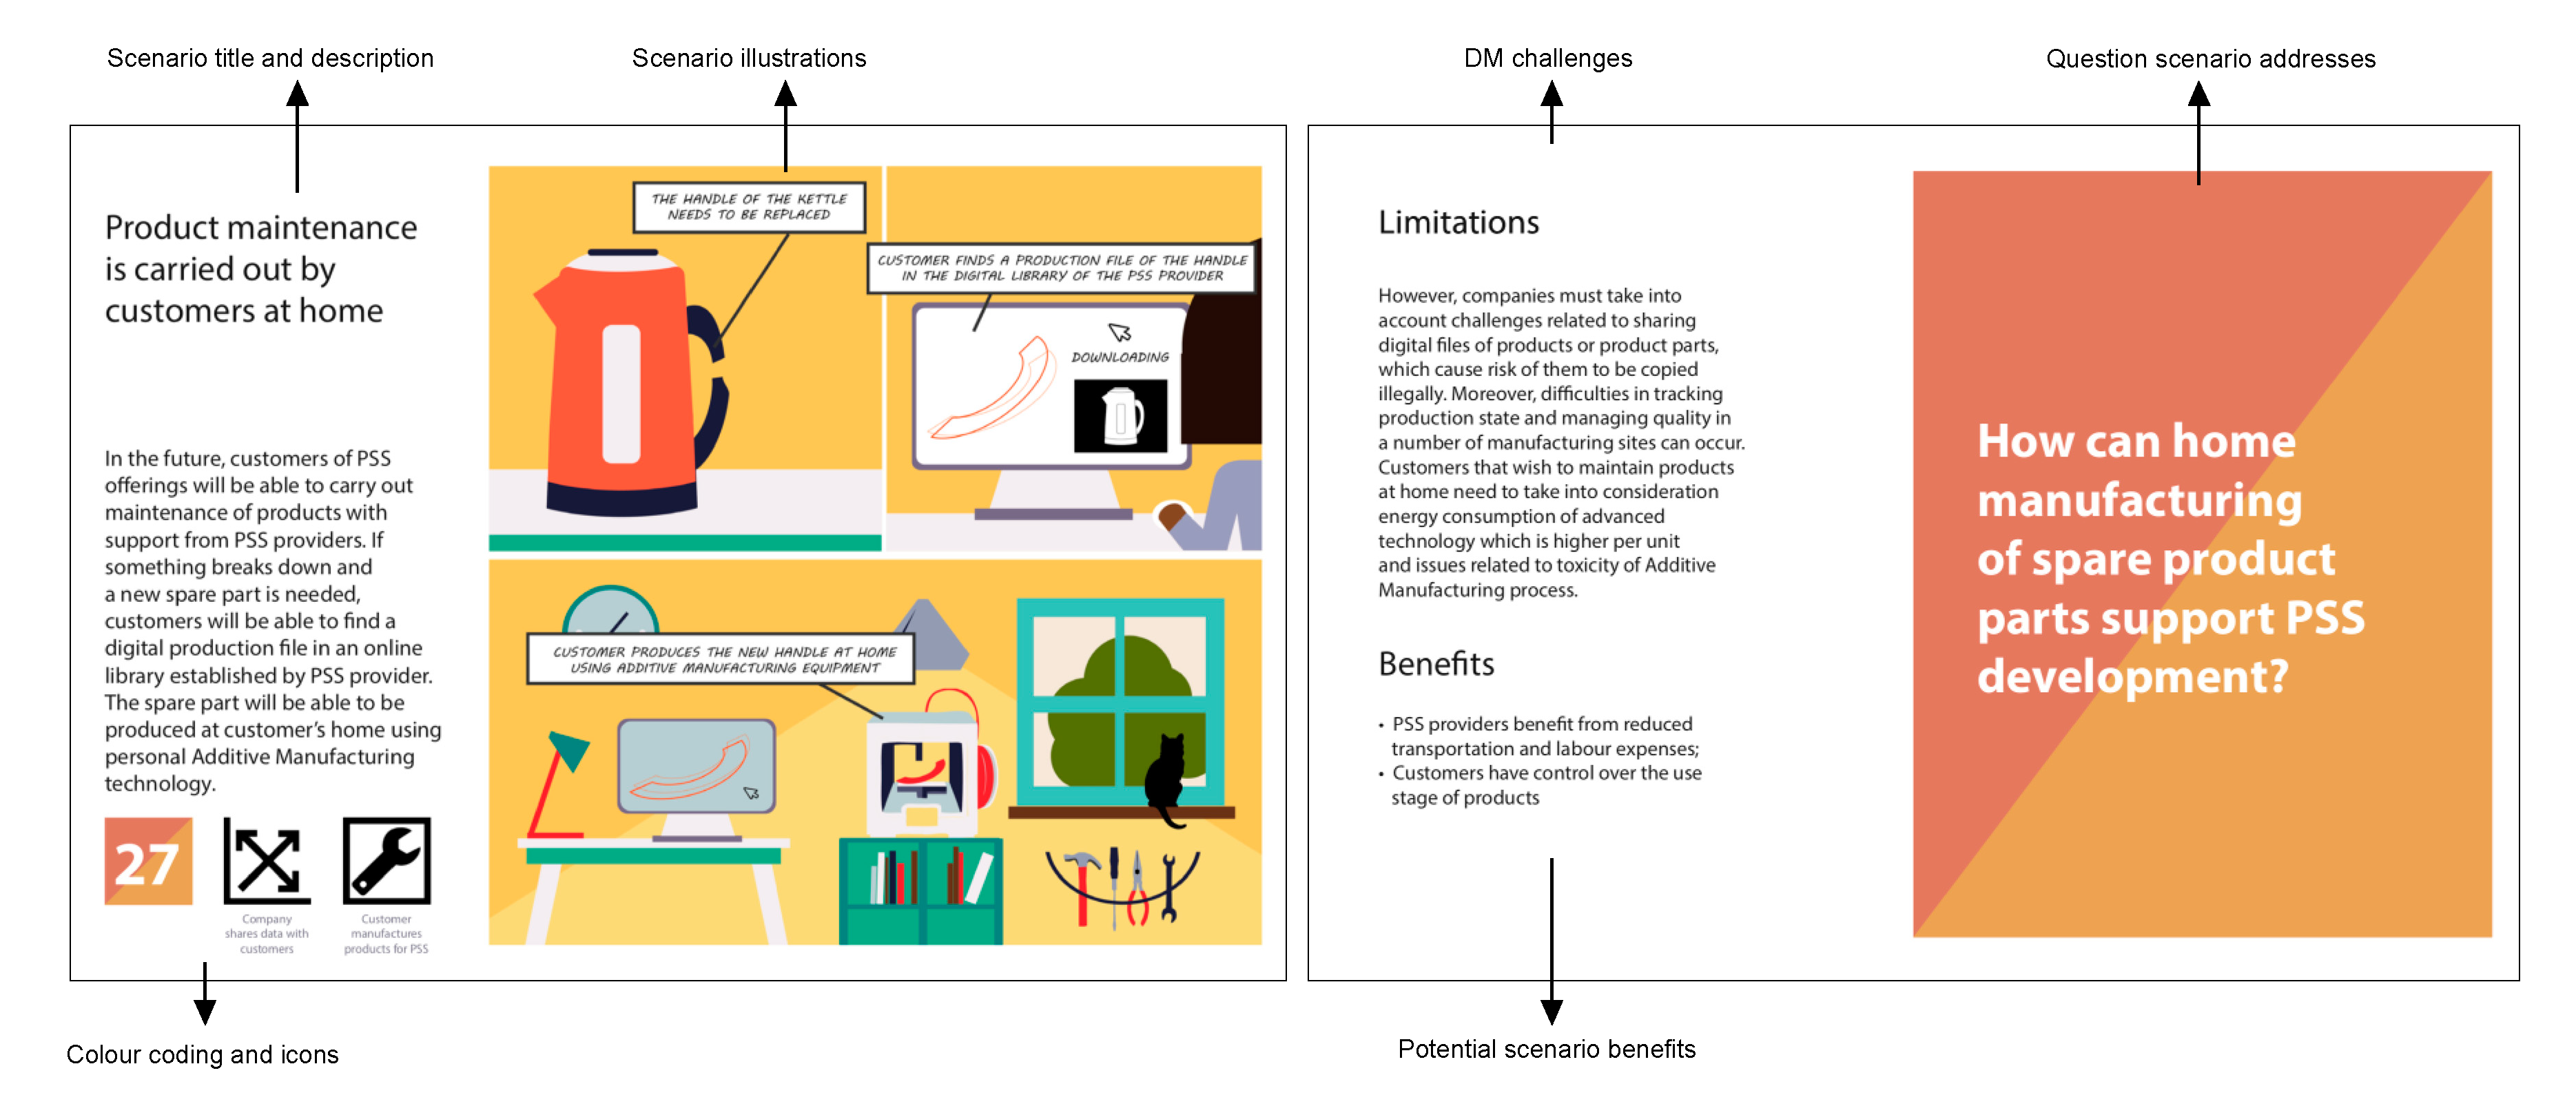
3.3.1. PSS+DM Near-Future Scenarios
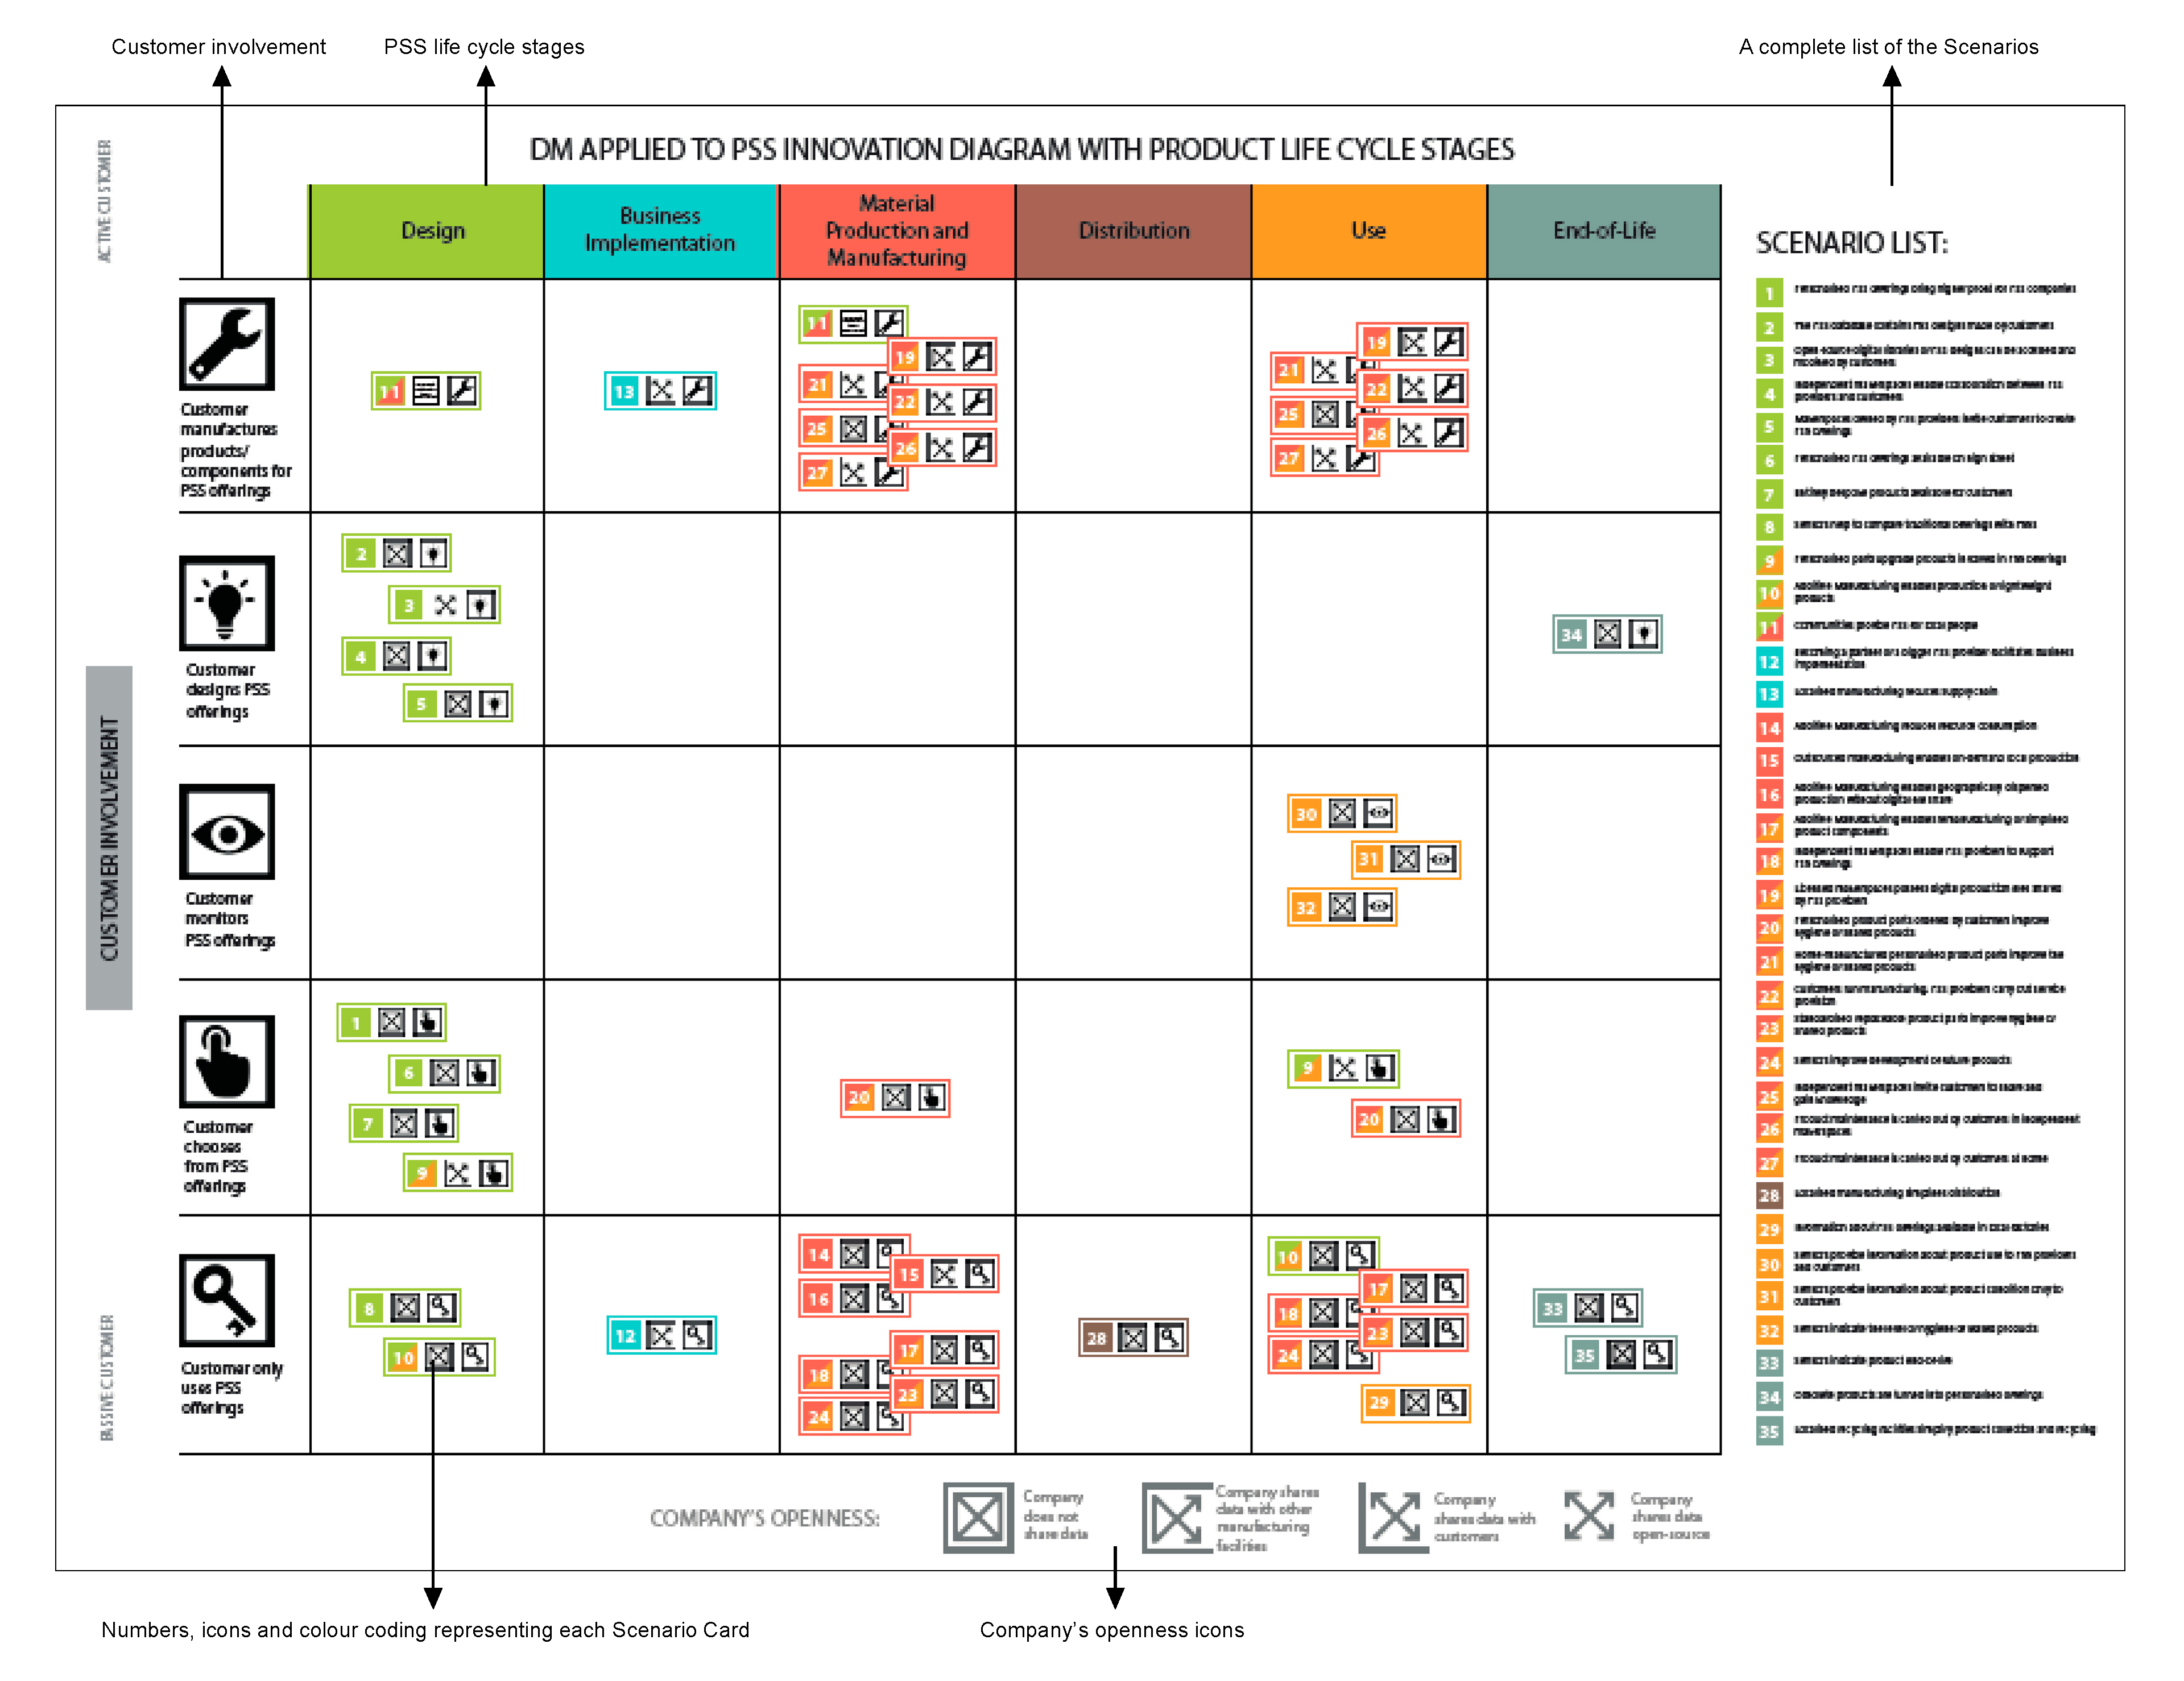
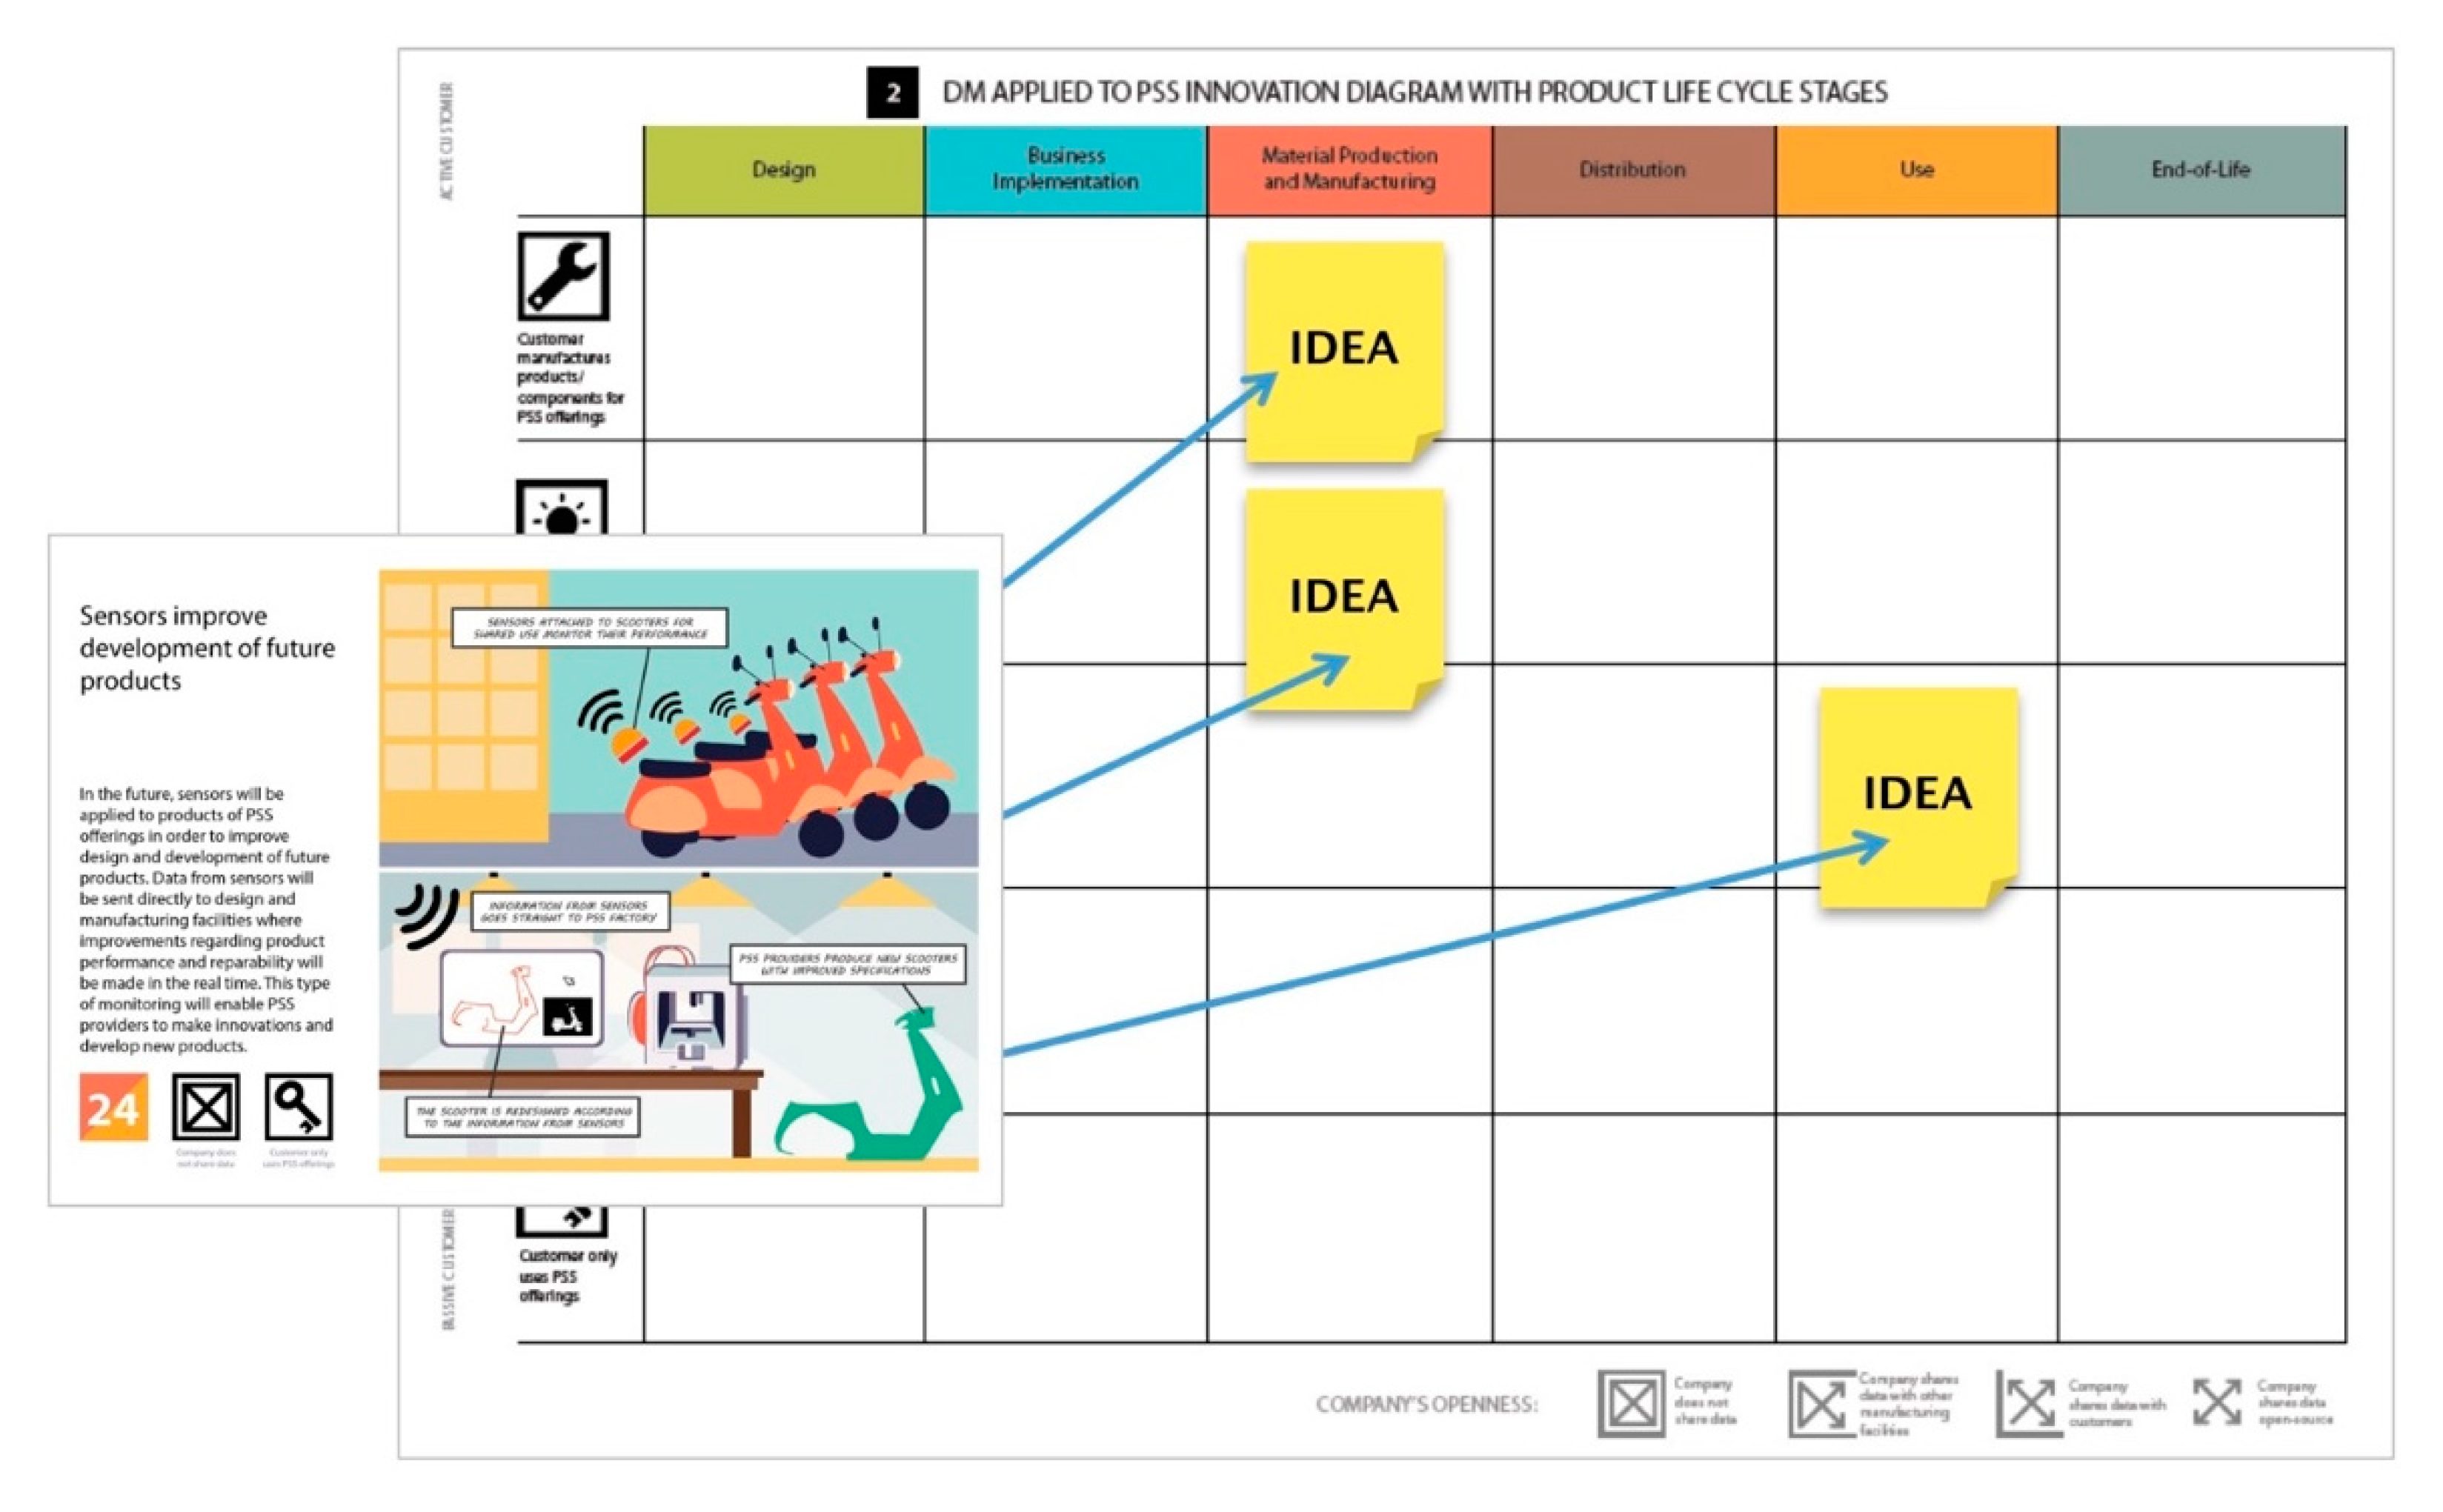
3.3.2. PSS+DM Design Tool Version 1.0
Tool Elements
Use of the Tool
3.4. Descriptive Study II (DS-II): Empirical Testing of the PSS+DM Design Tool Version 1.0
3.4.1. Effectiveness
3.4.2. Usability
3.5. Prescriptive Study II (PS-II): Development of the PSS+DM Design Tool Version 2.0
3.5.1. Insights from the First Empirical Testing
3.5.2. Design of the PSS+DM Design Tool Version 2.0
3.6. Descriptive Study III (DS-III): Empirical Testing of the PSS+DM Design Tool Version 2.0
3.6.1. Testing with Experts from PSS- and/or DM-Related Fields
3.6.2. Testing with Manufacturing Companies and Design Agencies
3.6.3. Completeness
3.6.4. Effectiveness
3.6.5. Usability
3.7. Prescriptive Study III (PS-III): Development of the Final Version of the PSS+DM Design Tool
4. Conclusions and Future Research
Author Contributions
Funding
Acknowledgments
Conflicts of Interest
Appendix A

| Life Cycle Stage | PSS+DM Near-Future Scenario | Addressed PSS Implementation Barriers | Applied DM Opportunities |
|---|---|---|---|
| PSS Design | 2. Comparison between PSS and traditional product-based solutions PSS providers will supply sensors for customers who are not yet sure whether they should choose PSS offerings instead of purchased products. Sensors will be applied to customers’ products to show energy consumption and lifecycle costs. Data collected from sensors will be sent to PSS providers in order to offer best suitable PSS solution as a replacement of owned product. Challenges: - Fitting sensor technologies into existing companies’ processes, including high initial investment, maintenance and upgrade; - Encouraging customers to adopt monitoring technology. | 11. A lack of knowledge and practice in pricing PSS offerings, estimating cash flows and financial savings. 35. A lack of information about owned product lifecycle costs and a belief that service “package” is more expensive. | 6. Improved product monitoring through the application of sensor technology. |
| Material Production and Manufacturing for PSS | 20. Remote control of manufacturing equipment Digital files and data will be transferred around the world in order to produce products in local factories. Same digital standards and machinery will provide an ability to control manufacturing equipment from distance. Challenges: - Communication and information issues can make manufacturing tasks difficult to manage. | 16. Concerns linked to sharing knowledge, expertise, and confidential information about internal procedures. | 1. ICT-facilitated collaboration between geographically dispersed stakeholders. 3. Remote control of manufacturing equipment. |
| Use of PSS | 35. Maintenance of PSS products carried out by customers at home If something breaks down and a new spare part is needed, customers will be able to find a digital production file in an online library established by the PSS provider. The spare part will be able to be produced at the customer’s home using personal AM technologies. Challenges: - Company’s privacy issues related to sharing blueprints of products or product parts; - Energy consumption of advanced technology. | 21. & 39. Concerns of the requirement for PSS provider to access customers’ personal data or even enter into their property. 46. High labour prices, which prevent customers from choosing labour-intensive PSS offerings. | 24. Manufacturing in real time at the point of need. 34. Improved responsiveness, flexibility and efficiency for the manufacturing of spare parts. 55. Facilitated collaboration between producer and customer. |
| PSS End-of-Life | 38. Monitoring of PSS products for their end-of-life Products involved in PSS offerings will be equipped with sensors and will be able to give a feedback to PSS providers. PSS providers will be informed when a product is obsolete or damaged and requires to be collected. Monitoring will enable PSS providers to ensure products are collected at their end-of-life. Challenges: - High initial investment and maintenance costs from PSS companies; - Fitting new technologies into existing production line; - Maintaining operational transition towards sensor implementation. | 24. Challenges of customers not being willing to return the product at the end of contract. | 6. Improved product monitoring through the application of sensor technology. |
| PSS Life Cycle Stage | PSS+DM Near-Future Scenario | Addressed PSS Implementation Barriers (From Table 2) | Applied DM Opportunities (From Table 3) |
|---|---|---|---|
| PSS Design | 1. Facilitated implementation of PSS businesses | 9 | 31, 37 |
| 2. Comparison between PSS and traditional product-based solutions | 11, 35 | 6 | |
| 3. PSS solutions created by customers in PSS makerspaces | 20, 38 | 24, 26, 29 | |
| 4. Collaboration between PSS producers/providers and customers in makerspaces | 20, 34 | 24, 43, 55 | |
| 5. Customisation of existing PSS solutions carried out by customers | 24 | 39, 46 | |
| 6. Personalised PSS solutions designed by customers themselves | 20, 38 | 45, 46, 50 | |
| 7. Entirely bespoke PSS solutions created for each customer | 32 | 40, 45 | |
| 8. PSS solutions available on the high street | 20, 31 | 27 | |
| 9. Reduced material usage enabled by complex geometries of PSS products | 7, 27 | 14 | |
| 10. Reduced number of materials needed to produce PSS products | 7, 27 | 14, 16 | |
| 11. Design of self-(dis)assembling PSS products | 27, 29 | 18, 19 | |
| 12. Design of self-repairing PSS products | 23,42 | 18 | |
| 13. Design of lightweight PSS products | 27 | 14, 16 | |
| 14. Simplified components for remanufacturing of PSS products | 27 | 16 | |
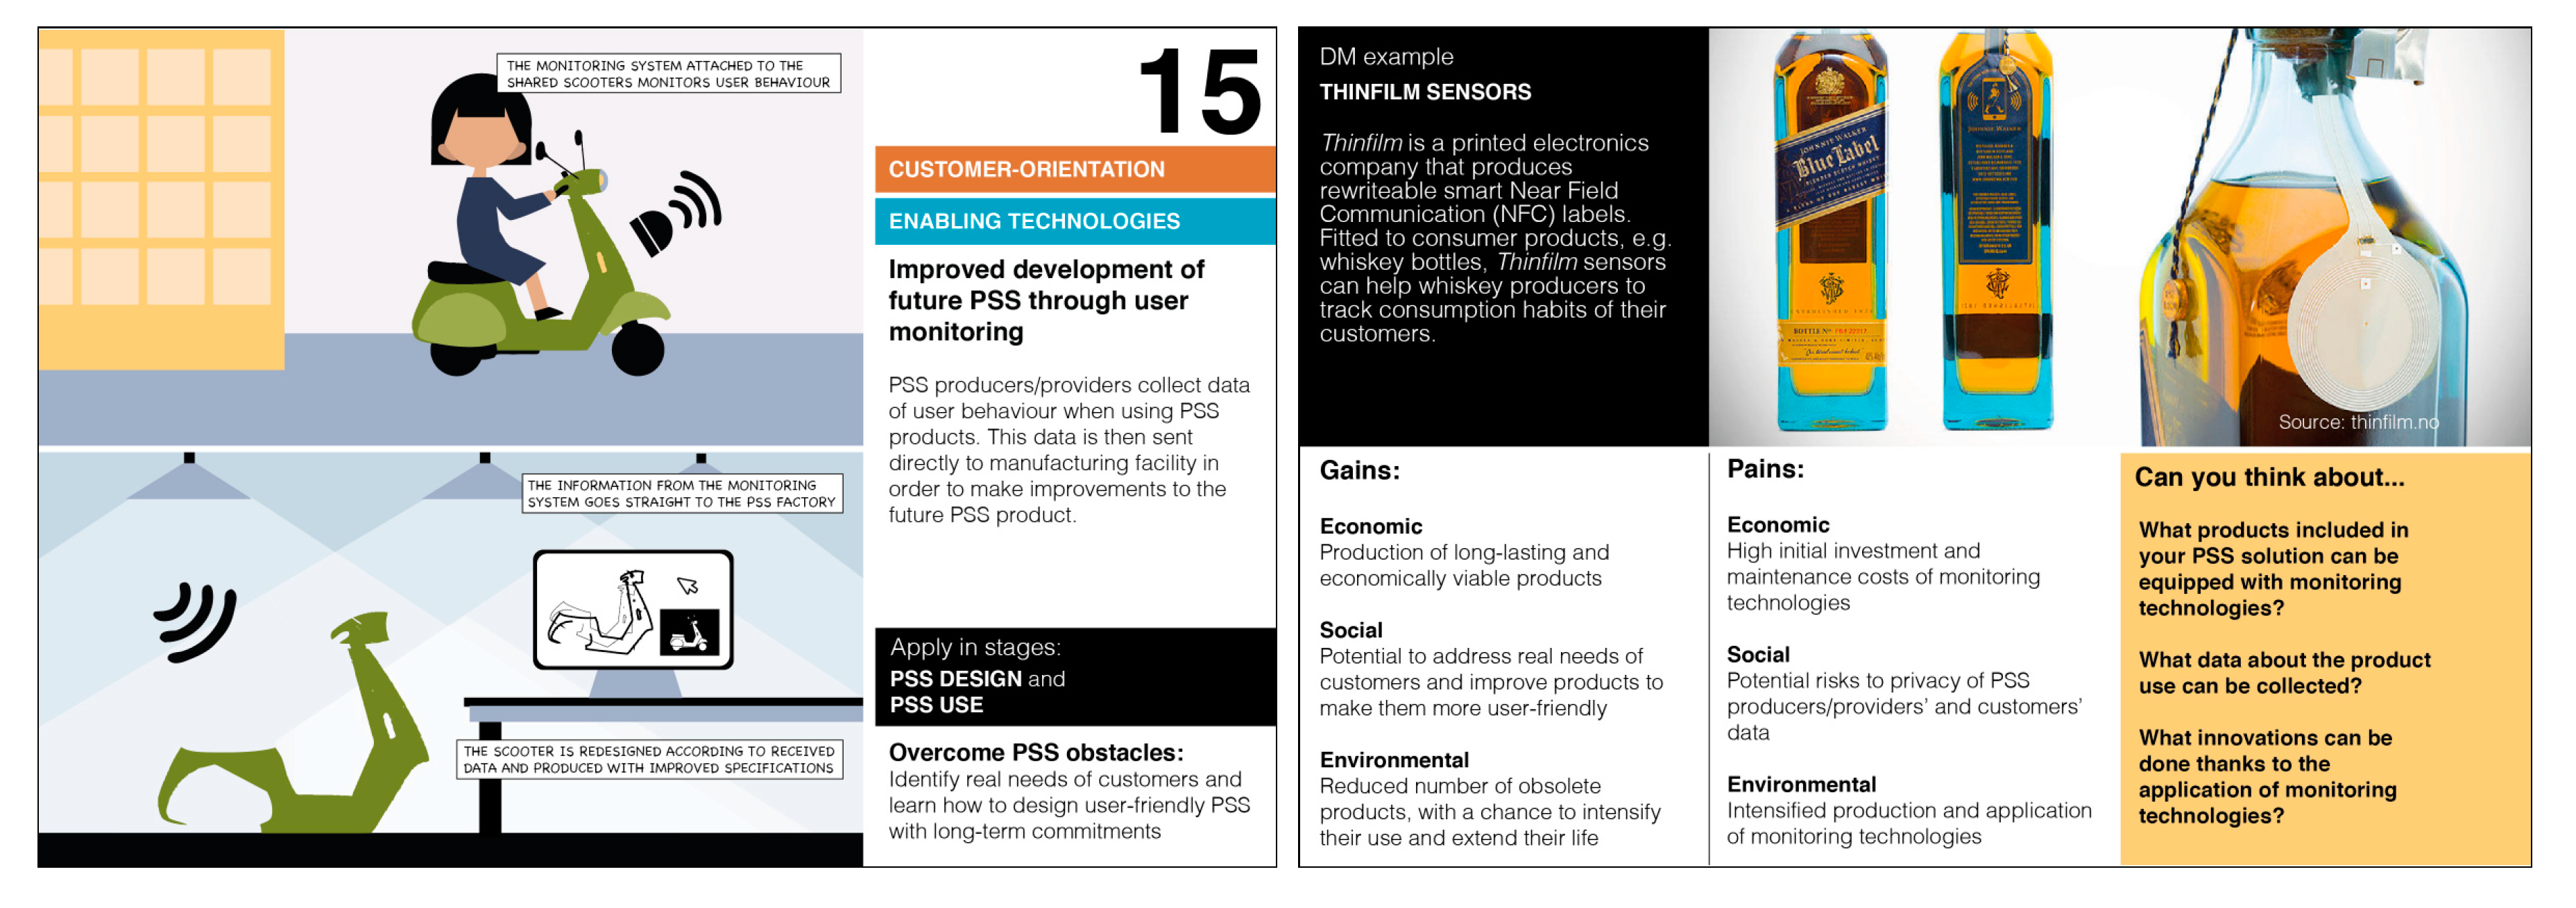
| 15. Improved development of future PSS through the user monitoring | 5, 7 | 6, 7, 11 | |
| 16. Maintenance of PSS products predicted through historical data | 25 | 6, 9 | |
| Material production and Manufacturing for PSS | 8. PSS solutions available on the high street | 20, 31 | 27 |
| 9. Reduced material usage enabled by complex geometries of PSS products | 7, 27 | 14 | |
| 10. Reduced number of materials needed to produce PSS products | 7, 27 | 14, 16 | |
| 11. Design of self-(dis)assembling PSS products | 27, 29 | 18, 19 | |
| 12. Design of self-repairing PSS products | 23,42 | 18 | |
| 13. Design of lightweight PSS products | 27 | 14, 16 | |
| 14. Simplified components for remanufacturing of PSS products | 27 | 16 | |
| 17. Reduced waste production | 27 | 14, 40 | |
| 18. Home manufacturing of personalised parts of PSS products | 36, 39, 42 | 24, 25, 28 | |
| 19. Outsourced manufacturing for localised production of PSS solutions | 9, 10 | 30, 31, 32 | |
| 20. Remote control of manufacturing equipment | 16 | 1, 3 | |
| 21. Manufacturing kit for local production of PSS solutions | 17, 25 | 29, 32 | |
| 22. Blueprints of PSS products available in makerspaces | 42 | 33, 47 | |
| 23. Simplified upgrade of PSS products | 40 | 13, 40 | |
| 24. Production and support of PSS solutions carried out by local artisans | 6, 25 | 36,39 | |
| 25. Reduced number of supply chain actors | 16–19 | 21, 23, 40 | |
| 26. Simplified transportation through local manufacturing | 29, 40 | 21, 22, 23 | |
| 27. Manufacturing ran by customers, service provision carried out by PSS producers/providers | 10 | 24, 45 | |
| 28. Reverse engineering for remanufacturing of components of PSS products | 25 | 13 | |
| Use of PSS | 11. Design of self-(dis)assembling PSS products | 27, 29 | 18, 19 |
| 12. Design of self-repairing PSS products | 23,42 | 18 | |
| 13. Design of lightweight PSS products | 27 | 14, 16 | |
| 14. Simplified components for remanufacturing of PSS products | 27 | 16 | |
| 15. Improved development of future PSS through the user monitoring | 5, 7 | 6, 7, 11 | |
| 16. Maintenance of PSS products predicted through historical data | 25 | 6, 9 | |
| 19. Outsourced manufacturing for localised production of PSS solutions | 9, 10 | 30, 31, 32 | |
| 20. Remote control of manufacturing equipment | 16 | 1, 3 | |
| 21. Manufacturing kit for local production of PSS solutions | 17, 25 | 29, 32 | |
| 22. Blueprints of PSS products available in makerspaces | 42 | 33, 47 | |
| 23. Simplified upgrade of PSS products | 40 | 13, 40 | |
| 24. Production and support of PSS solutions carried out by local artisans | 6, 25 | 36,39 | |
| 25. Reduced number of supply chain actors | 16–19 | 21, 23, 40 | |
| 26. Simplified transportation through local manufacturing | 29, 40 | 21, 22, 23 | |
| 27. Manufacturing ran by customers, service provision carried out by PSS producers/providers | 10 | 24, 45 | |
| 28. Reverse engineering for remanufacturing of components of PSS products | 25 | 13 | |
| 29. Educated customers with knowledge about PSS benefits and maintenance | 34, 36 | 48, 49, 50 | |
| 30. Monitoring of PSS products carried out by customers and PSS producers/providers | 23, 26, 40 | 6, 7 | |
| 31. Monitoring of hygiene of PSS products carried out by customers | 41 | 6 | |
| 32. Identification of manufacturing facility located closest to the customer | 25, 40 | 1, 2, 21 | |
| 33. Upgrade of PSS products with personalised parts | 41 | 13, 40, 44 | |
| 34. Home assemble and maintenance of PSS products using a DIY kit | 25, 29, 39 | 34 | |
| 35. Maintenance of PSS products carried out by customers at home | 21, 39, 46 | 24, 34, 55 | |
| 36. Maintenance of PSS products carried out by PSS producers/providers in makerspaces | 9, 10 | 29, 33 | |
| 37. Production of spare parts of PSS products carried out in a mobile factory | 25, 36, 40, 42 | 23, 24, 25 | |
| 38. Monitoring of PSS products for their end-of-life | 24, 26 | 6 | |
| PSS End-of-Life | 25. Reduced number of supply chain actors | 16–19 | 21, 23, 40 |
| 26. Simplified transportation through local manufacturing | 29, 40 | 21, 22, 23 | |
| 27. Manufacturing ran by customers, service provision carried out by PSS producers/providers | 10 | 24, 45 | |
| 28. Reverse engineering for remanufacturing of components of PSS products | 25 | 13 | |
| 38. Monitoring of PSS products for their end-of-life | 24 | 6 | |
| 39. Simplified collection of PSS products at their end-of-life | 47 | 21, 30, 34 | |
| 40. Transformation of obsolete PSS products into personalised solutions | 24 | 40, 51 |
References
- Tukker, A.; Tischner, U. New Business for Old Europe: Product-Service Development, Competitiveness and Sustainability; Greenleaf: Sheffield, UK, 2006. [Google Scholar]
- Baines, T.S.; Lightfoot, H.W.; Evans, S.; Neely, A.D.; Greenough, R.; Peppard, J.; Roy, R.; Shehab, E.; Braganza, A.; Tiwari, A.; et al. State-of-the-art in product-service systems. Proc. Inst. Mech. Eng. Part B J. Eng. Manuf. 2007, 221, 1543–1552. [Google Scholar] [CrossRef] [Green Version]
- Vasantha, G.V.A.; Roy, R.; Lelah, A.; Brissaud, D. A review of product–service systems design methodologies. J. Eng. Des. 2012, 23, 635–659. [Google Scholar] [CrossRef]
- Cooper, T.; Evans, S. Products to Services. A Report for Friends of the Earth Produced by the Centre for Sustainable Consumption; Sheffield Hallam University: Sheffield, UK, 2000. [Google Scholar]
- Mont, O. Clarifying the concept of product–service system. J. Clean. Prod. 2002, 10, 237–245. [Google Scholar] [CrossRef]
- Besch, K. Product-service systems for office furniture: Barriers and opportunities on the European market. J. Clean. Prod. 2005, 13, 1083–1094. [Google Scholar] [CrossRef] [Green Version]
- Sousa-Zomer, T.T.; Magalhães, L.; Zancul, E.; Cauchick-Miguel, P.A. Exploring the challenges for circular business implementation in manufacturing companies: An empirical investigation of a pay-per-use service provider. Resour. Conserv. Recycl. 2018, 135, 3–13. [Google Scholar] [CrossRef]
- Ceschin, F. Critical factors for implementing and diffusing sustainable product-Service systems: Insights from innovation studies and companies’ experiences. J. Clean. Prod. 2013, 45, 74–88. [Google Scholar] [CrossRef] [Green Version]
- Ceschin, F. Sustainable Product-Service Systems; Springer Science and Business Media LLC: Berlin/Heidelberg, Germany, 2014. [Google Scholar]
- Vezzoli, C.; Ceschin, F.; Diehl, J.C.; Kohtala, C. New design challenges to widely implement ‘Sustainable Product–Service Systems’. J. Clean. Prod. 2015, 97, 1–12. [Google Scholar] [CrossRef] [Green Version]
- Kohtala, C. Addressing sustainability in research on distributed production: An integrated literature review. J. Clean. Prod. 2015, 106, 654–668. [Google Scholar] [CrossRef] [Green Version]
- Srai, J.S.; Kumar, M.; Graham, G.; Phillips, W.; Tooze, J.; Ford, S.; Beecher, P.; Raj, B.; Gregory, M.; Tiwari, M.K.; et al. Distributed manufacturing: Scope, challenges and opportunities. Int. J. Prod. Res. 2016, 54, 1–19. [Google Scholar] [CrossRef]
- Petrulaityte, A.; Ceschin, F.; Eujin, P.; Harrison, D. Supporting Sustainable Product-Service System Implementation through Distributed Manufacturing. Procedia CIRP 2017, 64, 375–380. [Google Scholar] [CrossRef]
- Suominen, J.; Piller, F.; Ruohonen, M.; Tseng, M.; Jacobson, S. Mass Matching—Customization, Configuration & Creativity. In Proceedings of the 5th International Conference on Mass Customization & Personalization MCPC 2009, Aalto University School of Art and Design Publication Series B 102, Helsinki, Finland, 4–8 October 2009. [Google Scholar]
- Reim, W.; Sjödin, D.R.; Parida, V. Adoption of Product-service System (PSS) Business Model Innovations in Global Distributer Networks. In Proceedings of the 24th International Product Development Management Conference IPDMC, Reykjavik, Iceland, 11–13 June 2017. [Google Scholar]
- Miller, P.; O’Leary, T. Rethinking the Factory: Caterpillar Inc. Cult. Values 2002, 6, 91–117. [Google Scholar] [CrossRef]
- Despeisse, M.; Ford, S. The Role of Additive Manufacturing in Improving Resource Efficiency and Sustainability. Advances in Production Management Systems: Innovative Production Management towards Sustainable Growth. In Proceedings of the International Conference, APMS 2015, Tokyo, Japan, 7–9 September 2015. [Google Scholar]
- Moreno, M.; Charnley, F. Can Re-distributed Manufacturing and Digital Intelligence Enable a Regenerative Economy? An Integrative Literature Review. Hum. Centred Intell. Sys. 2016, 52, 563–575. [Google Scholar] [CrossRef] [Green Version]
- Ford, S.; Despeisse, M. Additive manufacturing and sustainability: An exploratory study of the advantages and challenges. J. Clean. Prod. 2016, 137, 1573–1587. [Google Scholar] [CrossRef]
- Moreno, M.; Turner, C.; Tiwari, A.; Hutabarat, W.; Charnley, F.; Widjaja, D.; Mondini, L. Re-distributed Manufacturing to Achieve a Circular Economy: A Case Study Utilizing IDEF0 Modeling. Procedia CIRP 2017, 63, 686–691. [Google Scholar] [CrossRef]
- Charro, A.; Schaefer, D. Cloud Manufacturing as a new type of Product-Service System. Int. J. Comput. Integr. Manuf. 2018, 31, 1018–1033. [Google Scholar] [CrossRef]
- Sinclair, M.; Sheldrick, L.; Moreno, M.; Dewberry, E. Consumer Intervention Mapping—A Tool for Designing Future Product Strategies within Circular Product Service Systems. Sustainability 2018, 10, 2088. [Google Scholar] [CrossRef] [Green Version]
- Ingemarsdotter, E.; Jamsin, E.; Kortuem, G.; Balkenende, R. Circular Strategies Enabled by the Internet of Things—A Framework and Analysis of Current Practice. Sustainability 2019, 11, 5689. [Google Scholar] [CrossRef] [Green Version]
- Haddad, Y.; Salonitis, K.; Emmanouilidis, C. Redistributed manufacturing of spare parts: An agent-based modelling approach. Procedia CIRP 2019, 81, 707–712. [Google Scholar] [CrossRef]
- Ford, S.; Minshall, T. Defining the Research Agenda for 3D Printing-Enabled Re-distributed Manufacturing. In Proceedings of the Security Education and Critical Infrastructures; Springer Science and Business Media LLC: Berlin/Heidelberg, Germany, 2015; pp. 156–164. [Google Scholar]
- Blessing, L.T.; Chakrabarti, A. DRM, a Design Research Methodology; Springer Science and Business Media LLC: Berlin/Heidelberg, Germany, 2009. [Google Scholar]
- Meredith, J. Theory Building through Conceptual Methods. Int. J. Oper. Prod. Manag. 1993, 13, 3–11. [Google Scholar] [CrossRef]
- Goodier, C.; Soetanto, R. Building future scenarios using cognitive mapping. J. Maps 2013, 9, 203–217. [Google Scholar] [CrossRef] [Green Version]
- Creswell, J.W. Qualitative Inquiry & Research Design: Choosing among Five Approaches, 3rd ed.; Sage: Thousand Oaks, CA, USA, 2013. [Google Scholar]
- Creswell, J.W. Research Design; Sage Publications: London, UK, 2009. [Google Scholar]
- Tukker, A. Eight types of product–service system: Eight ways to sustainability? Experiences from SusProNet. Bus. Strat. Environ. 2004, 13, 246–260. [Google Scholar] [CrossRef]
- United Nations Environmental Programme (UNEP). Product-Service Systems and Sustainability. Opportunities for Sustainable Solutions; Division of Technology Industry and Economics, Production and Consumption Branch; UNEP: Paris, France, 2002. [Google Scholar]
- Mont, O.; Lindhqvist, T. The role of public policy in advancement of product service systems. J. Clean. Prod. 2003, 11, 905–914. [Google Scholar] [CrossRef]
- Ceschin, F. The Introduction and Scaling up of Sustainable Product-service Systems: A New Role for Strategic Design for Sustainability. Ph.D. Thesis, Politecnico di Milano, Milan, Italy, 2012. [Google Scholar]
- Bartolomeo, M.; Maso, D.D.; De Jong, P.; Eder, P.; Groenewegen, P.; Hopkinson, P.G.; James, P.; Nijhuis, L.; Örninge, M.; Scholl, G.; et al. Eco-efficient producer services—What are they, how do they benefit customers and the environment and how likely are they to develop and be extensively utilised? J. Clean. Prod. 2003, 11, 829–837. [Google Scholar] [CrossRef]
- Martínez, V.; Bastl, M.; Kingston, J.; Evans, S. Challenges in transforming manufacturing organisations into product-service providers. J. Manuf. Technol. Manag. 2010, 21, 449–469. [Google Scholar] [CrossRef] [Green Version]
- Coreynen, W.; Matthyssens, P.; De Rijck, R.; Dewit, I. Internal levers for servitization: How product-oriented manufacturers can upscale product-service systems. Int. J. Prod. Res. 2017, 56, 2184–2198. [Google Scholar] [CrossRef]
- Mont, O. Drivers and barriers for shifting towards more service-oriented businesses: Analysis of the PSS field and contributions from Sweden. J. Sustain. Prod. Des. 2002, 2, 89–103. [Google Scholar] [CrossRef]
- Matschewsky, J.; Kambanou, M.L.; Sakao, T. Designing and providing integrated product-service systems—Challenges, opportunities and solutions resulting from prescriptive approaches in two industrial companies. Int. J. Prod. Res. 2017, 56, 2150–2168. [Google Scholar] [CrossRef] [Green Version]
- Barquet, A.P.B.; Oliveira, M.G.; Amigo, C.R.; Cunha, V.P.; Rozenfeld, H. Employing the business model concept to support the adoption of product-service systems (PPS). Ind. Mark. Manag. 2013, 42, 693–704. [Google Scholar] [CrossRef]
- Mont, O. Product-Service Systems: Panacea or Myth? Ph.D. Thesis, Lund University, Lund, Sweden, 2004. [Google Scholar]
- Catulli, M. What uncertainty? Further insight into why consumers might be distrustful of product service systems. J. Manuf. Tech. Manag. 2012, 23, 780–793. [Google Scholar] [CrossRef] [Green Version]
- Rexfelt, O.; Ornäs, V.H.A. Consumer acceptance of product-service systems. J. Manuf. Technol. Manag. 2009, 20, 674–699. [Google Scholar] [CrossRef]
- Manzini, E.; Vezzoli, C.; Clark, G. Product-Service Systems. Using an Existing Concept as a New Approach to Sustainability. J. Des. Res. 2001, 1. [Google Scholar] [CrossRef]
- Edbring, E.G.; Lehner, M.; Mont, O. Exploring consumer attitudes to alternative models of consumption: Motivations and barriers. J. Clean. Prod. 2016, 123, 5–15. [Google Scholar] [CrossRef]
- Ottosson, H. Personal Communication with Director of EnerSearch at Sydkraft; Mont, M.O., Ed.; Springer: New York, NY, USA, 2000. [Google Scholar]
- Hannon, M.; Foxon, T.J.; Gale, W.F. ‘Demand pull’ government policies to support Product-Service System activity: The case of Energy Service Companies (ESCos) in the UK. J. Clean. Prod. 2015, 108, 900–915. [Google Scholar] [CrossRef] [Green Version]
- Mont, O. Institutionalisation of sustainable consumption patterns based on shared use. Ecol. Econ. 2004, 50, 135–153. [Google Scholar] [CrossRef]
- Armstrong, C.M.; Niinimäki, K.; Kujala, S.; Karell, E.; Lang, C. Sustainable product-service systems for clothing: Exploring consumer perceptions of consumption alternatives in Finland. J. Clean. Prod. 2015, 97, 30–39. [Google Scholar] [CrossRef]
- Hobson, K.; Lynch, N.; Lilley, D.; Smalley, G.J. Systems of practice and the Circular Economy: Transforming mobile phone product service systems. Environ. Innov. Soc. Transit. 2018, 26, 147–157. [Google Scholar] [CrossRef] [Green Version]
- Rizos, V.; Behrens, A.; Van der Gaast, W.; Hofman, E.; Ioannou, A.; Kafyeke, T.; Flamos, A.; Rinaldi, R.; Papadelis, S.; Hirschnitz-Garbers, M.; et al. Implementation of Circular Economy Business Models by Small and Medium-Sized Enterprises (SMEs): Barriers and Enablers. Sustainability 2016, 8, 1212. [Google Scholar] [CrossRef] [Green Version]
- Kuo, T.-C.; Ma, H.-Y.; Huang, S.H.; Hu, A.H.; Huang, C.S. Barrier analysis for product service system using interpretive structural model. Int. J. Adv. Manuf. Technol. 2009, 49, 407–417. [Google Scholar] [CrossRef]
- Wallin, J.; Parida, V.; Isaksson, O. Understanding product-service system innovation capabilities development for manufacturing companies. J. Manuf. Technol. Manag. 2015, 26, 763–787. [Google Scholar] [CrossRef]
- Linder, M.; Williander, M. Circular Business Model Innovation: Inherent Uncertainties. Bus. Strat. Environ. 2015, 26, 182–196. [Google Scholar] [CrossRef]
- Mont, O. Product–Service Systems; International Institute of Industrial Environmental Economics, Lund University: Lund, Sweden, 2000. [Google Scholar]
- Wong, M. Implementation of Innovative Product Service-Systems in the Consumer Goods Industry. Ph.D. Thesis, Cambridge University, Cambridge, UK, 2004. [Google Scholar]
- Mont, O. Introducing and Developing a Product-Service System (PSS) Concept in Sweden; IIIEE Reports 2001:6. Lund: IIIEE; Lund University and NUTEK: Lund, Sweden, 2001. [Google Scholar]
- Cherry, C.; Pidgeon, N. Why Is Ownership an Issue? Exploring Factors That Determine Public Acceptance of Product-Service Systems. Sustainability 2018, 10, 2289. [Google Scholar] [CrossRef] [Green Version]
- Oliva, R.; Kallenberg, R. Managing the transition from products to services. Int. J. Serv. Ind. Manag. 2003, 14, 160–172. [Google Scholar] [CrossRef] [Green Version]
- Mont, O.; Dalhammar, C.; Jacobsson, N. A new business model for baby prams based on leasing and product remanufacturing. J. Clean. Prod. 2006, 14, 1509–1518. [Google Scholar] [CrossRef]
- Catulli, M.; Cook, M.; Potter, S. Mapping transitions towards sustainable consumption: Latitudes, legends and declinations in the interaction between consumers culture and sustainable business models. Paper presented at Consumer Culture Theory Conference—CCT 2014, Helsinki, Finland, 26–29 June 2014. [Google Scholar]
- Sakao, T.; Rönnbäck, A.O.; Sandström, G.O. Uncovering benefits and risks of integrated product service offerings—Using a case of technology encapsulation. J. Sys. Sci. Sys. Eng. 2013, 22, 421–439. [Google Scholar] [CrossRef] [Green Version]
- Bardhi, F.; Eckhardt, G.M. Access-Based Consumption: The Case of Car Sharing: Table 1. J. Consum. Res. 2012, 39, 881–898. [Google Scholar] [CrossRef]
- Enckell, C.; Isgran, M. Barriers towards a successful adoption of PSS: A Provider and Customer Perspective. Master’s Thesis, Lulea University of Technology, Lulea, Sweden, 2017. [Google Scholar]
- Bessière, D.; Charnley, F.; Tiwari, A.; Moreno, M. A vision of re-distributed manufacturing for the UK’s consumer goods industry. Prod. Plan. Control. 2019, 30, 555–567. [Google Scholar] [CrossRef]
- Kumar, M.; Tsolakis, N.; Agarwal, A.; Srai, J.S. Developing distributed manufacturing strategies from the perspective of a product-process matrix. Int. J. Prod. Econ. 2020, 219, 1–17. [Google Scholar] [CrossRef]
- Rauch, E.; Dallinger, M.; Dallasega, P.; Matt, D.T. Sustainability in Manufacturing through Distributed Manufacturing Systems (DMS). Procedia CIRP 2015, 29, 544–549. [Google Scholar] [CrossRef]
- Pearson, H.; Noble, G.; Hawkins, J. Re-Distributed Manufacturing Workshop Report; EPSRC: Swindon, UK, 2013. [Google Scholar]
- Matt, D.T.; Rauch, E.; Dallasega, P. Trends towards Distributed Manufacturing Systems and Modern Forms for their Design. Procedia CIRP 2015, 33, 185–190. [Google Scholar] [CrossRef]
- Kühnle, H. Distributed Manufacturing (DM)—Smart Units and Collaborative Processes. Int. J. Soc. Behav. Educ. Econ. Bus. Ind. Eng. 2015, 9. [Google Scholar]
- Basmer, S.; Buxbaum-Conradi, S.; Krenz, P.; Redlich, T.; Wulfsberg, J.; Bruhns, F.-L. Open Production: Chances for Social Sustainability in Manufacturing. Procedia CIRP 2015, 26, 46–51. [Google Scholar] [CrossRef] [Green Version]
- Christian Lerch Competence Center for Sustainability and Infrastructure Systems at the Fraunhofer Institute for Systems and Innovation Research ISI Karlsruhe Germany Digitalized Product-Service Systems in Manufacturing Firms: A Case Study Analysis. Res. Manag. 2015, 58, 45–52. [CrossRef]
- Mitchell, A.; Lafont, U.; Hołyńska, M.; Semprimoschnig, C. Additive manufacturing—A review of 4D printing and future applications. Addit. Manuf. 2018, 24, 606–626. [Google Scholar] [CrossRef]
- Eujin, P.; Loh, G.H.; Harrison, D.L.; Almeida, H.; Verona, M.D.M.; Paz, R. A study of 4D printing and functionally graded additive manufacturing. Assem. Autom. 2017, 37, 147–153. [Google Scholar] [CrossRef]
- Durão, L.F.C.S.; Christ, A.; Zancul, E.; Anderl, R.; Schützer, K. Additive manufacturing scenarios for distributed production of spare parts. Int. J. Adv. Manuf. Technol. 2017, 93, 869–880. [Google Scholar] [CrossRef]
- Eujin, P.; Ressin, M.; Campbell, I.; Eynard, B.; Xiao, J. Investigating the impact of additive manufacturing data exchange standards for re-distributed manufacturing. Prog. Addit. Manuf. 2019, 4, 331–344. [Google Scholar] [CrossRef] [Green Version]
- Liu, H.; Purvis, L.; Mason, R.; Wells, P. Developing logistics value propositions: Drawing Insights from a distributed manufacturing solution. Ind. Mark. Manag. 2020. [Google Scholar] [CrossRef]
- Foresight. The Future of Manufacturing: A New Era of Opportunity and Challenge for the UK; Project Report The Government Office for Science: London, UK, 2013. [Google Scholar]
- Ellwein, C.; Schmidt, A.; Lechler, A.; Riedel, O. Distributed Manufacturing; Association for Computing Machinery (ACM): New York, NY, USA, 2019; pp. 90–95. [Google Scholar]
- Bonvoisin, J.; Galla, J.K.; Prendeville, S. Design Principles for Do-It-Yourself Production. In Human Centred Intelligent Systems; Springer Science and Business Media LLC: Berlin/Heidelberg, Germany, 2017; pp. 77–86. [Google Scholar]
- Ardolino, M.; Rapaccini, M.; Saccani, N.; Gaiardelli, P.; Crespi, G.; Ruggeri, C. The role of digital technologies for the service transformation of industrial companies. Int. J. Prod. Res. 2017, 56, 2116–2132. [Google Scholar] [CrossRef]
- Freitas, D.; Almeida, H.; Bartolo, H.; Bártolo, P.J. Sustainability in extrusion-based additive manufacturing technologies. Prog. Addit. Manuf. 2016, 1, 65–78. [Google Scholar] [CrossRef] [Green Version]
- Gyires, T.; Muthuswamy, B. A planning algorithm for distributed manufacturing. In Proceedings International Conference on Intelligent and Cooperative Information Systems; Institute of Electrical and Electronics Engineers (IEEE): Piscataway, NJ, USA, 2002; pp. 237–246. [Google Scholar]
- Bogers, M.; Hadar, R.; Bilberg, A. Additive manufacturing for consumer-centric business models: Implications for supply chains in consumer goods manufacturing. Technol. Forecast. Soc. Chang. 2016, 102, 225–239. [Google Scholar] [CrossRef]
- Nagarajan, H.P.N.; Raman, A.S.; Haapala, K.R. A Sustainability Assessment Framework for Dynamic Cloud-based Distributed Manufacturing. Procedia CIRP 2018, 69, 136–141. [Google Scholar] [CrossRef]
- Angeles-Martinez, L.; Theodoropoulos, C.; Lopez-Quiroga, E.; Fryer, P.; Bakalis, S. The Honeycomb model: A platform for systematic analysis of different manufacturing scenarios for fast-moving consumer goods. J. Clean. Prod. 2018, 193, 315–326. [Google Scholar] [CrossRef]
- Lelah, A.; Boucher, X.; Moreau, V.; Zwolinski, P. Product-Service Systems Scenarios as a Tool for Transition towards Sustainable PSS’. Product Services Systems and Value Creation. In Proceedings of the 6th CIRP Conference on Industrial, IPSS 2014, Windsor, ON, Canada, 1–2 May 2014. [Google Scholar]
- Aurich, J.C.; Schweitzer, E.; Fuchs, C. Life Cycle Management of Industrial Product-Service Systems; Springer Science and Business Media LLC: Berlin/Heidelberg, Germany, 2007; pp. 171–176. [Google Scholar]
- Chiu, F.-C. Fit between future thinking and future orientation on creative imagination. Think. Ski. Creat. 2012, 7, 234–244. [Google Scholar] [CrossRef]
- Corubolo, M.; Jégou, F.; Meroni, A.; Piredda, F.; Zhang, Z. Visual Material Presenting Emerging Best Practices and Emerging Visions on Sustainable Lifestyles; The emerging visions. Part 2; Deliverable for SPREAD Sustainable Lifestyles; Politecnico di Milano: Milan, Italy, 2011. [Google Scholar]
- Eames, M.; Hunt, M.; Dixon, T.; Britnell, J. Retrofit City Futures: Visions for Urban Sustainability; Report for the Retrofit 2050, Cardiff University: Cardiff, UK, 2013. [Google Scholar]
- Forum for the Future. Fashion Futures 2025: Global Scenarios for a Sustainable Fashion Industry; Forum for the Future and Levi Strauss: London, UK, 2010. [Google Scholar]
- Forum for the Future. Consumer Futures 2020; Scenarios for tomorrow’s consumer; Forum for the Future and Sainsbury’s and Unilever: London, UK, 2011. [Google Scholar]
- Government Office for Science. Tackling Obesities: Future Choices—Visualising the Future: Scenarios to 2050; Department of Innovation Universities and Skills: London, UK, 2007. [Google Scholar]
- Jégou, F.; Seyrig, A.; Scholl, G. Sustainable Street 2030: CORPUS Toolkit for Collaborative Scenario Building; Institut für ökologische Wirtschaftsforschung GmbH: Berlin, Germany, 2013. [Google Scholar]
- Ryan, C.; Twomey, P.; Gaziulusoy, A.I.; McGrail, S.; Chandler, P. Scenarios 2040—Results from the Second Year of Visions and Pathways 2040; Scenarios of Low Carbon Living: Melbourne, Australia, 2016. [Google Scholar]
- Taylor, R.; Frame, B.; Delaney, K.; Brignall–Theyer, M. 4 Future Scenarios for New Zealand; Manaaki Whenua Press: Lincoln, New Zealand, 2007. [Google Scholar]
- Virdis, M.R. Energy to 2050: Scenarios for a Sustainable Future; OECD/IEA: Paris, France, 2003. [Google Scholar]
- Manzini, E.; Jégou, F. The Construction of Design-Orienting Scenarios; Final report; SusHouse Project; Faculty of Technology, Policy and Management, Delft University of Technology: Amsterdam, The Netherlands, 2000. [Google Scholar]
- Emili, S.; Ceschin, F.; Harrison, D. Product-Service Systems applied to Distributed Renewable Energy: A classification system and 15 archetypal models. Energy Sustain. Dev. 2016, 32, 71–98. [Google Scholar] [CrossRef] [Green Version]


| Section | Research Stage | Research Activities | Objectives Met |
|---|---|---|---|
| Section 3.1 | Research Clarification: Analysis of existing PSS implementation barriers | Literature review | 1. Collection of existing PSS implementation barriers. |
| Section 3.2 | Descriptive Study I: Collection of promising DM opportunities | Literature review | 2. Identification of DM features, benefits, future trends and challenges; 3. Validation of literature review findings and knowledge update regarding DM features, benefits, future trends and challenges. |
| Semi-structured expert interviews | |||
| DM research workshop | |||
| Section 3.3 | Prescriptive Study I: Development of PSS+DM near-future scenarios and the PSS+DM Design Tool version 1.0 | Future scenario development | 4. PSS+DM near-future scenario development based on the findings from the RC and DS-I stages; 5. Integration of PSS+DM scenarios into the Design Tool version 1.0. |
| Development of the Design Tool version 1.0 | |||
| Section 3.4 | Descriptive Study II: Empirical testing of the PSS+DM Design Tool version 1.0 | Testing of the Design Tool version 1.0 with design students | 6. Evaluation of usability and effectiveness of the PSS+DM Design Tool version 1.0. |
| Data analysis | |||
| Section 3.5 | Prescriptive Study II: Development of the PSS+DM Design Tool version 2.0 | Development of the Design Tool version 2.0 | 7. Summary of the requirements for the development of the improved version of the Design Tool. 8. Updated design of the Tool. |
| Section 3.6 | Descriptive Study III: Empirical testing of the PSS+DM Design Tool version 2.0 | Testing with PSS and/or DM experts | 9. Evaluation of completeness, effectiveness, and usability of the PSS+DM Design Tool version 2.0. |
| Testing with manufacturing companies and design agencies | |||
| Data analysis | |||
| Section 3.7 | Prescriptive Study III: Development of the final version of the PSS+DM Design Tool | Development of the Design Tool version 3.0 | 10. Summary of the requirements for the development of the improved version of the Design Tool. 11. Updated design of the Tool. |
| No. | Subcategory | PSS Implementation Barriers | Literature Source |
|---|---|---|---|
| PSS barriers for companies: | |||
| 1 | Organisational mind-set | Challenges to adopt mutual PSS-oriented mindset and embed PSS culture. | [32,36,37] |
| 2 | Resistance to change and adapting new ways to manage business processes. | [6,36,39] | |
| 3 | Resistance to make long-term decisions needed for PSS implementation. | [35,52] | |
| 4 | Inability to capture the value of PSS in a successful business model. | [37] | |
| 5 | Knowledge and expertise | A lack of know-how, knowledge, and expertise in methods and tools needed to develop, evaluate, and deliver a competent PSS. | [2,7,35] |
| 6 | A lack of skilled personnel in service development. | [32,40,41,52] | |
| 7 | A lack of know-how of designing and developing a product for PSS offerings. | [32,38,39] | |
| 8 | Overemphasis on product innovation. | [36,37,39] | |
| 9 | Finance-related challenges | A lack of financial resources of SMEs to implement and run PSS business models. | [6,51] |
| 10 | Challenges to cover the initial investment in PSS development. | [5,6,40] | |
| 11 | A lack of knowledge and practice in pricing PSS offerings, estimating cash flows and financial savings. | [2,35,38,40] | |
| 12 | Organisational fragmentation | Organisational and structural separation between product and service designs. | [39] |
| 13 | Disagreements between organisational bodies. | [36,39,53] | |
| 14 | Risk of cannibalisation. | [7,35,54] | |
| 15 | Challenges of adding services to some products. | [38] | |
| 16 | Collaboration with stakeholders | Concerns linked to sharing knowledge, expertise, and confidential information about internal procedures. | [4,41,52] |
| 17 | A multiplicity of actors in service chains, none of whom may have an overview of the entire chain and/or the ability to influence other actors. | [7,32,35] | |
| 18 | Concerned of weakened administration of core competencies caused by co-dependence of partners. | [7,32,55] | |
| 19 | Concerns linked to conflict of economic interest caused by different partners. | [4,51] | |
| 20 | Relationship with customers | Challenging to define customers’ purchase and service acceptance behaviour and develop PSS for a specific context. | [42,53,56] |
| 21 | Concerns of the requirement for PSS provider to access customers’ personal data or even enter into their property. | [33,50,57] | |
| 22 | Difficulties to provide PSS with higher or equal level of performance than traditional solutions. | [36,38] | |
| 23 | Ownerless consumption might lead to careless behaviour. | [38,40,58] | |
| 24 | Challenges of customers not being willing to return the product at the end of contract. | [5,42] | |
| 25 | Maintenance services | Difficulties in managing components for maintenance service caused by the lack of global service infrastructure. | [52,59] |
| 26 | A lack of data of PSS lifecycle. | [5,39,52] | |
| 27 | Environmental concerns | Difficulties to quantify environmental saving of PSS acceptance. | [32] |
| 28 | Prolonged time-to-market caused by the environmental efficiency added to business. | [5,52] | |
| 29 | An environmental impact caused by service provision. | [52,60] | |
| 30 | Absence of “green” suppliers. | [51] | |
| PSS barriers for customers: | |||
| 31 | Mind-set and social status | A belief that product ownership is related to social status and measure of achievement in life. | [6,41,42,44,45,58] |
| 32 | A belief that high initial investment when purchasing a product guarantees high level of satisfaction. | [2,41,45,58] | |
| 33 | A lack of recognisable PSS brand. | [50,61] | |
| 34 | Knowledge about PSS | A lack of understanding about the overall PSS concept and a belief that PSS solutions are less comfortable. | [38,42,45,46,50] |
| 35 | A lack of information about owned product lifecycle costs and a belief that service “package” is more expensive | [33,42,43,45] | |
| 36 | Relationship with PSS provider | A lack of trust in PSS provider | [43,49,58] |
| 37 | Resistance to accept long-term relationship with PSS provider. | [35,47,54,58] | |
| 38 | A mismatch between the offerings of PSS companies and the needs or desires of their potential customers. | [36,47,58,62] | |
| 39 | Concerned about the requirement for PSS provider to access customers’ personal data. | [38,50] | |
| 40 | Use of product or access to services | Concerns linked to independence and convenience related to the access of shared products. | [4,45,63] |
| 41 | Concerns related to hygiene of used or shared products. | [42,48,49] | |
| 42 | Concerns related to ruining or damaging shared products. | [42,43,45,58] | |
| Context-related PSS barriers: | |||
| 43 | Finance-related challenges | Taxation | [40,54] |
| 44 | A lack of knowledge and support from financial institutions. | [33,51] | |
| 45 | Low cost of resources, which encourage manufacturing of products using raw materials instead of recycling. | [38,64] | |
| 46 | High labour prices, which prevent customers from choosing labour-intensive PSS offerings. | [34,38] | |
| 47 | Regulatory barriers | A lack of external infrastructure for product end-of-life stage. | [32,50,52] |
| 48 | Externalities (environmental impacts) not included in the market price. | [33] | |
| No. | DM Opportunities | Literature Source | DM Challenges | Literature Source |
|---|---|---|---|---|
| Application of digital and physical technologies: | ||||
| 1 | ICT-facilitated collaboration between geographically dispersed stakeholders. | [70,71] | Challenges related to information exchange, communication and control between different production sites. | [75] |
| 2 | Spread of workloads across manufacturing units sharing same digital standards. | [12] | ||
| Managers receive greater responsibilities and difficulties caused by complex manufacturing tasks. | [75] | |||
| 3 | Remote control of manufacturing equipment. | [71] | ||
| 4 | Opportunity to start selling technological knowledge instead of providing physical manufacturing service. | [Expert interviews] | Lack of official data-sharing agreements between digitally connected supply chain actors. | [12,76] |
| 5 | Improved monitoring, control and optimisation of stock and material flows. | [12] | Challenges related to fitting new technologies into existing companies’ production lines. | [67] |
| 6 | Improved product monitoring through the application of sensor technology. | [12] | ||
| 7 | Optimised production, consumption and service through the application of sensor technology. | [70] | ||
| Security issues related to companies’ and customers’ data. | [67,70] | |||
| 8 | Machine to machine communication | [Expert interviews] | ||
| 9 | Improved development of future products through the application of “Digital Brain”. | [72] | ||
| 10 | Functional products achieved through the application of sensor technology. | [Expert interviews] | ||
| 11 | Better understanding of user behaviour through the Big Data collected by sensors. | [81] | ||
| 12 | Potential reduction of the time-to-market through the ability to manufacture in small lot sizes. | [75] | High initial investment costs, related to adoption of new technologies, their maintenance and upgrade. | [12] |
| Energy consumption of advanced manufacturing technology is higher per unit. | [Expert interviews] | |||
| 13 | Small-scale production of more complex products and their components provided by AM. | [Expert interviews] | ||
| 14 | Consumption of less material and less waste at the point of manufacturing using AM. | [25] | ||
| 15 | Optimisation of recycling in order to enable circular economy using AM. | [18,25] | ||
| Challenges related to training of employees who are required to have a wide range of technical and design skills. | [12,69] | |||
| 16 | Simplified and optimised design of products produced using AM. | [25] | ||
| 17 | Manufacturing of lightweight products using AM. | [19,82] | ||
| 18 | Self-disassembly and self-repair of product components available with the application of 4D printing technology. | [73] | ||
| 19 | Volume reduction of packed 4D printed products. | [73] | ||
| 20 | Low cost desktop 3D printers equipped with advanced materials (e.g., metal powder). | [Expert interviews] | Perception that 3D printing certain components is not reliable. | [Expert interviews] |
| Localisation of manufacturing units: | ||||
| 21 | Reduced transportation costs and delivery times. | [75,77] | Difficulties related to managing same quality delivery at various manufacturing units. | [12] |
| 22 | Reduced environmental impact of transportation, caused by only digital production files and raw materials being shipped over long distanced. | [83] | ||
| 23 | Last mile low-emission delivery implemented by companies to their customers. | [12,19] | ||
| 24 | Manufacturing in real time at the point of need. | [Expert interview, Research workshop] | Regulating small number of large-scale productions is easier than regulating a large number of small production sites. | [68] |
| 25 | Reduction of the number of intermediaries in the supply chain. | [84,85,86] | ||
| Issues related to energy consumption and toxicity of 3D printing processes. | [Expert interviews] | |||
| 26 | Combination of production and entertainment in manufacturing facilities in public spaces. | [Expert interviews] | ||
| 27 | Production in-store with manufacturing units on high street. | [78] | ||
| 28 | Home manufacturing of products which are no longer produced by companies. | [Expert interviews, Research workshop] | ||
| 29 | Production of products and their components carried out anywhere in the world using local resources and access to technologies. | [12] | Challenges to sensibly adapt new manufacturing units to the local context. | [Research workshop] |
| Difficulties and costs needed to manage production quality at various manufacturing units. | [12] | |||
| 30 | Re-evaluation of a global network design of companies. | [67] | ||
| 31 | Potential open collaboration between companies. | [Research workshop] | ||
| Change of mind within the company is needed to maintain operational transition towards DM implementation. | [68] | |||
| 32 | Facilitated movement and re-location of manufacturing facilities in case of market or environmental changes. | [67] | ||
| 33 | Worldwide manufacturing facilities for maintenance and production of spare parts. | [75] | ||
| Limited independence of companies caused by other network units and their processes and objectives. | [70] | |||
| 34 | Improved responsiveness, flexibility and efficiency for the manufacturing of spare parts. | [75] | ||
| 35 | Higher employment rate achieved by supporting local producers who employ local communities. | [12,68] | Challenges related to training of employees. | [12,68] |
| 36 | Support of local crafts and craftsmanship. | [Expert interviews] | ||
| 37 | Low capital cost of entry to distributed network. | [Expert interviews] | Concerns of companies related to processes fragmentation caused by offshoring and outsourcing of operations. | [78] |
| 38 | A shift towards service-based business models. | [20,78] | ||
| 39 | Opportunity for developing countries to produce goods on their own demand. | [71] | ||
| Customer-orientation: | ||||
| 40 | Small-scale manufacturing of only products required by customers. | [12,67] | Reduced efficiency of manufacturing processes compared to centralised mass production facilities. | [69] |
| 41 | Resilience to changes in demand caused by moving from centralised production of single product to small-scale production of multi-products. | [67] | ||
| 42 | Reduced warehousing costs related to unsold products, caused by on-demand production. | [67] | ||
| 43 | Open-source innovations encouraged by customer involvement in design and production processes. | [12] | Lack of regulations increase risk of illegal copying of objects through access to digital files and open-source information. | [78] |
| 44 | Free open-source libraries from which designs can be downloaded and improved by everyone. | [Expert interviews] | ||
| 45 | Customer involvement in production of personalised products. | [12,67,79] | A risk to move from consumption of products to consumption of production. | [Expert interviews] |
| 46 | Customers able to use digital design tools and send a production request to local manufacturing facility. | [12] | ||
| Challenges related to encouraging customers to adopt the new system of consuming and producing. | [Expert interviews] | |||
| 47 | Open-access workshops, which allow users to get involved in product development processes. | [12,69] | ||
| The choice of location of openly accessible manufacturing facilities must take into account the radius in which people are reached. | [71] | |||
| 48 | New community-sharing places to learn skills: repair cafes, makerspaces, co-working spaces etc. | [Expert interviews] | ||
| 49 | Distribution of knowledge and share of skills. | [Expert interviews, Research workshop] | Home and DIY production distinguishes by limited manpower, tools, skills and investment capacity. | [80] |
| 50 | Education of consumers, which provides a better understanding of production and efficient use of products. | [12] | ||
| Not all parts of products are suitable for DIY manufacturing. | [80] | |||
| 51 | Personalised services supporting personalised products. | [11] | Higher cost of personalised/bespoke products and services compared to traditionally mass manufactured equivalent. | [12] |
| 52 | Facilitated companies enter to niche markets. | [67] | ||
| 53 | Mass customisation and cost-effective bespoke production. | [12] | ||
| Potential conflicts within organisations caused by choices to offer standardised, personalised, inclusive or bespoke products. | [12] | |||
| 54 | Long-lasting companies’ relationship with customers, caused by proximity use of digital technologies. | [12] | Concerns of privacy issues of companies’ data caused by application of cloud manufacturing and ICT. | [12] |
| 55 | Facilitated collaboration between producer and customer. | [Research workshop] | ||
| Scenario Cards | |||||||
| Question | Evaluation | ||||||
| 1 Very Poor | 2 Poor | 3 Sufficient | 4 Good | 5 Excellent | Average | ||
| Effectiveness | 1. To what extent the Scenario Cards helped you understand the potential benefits of DM applied to PSS? | 0% | 0% | 7% | 53% | 40% | 4.3 |
| 2. To what extent are the Scenario Cards useful to generate ideas? | 0% | 2% | 15% | 41% | 42% | 4.2 | |
| 3. To what extent the Scenario Cards helped you stimulate the discussion in your group? | 0% | 2% | 12% | 61% | 25% | 4 | |
| Usability | 4. To what extent are the illustrations on the Scenario Cards easy to understand? | 0% | 0% | 11% | 55% | 34% | 4.2 |
| 5. To what extent are the descriptions of the scenarios easy to understand? | 0% | 4% | 30% | 54% | 12% | 3.7 | |
| 6. To what extent are the colour coding and the icons easy to understand? | 0% | 0% | 19% | 35% | 47% | 4.3 | |
| 7. To what extent, in general, is the layout of the Scenario Cards relevant to its contents? | 0% | 0% | 14% | 52% | 33% | 4.2 | |
| 8. To what extent are the Scenario Cards easy to use? | 0% | 0% | 19% | 60% | 21% | 4 | |
| Innovation Diagram | |||||||
| Question | Evaluation | ||||||
| 1 Very Poor | 2 Poor | 3 Sufficient | 4 Good | 5 Excellent | Average | ||
| Effectiveness | 1. To what extent is the Innovation Diagram useful to generate ideas? | 0% | 0% | 12% | 50% | 38% | 4.3 |
| 2. To what extent has the Innovation Diagram helped you take into account a complete lifecycle of your concept? | 0% | 2% | 17% | 41% | 41% | 4.2 | |
| 3. To what extent the Innovation Diagram helped you stimulate the discussion in your group? | 0% | 5% | 42% | 39% | 42% | 4.2 | |
| Usability | 4. To what extent is the Innovation Diagram easy to understand? | 0% | 0% | 17% | 71% | 2% | 4 |
| 5. To what extent is the Innovation Diagram easy to use? | 0% | 0% | 2% | 61% | 37% | 4.3 | |
| Scenario Cards | ||||
| Worked | Did Not Work | Examples of Suggestions from Participants | Recommendations for New Features | |
| Effectiveness | 1. Overall DM concept and the way it was presented aroused students’ interest. 2. Illustrations were easy to understand and inspiring. | 1. Some students had difficulties with applying scenarios to their own PSS concepts. | “Give more questions to inspire us.” | 1. Provide more questions in each Scenario Card to trigger idea generation. |
| Usability | 2. DM features were missing more detailed explanations about technological features and real-world cases. | “A good case study as an example could help us to better understand DM concept” “More in-depth information about the technologies.” | 2. Include case studies to better illustrate DM potential and provide descriptions of advanced technological features. | |
| Innovation Diagram | ||||
| Worked | Did Not Work | Examples of Suggestions from Participants | Recommendations for New Features | |
| Effectiveness | 1. Focus on a complete PSS lifecycle. | 3. Lack of guidelines about where to start and finish the idea generation process. | “If the diagram could have more rules and activities it will be better.” “Beginning at random stages of lifecycle – starting at end of life might change the final design – order can matter.” | 3. Provide more specific step-by-step guidelines of the tool application process, particularly emphasizing how to start and finish. |
| Usability | 4. Confusion linked to two different DM categorisation: customer involvement and company’s openness. | “It is not easy to map on the diagram. [Customer involvement icons] need to be simplified or re-categorized and help user to understand the contents easier.” | 4. Simplify the Diagram, keeping PSS lifecycle stages and removing Customer Involvement and Company’s Openness, potentially replacing them by a different axis. | |
| Scenario Cards | |||||||
| Question | Evaluation | ||||||
| 1 Very Poor | 2 Poor | 3 Sufficient | 4 Good | 5 Excellent | Average | ||
| Completeness | 1. To what extent are the contents of the Scenario Cards sufficient? | 0% | 0% | 0% | 48% | 52% | 4.5 |
| Effectiveness | 2. To what extent the Scenario Cards helped you understand potential benefits of DM applied to PSS? | 0% | 0% | 9% | 43% | 48% | 4.4 |
| 3. To what extent are the Scenario Cards useful for idea generation process? | 0% | 0% | 8% | 38% | 54% | 4.5 | |
| Usability | 4. To what extent are the Scenario Cards easy to use? | 0% | 0% | 4% | 44% | 52% | 4.5 |
| Innovation Diagram | |||||||
| Question | Evaluation | ||||||
| 1 Very Poor | 2 Poor | 3 Sufficient | 4 Good | 5 Excellent | Average | ||
| Completeness | 1. To what extent are the contents (axes) of the Idea Generation Diagram sufficient? | 0% | 0% | 22% | 35% | 43% | 4.2 |
| Effectiveness | 2. To what extent did the Idea Generation Diagram help you understand potential benefits of DM applied to PSS? | 0% | 0% | 4% | 64% | 32% | 4.3 |
| 3. To what extent is the Idea Generation Diagram useful for the idea generation process? | 0% | 0% | 18% | 50% | 32% | 4.1 | |
| Usability | 4. To what extent is the Idea Generation Diagram easy to use? | 0% | 0% | 18% | 41% | 41% | 4.2 |
| Scenario Cards | ||||
| Worked | Did Not Work | Examples of Suggestions from Participants | Recommendations for New Features | |
| Completeness | 1. Illustrations were identified as clear, fun, and engaging (from experts). 2. Scenarios were easy to apply in the specific business context (from companies). | 1. DM case studies were identified as difficult to relate to. | “I had difficulties because the examples are very distant for my work.” (from companies and design agencies) | 1. Improve DM case studies by making them more diverse. |
| Effectiveness | 2. Scenario illustrations were identified as limiting the idea generation process. | “Make images more culturally diverse.” (from experts) | 2. Make scenario illustrations more generic. | |
| Usability | 3. Analysis of the contents of Scenario Cards required more time than participants expected (from companies and design agencies). | “In my opinion, they could be more direct and simple, with less words and just 1 side.” (from companies and design agencies) | 3. Reduce, simplify or better categorise textual information, including scenario descriptions, PSS barriers. | |
| Innovation Diagram | ||||
| Worked | Did Not Work | Examples of Suggestions from Participants | Recommendations for New Features | |
| Completeness | 1. Scenario Cards mapped on the diagram provided a good overall picture of the Design Tool (from experts). 2. Potential applications of DM features in each PSS lifecycle stage were well understood (from companies). | 4. The Diagram was identified as too product-focused and not efficient to support PSS-oriented thinking (from companies and design agencies). | “As we will use post-its, you could put more information inside the boxes.” (from companies and design agencies) | 4. Provide more information about PSS (questions or suggestions) inside empty squares of the diagram. |
| Effectiveness | 5. The Diagram was missing clear guidelines on how to use it (from experts). | “More guidelines for idea navigation. Something that shows idea inclination - if user focuses on one corner of the diagram, how to encourage him/her to also develop ideas in other areas? Has the diagram to be completed?” (from experts) | 5. Provide more guidelines on how to select relevant Scenario Cards and use the Diagram. | |
| Usability | 6. Colours were identified as too similar and confusing (from experts, companies and design agencies). | “The colours are a problem. Red is almost same as orange, and the greys are close.” (from experts) | 6. Improve colour coding and graphical communication elements. | |
© 2020 by the authors. Licensee MDPI, Basel, Switzerland. This article is an open access article distributed under the terms and conditions of the Creative Commons Attribution (CC BY) license (http://creativecommons.org/licenses/by/4.0/).
Share and Cite
Petrulaityte, A.; Ceschin, F.; Pei, E.; Harrison, D. Applying Distributed Manufacturing to Product-Service System Design: A Set of Near-Future Scenarios and a Design Tool. Sustainability 2020, 12, 4918. https://doi.org/10.3390/su12124918
Petrulaityte A, Ceschin F, Pei E, Harrison D. Applying Distributed Manufacturing to Product-Service System Design: A Set of Near-Future Scenarios and a Design Tool. Sustainability. 2020; 12(12):4918. https://doi.org/10.3390/su12124918
Chicago/Turabian StylePetrulaityte, Aine, Fabrizio Ceschin, Eujin Pei, and David Harrison. 2020. "Applying Distributed Manufacturing to Product-Service System Design: A Set of Near-Future Scenarios and a Design Tool" Sustainability 12, no. 12: 4918. https://doi.org/10.3390/su12124918
APA StylePetrulaityte, A., Ceschin, F., Pei, E., & Harrison, D. (2020). Applying Distributed Manufacturing to Product-Service System Design: A Set of Near-Future Scenarios and a Design Tool. Sustainability, 12(12), 4918. https://doi.org/10.3390/su12124918