Article

Social Vulnerability to Natural Hazards in Namibia: A District-Based Analysis

Faculty of Forestry and Wood Sciences, Czech University of Life Sciences Prague, Kamýcká 129, 165 00 Praha 6–Suchdol, Czech Republic
*
Author to whom correspondence should be addressed.
Sustainability 2020, 12(12), 4910; https://doi.org/10.3390/su12124910
Submission received: 17 April 2020 / Revised: 6 June 2020 / Accepted: 12 June 2020 / Published: 16 June 2020

Abstract

:
Southern Africa is one of the world’s poorest and most vulnerable regions with severe barriers to its sustainable development. We strived to understand here the patterns and drivers of social vulnerability to natural hazards in Namibia, which is the most arid sub-Saharan country with large social inequalities. We used a total of 12 indicators that characterized social, economic and demographic settings of the 14 districts in the country. Further, we evaluated the countrywide pattern of most relevant natural hazards, including wildfires, floods and drought. We identified the main factors driving social vulnerability in the districts, and we evaluated how the socio-economic fitness of populations coincided with the distribution of high-hazard areas. We found that populations with the poorest socio-economic performance were mostly distributed in the country’s northern districts, which are also exposed to the highest frequency and severity of natural hazards, particularly to floods and wildfires. This coincidence of highly sensitive populations with high exposure to hazards renders these populations particularly vulnerable. That the frequency of natural hazards increases with climate change, and implementation of programs enhancing the social resilience is insufficient, underscores the urgency of actions targeted at the priority areas identified herein.

1. Introduction

The world has been experiencing an unprecedented increase in the frequency and intensity of natural hazards that threaten the stability of many human populations [1,2]. These hazards have increasingly affected economies, the environment, infrastructure and human wellbeing and they have caused annual damages amounting to billions of US dollars globally [3]. Understanding the patterns and mechanism of social vulnerability to natural hazards has, thus, become an important part of the research agenda with implications for policy and decision making [4]. It also plays a crucial role in the development of adaptation and resilience strategies enhancing the population’s capacity to respond to natural disasters [5].
While the biophysical dimension of vulnerability has been extensively studied [6,7], our understanding of the social dimension remains limited [8]. The increasing size of the population affected by diverse stressors, however, highlights the prominence of this topic [9]. Previous studies have focused, for example, on patterns and drivers of vulnerability to specific hazard types, such as floods [8,10], drought [11] and wildfires [12]. Others shed light on the main drivers of social vulnerability [13,14], including changes in demographic composition [14,15] income and poverty [11,13,15], the proportion of elderly people in the community [16,17,18] and access to resources, such as information, technologies and knowledge [19].
The concept of vulnerability has been increasingly applied in social science research and management of natural hazards [19,20]. Social vulnerability to hazards is defined as the probability of a population being negatively affected by hazards [15], or as the capacity of a population to cope with and adapt to hazards [21,22]. There is an agreement that the vulnerability is determined by the interaction of three components: exposure, sensitivity and carrying (adaptive) capacity [21,23]. Assessing the vulnerability of any social system thus requires understanding the biophysical (exposure component) as well as the social, economic and demographic settings (sensitivity and adaptive capacity of the system) [24]. In the current study, we defined the overall vulnerability of the population as a property emerging from the level of exposure to natural hazards (based on hazard occurrence or impact) and the level of social vulnerability (i.e., ability to adapt and recover from the impact), which is based on the social, economic and demographic settings of the population.
Social vulnerability is characterized by a large number of factors, which interact and vary in space and over time in manifold ways (e.g., Cutter et al. [18], Rygel [25], Otto et al. [26]). This complexity, however, makes it difficult to measure vulnerability and compare different assessments [27]. Difficulties emerge, for example, from the selection of partial vulnerability indicators, their preprocessing (transformation, dimensionality reduction, etc.) and determination of their relative importance [28,29]. Vulnerability assessments may, for example, use an entire suite of indicators to evaluate vulnerability profiles for different geographical entities (e.g., districts) [30]. Social scientists also strive to formulate composite indices which capture the essence of information provided by the underlying factors (e.g., Cutter & Finch [9], Rygel [25], Cutter et al. [15] and Fekete [31]). The latter approach has recently received increased attention, and different approaches to the construction of vulnerability indices have been developed and tested [15,32,33,34,35]. Composite indices are, for example, advised to be used to identify the most vulnerable countries, to assist the adaptation efforts or to obtain an entry point for systemic vulnerability studies [29]. The use of composite indices, however, may lead to an oversimplified understanding of the investigated systems and misplaced overconfidence in the conclusions [35]. For example, qualitatively different combinations of underlying variables, which require different responses, may generate the same index value. We, therefore, combined in this study a composite index approach with an assessment of complex vulnerability profiles.
Human populations that exhibit high social vulnerability to natural hazards often occur in developing parts of the world [36], including Africa [37,38]. The frequency and intensity of natural hazards such as floods and droughts have increased for most of the African continent [12,39,40]. Poor infrastructure development, inadequate adaptative capabilities and high dependence on natural resources are the main factors that exacerbate these populations’ vulnerability, and increase, for example, the risk of food insecurity [41,42,43]. In sub-Saharan Africa, natural hazards are increasingly affecting essential economic sectors such as agriculture [44,45,46]. It is estimated that more than ten million people in Southern Africa reside within hazard-prone areas, and their livelihoods vitally depend on hazard-exposed agricultural practices [47].
Namibia is one of the countries with the greatest social and economic inequalities in the world [48]. Its semi-arid environment, along with poor socio-economic conditions, often leads to the overexploitation of scarce resources and threatens the stability of human populations [49]. In recent years, the country has increasingly been experiencing erratic rainfall patterns, extreme droughts and wildfires [50,51]. These events have had a major impact on the main sources of livelihood, particularly for the elderly, women, children and those with compromised health conditions [52,53]. Many households have, thus, become unable to secure their essential needs [42]. Social issues, such as HIV/AIDS and unemployment, particularly among the youth, are of great concern too. This social vulnerability is exacerbated by the underdeveloped infrastructure; for example, more than 60% of the population in rural areas depends on firewood and charcoal as a source of energy.
Despite the recurrent incidence of different natural hazards and overall intensification of disturbance regimes, the patterns and drivers of social vulnerability (SV) are not well understood. This hinders implementations of adaptation and resilience strategies and compromises the options for sustainable development of local communities [50,54,55]. In light of these facts, we aim to extend our understanding of SV of the Namibian population and, thus, support the development of knowledge-driven management strategies and policies. In particular, we aim to (i) identify patterns of SV in the country based on a suite of demographic, economic and other indicators; (ii) identify the main drivers that influence the SV and their variability between the administrative districts; and (iii) evaluate the relationship between SV and the distribution of high-hazard areas in the country. Our results are intended to support the development of national and regional management strategies and the formulation of research and investment priorities, and to contribute towards achieving the Sustainable Development Goals [56,57].

2. Materials and Methods
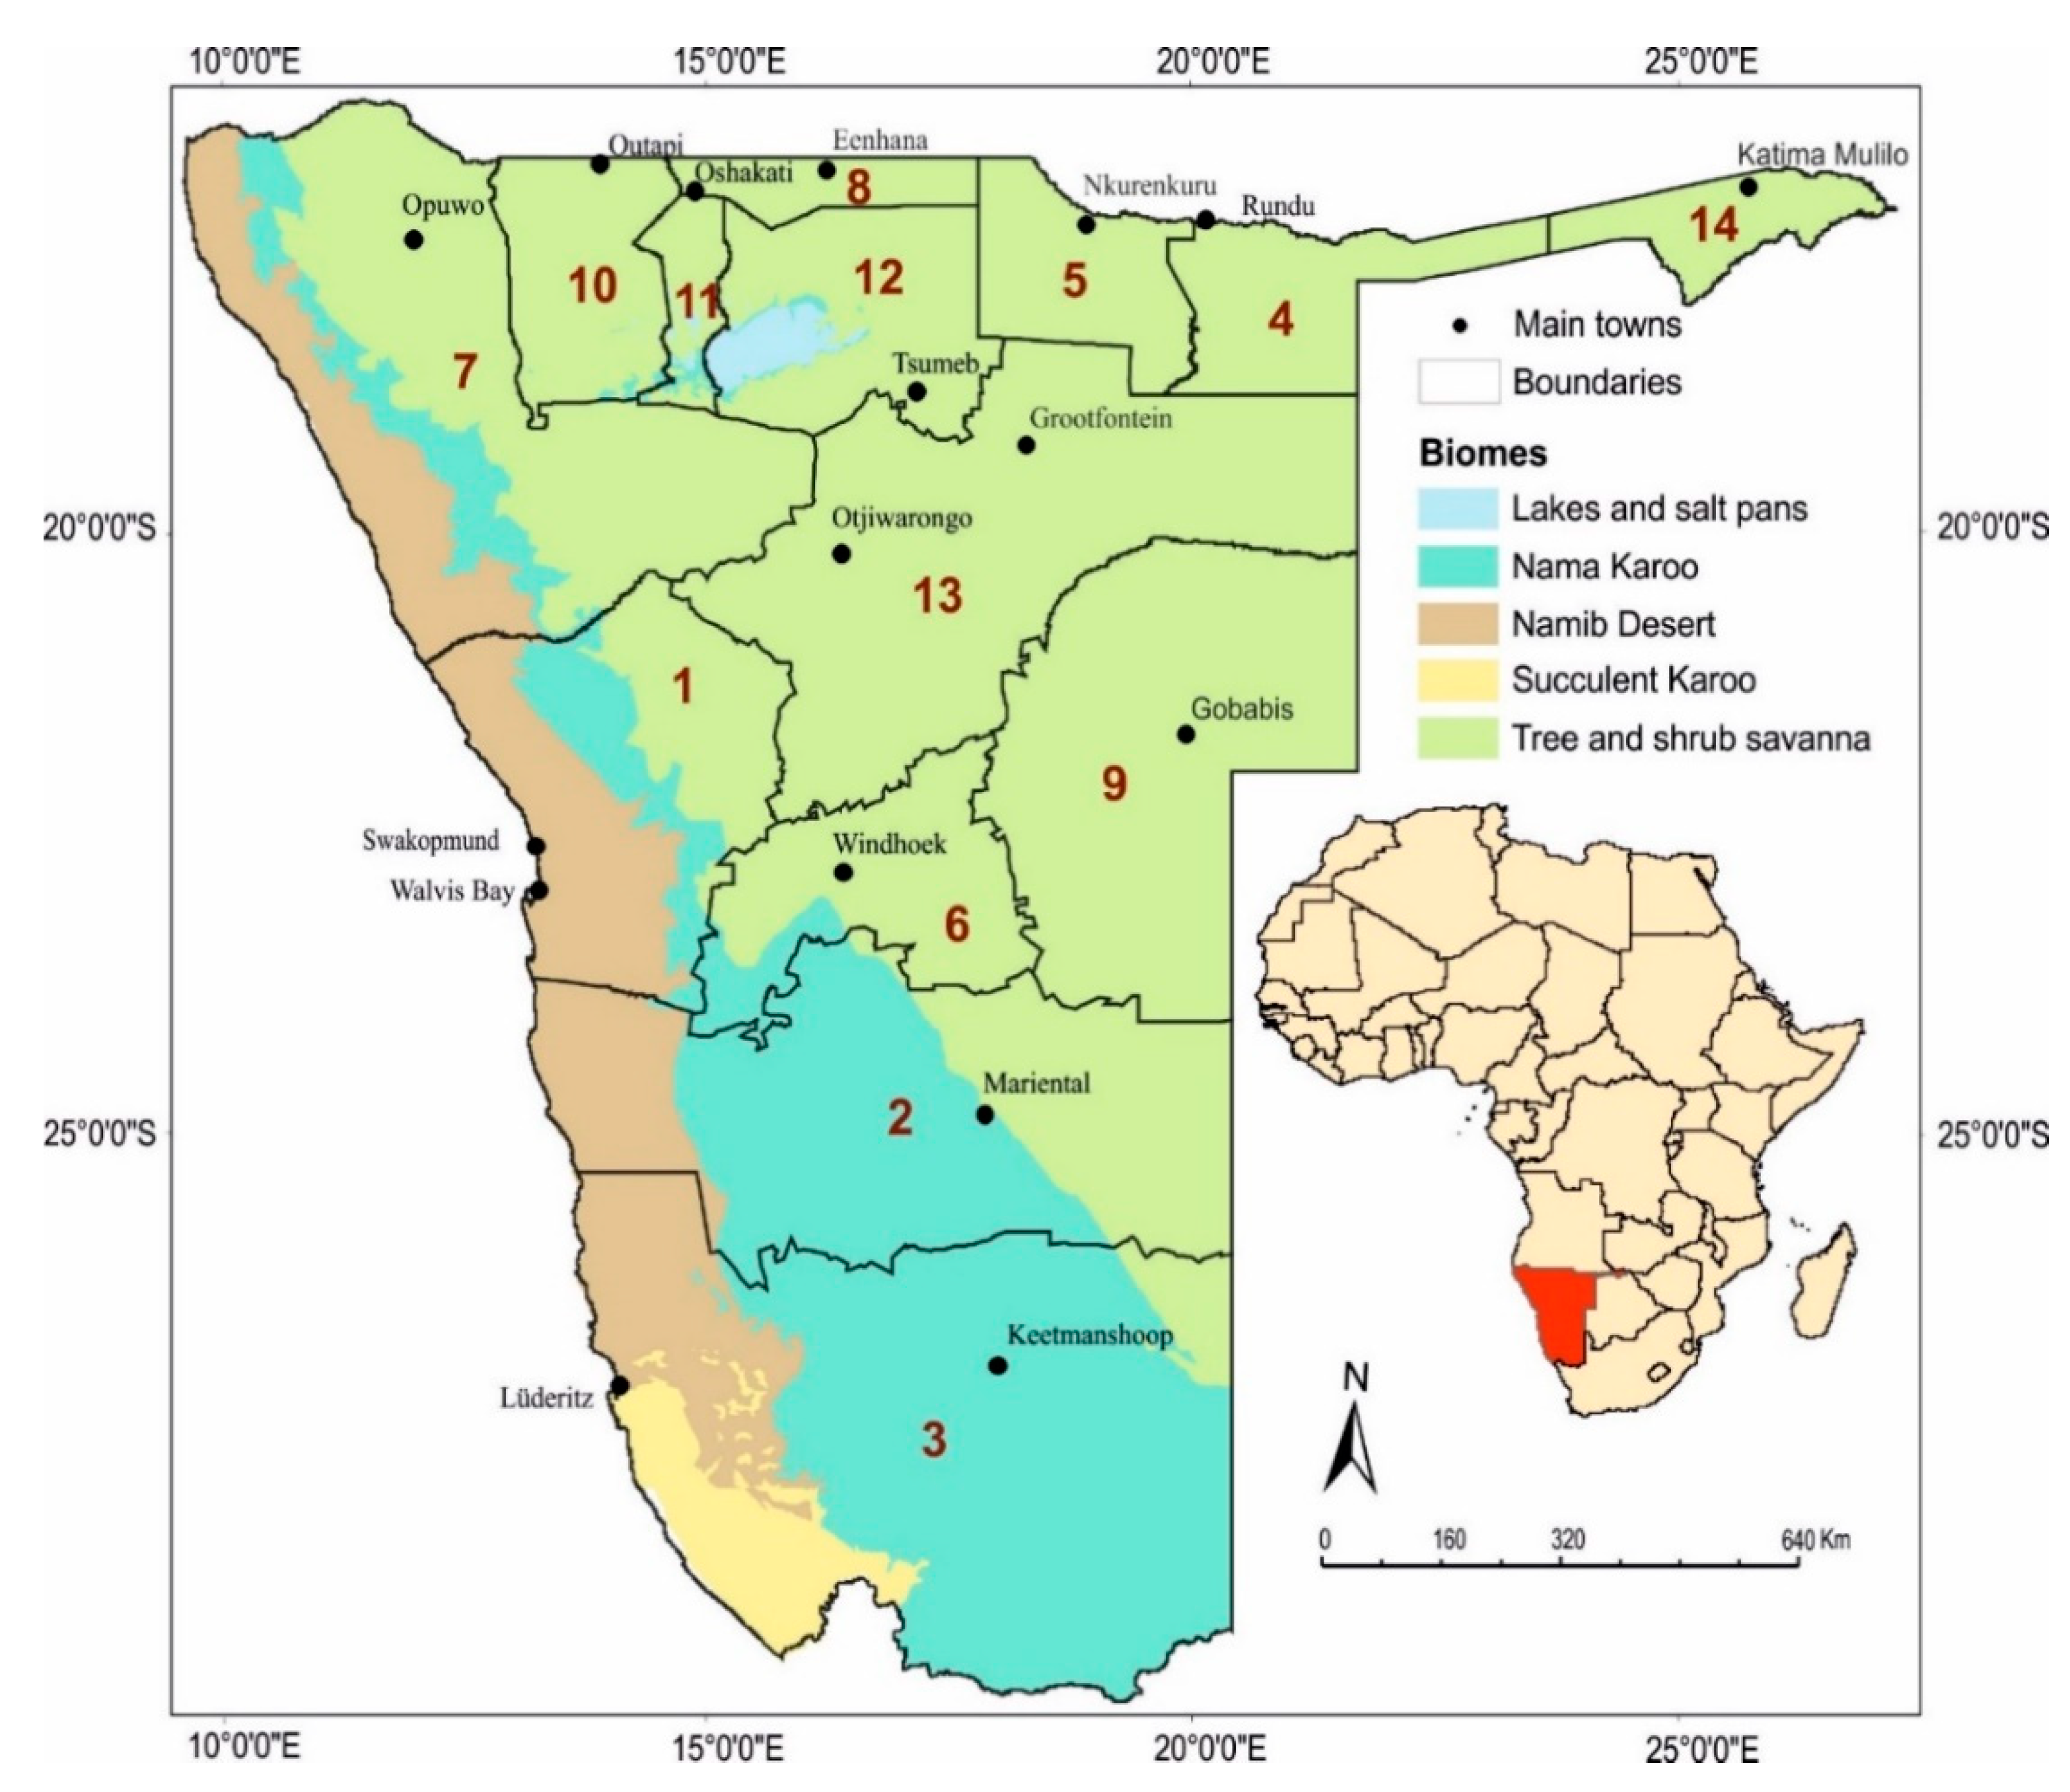
2.1. Study Area

Namibia has an area of 824,292 km² and a population of 2.5 million inhabitants. It is one of the most sparsely populated countries in the world and the driest country in sub-Saharan Africa [43,58] (Figure 1). Elevation of the country increases from the coast towards the inland. The north-central part forms the Cuvelai-Etosha Basin, which is shared with southern Angola. The basin is made up of a drainage system that originates from central Angola and enters the north-central part of Namibia. Then, it spreads through the flat areas of the Kalahari sands into the Etosha Pan [59].
The climate is hot and dry, with uneven rainfall. The average annual air temperature ranges from 16 °C along the coast to 22 °C in the north-central and northeastern part of the country [58]. In the interior, the climate is continental with high summer temperatures and cold winters. Mean annual rainfall ranges from 25 mm in the southern and coastal areas to 600 mm in the Northeast. The most erratic rainfall (inter-annual range >35%) occurs in the transition between the south-western coastal areas and the inland regions. Rainfall is more stable and predictable in the North and Northeast. The wettest period of the year is December to March.
Despite the country’s harsh weather, it harbors a remarkable number of species of fauna and flora. The country is divided into three vegetation zones: desert (16%), savannah (64%), dry woodlands and forests (20%). The country comprises four biomes: tree and shrub savanna (60%), Nama Karoo (dominated by grass, shrubland and quiver trees Aloidendron dichotomum) (24%), the Namib Desert and the Succulent Karoo (mainly dominated by succulents, dwarf shrubs and quiver trees) (2%) (Figure 1). The latter biome is acknowledged as a biodiversity hotspot and the only arid hotspot in the world [60].
The largest ethnic group is Owambo (50%), which mainly occupies the north-central part of the country. Kavangos (9%) are mostly found in the Northeast and Hereros (7%) in the central-east and north-west parts. Damaras (7%) and Namas (5%) mainly occupy the southern part, and Caprivians (4%) the Zambezi district in the far East. The San people (3%), who are one the most marginalized and disadvantaged groups of the population, mostly occupy the northern and central-eastern territories [61]; they are assumed to be the oldest inhabitants of Southern Africa [62]. Other ethnicities include Whites 6%, Basters 2% and Tswanas 5% [63].
The distribution of ethnic groups has been mainly influenced by historical migrations and, to some extent, the dislocation of groups such as the Ovaherero, Damaras and Nama. The dislocations were happening particularly in the eastern, central, and southern parts of the country during the colonial era [64,65]. Moreover, the distribution of some ethnic groups was influenced by the apartheid regime, which, for example, introduced the controversial “redline”, the veterinary cordon fence, that separates communal and commercial farming lands [66]. In the North, the abundance of natural resources such as arable land was the main factor attracting the early settlers. Extensive indigenous knowledge of ethnics such as Owambo, Kavangos and Caprivians allowed them to adapt and persist here even under harsh environmental conditions [67].
More than 54% of the Namibian population reside in rural areas [58], where rainfall-dependent subsistence farming is the main source of livelihood. Namibia has extreme income inequality [48,50], with about 30% of the population living below the poverty line [68,69]. The socio-economic system has been influenced by the apartheid system, which largely compromised all spheres of development. The main sources of income for most of the population in urban areas are small informal businesses. Other sources of income include tourism, mining, agriculture and construction. Poverty is extreme, particularly in rural underdeveloped areas [70]. The most vulnerable groups of the population are female-headed households, the San community, the youth, the elderly and people with disabilities. Poor and severely poor populations account for 29% and 15% of the total population, respectively [70], with poverty hotspots being located in the northern districts (Figure 1).

2.2. Natural Hazard Regime

Flood frequency has increased in recent years in Namibia, affecting around 70,000 people annually [68]. Floods triggered by seasonal torrential rains, often amplified by deforestation, have particularly affected the northern part of the country [68]. For example, the 2011 flood affected here nearly 500,000 people, with over 60,000 displaced, 19,000 in relocation camps and 65 flood-related deaths [72]. North-central Namibia experiences seasonal floods, which relate to the hydrological regime of the Cuvelai Basin. It accumulates water from central Angola during heavy rains and spreads further through the floodplains of Namibia [73]. Floods in north-eastern Namibia mainly relate to the hydrological regime of the Okavango river system (Kavango East and Kavango West) and to the Zambezi river in the far Northeast. The floods are less frequent here than in the north-central part of the country [74]. The far Northeast is part of the Zambezi basin, where floods typically occur during the rainfall season in January and February [75]. The floods, for example, disrupt water supplies, damage sewerage systems in the cities and trigger outbreaks of water-borne diseases such as cholera and malaria (e.g., 2008 flood season) [76].
Recurrent droughts affect most of the Namibian territory and cause livestock deaths, crop failures, poverty and food insecurity [77]. Droughts related to erratic rainfall patterns and increasing evaporation demand occur in most of the country. These effects are further modulated by the El Niño–Southern Oscillation (ENSO), as was the case in the 2015/2016 season [53]. For example, drought events in the period 2013–2016 affected about 450,000 people and caused massive food insecurity [78]. During the season 2018/2019, below-average rainfall caused one of the worst drought events over the previous 40 years, which caused deaths of over 80,000 livestock, and largely compromised household food security [77,79].
Wild and man-induced fires have important impacts on the Namibian ecosystems and economies and, at the same time, have indispensable ecological functions [80]. It is estimated that more than 1 million hectares of forest and open land is burned every year, though the area burned fluctuates depending on weather and actual fuel loads (e.g., 1.1 million hectares in 2016, 2.1 million hectares in 2017) [81]. Most of the fires occur in the fire-driven savanna ecosystems in northern Namibia, which were found to be resilient to a wide range of fire regimes [82]. Most of the fires (90%), particularly in the north-central and north-eastern parts, are anthropogenic and relate, for example, to slash-and-burn agriculture practices [83] or are ignited accidentally [84]. The use of fire in agriculture, however, often leads to uncontrollable spread with undesired consequences [85]. Fires mostly occur during the dry and windy seasons of May–July (early dry season: low intensity fires) and August–September (late dry season: high-intensity fires) [80]. The most fire-prone areas are the communal lands in the north-central and north-eastern parts of the country [85]. Depending on the intensity and timing, wildfires may cause environmental degradation and loss of biodiversity, which impact the livelihood of local communities, national and regional economies [53]. Adverse effects include, for example, the disruption of plant regeneration and damage to commercially valuable tree species such as Burkea pterocarpus and Baikiaea plurijuga in the northern woodlands [80,83].

2.3. Material and Methods

2.3.1. Social Vulnerability Indicators

We used a set of 29 candidate variables (see Supplementary material, Table S1) that characterized the social, economic and demographic conditions of districts in the country (Figure 1). The data were obtained from the Namibia Inter-censal Demographic Survey of 2016 conducted by the Namibia Statistics Agency (NSA). We refined this initial set of variables based on several criteria to arrive at the final list of twelve variables listed in Table 1. Rather than using factors or other analyses for dataset reduction [15,31], we preferred to select a subset of original variables that adequately represented the entire initial dataset (e.g., Sebesvari et al. [6], Rufat et al. [10] and Fatemi et al. [32]). Such an approach allowed for a more straightforward and intuitive interpretation of the final findings.
First, we discarded variables that were obviously redundant (e.g., income per household vs. income per capita). From each group of redundant variables, we preserved a single variable, which had better support in the literature as an indicator of SV (Supplementary material, Table S1). The retained variables were grouped into the categories “social”, “economic” and “demographic“. Within each category, we evaluated the redundancy of variables using Spearman’s rank correlation coefficient with a threshold value of 0.7. From each pair of correlated variables, we retained the variable that showed a greater inter-district variability, i.e., it better discriminated between the districts (Table 1).
Alongside evaluating the districts’ SV profiles using the entire set of variables listed in Table 1, we also calculated the SV index (SVI) for each district by aggregating these variables. We first normalized the values of each variable into the unit range using the following formula:
Z i = x i m i n ( x ) m a x ( x ) m i n ( x )
where Zi is the normalized ith value of the variable Z, xi is the ith value of the variable Z, and min(x) and max(x) are the minimum and maximum values of the variable Z.
Rescaling was conducted so that a value of 1 indicated the highest vulnerability, and vice versa. Such an approach required reverting the normalized values of some variables. This applied for average household income and literacy rate, where the highest value indicated the lowest vulnerability (in contrast to, for example, HIV level, where the highest value indicates the highest vulnerability). The SVI was calculated as the weighted median of the normalized variables. Because normalization based on the Equation (1) unified the variability of variables, we used the variation coefficient (Table 1) as the weight. This allowed for downweighing variables with a small inter-district variability, such as the percent of female population, and attaching a greater importance to variables that strongly discriminated between the districts.

2.3.2. Natural Hazard Indicators

We explored various sources of data to collect a number of indicators related to flood, wildfire and drought incidence in the districts (Supplementary material, Table S2). Because of limited data availability, the data covered different periods of time or were available for a single year only. This can seriously limit use of these data as indicators of the long-term disturbance regime in the districts. We, therefore, critically assessed each of the available indicators using previous studies and statistics (Section 2.2; Appendix A). Based on this, we retained seven indicators that were found to represent the characteristic regime of natural hazards in a given district or a broader region (i.e., the recorded events were not isolated episodic occurrences) (Table 2).
Apart from investigating district-specific hazard profiles based on the whole set of indicators, we also calculated a composite hazard indicator by averaging the underlying indicators rescaled to the unit range. Because the three hazard categories (fire, drought and floods) were represented by a different number of variables (Table 2), we applied weights to equally model the effect of each group of hazards on the final indicator value (column Weight in Table 2). This weighting was applied to compensate for the different data availability on different hazard types rather than to model their equal impact.

2.3.3. District-Based Vulnerability Assessment

Finally, we evaluated the vulnerability of the Namibian population based on the interaction between socio-economic conditions approximated by the SVI and the level of exposure to natural hazards approximated by the introduced hazard index. Based on district positions in the space defined by the SVI and the aggregate hazard index, we categorized the districts into three vulnerability classes using the K-means clustering technique. In the final evaluation, we conducted the analysis based on composite indices with socio-economic or hazard profiles constructed for each district using the full set of underlying variables.
All presented analyses were conducted in Statistica 13.4 [86], R-Language [87] and ArcGIS Desktop [88].

3. Results

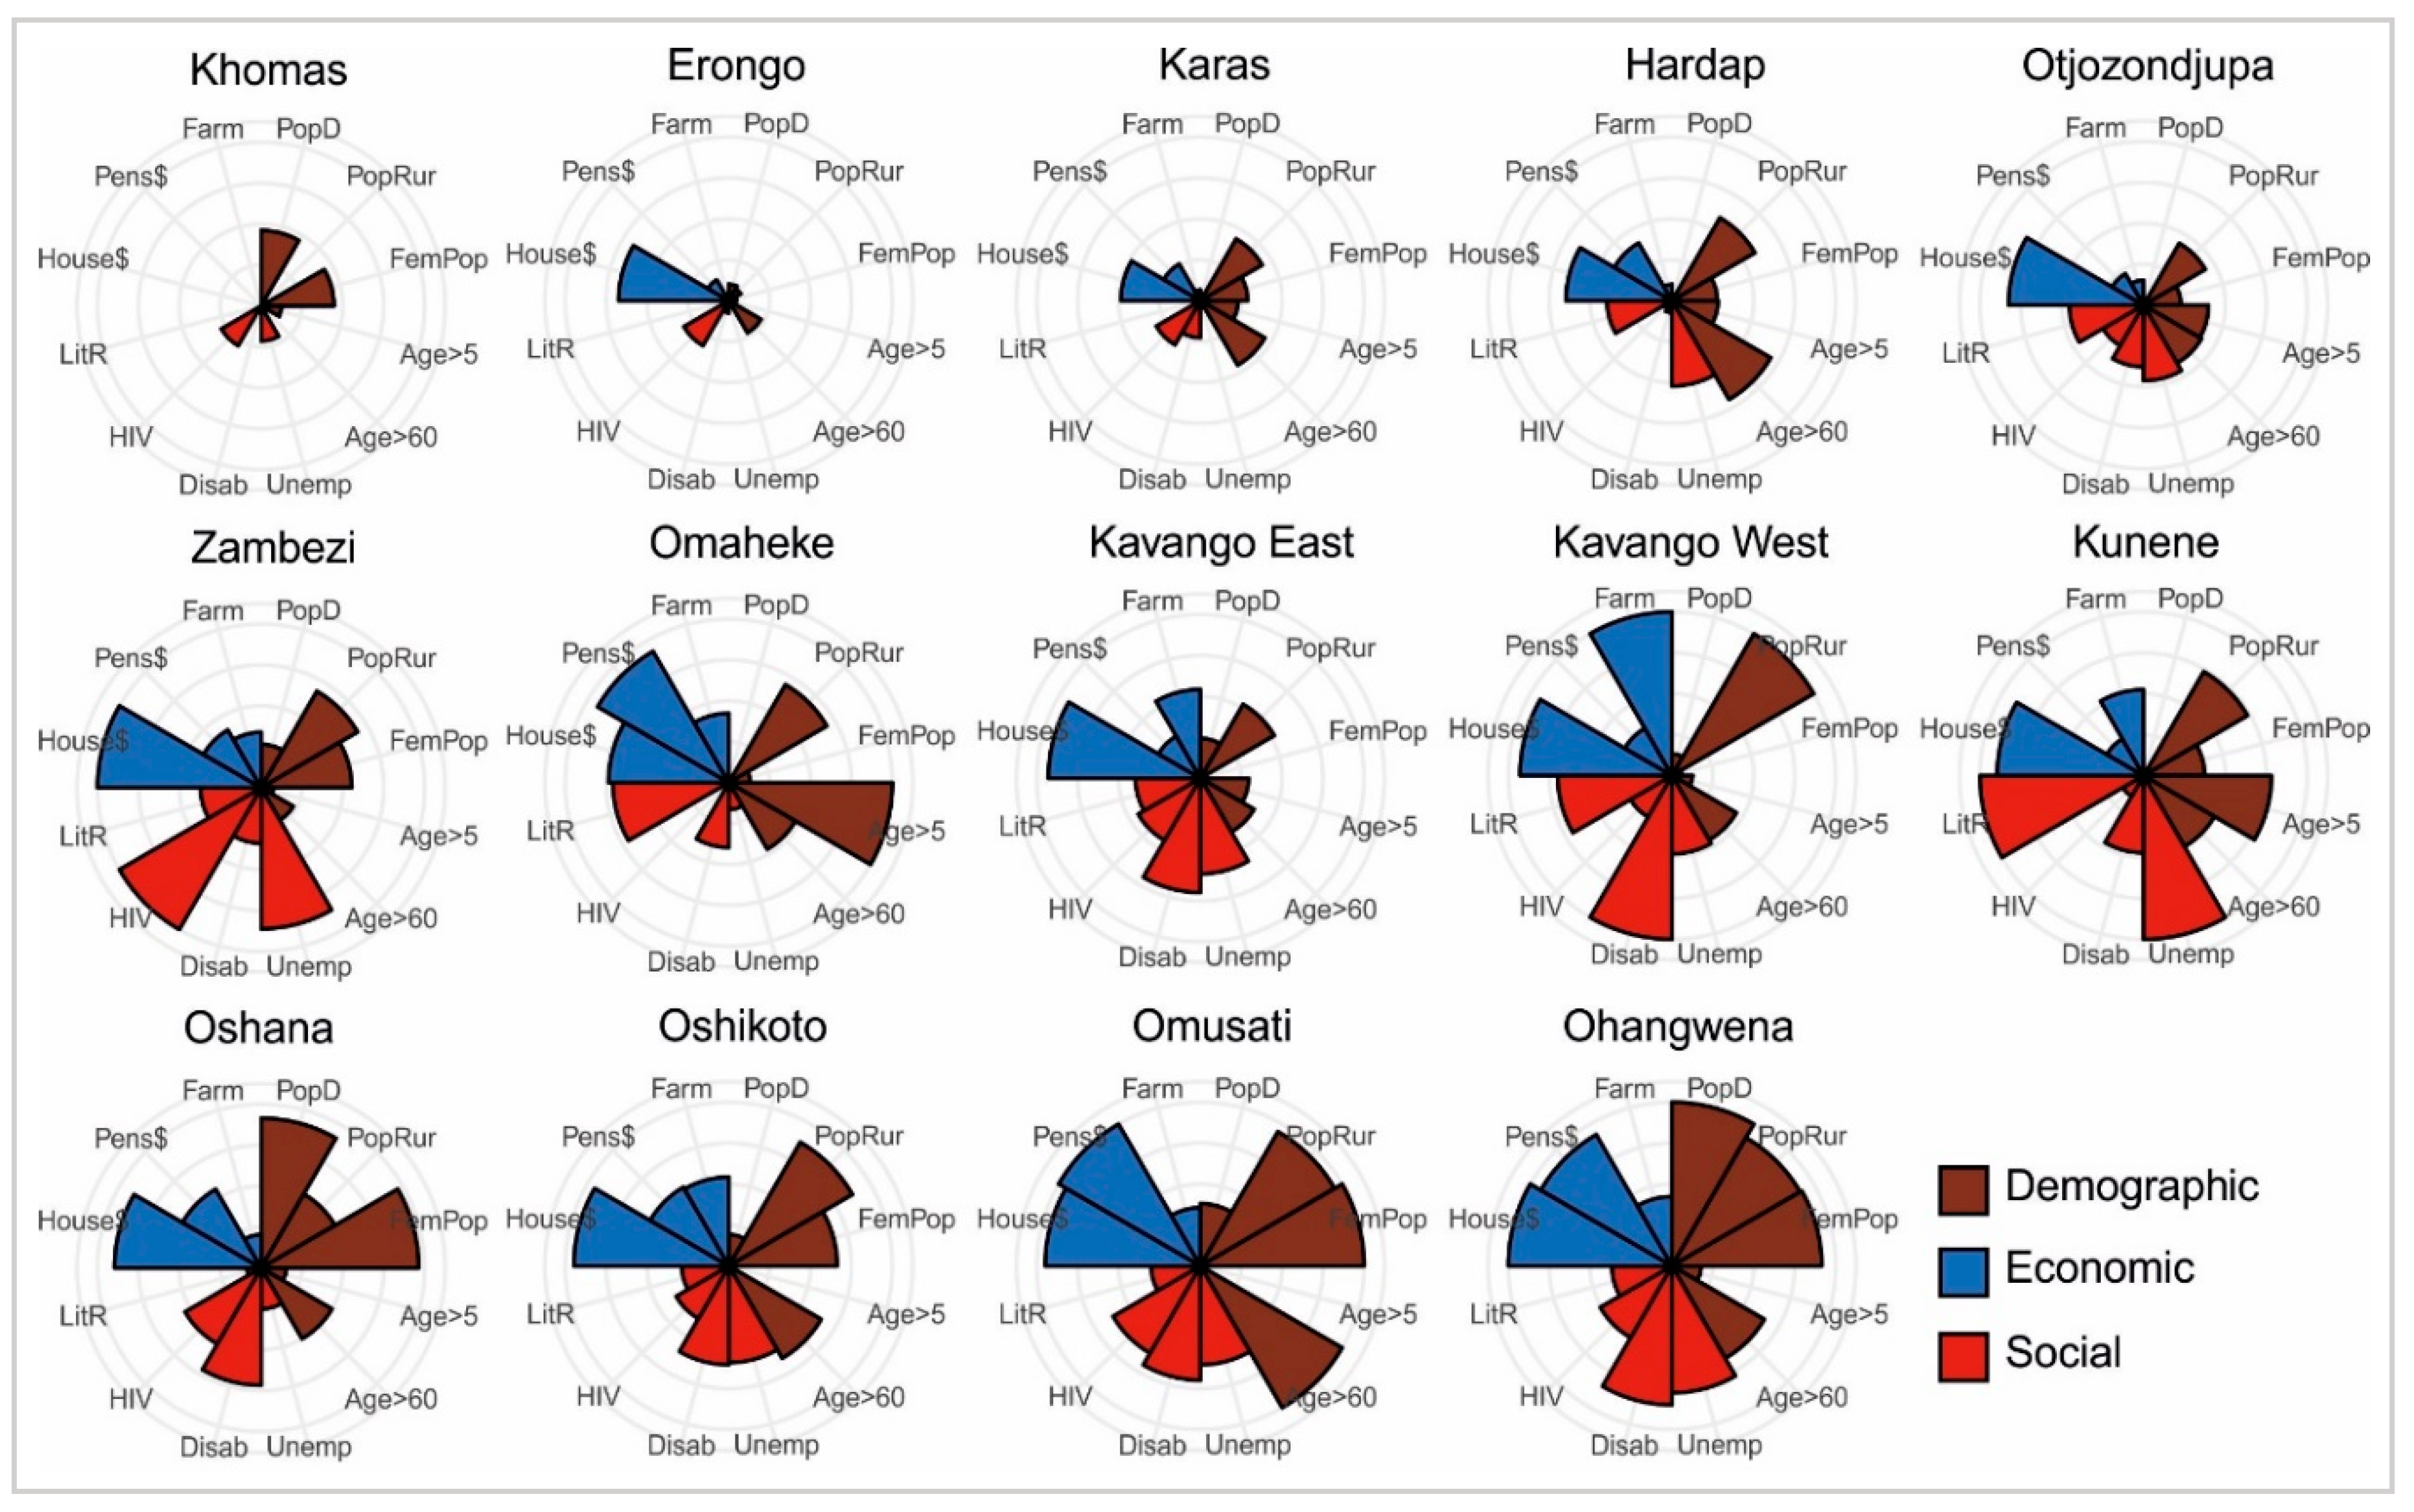
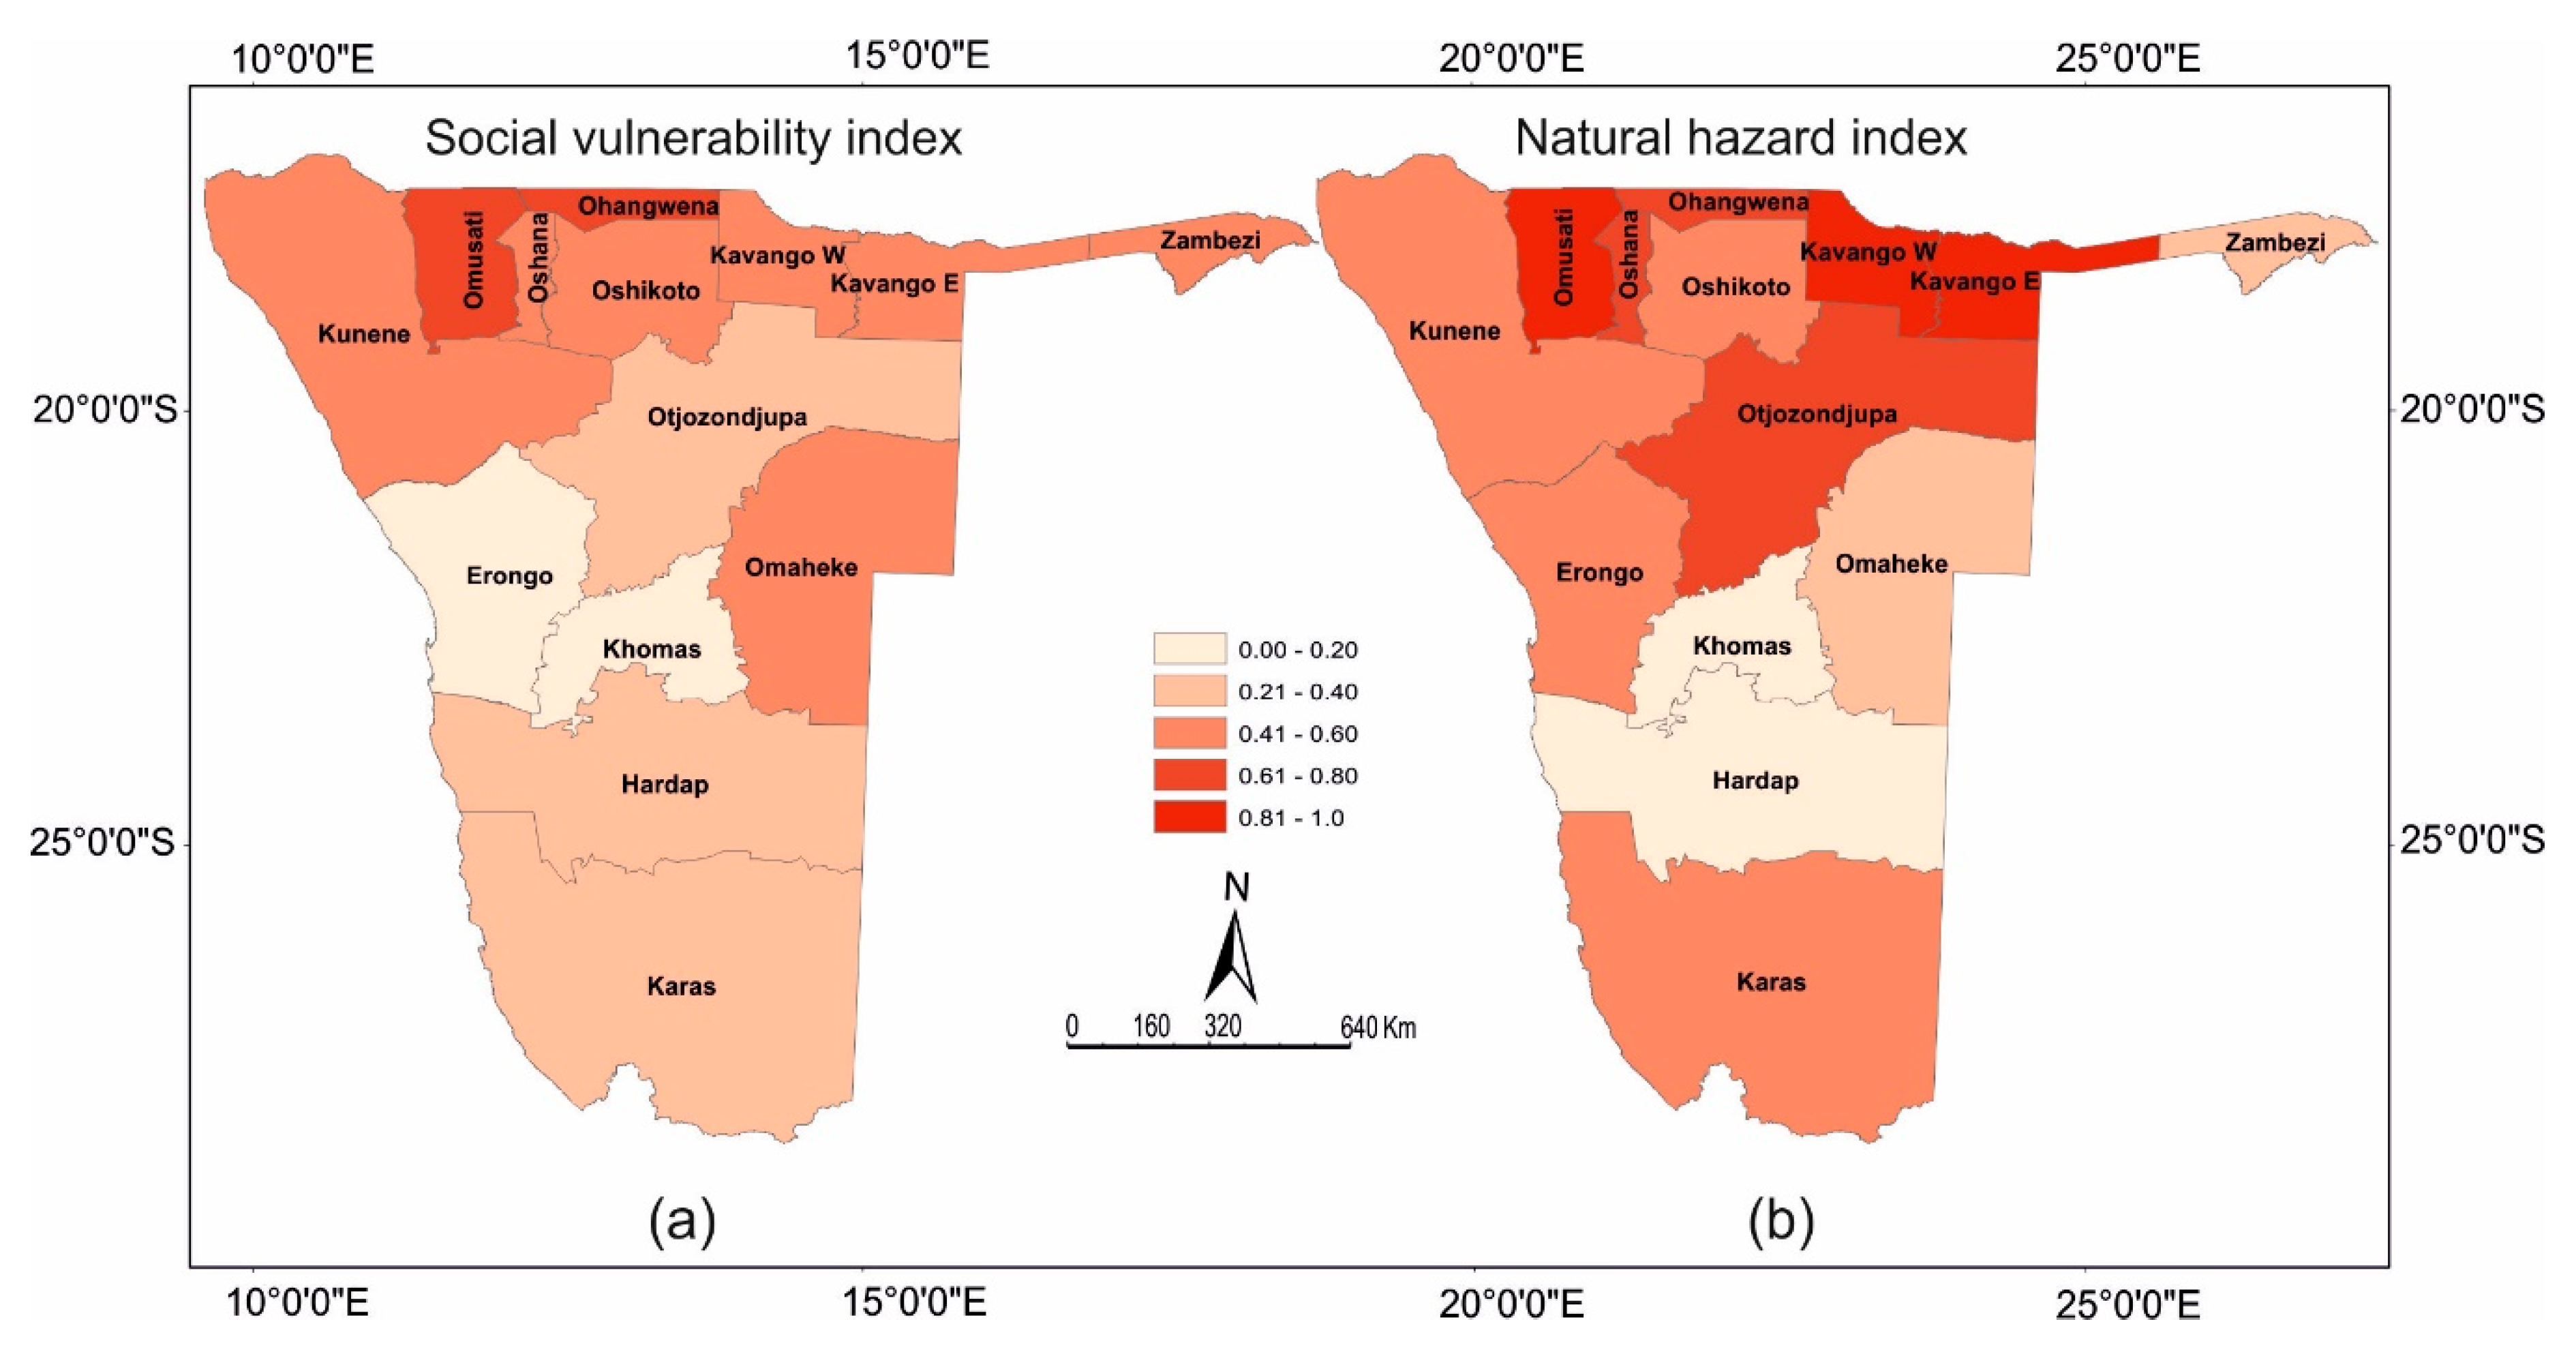
3.1. District-Based Pattern of Social Vulnerability

The SVI reached its highest values in the northern districts of the country, with maximums in the Omusati and Ohangwena districts (Figure 2a). While all categories of indicators (i.e., social, economic and demographic) were nearing their maximum in Ohangwena, the vulnerability of populations in Omusati was mainly driven by economic and demographic factors (Figure 3).
The effect of underlying indicators was variable in a group of districts with medium SVI values (Oshikoto to Zambezi, Figure 3). A common pattern was that a small subset of indicators drove the overall SV rather than being equally affected by a large number of factors. The remaining four districts (Hardap to Khomas, Figure 3) with low SV formed a cluster located in the central and west-central parts of the country. The least vulnerable districts were Khomas and Erongo (Figure 2 and Figure 3). In summary, there was no common pattern of SV pattern applicable for all Namibian districts, and the districts’ vulnerability profiles were highly variable.

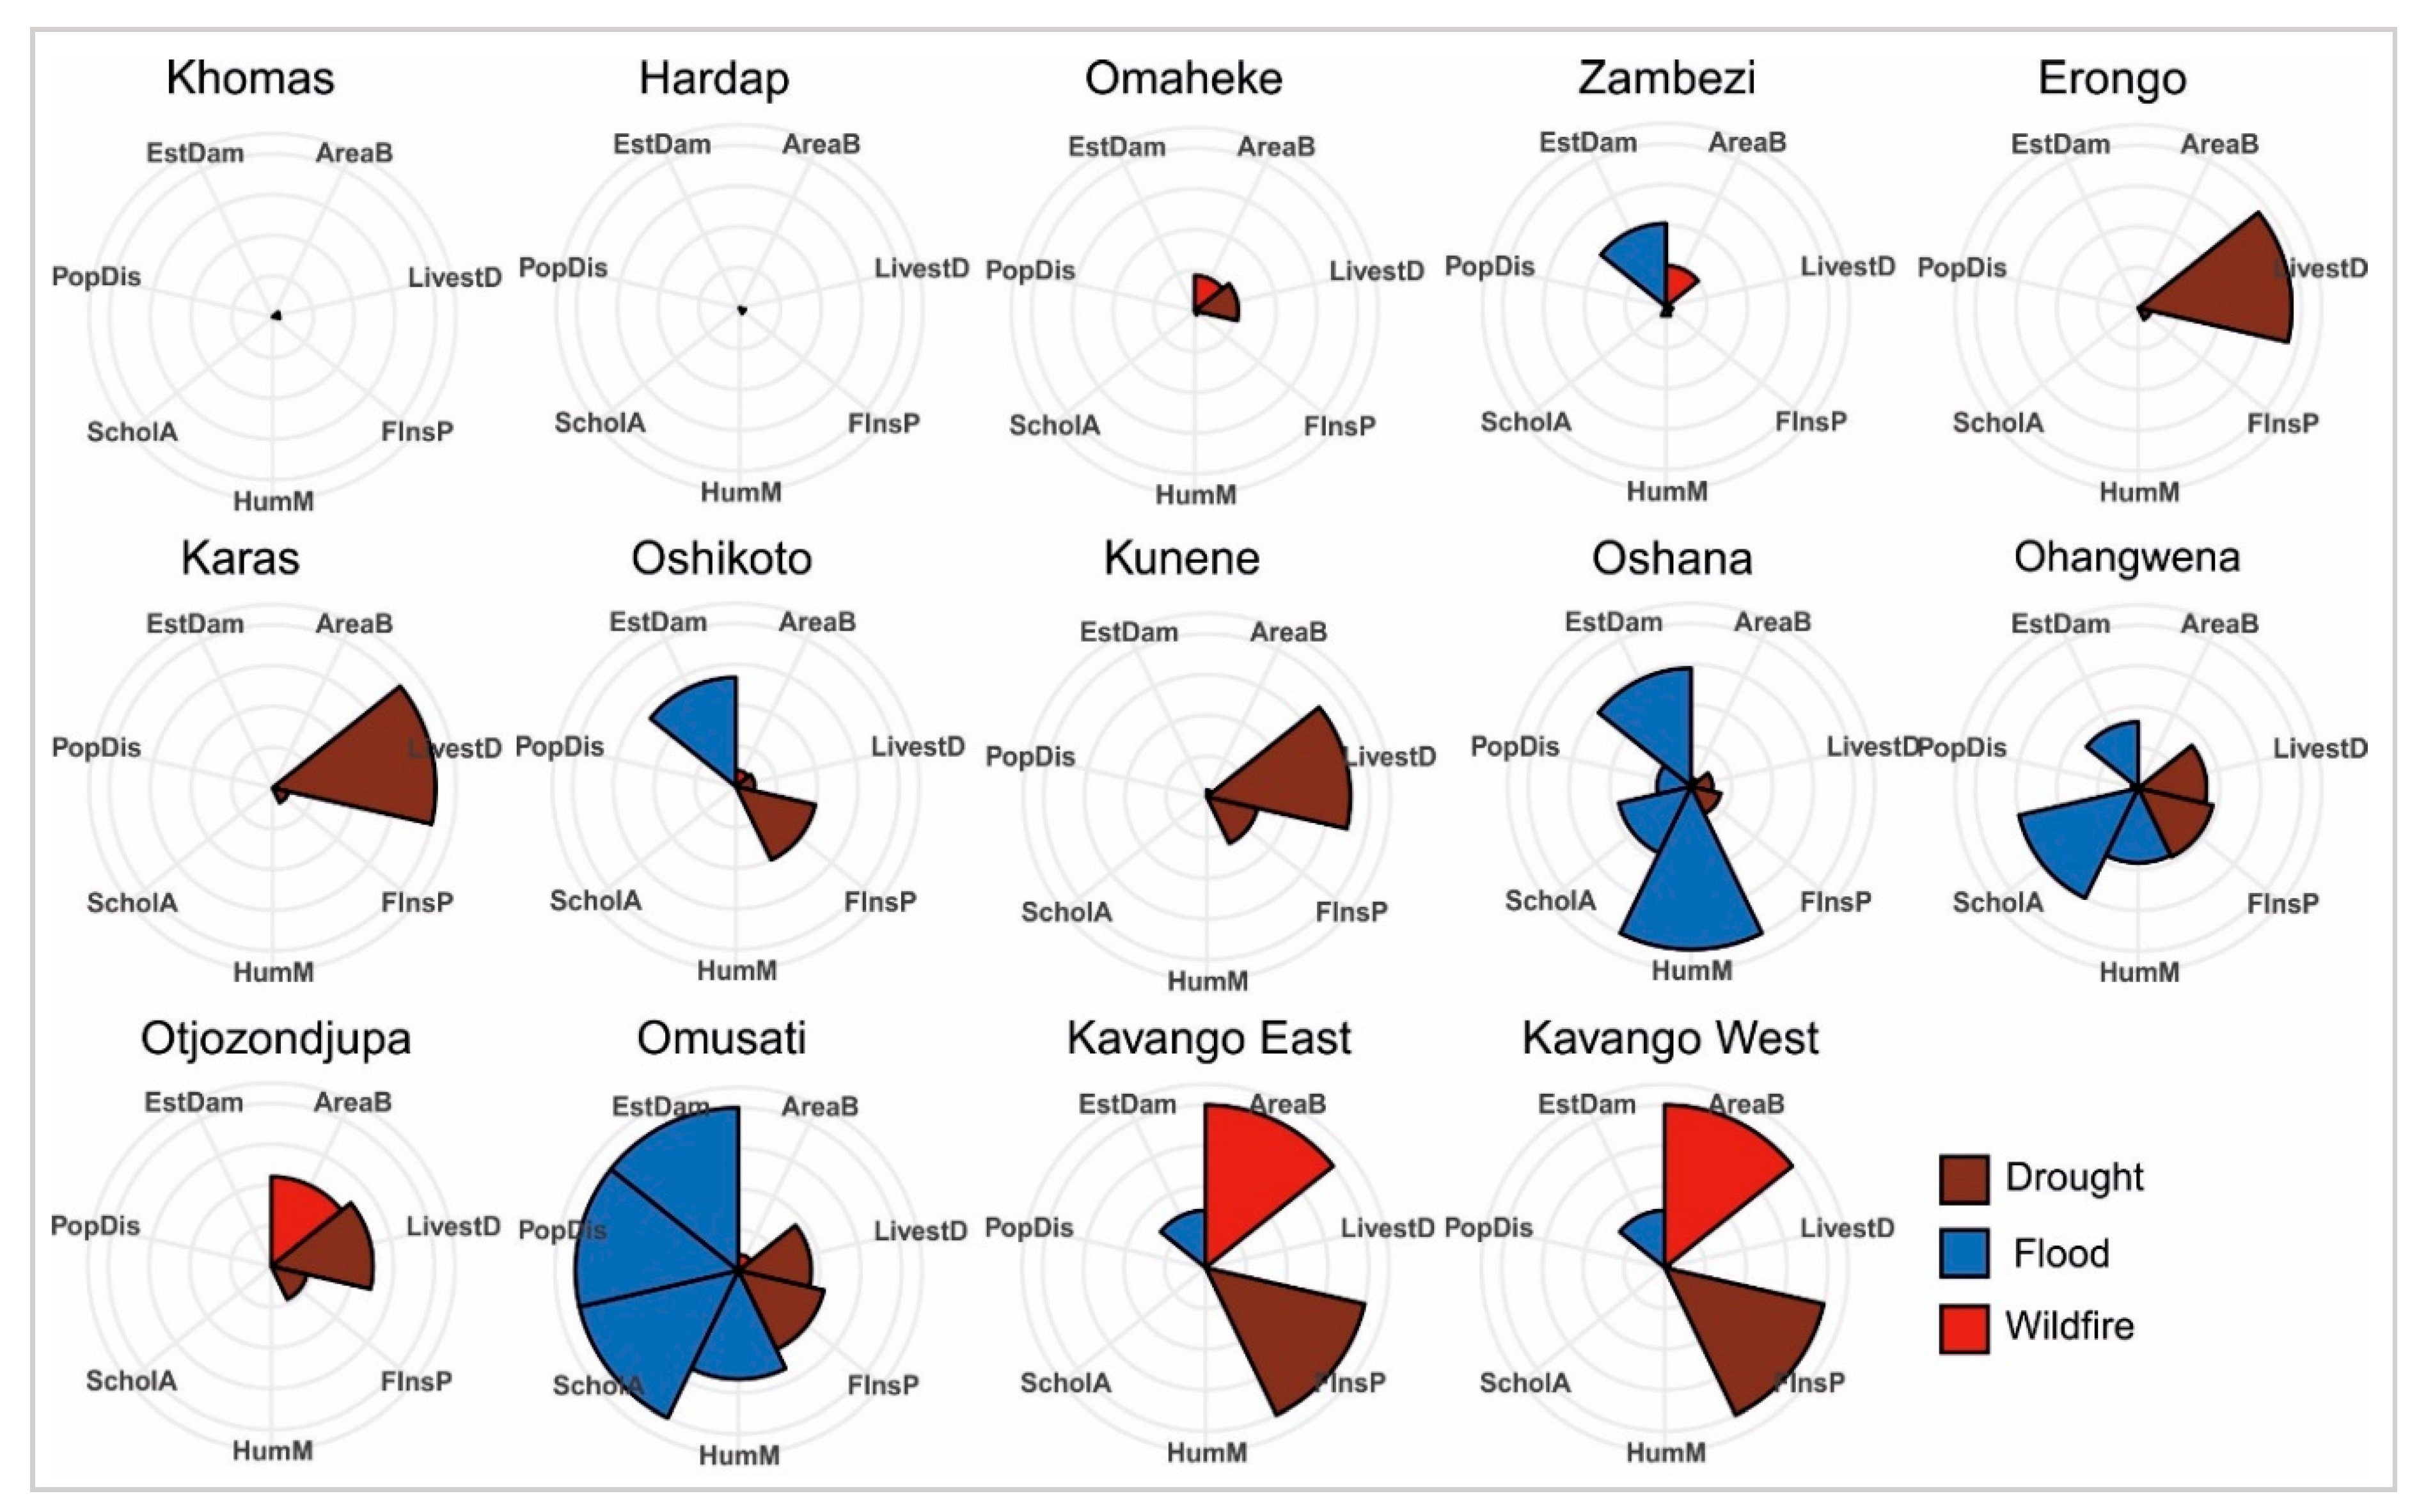
3.2. Exposure to Natural Hazards

The highest exposure to natural hazards was in the northern districts of the country, where multiple hazard indicators culminated (Figure 2b). On the contrary, the lowest level of exposure occurred in the central and southern districts of Khomas and Hardap, where all indicators were zero (Figure 4), i.e., no hazard was recorded here during the period covered by the used data (Table 2). The risk of hazard was typically driven by two out of three main hazard types, with floods and drought being the most frequent combination. The main hazard categories, i.e., drought, fire and floods, showed a differential spatial pattern across the country (Appendix A). While fire incidence was highest in the northern districts (Kavango East and Kavango West), flood risk was mainly pronounced in the north-central and northeastern districts [72]. Drought exposure was highest in the South and Northwest of the country, while central districts Khomas and Hardap exhibited relatively low drought impacts.

3.3. Vulnerability Assessment

The final vulnerability assessment showed a positive relationship between most of the used hazard indicators and the level of SV indicated by the SVI (Figure 5). This applied to all hazard indicators except for drought-induced livestock mortality, where the relationship was negative (Figure 5).
Investigation of the district positions in a space defined by the SVI and the composite hazard indicator showed that the districts formed three distinct categories characterized by different levels of SV and exposure to hazards (Figure 6a). These groups of districts displayed a distinct South–North zonal pattern, with most vulnerable populations being distributed in the North of the country (Figure 6b). These districts covered 10% of the country’s area but included 32% of the total population. Districts with the lowest vulnerability were in the southern part of the country (Erongo, Khomas, Hardap, Karas) and covered 45% of the Namibian territory (Figure 6b). At the same time, they included 33% of the total population. These districts are also the economic, social and political centers, with major cities of the country (see Figure 1). The remaining six districts, which form the medium vulnerability cluster, showed relatively low levels of exposure (0.1–0.25). The only exception was Otjozondjupa, where the level of exposure was 0.32.

4. Discussion

We conducted our investigation in Namibia, a sub-Saharan country where many ecosystems and populations persist at their social and ecological margins [89,90]. These conditions can be further exacerbated by climate change, which may cause the social-ecological resilience limits to be exceeded [91]. We strived to extend our understanding of SV to natural hazards in the country by exploiting a large set of heterogeneous, and often incomplete, information available from public sources. Consistently with national strategic materials, such as the National Disaster Risk Management Plan [56] and the National Disaster Risk Management Policy [76], we found that macro-regions with specific magnitudes of vulnerability exist in the country, which require different treatment and management responses [56,76]. We also highlighted large differences among the districts in their overall vulnerability, as well as in the relative contributions of underlying social factors and hazard types. Most importantly, we found that socially the most vulnerable populations, which cannot take effective emergency and adaptation actions, occurred in high-hazard areas of the country. This fact further underscores the vulnerability of the entire region.

4.1. Population Vulnerability Patterns

We found that although SV and hazard exposure varied between the districts, there were characteristic large-scale patterns that deserve attention in strategic planning. Social vulnerability reached its highest values in the northern districts and culminated in Ohangwena and Omusati. Due to the prominence of these districts, they also received increased attention in previous studies [48,50,92,93,94]. Vulnerability profiles in the northern districts, however, did not show any common pattern, and the overall SV was driven by different combinations of factors. This suggests that one-size-fits-all solutions are not applicable, and tailor-made systems of measures are required for different districts. For example, a high prevalence of the elderly population (10%) is a key contributing factor in Omusati, while high HIV/AIDS levels (24%) drive social vulnerability in Zambezi. High levels of populations with disabilities are typical of the Kavango West and Ohangwena districts, while low household income drives social vulnerability in the entire north-central and northeastern parts of Namibia. On the contrary, the southern districts Khomas, Erongo, Karas and Hardap were found to have, relative to the remaining parts of the country, good capacities to cope with and respond to natural hazards (see also Angula and Menjono [54], Namibia Statistics Agency [70], Angula [95]). This is related to factors such as high employment and literacy rates and lower numbers of young, elderly and disabled persons in the population.
Exposure to natural hazards showed a distinct geographical pattern too. While flood- and fire-prone districts occurred in two non-overlapping clusters in the North, drought risk was high across the entire country. Lower drought risk in the central districts Khomas and Hardap should be interpreted with caution due to the limited temporal coverage of the used data. The most frequent combination of hazards was drought and flood, while the combination of drought and fire occurred in Otjozondjupa, Kavango East and Kavango West only. The latter two districts also showed a minor exposure to floods, which makes them the most hazard-prone districts in the country from the view of both magnitude of the impact and the number of participating hazards. For example, drought here affects both crop and livestock farming and local populations; thus, they frequently experience food insecurity [96]. Although the flood and fire hazard patterns identified herein are relatively robust (Appendix A), limitations related to data availability still need to be considered.
The previous patterns imply that a large part, socially, of the highly vulnerable population (32%) occurred in high-hazard areas of the country, and vice versa. This pattern was mainly driven by flood risk, which showed the tightest positive relationship with the level of social vulnerability. Reasons of such a situation likely stem from the historical attraction of communities to water resources (i.e., migration along rivers in Namibia), which facilitated the agriculture expansion, yet also increased the size of the population and infrastructure exposed to floods [97]. Moreover, the rapid development of cities such as Oshakati in the flood-prone regions triggers immigration, which, along with lacking infrastructure and poor planning, increases the pressure on natural resources and exacerbates population vulnerability [75].
In the case of drought, the relationship with the SVI was tight for the number of food insecure people but not for drought-induced livestock mortality. The reason is that livestock farming is mainly used in Erongo, Karas, and Kunene, which have relatively good socio-economic conditions. Moreover, the high level of livestock mortality needs to be thought of as a legacy of previous years with sufficient rains, which may have caused overstocking. These facts, thus, highlight the need for broader contextual considerations in the assessment of social vulnerability to hazards, which may not have been obvious in our investigation.
The total burned area during the period 2007–2017 was associated with the SVI only loosely. The most exposed districts were Kavango East and West, where the level of social vulnerability was moderate. The frequency of wildfires decreased southward mainly due to the decreasing management intensity and the presence of the desert [85,98]. We note that although the pattern of fire-prone districts was rather robust, the used dataset did not differentiate between the causes and impacts of the fire (i.e., only the burned area was reported). Most of the fires occurred in the fire-driven savanna ecosystem, where they formed a characteristic disturbance regime [84]; however, the social impacts were not sufficiently documented. Still, previous studies indicate substantial effects of fire on human wellbeing (Section 2.2), which justifies the use of this dataset as a proxy of social exposure to fire hazards.
In total, 32% of the total population of Namibia was found to be distributed in four districts belonging to the highest vulnerability class. Although being geographically close, the social and hazard profiles showed substantial differences between these districts. This situation represents a rather complex challenge to adaptation and resilience management, which needs to cope with highly diverse local contexts, high population density, exposure to multiple concurrent hazards and social barriers to implementation [90,99]. For example, some ethnic groups with strong cultural and religious beliefs are often unwilling to take adaptive measures, such as to reduce the livestock herd size during droughts. The reasons are, for example, low market prices and problematic access to the markets but also a fear of losing prestige in the community [93,100]. Such a cultural background further exacerbates the overall vulnerability of this region.
The coincidence of high social vulnerability and exposure to hazards generates a chain of other issues that puts additional pressure on human and infrastructure resources. These include, for example, aggravating conflicts between agriculture development and nature conservation, risks to biodiversity and tourism, food insecurity and exposure to water-borne diseases [101,102]. For example, the most vulnerable districts identified here overlapped with areas harboring exceptional biodiversity values such as the Etosha National Park. On the other hand, the spatially restricted size of these priority areas can be thought of as an opportunity as it may allow for better concentration of resources, which can generate synergies and thus amplify the final effect [50].
The presented patterns of vulnerability were based on data from previous decades, when different social-ecological systems have already experienced effects of changing climate [103,104]. These effects may further increase in the future as the studied systems are sensitive to climate. For example, natural hazard regimes can be intensified under climate change and trigger a chain of social responses [105]. This requires consideration of the presented assessment in the context of transient ecological and social conditions, including limitations related to the static nature of the data used herein.

4.2. Methodological Aspects

Our analysis used a coarse resolution of administrative districts, which was determined by the availability of used data. Although such a scale of assessment can support strategic planning, including targeting of investments from external sources, finer-scale studies addressing the diversity of local contexts are needed for efficient implementation [27,101]. The scale of districts is particularly limiting if inhabitants are unevenly dispersed across their territory, and within-district variation in social and biophysical vulnerability is large. Moreover, districts in Namibia are influenced by the colonial era, where indigenous people were being largely relocated, without respect to their cultural, ethnic and historical background [64]. Use of district-specific data in vulnerability and other studies has, therefore, obvious limitations and findings should be interpreted with caution. However, as census and other data are typically available for districts, this scale will remain important in the future. To obtain a more complex picture of social vulnerability in Namibia, our assessment can be confronted with previous finer-scale studies, such as Hegga et al. [92], aiming at climate change adaptation in the Omusati district, or Angula and Kaundjua [93] aiming at north-central Namibia (Ohangwena, Oshana and Omusati).
We characterized SV using a number of social, economic and demographic indicators, which is a frequent practice in social vulnerability research (e.g., Cutter et al. [7], Chakraborty et al. [106] and Dwyer [107]). There are, however, other aspects of SV not considered here, such as the broader institutional context, quality of governance, law enforcement, dependence on humanitarian donations [96], level of rural development or existing international collaborative networks [108]. Such district-specific data were not available in the current study though these factors obviously determine SV in Namibia. For example, factors such as institutional development, match between the level of regional development and actual needs of the regions, and participation of vulnerable populations in hazard management largely vary between the districts, thus depicting another dimension of SV.
One factor affecting our analyses was temporal mismatch between SV and natural hazard indicators. While social, economic and demographic data were collected in the census in 2016, the natural hazard data came from different sources and covered different periods. While snapshot data should not be limiting in the case of social attributes (see, e.g., Rufat et al. [10]) (although volatile political and market environment may trigger rapid social changes), this may not be the case for natural hazard data, which often characterize episodic events with erratic temporal fluctuations.
We evaluated relative differences in districts’ exposure to natural hazards by combining several hazard indicators (see, e.g., [109,110]).The most robust data were available for wildfires, which covered a 10-year period of time. These data thus differentiated well between fire-prone and the remaining districts in the country. Moreover, the high fire incidence in the northern districts (Appendix A) was also corroborated by previous studies [80,84,85,98]. In the case of flood risk, we mitigated the limited temporal coverage of data by aggregating different flood indicators from different years (2007, 2008 and 2009) and thus obtained a more robust estimate of the overall flood risk. Moreover, flood incidence is generally driven by the hydrological conditions of the country (Section 2.2); this fact, along with numerous previous studies (e.g., [72,74,75,77]), supports the flood risk pattern identified herein (Appendix A). Drought impacts were approximated by livestock mortality (2018–2019) and the food insecure population (2013), which limits the robustness of this dataset. Moreover, interpreting the livestock mortality as an indicator of drought should be taken with caution, as there are also other factors, most prominently diseases [111], that lead to livestock death. Still, the source statistical reports indicated drought as the main reason for livestock mortality in the season 2018–2019, without referring to any disease outbreak, which supports the use of this indicator. Although further extension of the used dataset would be a great asset in assessing the patterns and drivers of natural hazards, dealing with low-resolution or incomplete data will remain one of the important challenges in research and management planning in many parts of Africa (e.g., Hosegood & Madhavan [112]).
Finally, recent research has increasingly emphasized the importance of resilience as a prerequisite for sustainable development [113]. Resilience goes beyond the vulnerability framework and considers the complex abilities of populations to reduce the severity of impacts and recover rapidly from losses [114]. Further research can use the data and approaches presented here to address the resilience of the Namibian population and, thus, provide more comprehensive support in decision and policy making.

5. Conclusions

Understanding the interactions between the social conditions of human populations and the dynamics of natural hazards is one of the key preconditions for sustainable development. This particularly applies for populations living at their social margins, which can be driven to collapse by minor fluctuations in resource availability. We showed that the pattern of natural hazards was highly variable among the districts of Namibia, as were the factors determining the social and economic fitness of the population. Adaptation strategies, therefore, need to consider the diversity of regional contexts, which is high even between adjacent districts with similar natural and cultural conditions. We found that macro-regions exist in the country, where multiple adverse effects coincided, including critically low socio-economic performance, high population density and the concurrent incidence of different hazard types. The increasing risk of natural disasters, which is often mediated by climate change, implies that tipping points can be exceeded in such environments and social and ecological harm can be beyond repair. Our findings can inform national and regional policies on how to develop better targeted management actions that recognize the diversity of the social and hazard-related conditions described herein.

Supplementary Materials

The following are available online at https://www.mdpi.com/2071-1050/12/12/4910/s1, Table S1: Description of candidate indicators of social vulnerability, Table S2: Description of candidate indicators of natural hazards.

Author Contributions

Conceptualization, T.H.; data curation, A.K.; formal analysis, A.K. and T.H.; investigation, A.K. and T.H.; methodology, T.H.; supervision, T.H.; writing—original draft, A.K.; writing—review & editing, T.H. All authors have read and agreed to the published version of the manuscript.

Funding

This research was funded by the OPRDE grant number “EVA4.0”, No. CZ.02.1.01/0.0/0.0/16_019/0000803X.

Acknowledgments

We are thankful to Martin Mokroš and Jiří Trombik for their kind help with the operation of R language and GIS software.

Conflicts of Interest

The authors declare no conflict of interest.

Appendix A. District-Based Patterns of Main Hazard Types

Figure A1. District-based pattern of the main hazard types in Namibia based on hazard indicators listed in Table 2. Average standardized indicator values for each hazard category are shown.
Sustainability 12 04910 g0a1
The collected hazard indicators characterize the most prominent natural hazards in Namibia. The patterns in Figure A1 are based on several often heterogenous indicators with limited temporal coverage. Because these patterns are vital to the vulnerability assessment presented in this study, we provide here an additional justification of the relevance of these patterns.
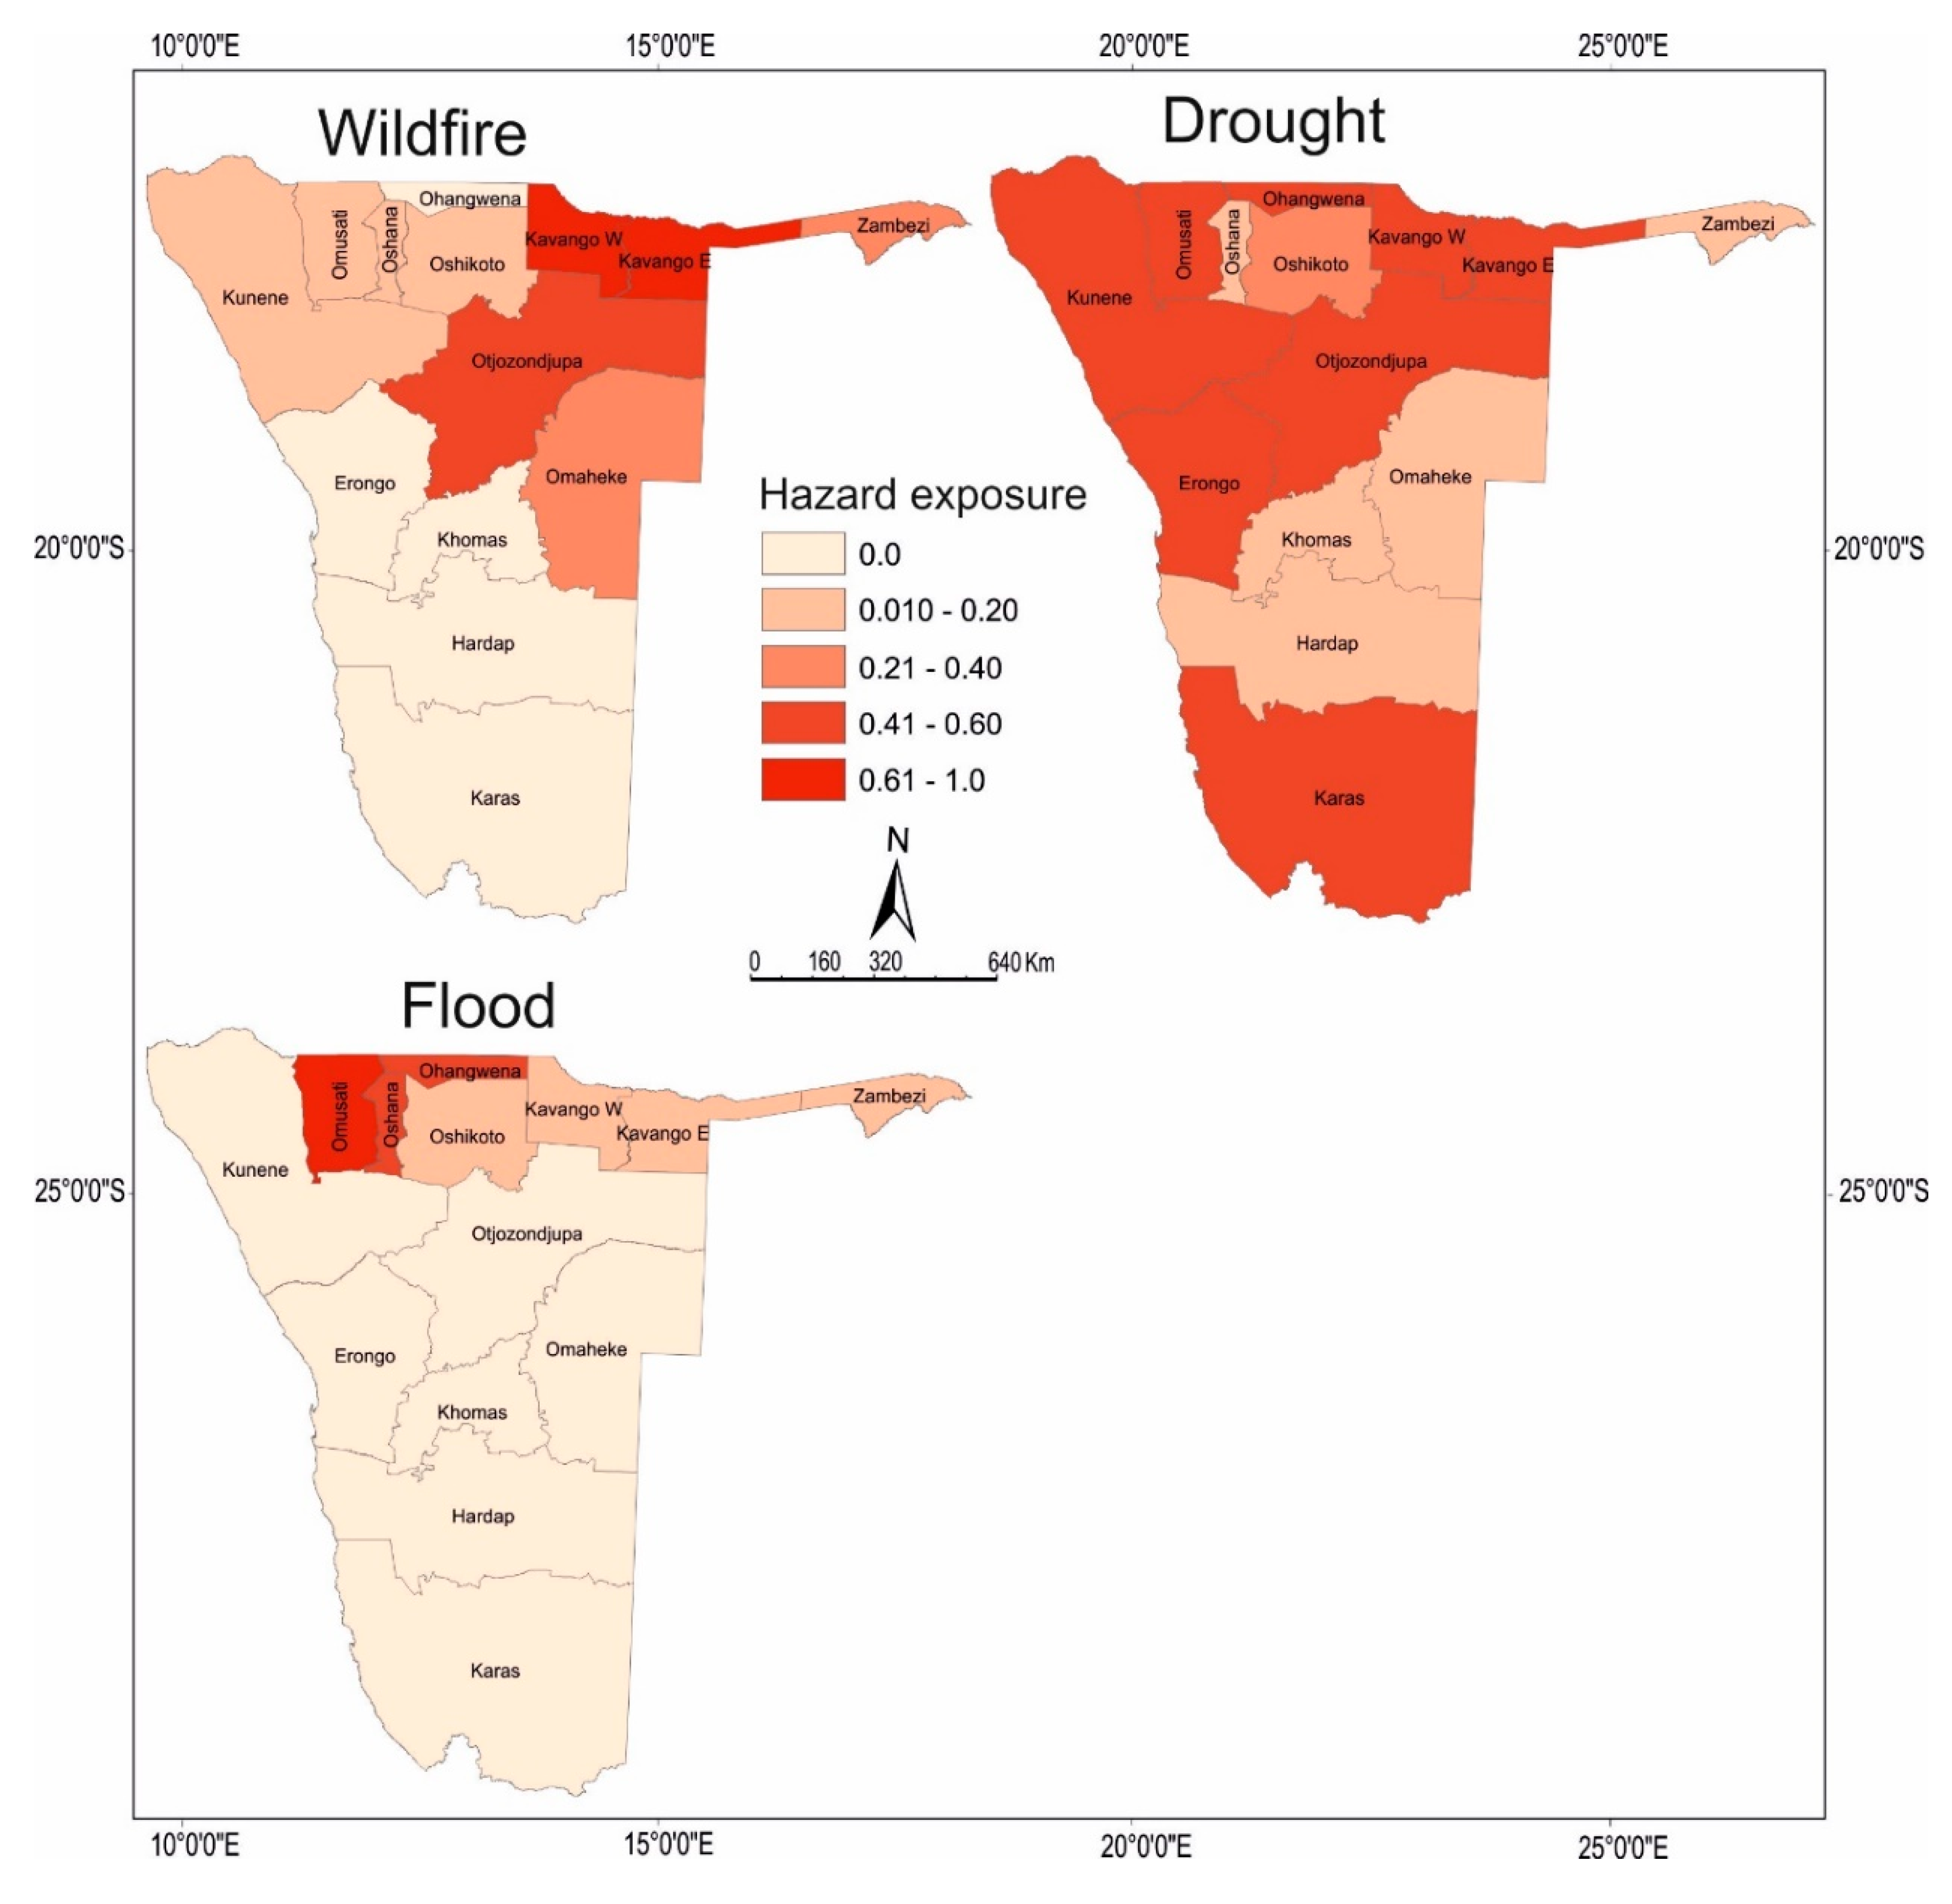
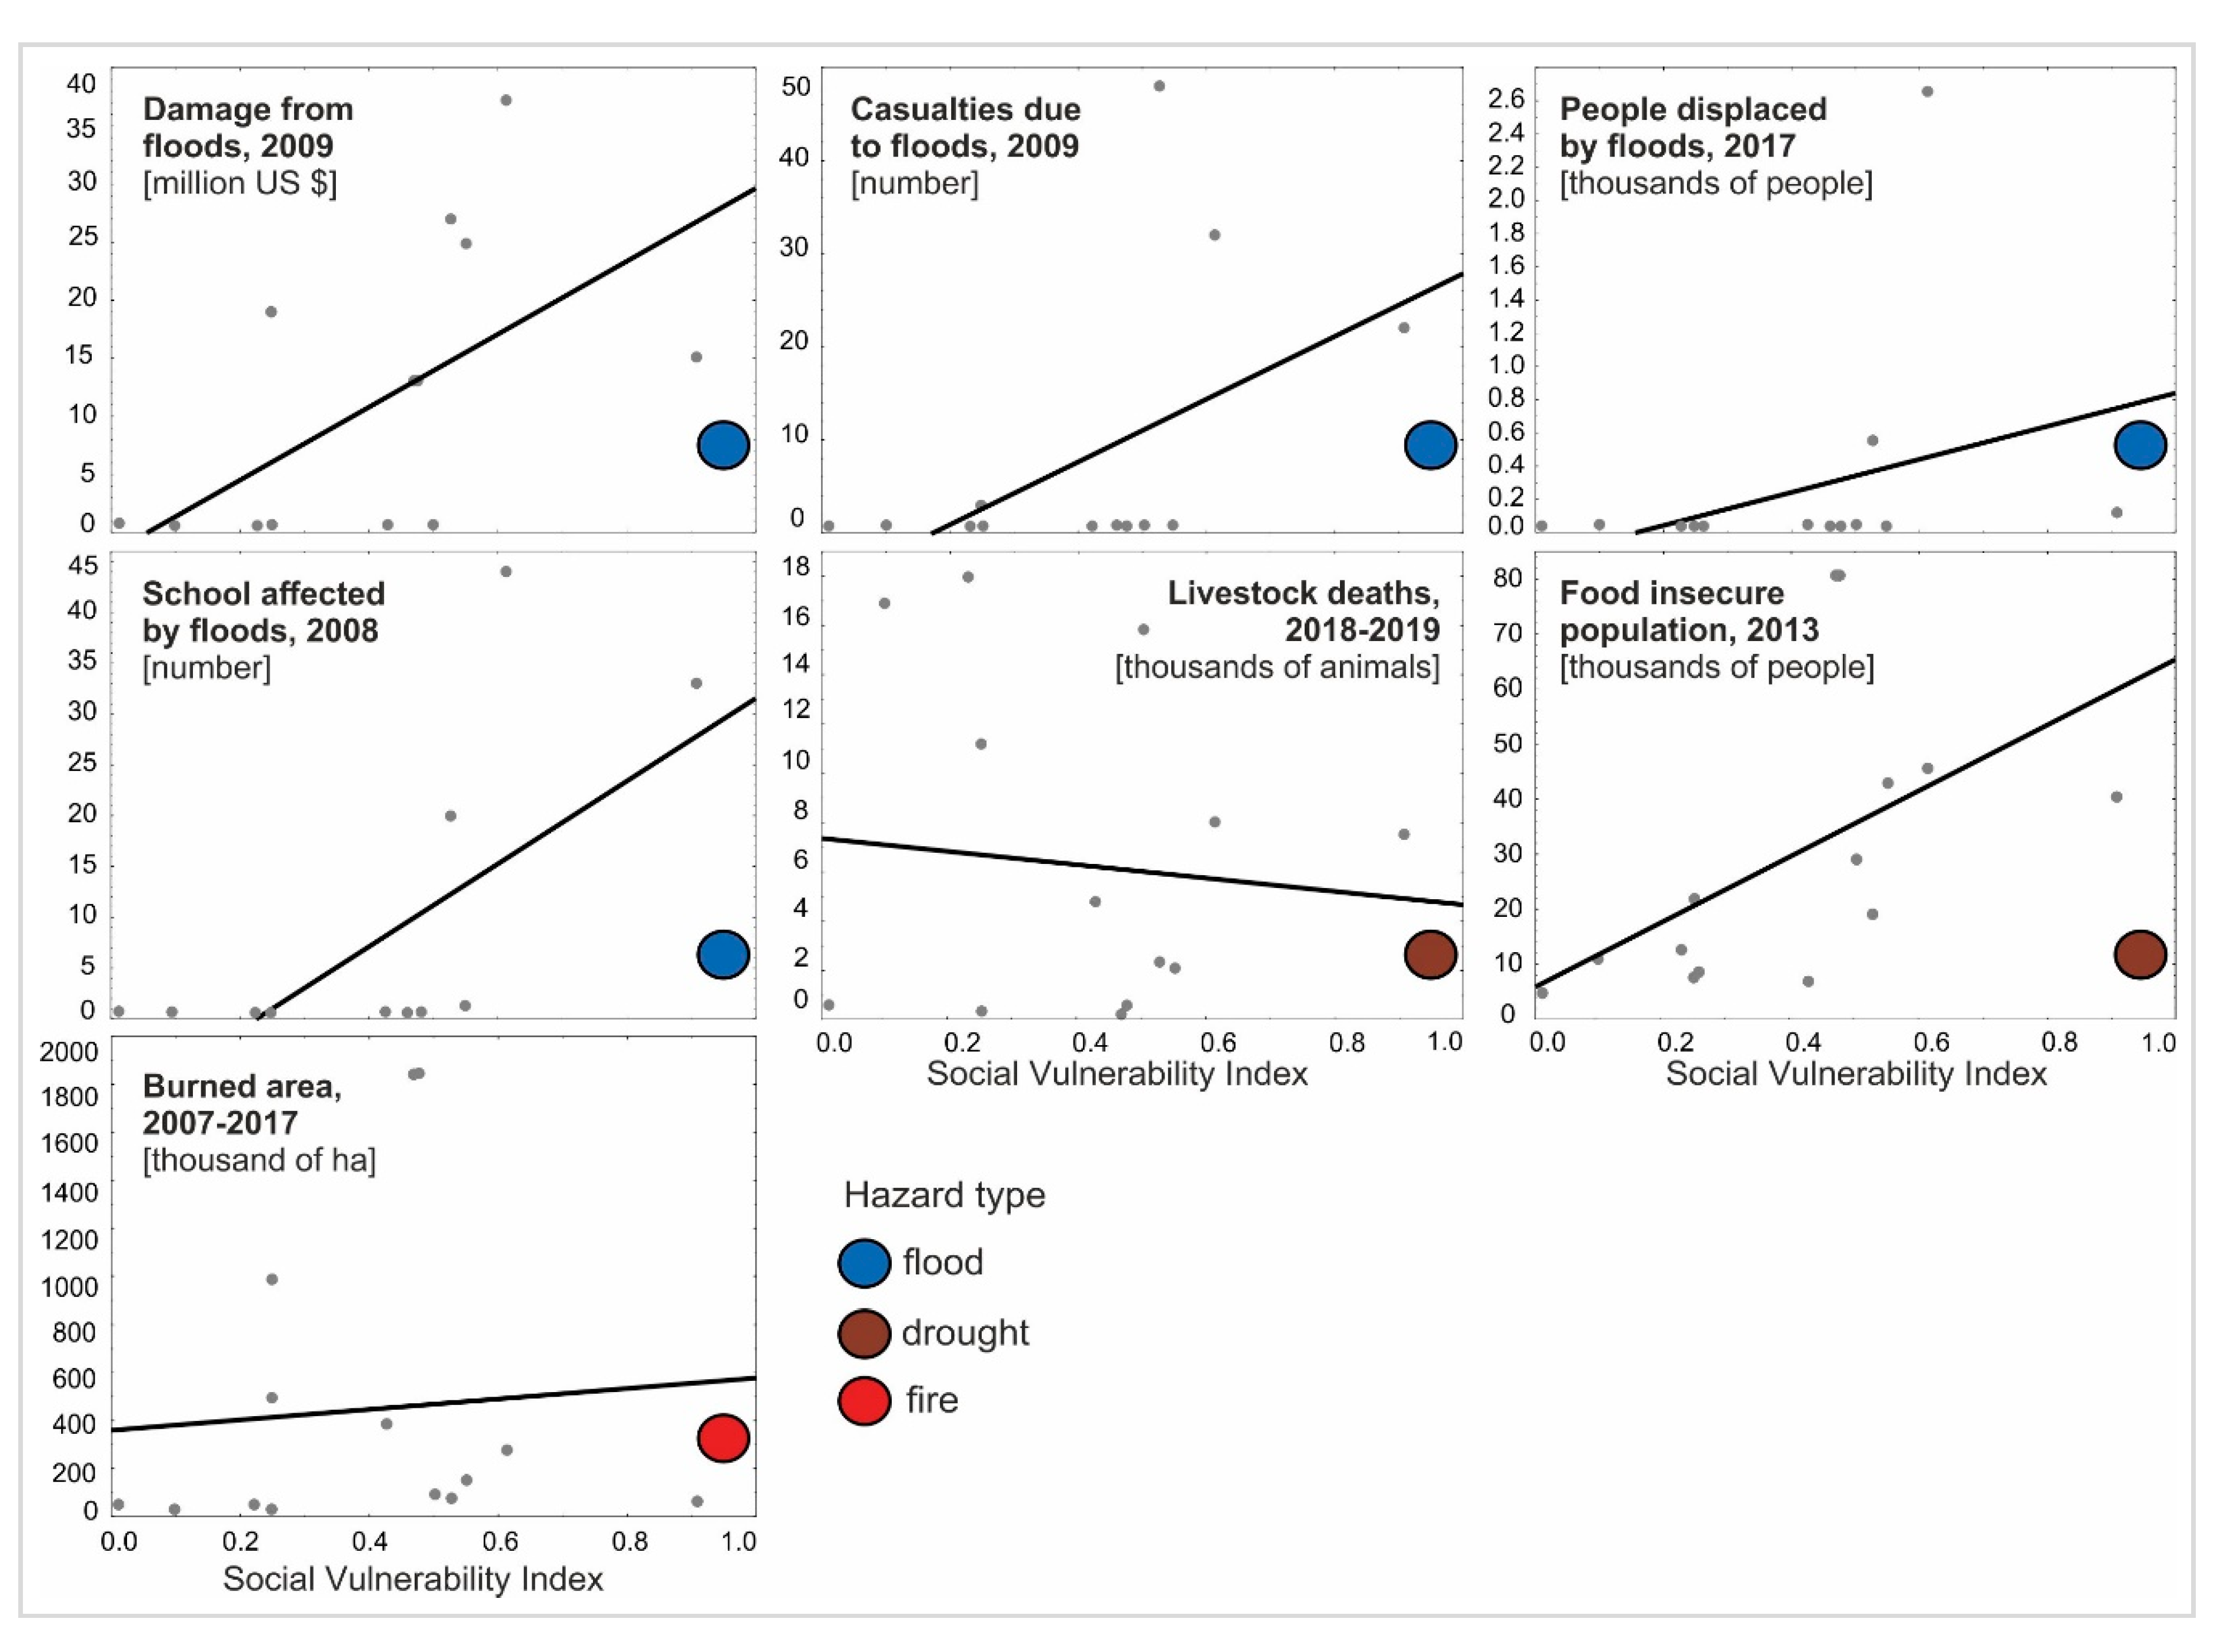
  • Wildfire: Wildfire data are derived from the regular monitoring conducted by the Remote Sensing Department of the Ministry of Agriculture, Water and Forestry of Namibia, based on satellite imagery. This assessment is rather robust as it based on 10 years of observations. Identical patterns of fires were also identified in previous studies, particularly Sheuyange et al. [84] for the northeastern districts, Pricope et al. [53] and Siljander [80] for the Zambezi district, and Verlinden et al. [85] for the northern districts.
  • Floods: Flood impact patterns were based on different indicators from flood seasons 2008, 2009 and 2017. The most flood-prone districts are Oshikoto, Oshana, Omusati and Ohangwena, which belong to the Cuvelai Basin floodplains. High flood incidence was documented here also by [68,73,77]. The remaining districts Kavango East, Kavango West and Zambezi, which belong to the Kavango and Zambezi river basins, showed high levels of risk too, though lower than the previous region [74]. The current dataset does not indicate any flood impact in the remaining districts, although authors in [115] indicate infrequent floods, for example, in the Kuiseb catchment in the Namib Desert. In summary, the flood pattern identified based on the used indicators is highly consistent with previous studies.
  • Drought: Drought impacts were characterized based on the records from two drought seasons, 2013 and 2018–2019. These data indicate that the entire country was affected to a certain degree, though differences between districts existed. A lower level of drought impacts was observed in the central districts Khomas, Hardap and Omahake with relatively good social-economic conditions. The lower impact of drought here was therefore likely related to the higher adaptive capacity of the population relative to the remaining districts. With regard to the underlying data, drought patterns are the least robust and need to be interpreted with caution. Given the large-scale drivers of drought, which often affects multiple countries in southern Africa [116,117], all districts in Namibia need to be thought of as highly drought-exposed.

References

  1. Balica, S.F.; Douben, N.; Wright, N.G. Flood vulnerability indices at varying spatial scales. Water Sci. Technol. 2009, 60, 2571–2580. [Google Scholar] [CrossRef]
  2. Chang, S.E.; Mcdaniels, T.L.; Mikawoz, J.; Peterson, K. Infrastructure failure interdependencies in extreme events: Power outage consequences in the 1998. Nat. Hazards (Dordr.) 2006, 41, 337–358. [Google Scholar] [CrossRef]
  3. Botzen, W.J.W.; Deschenes, O.; Sanders, M. The economic impacts of natural disasters: A review of models and empirical studies. Rev. Environ. Econ. Policy 2019, 13, 167–188. [Google Scholar] [CrossRef] [Green Version]
  4. Yuan, X.C.; Sun, X. Climate change impacts on socioeconomic damages from weather–related events in China. Nat. Hazards (Dordr.) 2019, 99, 1197–1213. [Google Scholar] [CrossRef]
  5. Zhang, M.; Xiang, W.; Chen, M.; Mao, Z. Measuring social vulnerability to flood disasters in China. Sustainability 2018, 10, 2676. [Google Scholar] [CrossRef] [Green Version]
  6. Sebesvari, Z.; Renaud, F.G.; Haas, S.; Tessler, Z.; Hagenlocher, M.; Kloos, J.; Szabo, S.; Tejedor, A.; Kuenzer, C. A review of vulnerability indicators for deltaic social–Ecological systems. Sustain. Sci. 2016, 11, 575–590. [Google Scholar] [CrossRef]
  7. Cutter, S.L.; Mitchell, J.T.; Scott, M.S. Revealing the vulnerability of people and places: A case study of Georgetown. Ann. Assoc. Am. Geogr. 2000, 90, 713–737. [Google Scholar] [CrossRef]
  8. Ahmad, T.; Pandey, A.C.; Kumar, A. Flood hazard vulnerability assessment in Kashmir Valley, India using geospatial approach. Phys. Chem. Earth 2018, 105, 59–71. [Google Scholar] [CrossRef]
  9. Cutter, S.L.; Finch, C. Temporal and Spatial Changes in Social Vulnerability to Natural Hazards. Proc. Natl. Acad. Sci. USA 2018, 105, 2301–2306. [Google Scholar] [CrossRef] [Green Version]
  10. Rufat, S.; Tate, E.; Burton, C.G.; Maroof, A.S. Social vulnerability to floods: Review of case studies and implications for measurement. Int. J. Disaster Risk Reduct. 2015, 14, 470–486. [Google Scholar] [CrossRef] [Green Version]
  11. Ahmadalipour, A.; Moradkhani, H. Multi-Dimensional assessment of drought vulnerability in Africa: 1960–2100. Sci. Total Environ. 2018, 644, 520–535. [Google Scholar] [CrossRef] [PubMed]
  12. Scholze, M.; Knorr, W.; Arnell, N.W.; Prentice, I.C. A climate-change risk analysis for world ecosystems. Proc. Natl. Acad. Sci. USA 2006, 103, 13116–13120. [Google Scholar] [CrossRef] [Green Version]
  13. Gaillard, J.C.; Cadag, J.R.D.; Rampengan, M.M.F. People’s capacities in facing hazards and disasters: An overview. Nat. Hazards (Dordr.) 2018, 95, 863–876. [Google Scholar] [CrossRef]
  14. Clar, C. How demographic developments determine the management of hydrometeorological hazard risks in rural communities: The linkages between demographic and natural hazards research. Wires Water 2019, 1–20. [Google Scholar] [CrossRef] [Green Version]
  15. Cutter, S.L.; Boruff, B.J.; Shirley, W.L. Social Vulnerability to Environmental Hazards. Soc. Sci. Q. 2003, 84, 242–261. [Google Scholar] [CrossRef]
  16. Mayhorn, C.B. Cognitive aging and the processing of hazard information and disaster warnings. Nat. Hazards Rev. 2005, 6, 165–170. [Google Scholar] [CrossRef]
  17. Seplaki, C.L.; Goldman, N.; Weinstein, M.; Lin, Y. Before and after the 1999 Chi-Chi earthquake: Traumatic events and depressive symptoms in an older population. Soc. Sci. Med. 2006, 62, 3121–3132. [Google Scholar] [CrossRef] [Green Version]
  18. Cutter, S.L.; Barnes, L.; Berry, M.; Burton, C.; Evans, E.; Tate, E.; Webb, J. A Place-Based model for understanding community resilience to natural disasters. Glob. Environ. Chang. 2008, 18, 598–606. [Google Scholar] [CrossRef]
  19. Wahid, Y.; Hossain, M.B.; Hasan, M.U. Social vulnerability in the coastal region of Bangladesh: An investigation of social vulnerability index and scalar change effects. Int. J. Disaster Risk Reduct. 2019, 41, 1–14. [Google Scholar] [CrossRef]
  20. Wang, Z.; Lam, N.S.N.; Obradovich, N.; Ye, X. Are vulnerable communities digitally left behind in social responses to natural disasters? An evidence from Hurricane Sandy with Twitter data. Appl. Geogr. 2019, 108, 1–8. [Google Scholar] [CrossRef]
  21. Birkmann, J. Measuring vulnerability to promote disaster-resilient societies: Conceptual frameworks and definitions. In Measuring Vulnerability to Natural Hazards: Towards Disaster Resilient Societies, 2nd ed.; Birkmann, J., Ed.; UNU-Press: Tokyo, Japan, 2006; pp. 7–54. [Google Scholar]
  22. Kantamaneni, K. Evaluation of social vulnerability to natural hazards: A case of Barton on Sea, England. Arab. J. Geosci. 2019, 12, 628. [Google Scholar] [CrossRef]
  23. Pachauri., R.K.; Allen, M.R.; Barros, V.R. Climate Change 2014: Synthesis Report. Contribution of Working Groups I, II and III to the Fifth Assessment Report of the Intergovernmental Panel on Climate Change; ISBN 9789291691432. IPCC: Geneva, Switzerland, 2014. [Google Scholar]
  24. Török, I. Qualitative assessment of social vulnerability to flood hazards in Romania. Sustainability 2018, 10, 3780. [Google Scholar] [CrossRef] [Green Version]
  25. Rygel, L.; O’Sullivan, D.; Yarnal, B. A Method for constructing a social vulnerability index: An application to hurricane storm surges in a developed country. Mitig. Adapt. Strat. Glob. Chang. 2006, 11, 741–764. [Google Scholar] [CrossRef]
  26. Otto, I.M.; Reckien, D.; Reyer, C.P.O.; Marcus, R.; Le Masson, V.; Jones, L.; Norton, A.; Serdeczny, O. Social vulnerability to climate change: A review of concepts and evidence. Reg. Environ. Chang. 2017, 17, 1651–1662. [Google Scholar] [CrossRef]
  27. Malone, E.L.; Engle, N.L. Evaluating regional vulnerability to climate change: Purposes and methods. Wires Clim. Chang. 2011, 2, 462–474. [Google Scholar] [CrossRef]
  28. Stanickova, M.; Melecký, L. Understanding of resilience in the context of regional development using composite index approach: The case of European Union NUTS-2 regions. Reg. Stud. Reg. Sci. 2018, 5, 231–254. [Google Scholar] [CrossRef] [Green Version]
  29. Brooks, N.; Adger, W.N.; Kelly, P.M. The determinants of vulnerability and adaptive capacity at the national level and the implications for adaptation. Glob. Environ. Chang. 2005, 151–163. [Google Scholar] [CrossRef]
  30. Adger, W.N.; Brooks, N.; Bentham, G.; Agnew, M. New indicators of vulnerability and adaptive capacity. Final Project Report. Tyndal Cent. Clim. Chang. 2004. [Google Scholar]
  31. Fekete, A. Validation of a Social Vulnerability Index in Context to River-floods in Validation of a social vulnerability index in context to River-Floods in Germany. Nat. Hazards Earth Syst. Sci. 2009, 9, 393–403. [Google Scholar] [CrossRef] [Green Version]
  32. Fatemi, F.; Ardalan, A.; Aguirre, B.; Mansouri, N.; Mohammadfam, I. Social vulnerability indicators in disasters: Findings from a systematic review. Int. J. Disaster Risk Reduct. 2017, 22, 219–227. [Google Scholar] [CrossRef]
  33. Kodavalla, V.; Meshram, I.I.; Gottimukkula, M.; Kodavanti, M.R.; Kakani, S.; Avula, L. Development of composite index and ranking the districts using nutrition survey data in Madhya Pradesh, India. Indian J. Community Health 2015, 27, 204–210. [Google Scholar]
  34. Krishnan, V. Constructing an Area-Based Socioeconomic Index: A Principal Components Analysis Approach. Early Child Development Mapping Project Alberta, Edmonton, Canada. 2010. Available online: https://www.ualberta.ca/-/media/ualberta/faculties-and-programs/centres-institutes/community-university-partnership/research/ecmap-reports/seicupwebsite10april13-1.pdf (accessed on 27 January 2020).
  35. Krishnan, V. Development of a multidimensional living conditions index (LCI). Soc. Indic. Res. 2015, 120, 455–481. [Google Scholar] [CrossRef]
  36. De Silva, M.M.G.T.; Kawasaki, A. Socioeconomic vulnerability to disaster risk: A case study of flood and drought impact in a rural Sri Lankan community. Ecol. Econ. 2018, 152, 131–140. [Google Scholar] [CrossRef]
  37. Mertz, O.; Halsnæs, K.; Olesen, J.E.; Rasmussen, K. Adaptation to climate change in developing countries. Environ. Manag. 2009, 43, 743–752. [Google Scholar] [CrossRef] [PubMed] [Green Version]
  38. Herslund, L.B.; Jalayer, F.; Jean-Baptiste, N.; Jørgensen, G.; Kabisch, S.; Kombe, W.; Lindley, S.; Nyed, P.K.; Pauleit, S.; Printz, A.; et al. A Multi-Dimensional assessment of urban vulnerability to climate change in Sub-Saharan Africa. Nat. Hazards (Dordr.) 2016, 82, 149–172. [Google Scholar] [CrossRef]
  39. Luetkemeier, R.; Stein, L.; Drees, L.; Liehr, S. Blended drought index: Integrated drought hazard assessment in the Cuvelai-Basin. Climate 2017, 5, 51. [Google Scholar] [CrossRef] [Green Version]
  40. Davis-Reddy, C.L.; Vincent, K. Climate Risk and Vulnerability: A Handbook for Southern Africa, 2nd ed.; ISBN 9780620765220. Council for Scientific and Industrial Research: Pretoria, South Africa, 2017. [Google Scholar]
  41. Dintwa, K.F.; Letamo, G.; Navaneetham, K. Quantifying social vulnerability to natural hazards in Botswana: An application of cutter model. Int. J. Disaster Risk Reduct. 2019, 37, 1–12. [Google Scholar] [CrossRef]
  42. Luetkemeier, R.; Liehr, S. Household Drought Risk Index (HDRI): Social-ecological assessment of drought risk in the Cuvelai-Basin. J. Nat. Resour. Dev. 2018, 8, 46–68. [Google Scholar] [CrossRef]
  43. Reid, H.; Sahlén, L.; Stage, J.; MacGregor, J. Climate change impacts on Namibia’ s natural resources and economy. Clim. Policy 2008, 8, 452–466. [Google Scholar] [CrossRef]
  44. Hummel, D.; Doevenspeck, M.; Samimi, C. Climate Change, Environment and Migration in the Sahel: Selected Issues with a Focus on Senegal and Mali; working paper No. 1; Micle: Frankfurt, Germany, 2012. [Google Scholar]
  45. Kamali, B.; Abbaspour, K.C.; Wehrli, B.; Yang, H. A Quantitative analysis of Socio-Economic determinants influencing crop drought vulnerability in Sub-Saharan Africa. Sustainability 2019, 11, 6135. [Google Scholar] [CrossRef] [Green Version]
  46. Rapolaki, R.S.; Blamey, R.C.; Hermes, J.C.; Reason, C.J.C. A classification of synoptic weather patterns linked to extreme rainfall over the Limpopo River Basin in southern Africa. Clim. Dyn. 2019, 53, 2265–2279. [Google Scholar] [CrossRef]
  47. Global Drought Observatory. GDO Analytical Report: Drought in Southern Africa–January 2019; Copernicus: Göttingen, Germany, 2019; Available online: https://www.gdacs.org/Public/download.aspx?type=DC&id=144 (accessed on 6 January 2020).
  48. Lendelvo, S.; Angula, M.N.; Mogotsi, I.; Aribeb, K. Towards the reduction of vulnerabilities and risks of climate change in the Community-Based tourism, Namibia. In Natural Hazards—Risk Assessment and Vulnerability Reduction; do Carmo, J.S.A., Ed.; BoD—Books on Demand: London, UK, 2018; pp. 87–105. ISBN 978-1-78984-820-5. [Google Scholar]
  49. Liehr, S.; Röhrig, J.; Mehring, M.; Kluge, T. How the Social-Ecological systems concept can guide transdisciplinary research and implementation: Addressing water challenges in central northern Namibia. Sustainability 2017, 9, 1109. [Google Scholar] [CrossRef] [Green Version]
  50. Angombe, S.T. Evaluation of drought indices using the 40-percentile threshold for the North-Central regions of Namibia. J. Stud. Humanit. Soc. Sci. 2012, 1, 2026–7215. [Google Scholar]
  51. Landman, W.A.; Barnston, A.G.; Vogel, C.; Savy, J. Use of El Niño–Southern Oscillation related seasonal precipitation predictability in developing regions for potential societal benefit. Int. J. Clim. 2019, 39, 5327–5337. [Google Scholar] [CrossRef]
  52. Nhamo, L.; Mabhaudhi, T. Preparedness or repeated short-term relief aid? Building drought resilience through early warning in southern Africa. Water SA 2019, 45, 75–85. [Google Scholar] [CrossRef] [Green Version]
  53. Pricope, N.G.; Gaughan, A.E.; All, J.D.; Binford, M.W.; Rutina, L.P. Spatio-temporal analysis of vegetation dynamics in relation to shifting inundation and fire regimes: Disentangling environmental variability from land management decisions in a southern African transboundary watershed. Land 2015, 4, 627–655. [Google Scholar] [CrossRef]
  54. Angula, M.N.; Menjono, E. Gender, culture and climate change in rural Namibia. J. Stud. Humanit. Soc. Sci. 2014, 3, 225–238. [Google Scholar]
  55. Mabuku, M.P.; Senzanje, A.; Mudhara, M.; Jewitt, G. Rural households’ flood preparedness and social determinants in Mwandi district of Zambia and Eastern Zambezi Region of Namibia. Int. J. Disaster Risk Reduct. 2018, 28, 284–297. [Google Scholar] [CrossRef]
  56. Government Republic of Namibia (GRN), National Disaster Risk Management Plan; Government Republic of Namibia: Windhoek, Namibia, 2011.
  57. Food and Agriculture Organization of the United Nations (FAO). Food and Agriculture: Key to Achieving the 2030 Agenda for Sustainable Development; Food and Agriculture Organization of the United Nations: Rome, Italy, 2016. [Google Scholar]
  58. Government Republic of Namibia. Climate Change Vulnerability & Adaptation Assessment: Namibia; Government Republic of Namibia: Windhoek, Namibia, 2008.
  59. Awadallah, A.G.; Tabet, D. Estimating flooding extent at high return period for ungauged braided systems using remote sensing: A case study of Cuvelai Basin, Angola. Nat. Hazards (Dordr.) 2015, 77, 255–272. [Google Scholar] [CrossRef]
  60. Mittermeier, R.A.; Turner, W.R.; Larsen, F.W.; Brooks, T.M.; Gascon, C. Global biodiversity conservation: The critical role of hotspots. In Biodiversity Hotspots: Distribution and Protection of Conservation Priority Areas; Zachos, F.E., Habel, J.C., Eds.; Springer: Heidelberg, Germany, 2011; pp. 3–22. ISBN 978-3-642-20991-8. [Google Scholar]
  61. Scraping the Pot: San in Namibia Two Decades After Independence; Dieckmann, U.; Thiem, M.; Dirkx, E.; Hays, J. (Eds.) Legal Assistance Centre (LAC): Windhoek, Namibia, 2014; ISBN 978-99945-61-52-0. [Google Scholar]
  62. Lee, R.B.; Hitchcock, R.K. African Hunter-Gatherers: Survival, history and the politics of identity. Afr. Study Monogr. 2001, 26, 257–280. [Google Scholar]
  63. Central Inteligence Agency. The World Factbook. Available online: https://www.cia.gov/library/publications/the-world-factbook/geos/wa.html (accessed on 5 June 2020).
  64. Melber, H. Colonialism, land, ethnicity, and class: Namibia after the second national land conference. Afr. Spectr. 2019, 54, 73–86. [Google Scholar] [CrossRef] [Green Version]
  65. Hoole, A.; Berkes, F. Breaking down fences: Recoupling Social–Ecological systems for biodiversity conservation in Namibia. Geoforum 2009, 41, 304–317. [Google Scholar] [CrossRef]
  66. Namibia’s Red Line: The History of a Veterinary and Settlement Border; Giorgio, M. (Ed.) Palgrave MacMillan: London, UK, 2012. [Google Scholar]
  67. Newsham, A.J.; Thomas, D.S.G. Knowing, farming and climate change adaptation in North-Central Namibia. Glob. Environ. Chang. 2011, 21, 761–770. [Google Scholar] [CrossRef] [Green Version]
  68. Hooli, L.J. Resilience of the poorest: Coping strategies and indigenous knowledge of living with the floods in Northern Namibia. Reg. Environ. Chang. 2015, 16, 695–707. [Google Scholar] [CrossRef]
  69. Van Rooy, G.; Roberts, B.; Schier, C.; Swartz, J.; Levine, S. Income Poverty and Inequality in Namibia; Discussion Paper No. 1: Windhoek, Namibia, 2007. [Google Scholar]
  70. Namibia Statistics Agency. Poverty Dynamics in Namibia: A Comparative Study Using 1993/1994, 2003/04 and the 2009/10 NHIES Surveys; Namibia Statistics Agency: Windhoek, Namibia, 2012. [Google Scholar]
  71. Mendelsohn, J.; Jarvis, A.; Roberts, C.; Robertson, T. Atlas of Namibia: A Portrait of the Land and Its People; David Philip Publishers: Cape Town, South Africa, 2002. [Google Scholar]
  72. Taukeni, S.; Chitiyo, G.; Chitiyo, M.; Asino, I.; Shipena, G. Post-Traumatic stress disorder amongst children aged 8–18 affected by the 2011 northern-Namibia floods. Jàmbá. J. Disaster Risk Stud. 2011, 8, 1–6. [Google Scholar] [CrossRef]
  73. Kluge, T.; Liehr, S.; Lux, A.; Moser, P.; Niemann, S.; Umlauf, N.; Urban, W. IWRM concept for the Cuvelai Basin in northern Namibia. Phys. Chem. Earth 2008, 33, 48–55. [Google Scholar] [CrossRef]
  74. Vallejo Orti, M.; Negussie, K.G. Temporal statistical analysis and predictive modelling of drought and flood in Rundu–Namibia. Clim. Dyn. 2019, 53, 1247–1260. [Google Scholar] [CrossRef]
  75. Speranza, C.I. Flood disaster risk management and humanitarian interventions in the Zambezi River Basin: Implications for adaptation to climate change. Clim. Dev. 2010, 2, 176–190. [Google Scholar] [CrossRef]
  76. Government Republic of Namibia. A Policy for Disaster Risk Management in Namibia 2009; Office of the Prime Minister—Directorate Disaster Risk Management: Windhoek, Namibia, 2009.
  77. Awala, S.K.; Hove, K.; Wanga, M.A.; Valombola, J.S.; Mwandemele, O.D. Rainfall trend and variability in Semi-Arid northern Namibia: Implications for smallholder agricultural production. Welwitschai Int. J. Agric. Sci. 2019, 5–25. [Google Scholar]
  78. Luetkemeier, R.; Liehr, S. Integrated Responses to Drought Risk in Namibia and Angola; ISOE—nstitute for Social-Ecological Research: Frankfurt, Germany, 2019; pp. 1–7. [Google Scholar]
  79. Government Republic of Namibia. Agricultural Inputs and Household Food Security Situation Report; Government Republic of Namibia: Windhoek, Namibia, 2019.
  80. Siljander, M. Predictive fire occurrence modelling to improve burned area estimation at a regional scale: A case study in East Capriv, Namibia. Int. J. Appl. Earth Obs. Geoinf. 2009, 11, 380–393. [Google Scholar] [CrossRef]
  81. Government Republic of Namibia. National Forest and Veld Fire Management Policy and Strategy; Government Republic of Namibia: Windhoek, Namibia, 2019.
  82. van Wilgen, B.W. The evolution of fire management practices in savanna protected areas in South Africa. S. Afr. J. Sci. 2009, 105, 343–349. [Google Scholar] [CrossRef]
  83. Government Republic of Namibia. Fire Management Strategy for Namibia’s Protected Areas; Government Republic of Namibia: Windhoek, Namibia, 2016.
  84. Sheuyange, A.; Oba, G.; Weladji, R.B. Effects of anthropogenic fire history on savanna vegetation in northeastern Namibia. J. Environ. Manag. 2005, 75, 189–198. [Google Scholar] [CrossRef] [PubMed]
  85. Verlinden, A.; Laamanen, R. Long term fire scar monitoring with remote sensing in northern namibia: Relations between fire frequency, rainfall, land cover, fire management and trees. Environ. Monit. Assess. 2006, 112, 231–253. [Google Scholar] [CrossRef]
  86. TIBCO Software Inc. Statistica, Software release 13.4. 2018. [Google Scholar]
  87. R Core Team. A Language and Environment for Statistical Computing. R Foundation for Statistical Computing; R Core Team: Vienna, Austria, 2017. [Google Scholar]
  88. ESRI ArcGIS Desktop: Release 10.8. Redlands, CA: Environmental Systems Research Institute 2020.
  89. Bunting, E.; Steele, J.; Keys, E.; Muyengwa, S.; Child, B.; Southworth, J. Local perception of risk to livelihoods in the Semi-Arid landscape of Southern Africa. Land 2013, 2, 225–251. [Google Scholar] [CrossRef] [Green Version]
  90. O’Brien, K.; Quinlan, T.; Ziervogel, G. Vulnerability interventions in the context of multiple stressors: Lessons from the Southern African Vulnerability Initiative (SAVI). Environ. Sci. Policy 2009, 12, 23–32. [Google Scholar] [CrossRef]
  91. Davies, J.E.; Spear, D.; Ziervogel, G.; Hegga, S.; Angula, N.; Kunamwene, I.; Togarepi, C.; Elaine, J.; Spear, D.; Ziervogel, G.; et al. Avenues of understanding: Mapping the intersecting barriers to adaptation in Namibia. Clim. Dev. 2020, 12, 268–280. [Google Scholar] [CrossRef] [Green Version]
  92. Hegga, S.; Ziervogel, G.; Angula, M.; Spear, D.; Nyamwanza, A.; Ndeunyema, E.; Kunamwene, I.; Togarepi, C.; Morchain, D. Vulnerability and Risk Assessment in Omusati Region. In Namibia: Fostering People-Centred Adaptation to Climate Change; CARIAA: Ottawa, ON, Canada, 2016. [Google Scholar]
  93. Angula, M.N.; Kaundjua, M.B. The changing climate and human vulnerability in North-Central Namibia. Jàmbá. J. Disaster Risk Stud. 2016, 8, 1–7. [Google Scholar] [CrossRef]
  94. Taapopi, M.; Kamwi, J.M.; Siyambango, N. Perception of farmers on conservation agriculture for climate change adaptation in Namibia. Environ. Nat. Resour. Res. 2018, 8, 33–43. [Google Scholar] [CrossRef]
  95. Angula, M. Gender and Climate Change: Namibia Case Study; Heinrich böll Foundation southern Africa: Cape Town, South Africa, 2010. [Google Scholar]
  96. Nhemachena, C.; Matchaya, G.; Nhemachena, C.R.; Karuaihe, S.; Muchara, B.; Nhlengethwa, S. Measuring baseline Agriculture-Related sustainable development goals index for southern Africa. Sustainability 2018, 10, 849. [Google Scholar] [CrossRef] [Green Version]
  97. Dilshad, T.; Mallick, D.; Udas, P.B.; Goodrich, C.G.; Prakash, A.; Gorti, G.; Bhadwal, S.; Anwar, M.Z.; Khandekar, N.; Hassan, S.M.T.; et al. Growing social vulnerability in the river basins: Evidence from the Hindu Kush Himalaya (HKH) Region. Environ. Dev. 2019, 31, 19–33. [Google Scholar] [CrossRef]
  98. Mayr, M.; Le Roux, J.; Samimi, C. The Effect of Land Use Practices on the Spatial and Temporal Characteristics of Savanna Fires in Namibia; University of Bayreuth: Bayreuth, Germany, 2015. [Google Scholar]
  99. Eriksen, S.; Silva, J.A. The vulnerability context of a savanna area in Mozambique: Household drought coping strategies and responses to economic change. Environ. Sci. Policy 2009, 12, 33–52. [Google Scholar] [CrossRef]
  100. Davies, J.; Spear, D.; Chappel, A.; Joshi, N.; Togarepi, C.; Kunamwene, I. Considering religion and tradition in climate smart Agriculture: Insights from Namibia. In The Climate-Smart Agriculture Papers: Investigating the Business of a Productive, Resilient and Low Emission Future; Rosenstock, T.S., Nowak, A., Girvetz, E., Eds.; Springer Nature Switzerland AG: Gewerbestrasse, Switzerland, 2019; pp. 187–197. ISBN 9783319927985. [Google Scholar]
  101. Osbahr, H.; Twyman, C.; Adger, W.N.; Thomas, D.S.G. Evaluating successful livelihood adaptation to climate variability and change in Southern Africa. Ecol. Soc. 2010, 15, 1–20. [Google Scholar] [CrossRef]
  102. Gan, T.Y.; Ito, M.; Hülsmann, S.; Qin, X.; Lu, X.X.; Liong, S.-Y.; Rutschman, M.D.; Koivusalo, H. Possible climate change/variability and human impacts, vulnerability of Drought-Prone regions, water resources and capacity building for Africa. Hydrol. Sci. J. 2016, 61, 1209–1226. [Google Scholar] [CrossRef]
  103. Zinyengere, N.; Crespo, O.; Hachigonta, S. Crop response to climate change in southern Africa: A comprehensive review. Glob. Planet. Chang. 2013, 111, 118–126. [Google Scholar] [CrossRef] [Green Version]
  104. Kusangaya, S.; Warburton, M.L.; van Garderen, E.A.; Jewitt, G.P.W. Impacts of climate change on water resources in southern Africa: A review. Phys. Chem. Earth Parts A/B/C 2014, 67–69, 47–54. [Google Scholar] [CrossRef]
  105. Serdeczny, O.; Adams, S.; Baarsch, F.; Coumou, D.; Robinson, A.; Hare, W.; Schaeffer, M.; Perrette, M.; Reinhardt, J. Climate change impacts in Sub-Saharan Africa: From physical changes to their social repercussions. Reg. Environ. Chang. 2017, 17, 1585–1600. [Google Scholar] [CrossRef]
  106. Chakraborty, L.; Rus, H.; Henstra, D.; Thistlethwaite, J.; Scott, D. A Place-Based socioeconomic status index: Measuring social vulnerability to flood hazards in the context of environmental justice. Int. J. Disaster Risk Reduct. 2019, 43, 1–12. [Google Scholar] [CrossRef]
  107. Dwyer, A.; Zoppou, C.; Nielsen, O.; Day, S.; Robert, S. Quantifying Social Vulnerability: A methodology for identifying those at risk to natural hazards; Geoscience Australia: Canberra, Australia, 2004; ISBN 1-920871-09-8.
  108. Bauer, S.; Scholz, I. Adaptation to climate change in Southern Africa: New boundaries for sustainable development? Clim. Dev. 2010, 2, 83–93. [Google Scholar] [CrossRef]
  109. Skilodimou, H.D.; Bathrellos, G.D.; Chousianitis, K.; Youssef, A.M.; Pradhan, B. Multi-hazard assessment modeling via Multi-Criteria analysis and GIS: A case study. Environ. Earth Sci. 2019, 78, 1–21. [Google Scholar] [CrossRef]
  110. Bathrellos, G.D.; Skilodimou, H.D.; Chousianitis, K.; Youssef, A.M.; Pradhan, B. Suitability estimation for urban development using Multi-Hazard assessment map. Sci. Total Environ. 2017, 575, 119–134. [Google Scholar] [CrossRef]
  111. Government Republic of Namibia. Disaster Risk Management Plan; Office of the Prime Minister—Directorate Disaster Risk Management: Windhoek, Namibia, 2011.
  112. Hosegood, V.; Madhavan, S. Data availability on men’s involvement in families in Sub-Saharan Africa to inform Family-Centred programmes for children aff ected by HIV and AIDS. J. Int. Aids Soc. 2010, 13, 1–7. [Google Scholar] [CrossRef] [PubMed] [Green Version]
  113. Obrist, B.; Pfeiffer, C.; Henley, R. Multi-layered social resilience: A new approach in mitigation research. Prog. Dev. Stud. 2010, 10, 283–293. [Google Scholar] [CrossRef]
  114. Saja, A.M.A.; Goonetilleke, A.; Teo, M.; Ziyath, A.M. A critical review of social resilience assessment frameworks in disaster management. Int. J. Disaster Risk Reduct. 2019, 35, 101096. [Google Scholar] [CrossRef]
  115. Grodek, T.; Benito, G.; Botero, B.A.; Jacoby, Y.; Porat, N.; Haviv, I.; Cloete, G. The last millennium largest floods in the hyperarid Kuiseb River basin, Namib Desert. J. Quat. Sci. 2013, 28, 258–270. [Google Scholar] [CrossRef]
  116. Archer, E.R.M.; Landman, W.A.; Tradross, M.A.; Malherbe, J.; Weepener, H.; Maluleke, P.; Marumbwa, F.M. Understanding the evolution of the 2014–2016 summer rainfall seasons in southern Africa: Key lessons. Clim. Risk Manag. 2017, 16, 22–28. [Google Scholar] [CrossRef]
  117. Fara, K. How Natural Are ‘Natural Disasters’? Vulnerability to Drought of Communal Farmers in Southern Namibia. Risk Manag. 2001, 3, 47–63. [Google Scholar] [CrossRef]
Figure 1. Administrative districts, main towns and biomes of Namibia. District codes: 1—Erongo, 2—Hardap, 3—Karas, 4—Kavango East, 5—Kavango West, 6—Khomas, 7—Kunene, 8—Ohangwena, 9—Omaheke, 10—Omusati, 11—Oshana, 12—Oshikoto, 13—Otjozondjupa, 14—Zambezi. The inset figure shows the location of Namibia in the African continent. Map of biomes [71].
Sustainability 12 04910 g001
Figure 2. Spatial distribution of the composite index of social vulnerability (a) and natural hazards (b) within the districts of Namibia.
Sustainability 12 04910 g002
Figure 3. Relative contribution of twelve indicators to the overall level of social vulnerability in the Namibian districts. The districts are ordered by the magnitude of the composite index of social vulnerability based on all underlying variables. Colors indicate three groups of variables—social, demographic and economic. Abbreviations of the variables are explained in Table 1.
Sustainability 12 04910 g003
Figure 4. Relative magnitude of different indicators of natural hazards in the Namibian districts. The districts are ordered from lowest to highest exposure based on the composite index of natural hazards. The greater the area of the segment the greater the effect of the given hazard type.
Sustainability 12 04910 g004
Figure 5. Response of individual indicators of natural hazards to the composite index of social vulnerability calculated for the Namibian districts.
Sustainability 12 04910 g005
Figure 6. Position of the Namibian districts in space defined by the socio-economic conditions of populations and their exposure to natural hazards (a). The groups of districts were identified using the K-means clustering technique. The map indicates spatial distribution of the identified vulnerability classes (b).
Sustainability 12 04910 g006
Table 1. Variables characterizing social, economic and demographic settings of the Namibian districts. The variables were selected to represent a broader set of 29 variables listed in Supplementary material, Table S1.
CategoryVariableUnitAbbrev.MeanMedianMinMax.Var. Coef.
DemographicPopulation densityinhabitants/km2PopD6.814.300.5023.90107.49
Population in rural area%PopRur61.5064.505.0099.0044.21
Female population%FemPop50.2349.4546.7055.005.51
<4 years old%Age < 514.3613.6012.3020.1015.26
>60 years old%Age > 606.426.353.309.9023.81
SocialTotal unemployment%Unemp36.0637.0521.9052.2024.51
Population with
disabilities
%Disab4.774.602.307.6032.92
HIV level%HIV13.3412.457.3023.7029.78
Literacy rate%LitR85.6685.5566.5096.709.86
EconomicPension dependent%Pens$16.1414.004.0031.0049.72
Average household income (2015)USDHouse$1210867560350663.49
Farming dependent%Farm20.8621.501.0060.0074.07
Table 2. Variables characterizing the incidence of the most prominent natural hazards in the Namibian districts. Weights are used to calculate a composite indicator of natural hazards for each district.
HazardVariablePeriodUnitAbbrev.MeanMedianMinMaxWeight
FireAverage area burned2007–2017km2AreaB21607010.091080.33
DroughtLivestock deaths2018–2019number of livestockLivestD6,3013,5900.017,9550.165
Food insecure population2013number of peopleFInsP29,40320,497492880,7200.165
FloodsHuman mortality2009number of peopleHumM7.50.00.048.00.083
Schools affected2008number of schoolsScholA7.50.00.044.00.083
People displaced by floods2017number of peoplePopDis2380.00.02,6550.083
Estimated damages2009millions of US $EstDam10.76.60.037.20.083

