Pedestrian Road Crossing at Uncontrolled Mid-Block Locations: Does the Refuge Island Increase Risk?


Abstract
1. Introduction
2. Methodology
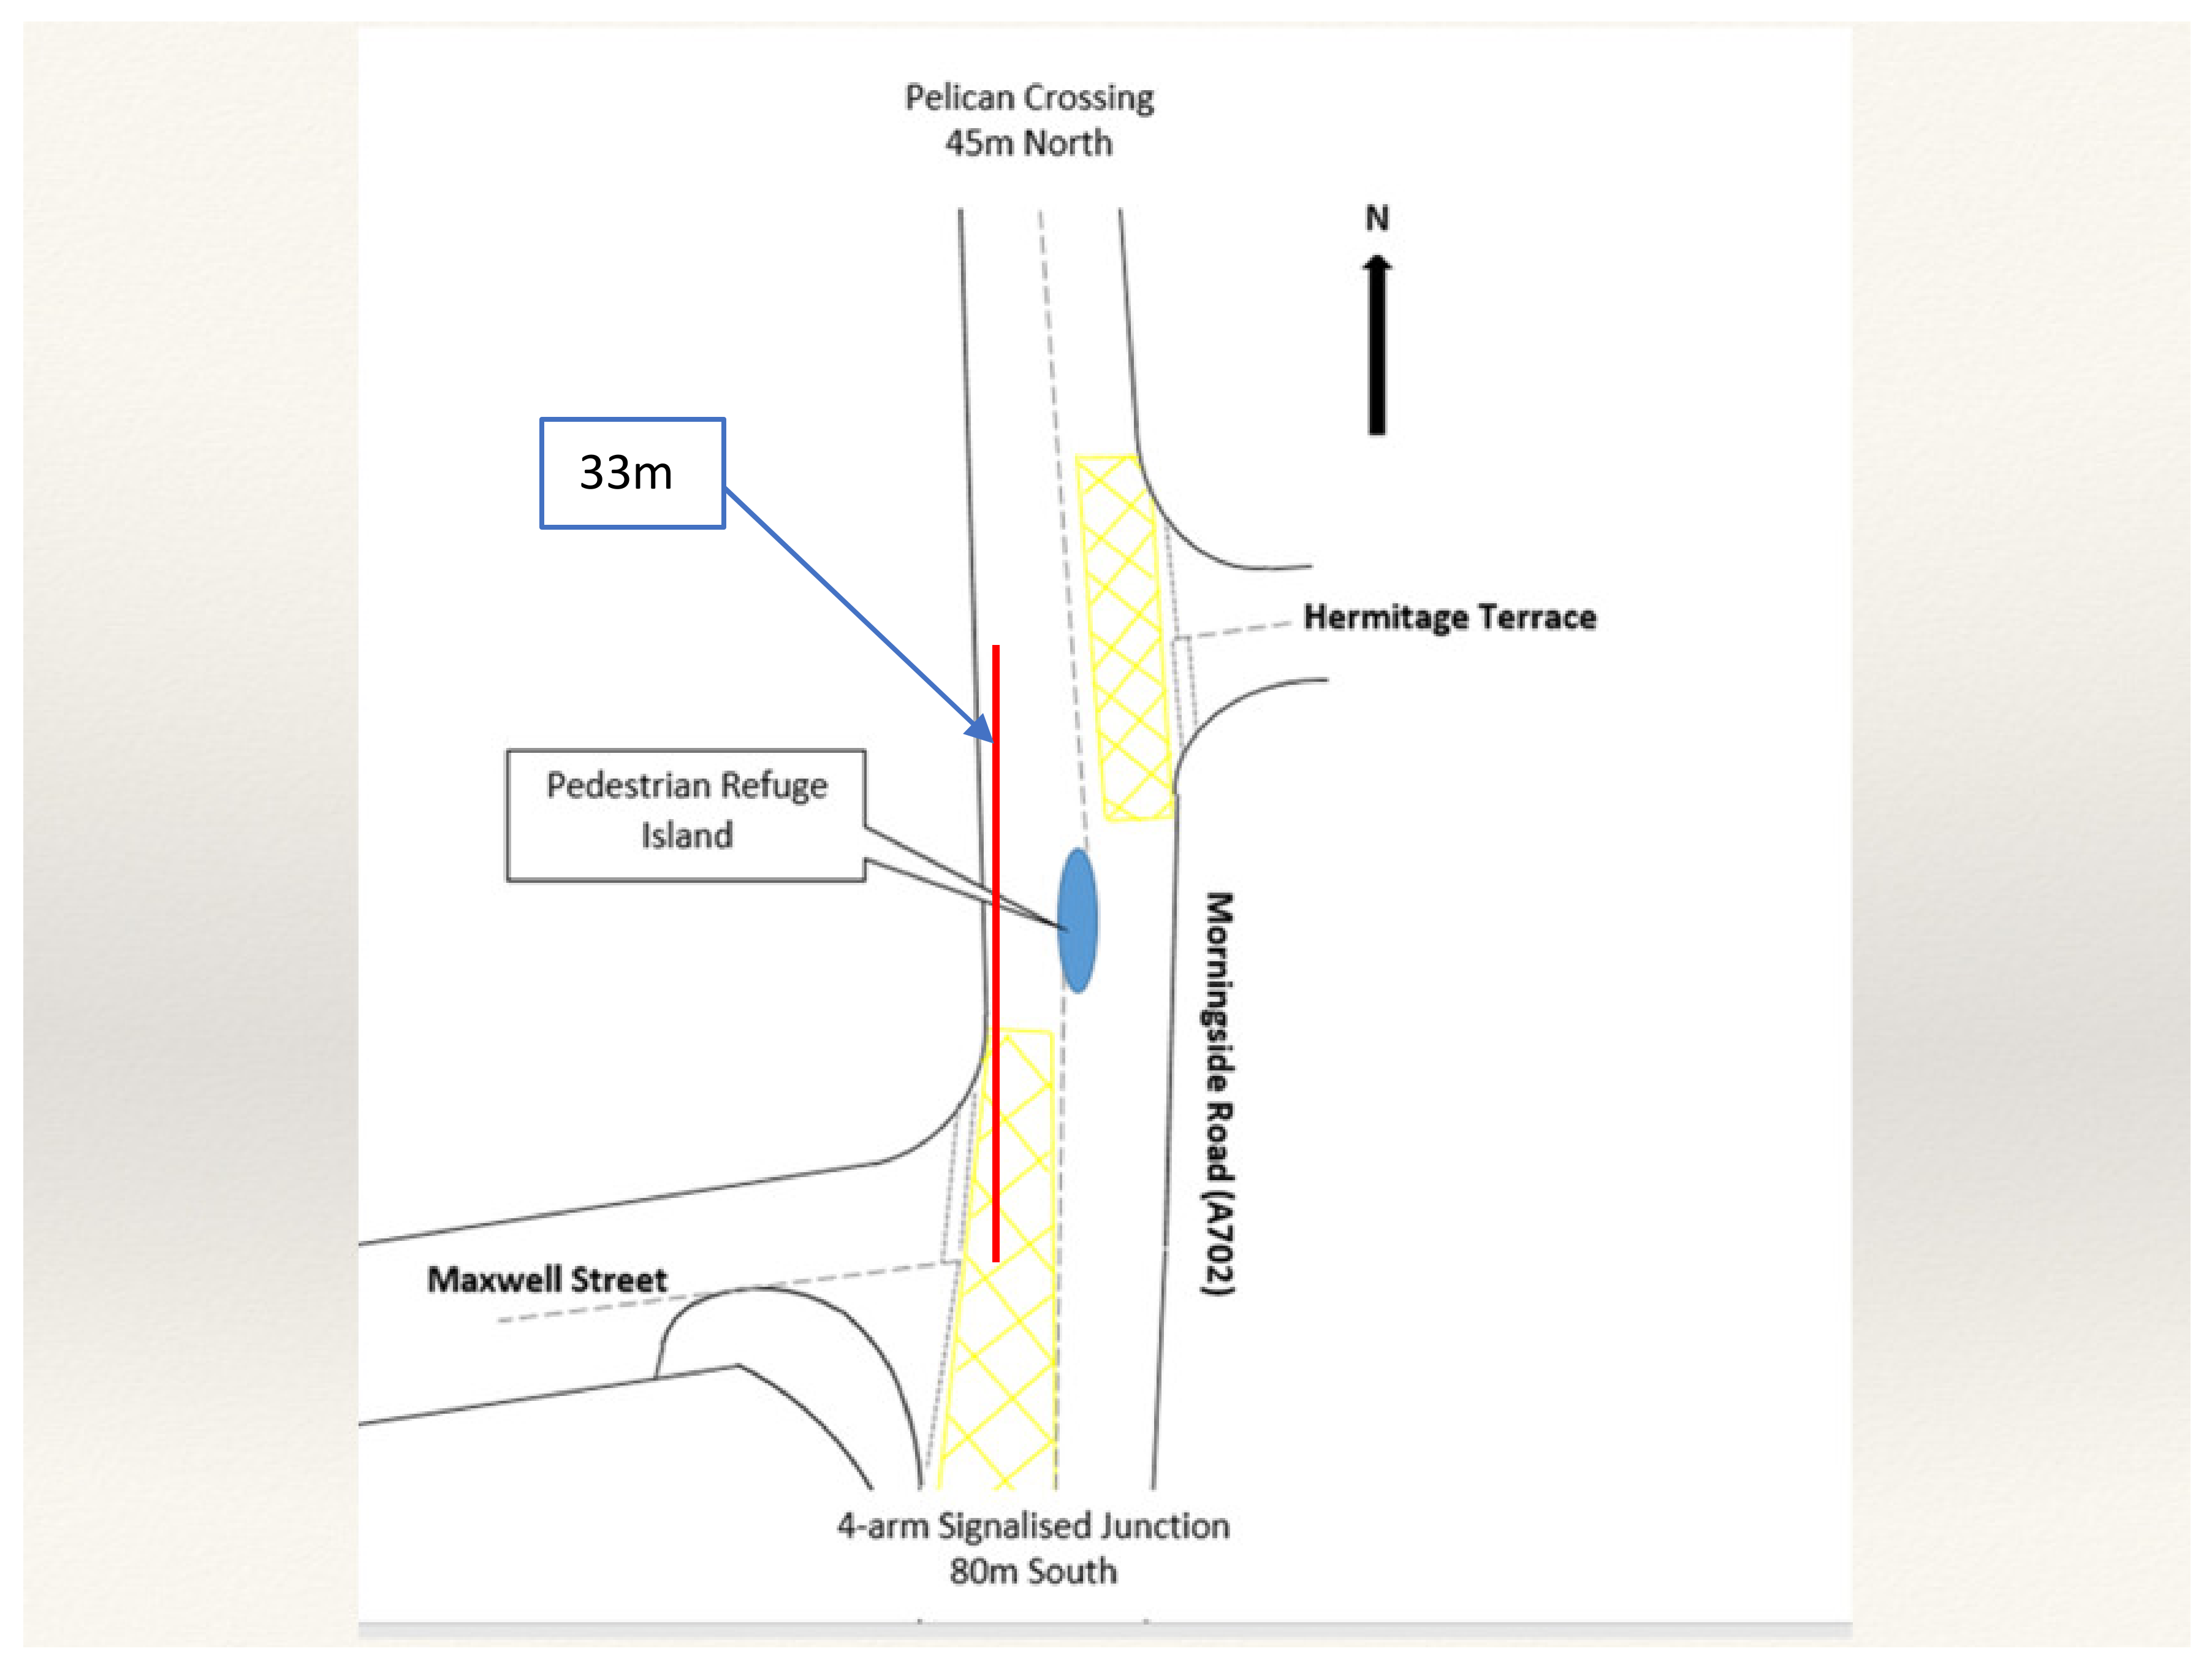
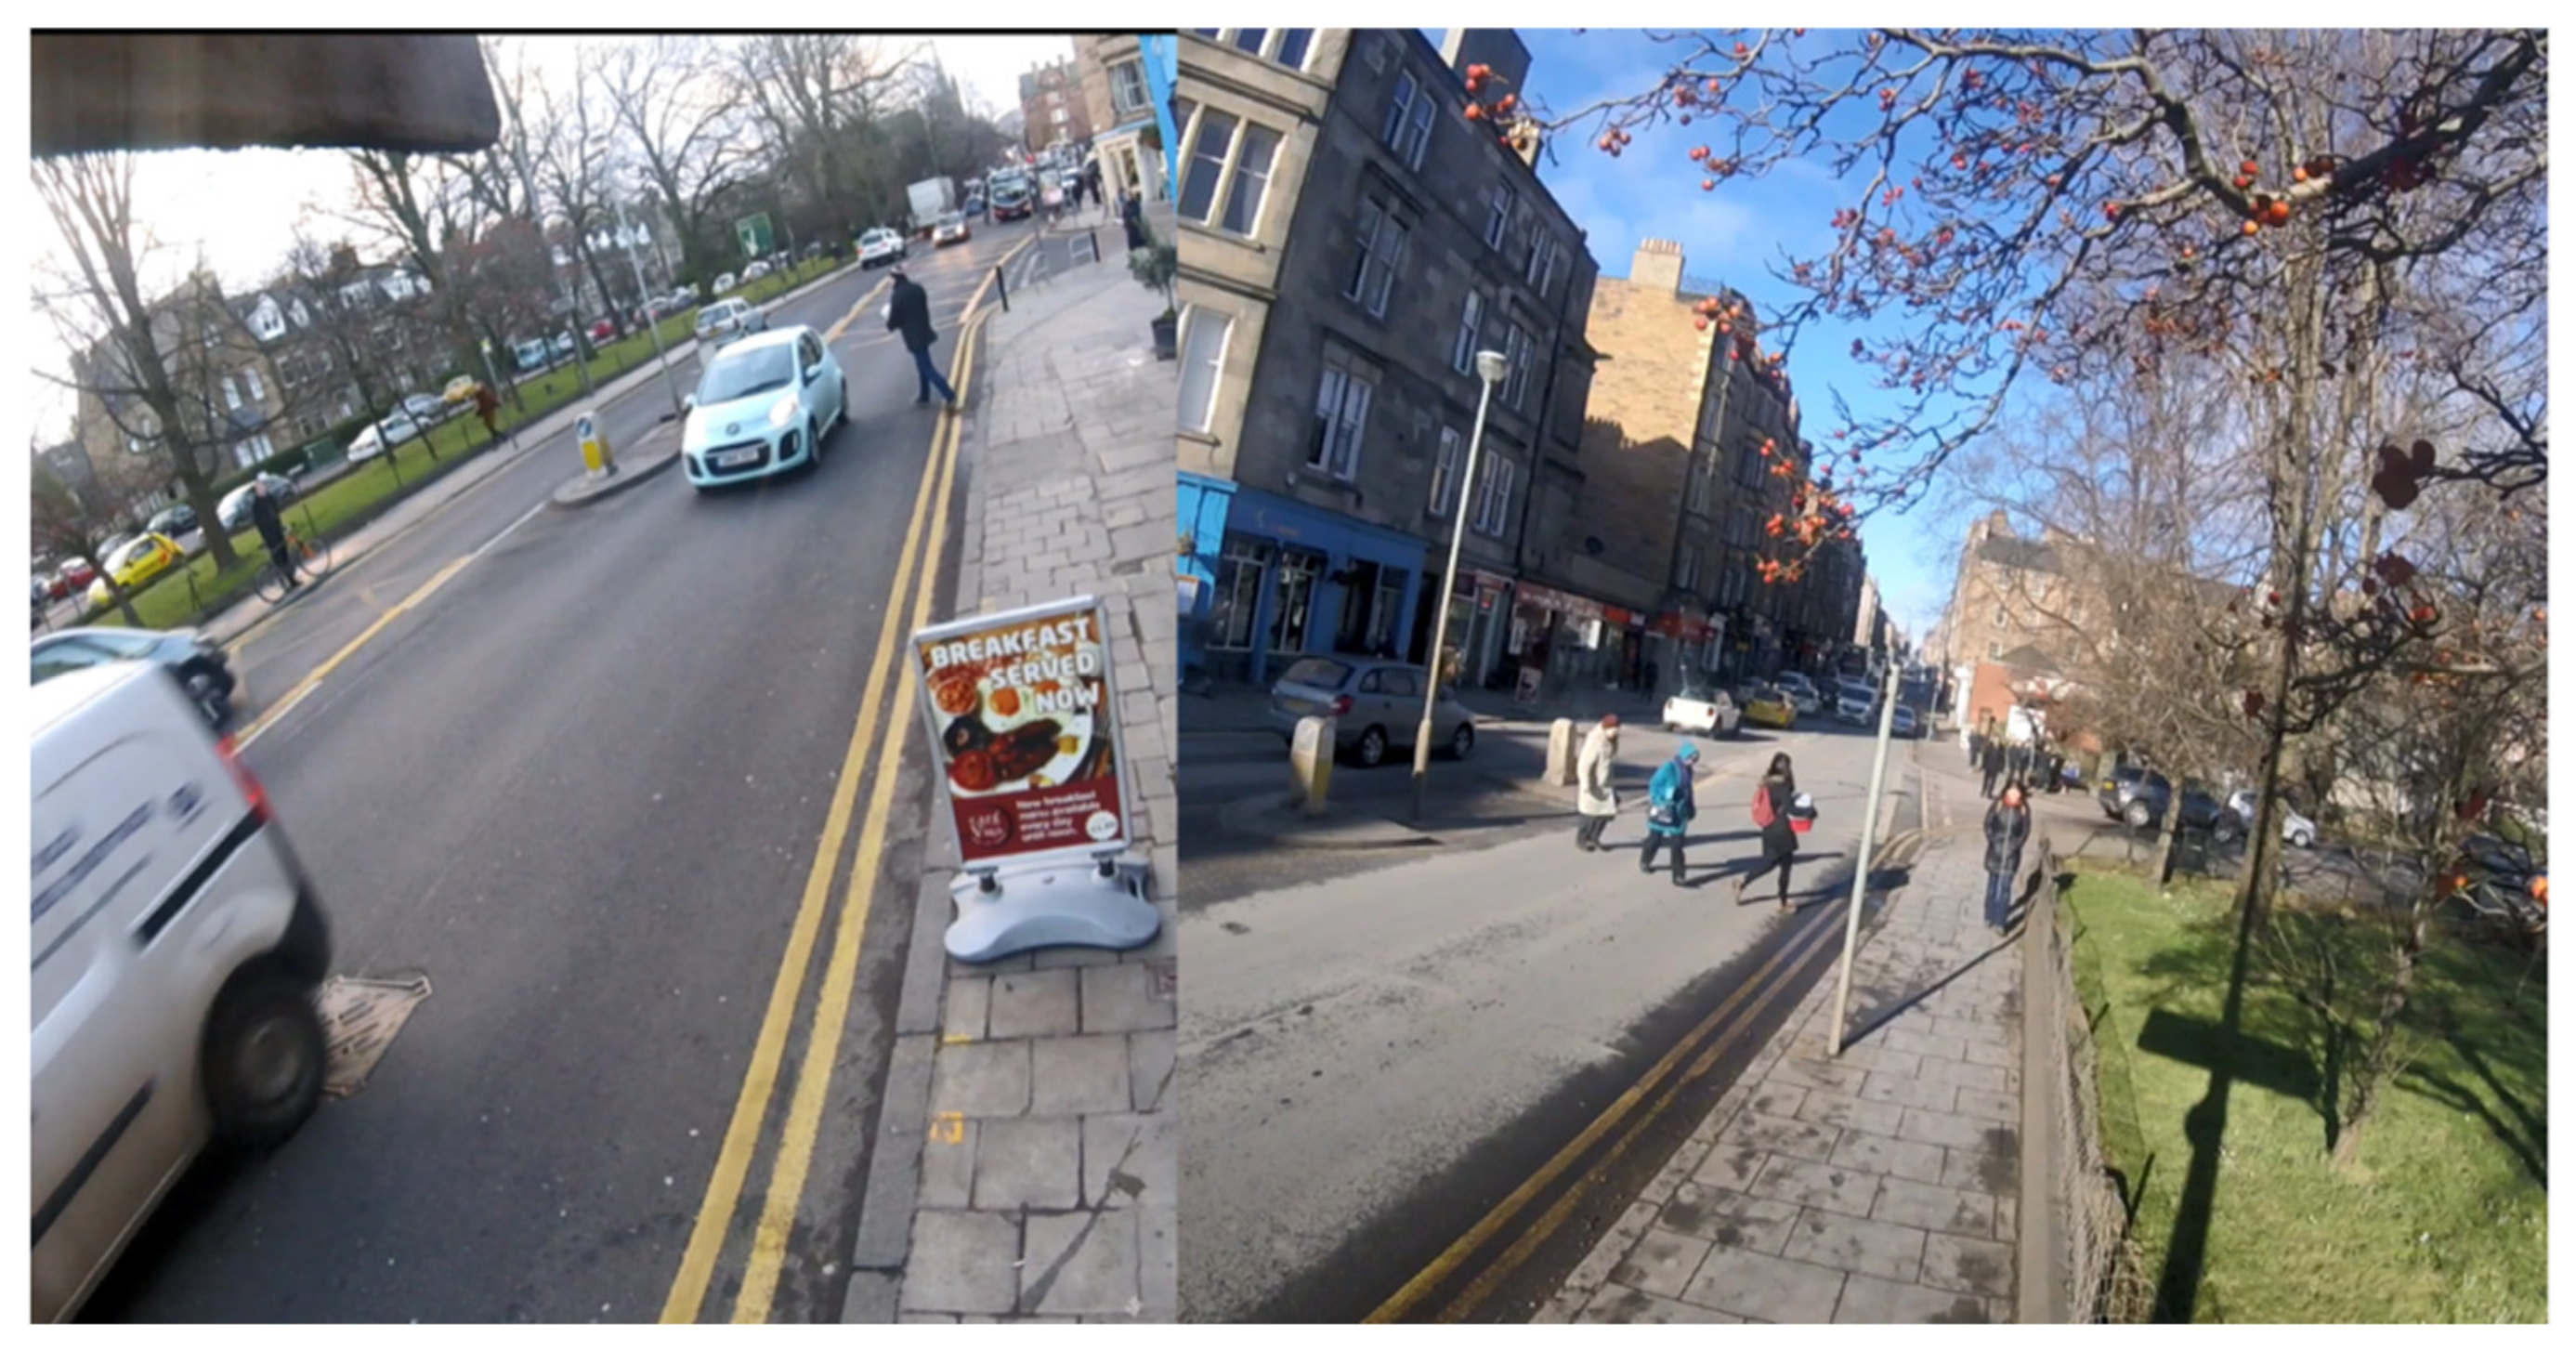
3. Location Description
4. Data Collection
5. Data Analysis
6. Results
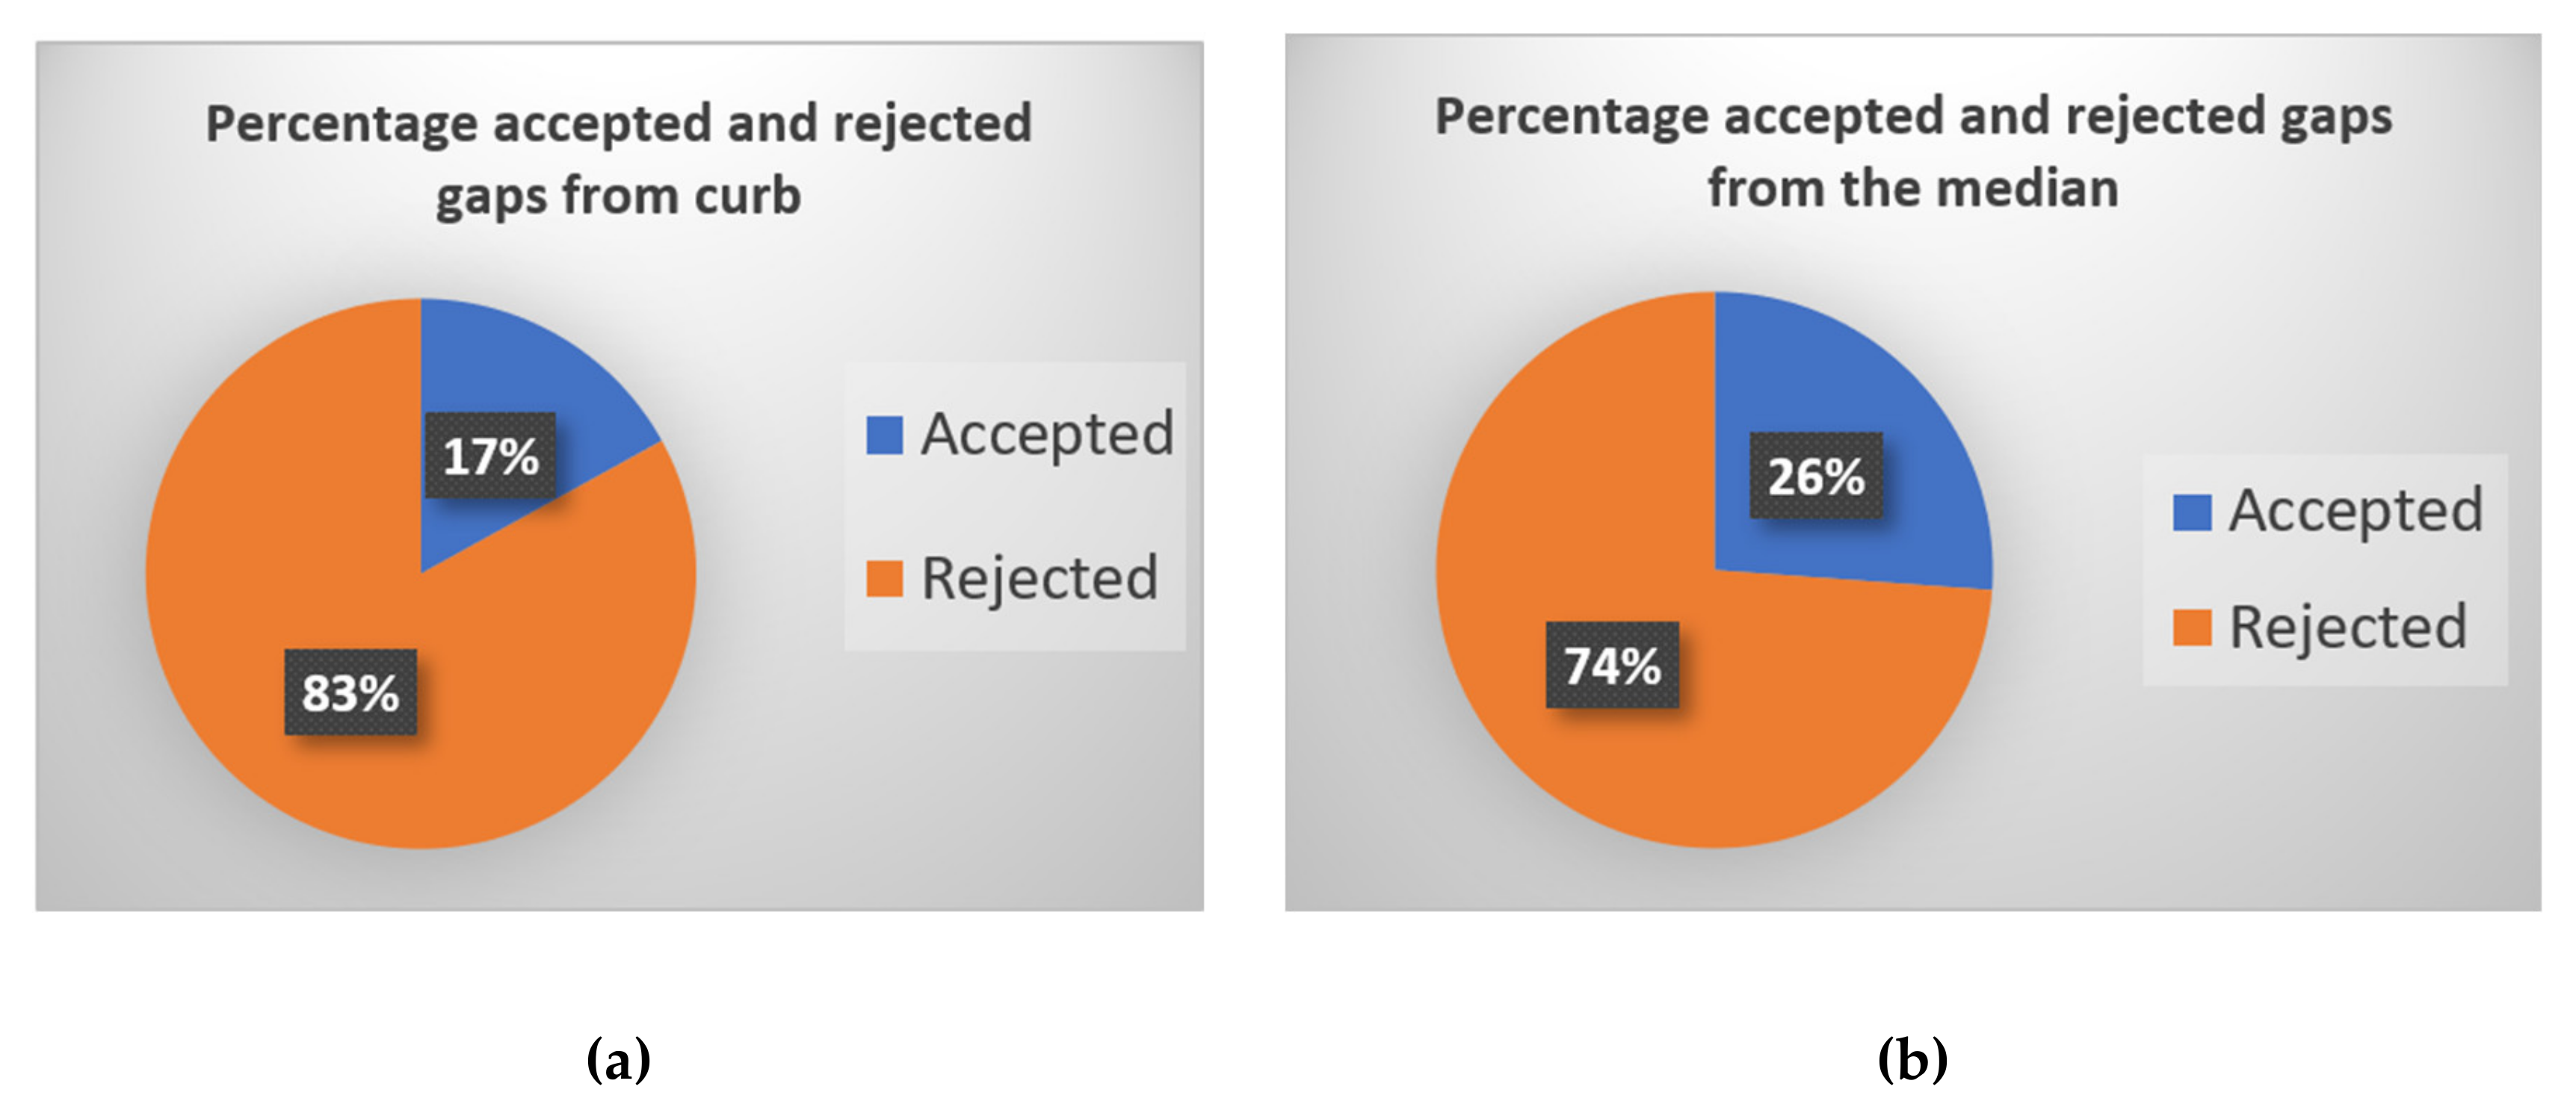
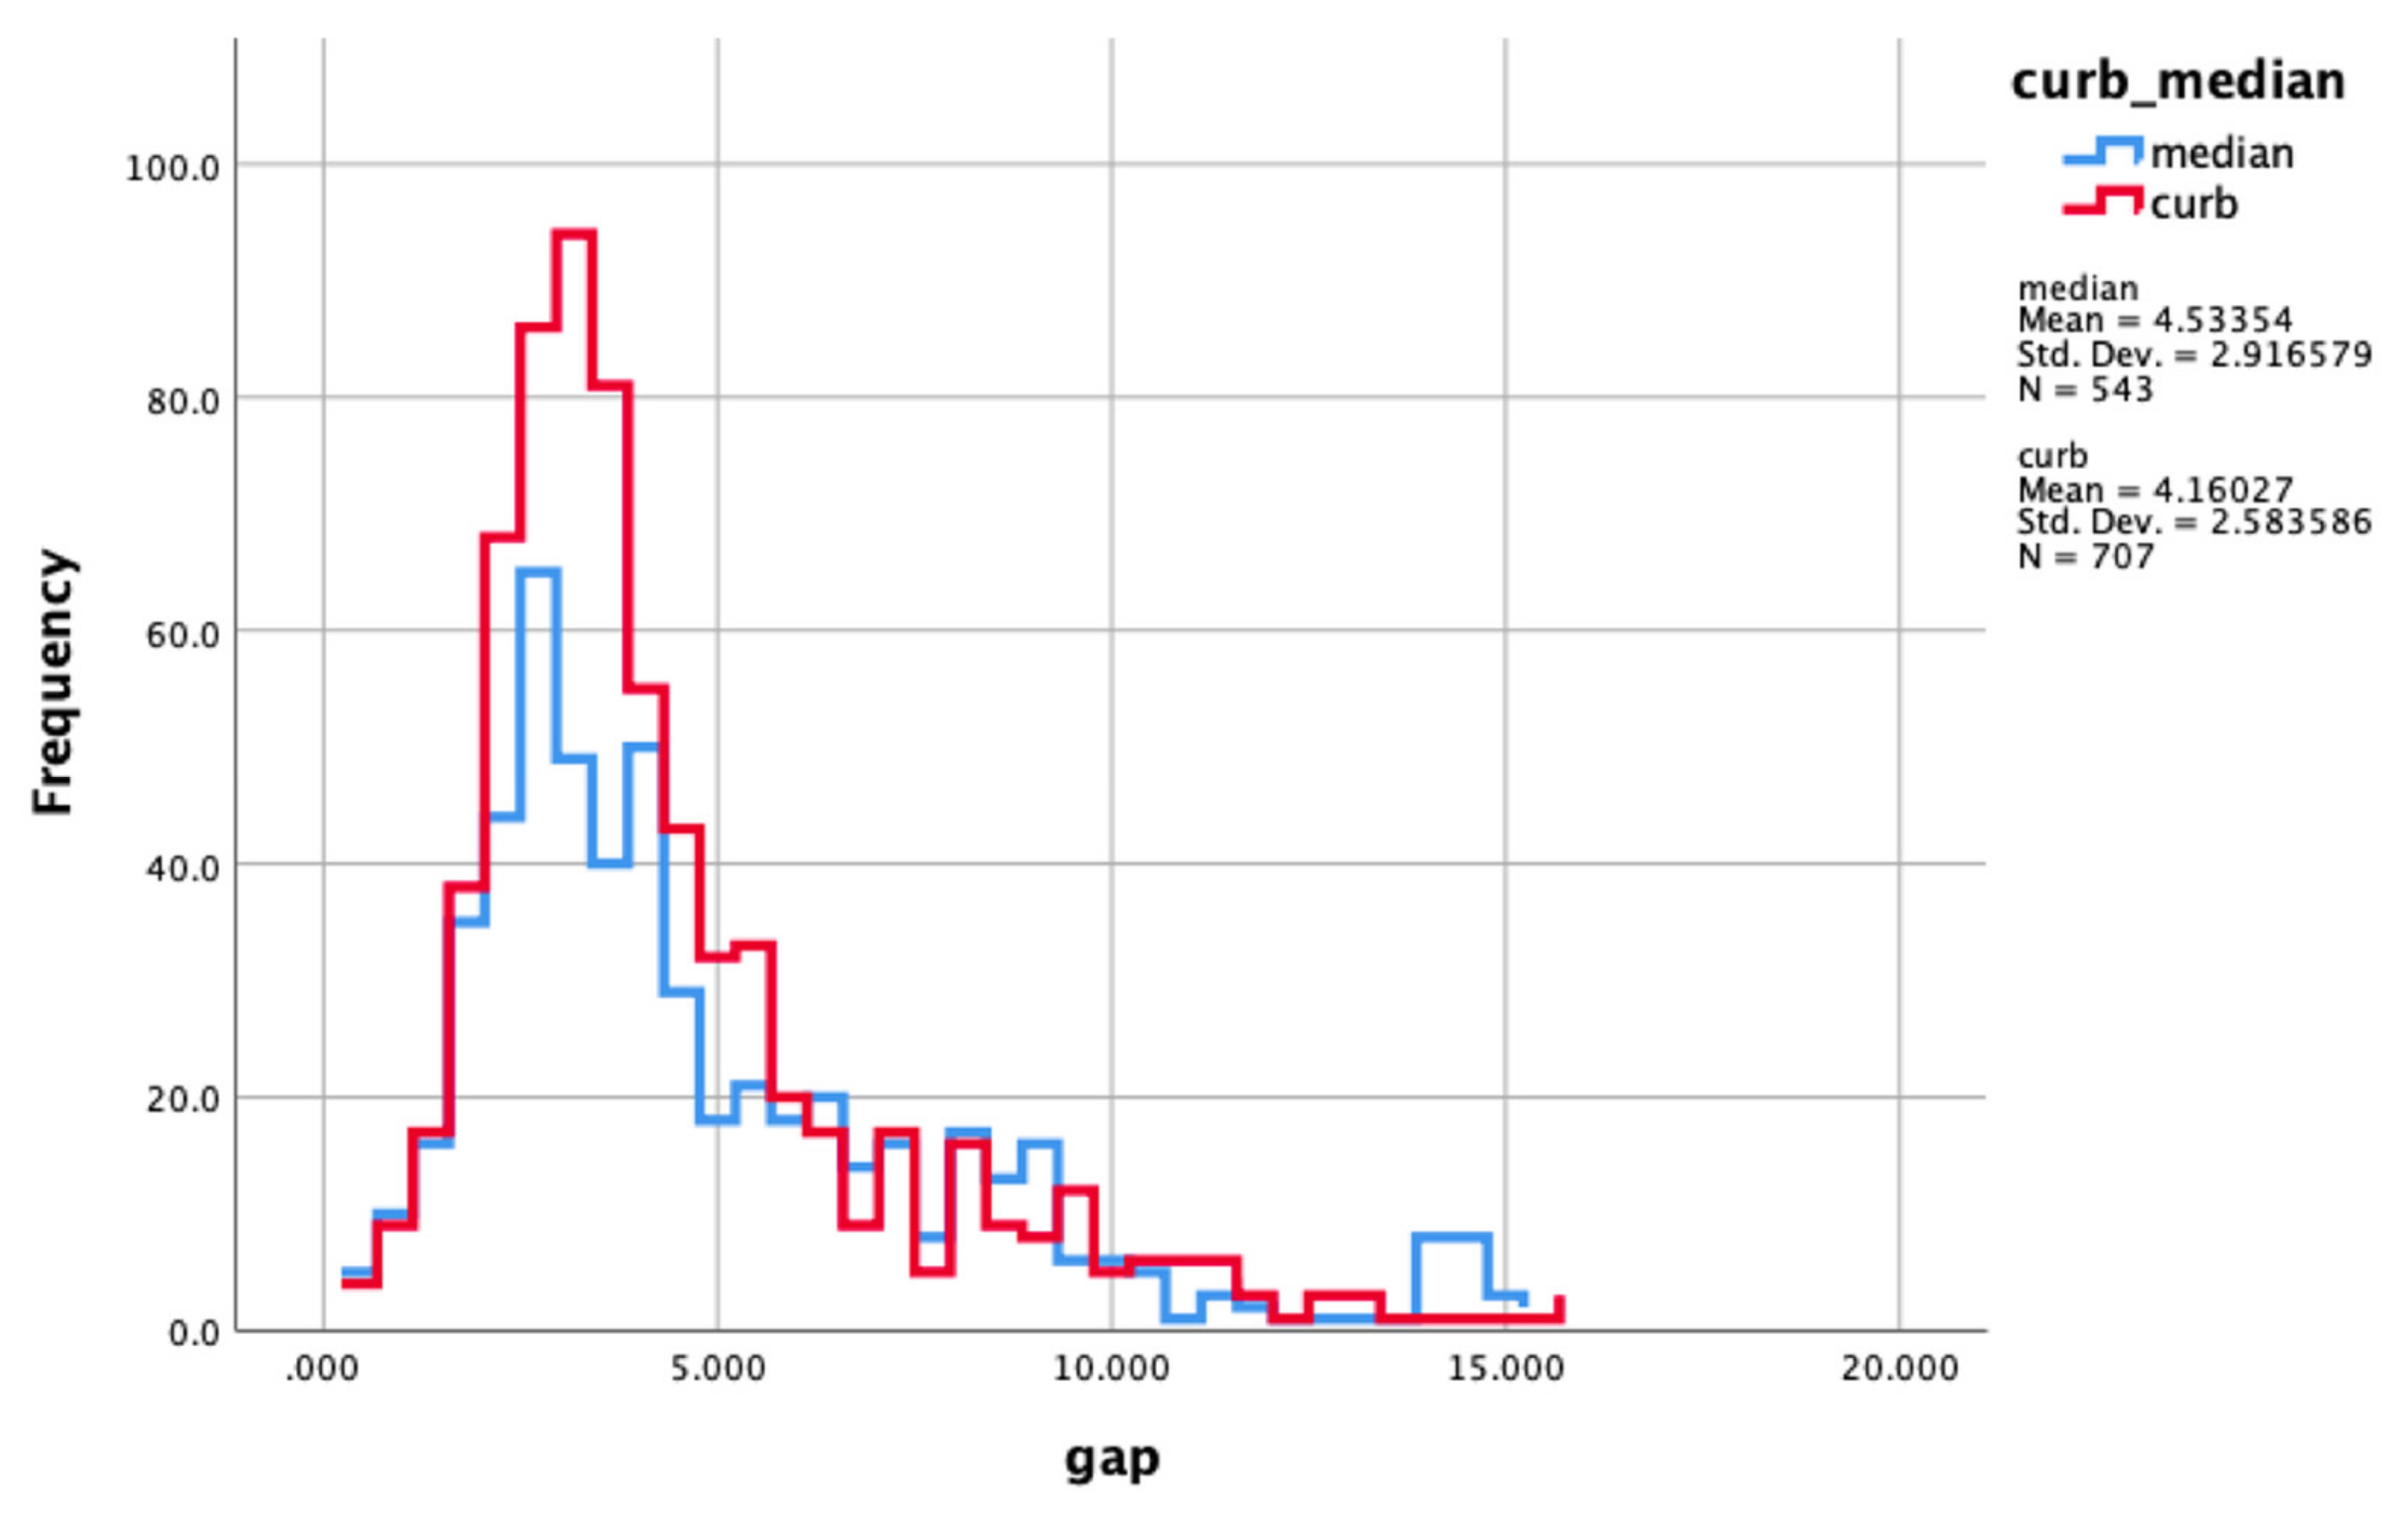
6.1. Descriptive Statistics
6.2. Multiple Linear Regression
6.3. Generalised Estimating Equations
7. Conclusions
Author Contributions
Funding
Acknowledgments
Conflicts of Interest
References
- Cohen, J.; Dearnaley, E.J.; Hansel, C.E.M. The risk taken in crossing a road. J. Oper. Res. Soc. 1955, 6, 120–128. [Google Scholar] [CrossRef]
- Zegeer, C.V.; Stewart, J.R.; Huang, H.H.; Lagerwey, P.A.; Feaganes, J.R.; Campbell, B.J. Safety Effects of Marked Versus Unmarked Crosswalks at Uncontrolled Locations Final Report and Recommended Guidelines. Available online: https://www.fhwa.dot.gov/publications/research/safety/04100/04100.pdf (accessed on 14 April 2020).
- Garder, P. Pedestrian safety at traffic signals: A study carried out with the help of a traffic conflicts technique. Accid. Anal. Prev. 1989, 21, 435–444. [Google Scholar] [CrossRef]
- Li, Y.; Fernie, G. Pedestrian behavior and safety on a two-stage crossing with a center refuge island and the effect of winter weather on pedestrian compliance rate. Accid. Anal. Prev. 2010, 42, 1156–1163. [Google Scholar] [CrossRef]
- Cherry, C.; Donlon, B.; Yan, X.; Moore, S.E.; Xiong, J. Illegal mid-block pedestrian crossings in China: Gap acceptance, conflict and crossing path analysis. Int. J. Inj. Control Saf. Promot. 2012, 19, 320–330. [Google Scholar] [CrossRef]
- Das, S.; Manski, C.F.; Manuszak, M.D. Walk or wait? An empirical analysis of street crossing decisions. J. Appl. Econom. 2005, 20, 529–548. [Google Scholar] [CrossRef]
- Hamed, M.M. Analysis of pedestrians’ behavior at pedestrian crossings. Saf. Sci. 2001, 38, 63–82. [Google Scholar] [CrossRef]
- Papadimitriou, E.; Lassarre, S.; Yannis, G. Pedestrian risk taking while road crossing: A comparison of observed and declared behaviour. Transp. Res. Procedia 2016, 14, 4354–4363. [Google Scholar] [CrossRef]
- Mamidipalli, S.V.; Sisiopiku, V.P.; Schroeder, B.J.; Elefteriadou, L.; Salamati, K.; Rouphail, N.M. Probit-Based Pedestrian Gap Acceptance Model for Midblock Crossing Locations. Transp. Res. Rec. J. Transp. Res. Board 2015, 2519, 128–136. [Google Scholar] [CrossRef]
- Kaparias, I.; Bell, M.; Dong, W.; Sastrawinata, A.; Singh, A.; Wang, X.; Mount, B. Analysis of pedestrian-vehicle traffic conflicts in street designs with elements of shared space. Transp. Res. Rec. J. Transp. Res. Board 2013, 2393, 21–30. [Google Scholar] [CrossRef]
- Kadali, B.R.; Vedagiri, P. Modelling pedestrian road crossing behaviour under mixed traffic condition. Eur. Transp. 2013, 55, 1–17. [Google Scholar]
- Kadali, B.R.; Vedagiri, P. Effect of vehicular lanes on pedestrian gap acceptance behaviour. Procedia Soc. Behav. Sci. 2013, 104, 678–687. [Google Scholar] [CrossRef]
- Sun, D.; Ukkusuri, S.V.S.K.; Benekohal, R.F.; Waller, S.T. Modeling of Motorist-Pedestrian Interaction at Uncontrolled Mid-Block Crosswalks. Available online: https://www.researchgate.net/profile/Rahim_Benekohal/publication/229042659_Modeling_of_motorist-pedestrian_interaction_at_uncontrolled_mid-block_crosswalks/links/5850798808aecb6bd8d21451/Modeling-of-motorist-pedestrian-interaction-at-uncontrolled-mid-block-crosswalks.pdf (accessed on 14 April 2020).
- Yannis, G.; Papadimitriou, E.; Theofilatos, A. Pedestrian gap acceptance for mid-block street crossing. Transp. Plan. Technol. 2013, 36, 450–462. [Google Scholar] [CrossRef]
- Kaparias, I.; Hirani, J.; Bell, M.G.; Mount, B. Pedestrian gap acceptance behavior in street designs with elements of shared space. Transp. Res. Rec. 2016, 2586, 17–27. [Google Scholar] [CrossRef]
- Brewer, M.; Fitzpatrick, K.; Whitacre, J.; Lord, D. Exploration of pedestrian gap-acceptance behavior at selected locations. Transp. Res. Rec. J. Transp. Res. Board 2006, 1982, 132–140. [Google Scholar] [CrossRef]
- Kadali, B.R.; Perumal, V. Pedestrians’ gap acceptance behavior at mid block location. Int. J. Engin. Technol. 2012, 4, 158–161. [Google Scholar] [CrossRef]
- Zhuang, X.; Wu, C. Pedestrians’ crossing behaviors and safety at unmarked roadway in China. Accid. Anal. Prev. 2011, 43, 1927–1936. [Google Scholar] [CrossRef] [PubMed]
- Serag, M.S. Modelling pedestrian road crossing at uncontrolled mid-block locations in developing countries. Int. J. Civil Struct. Eng. 2014, 4, 274–285. [Google Scholar]
- Kadali, B.R.; Vedagiri, P.; Rathi, N. Models for pedestrian gap acceptance behaviour analysis at unprotected mid-block crosswalks under mixed traffic conditions. Transp. Res. Part F Traffic Psychol. Behav. 2015, 32, 114–126. [Google Scholar] [CrossRef]
- Manual, H.C. HCM2010. Transportation Research Board; National Research Council: Washington, DC, USA, 2010. [Google Scholar]
- Demiroz, Y.I.; Onelcin, P.; Alver, Y. Illegal road crossing behavior of pedestrians at overpass locations: Factors affecting gap acceptance, crossing times and overpass use. Accid. Anal. Prev. 2015, 80, 220–228. [Google Scholar] [CrossRef]
- Parkin, J.; Clark, B.; Clayton, W.; Ricci, M.; Parkhurst, G. Understanding Interactions between Autonomous Vehicles and Other Road Users: A Literature Review. Available online: https://uwe-repository.worktribe.com/output/922216/understanding-interactions-between-autonomous-vehicles-and-other-road-users-a-literature-review (accessed on 14 April 2020).
- Chu, X.; Baltes, M.R. Pedestrian Mid-Block Crossing Difficulty; (No. NCTR-392-09); National Center for Transit Research, Center for Urban Transportation Research, University of South Florida: Tampa, FL, USA, 2001; Available online: https://www.nctr.usf.edu/wp-content/uploads/2012/07/392-14.pdf (accessed on 14 April 2020).
- Oxley, J.A.; Ihsen, E.; Fildes, B.N.; Charlton, J.L.; Day, R.H. Crossing roads safely: An experimental study of age differences in gap selection by pedestrians. Accid. Anal. Prev. 2005, 37, 962–971. [Google Scholar] [CrossRef]
- Lobjois, R.; Cavallo, V. Age-related differences in street-crossing decisions: The effects of vehicle speed and time constraints on gap selection in an estimation task. Accid. Anal. Prev. 2007, 39, 934–943. [Google Scholar] [CrossRef] [PubMed]
- Oxley, J. Age Differences in Road Crossing Behaviour. Unpublished Ph.D. Thesis, Monash University, Melbourne, Australia, 2000. [Google Scholar]
- Yannis, G.; Golias, J.; Papadimitriou, E. Modeling crossing behavior and accident risk of pedestrians. J. Transp. Eng. 2007, 133, 634–644. [Google Scholar] [CrossRef]
- Wang, W.; Guo, H.; Gao, Z.; Bubb, H. Individual differences of pedestrian behaviour in midblock crosswalk and intersection. Int. J. Crashworthiness 2011, 16, 1–9. [Google Scholar] [CrossRef]
- Ishaque, M.M.; Noland, R.B. Behavioural issues in pedestrian speed choice and street crossing behaviour: A review. Transp. Rev. 2008, 28, 61–85. [Google Scholar] [CrossRef]
- Papadimitriou, E.; Lassarre, S.; Yannis, G. Human factors of pedestrian walking and crossing behaviour. Transp. Res. Procedia 2017, 25, 2007–2020. [Google Scholar] [CrossRef]
- Liang, K.Y.; Zeger, S.L. Longitudinal data analysis using generalized linear models. Biometrika 1986, 73, 13–22. [Google Scholar] [CrossRef]
- Raff, M.S.; Hart, J.W. A Volume Warrant for Stop Signs; Eno Foundation for Highway Traffic Control: Saugatuck, CN, USA, 1950. [Google Scholar]


| Variable | Description | Measurement |
|---|---|---|
| Cumulative waiting time until each vehicle | Cumulative waiting time which is calculated for each individual gap faced by the pedestrian from formula: Car arrival time - pedestrian arrival time. Used in the Generalised Estimating Equations (GEE) binary model. | Seconds; continuous |
| Total waiting time | Total waiting time for each pedestrian until they accept a gap. Variable used in the linear regression model. | Seconds, continuous |
| Gender | As observed on video. | Categorical male and female |
| Age group | Pedestrians are categorised with approximation based on visual characteristics. Children supervised by adults were not included as separate pedestrians making decisions. | Categorical approximately: Young (17–35), middle age (35–55), old (55+) |
| Group size | For rejected gaps, this is the size of the group waiting to cross, on same side and opposite side of the road. For accepted gaps, the group size is the number of people who crossed together. If a pedestrian crossed on their own and other waiting pedestrians did not cross with them, then the group size for the accepted gap for the crossing pedestrian is 0. | Continuous |
| Time to cross (proxy for pedestrian speed) | Calculated from departure and completion times for crossing from curb/median | Seconds, continuous |
| Cross from curb/median | If the pedestrian was crossing from the curb or median. | Categorical curb and median |
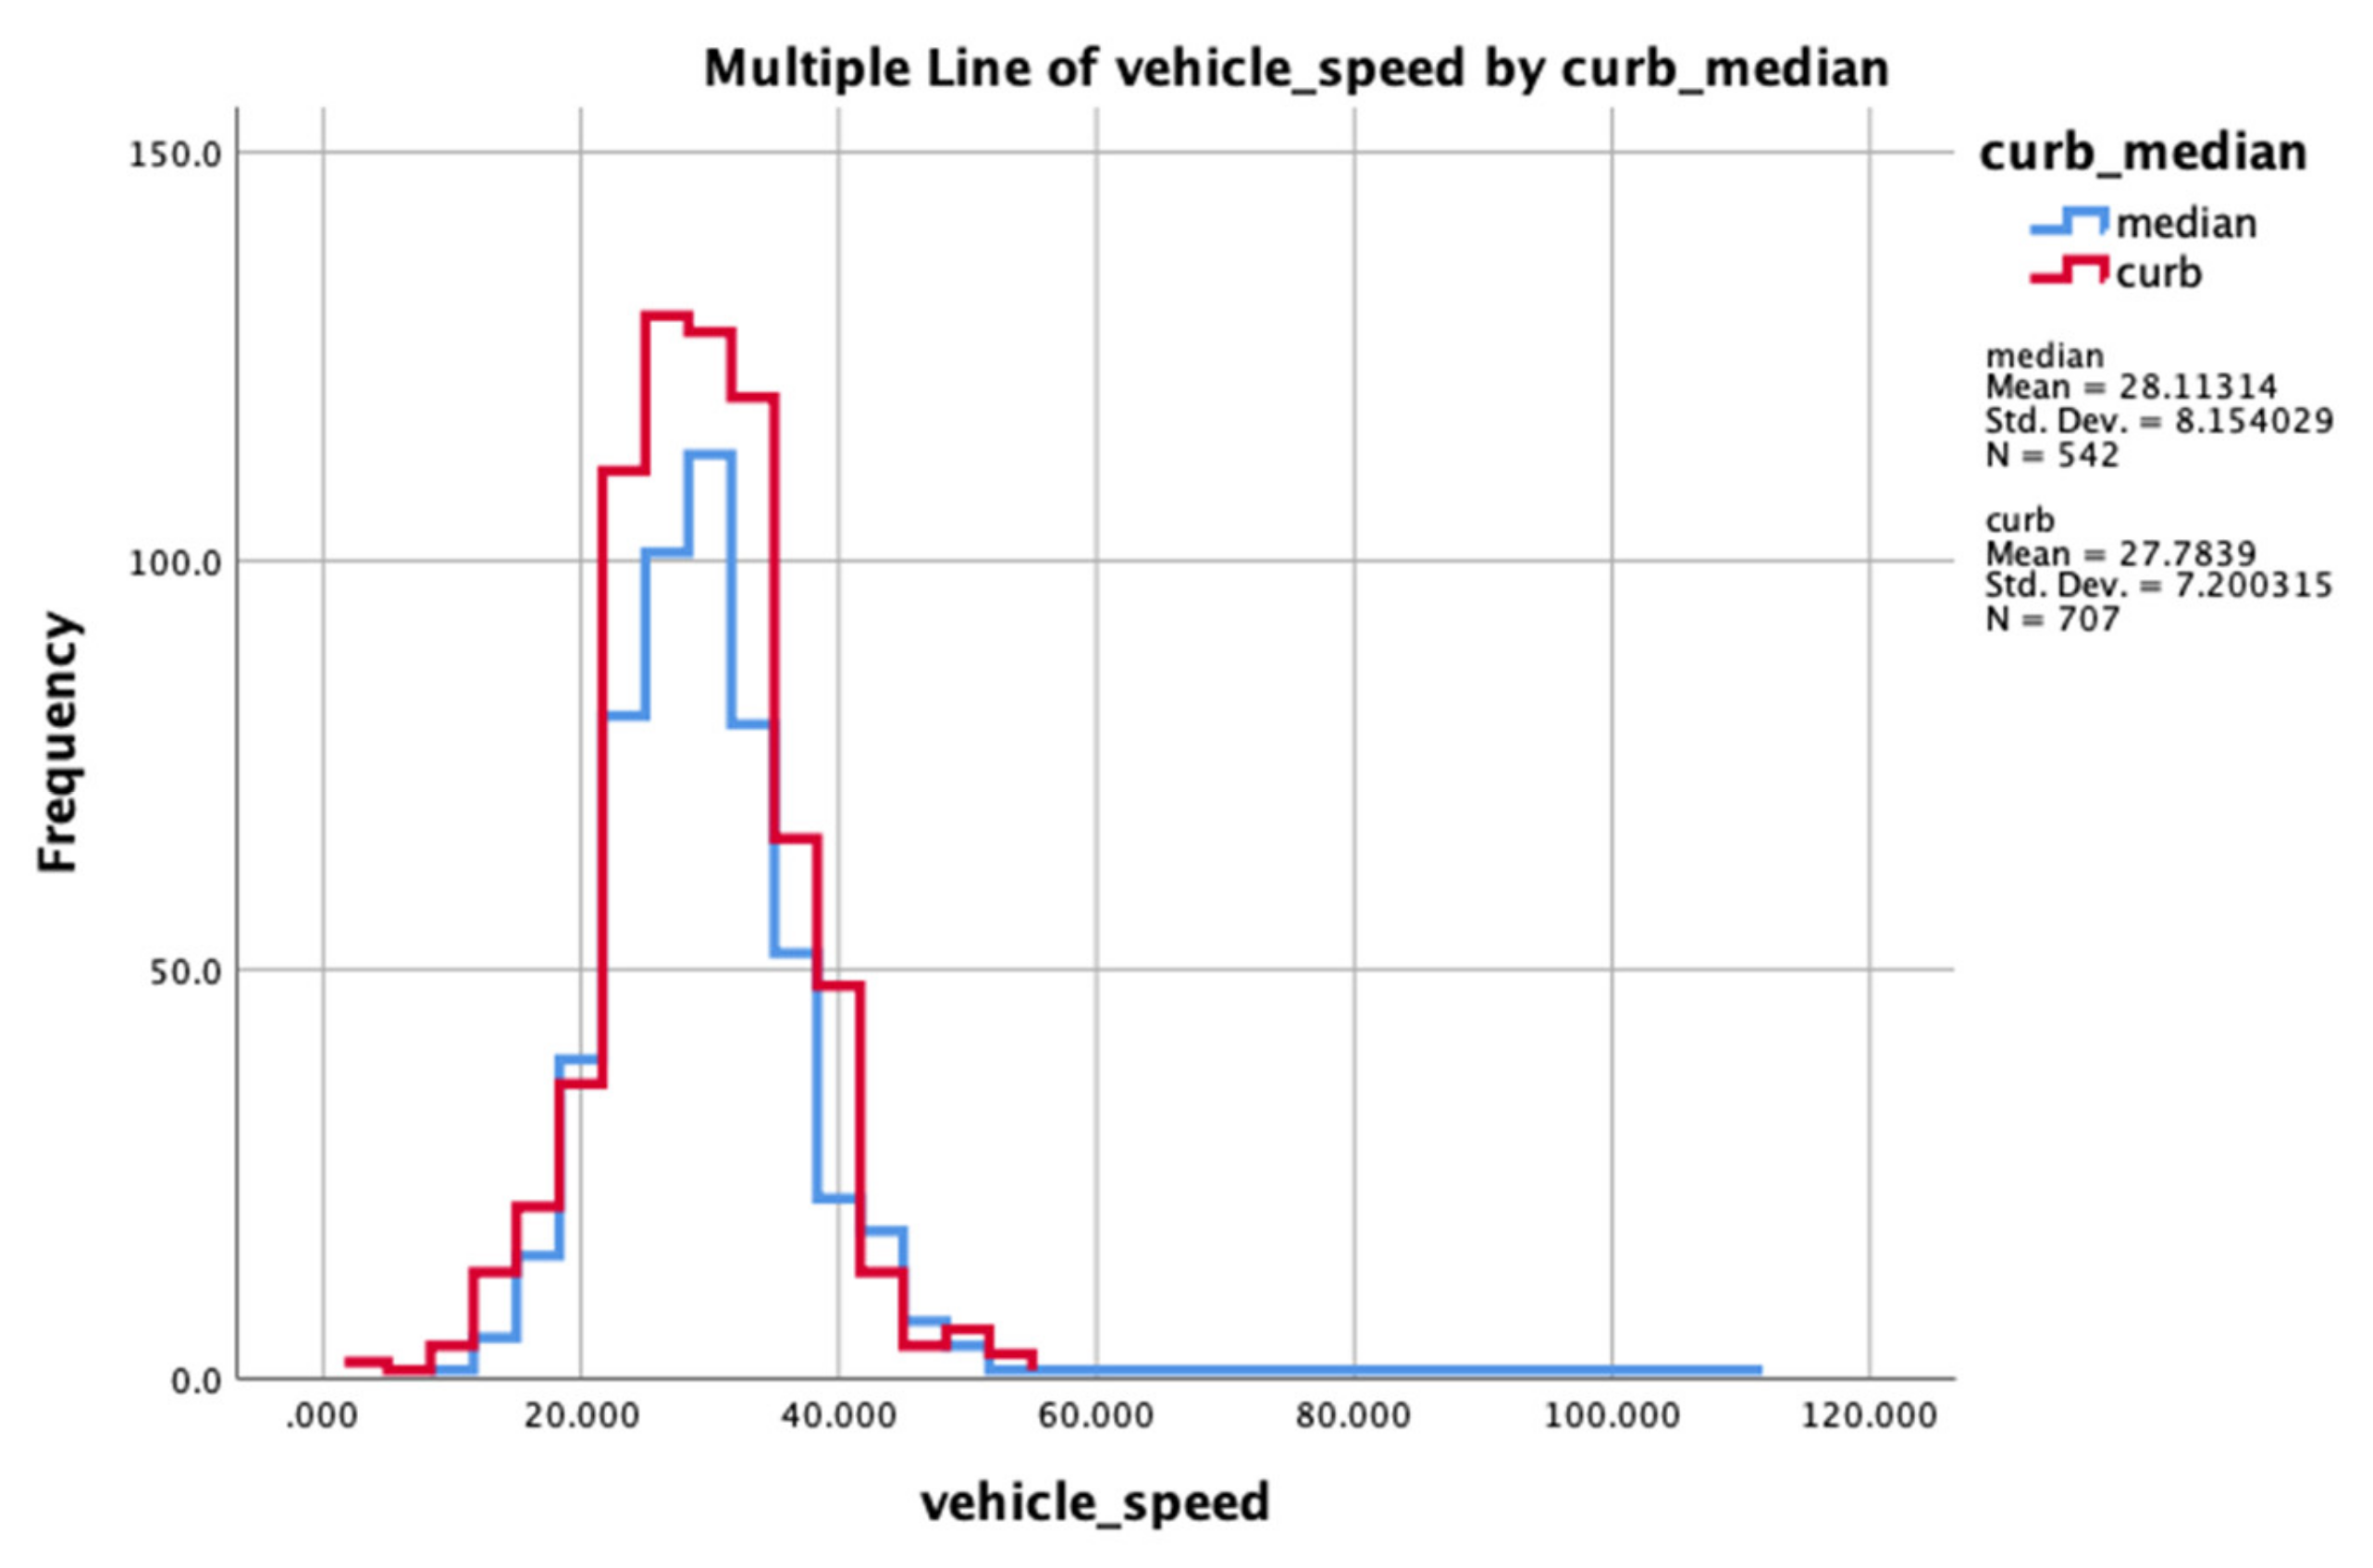
| Vehicle speed | Speed of vehicle measured from distance and time between two static points (first and last yellow lines shown on Figure 1). | km/h, continuous |
| Type of vehicle | Categorised as observed on video: Small (all cars, motorcycles and some small vans), medium (mostly vans or small service trucks), large (buses and most trucks). | Categorical small vehicle, medium vehicle, large vehicle |
| Accepted gap | The gap between pedestrian departure time from the curb and arrival of next vehicle. | Milliseconds, continuous |
| Rejected gaps | The elapsed time headway between the arrival of two successive vehicles at the hypothetical crossing line of the pedestrian. | Milliseconds, continuous |
| Variable | Accepted from Curb | Accepted from Median | Rejected from Curb | Rejected from Median |
|---|---|---|---|---|
| Number of gaps | 136 | 149 | 601 | 403 |
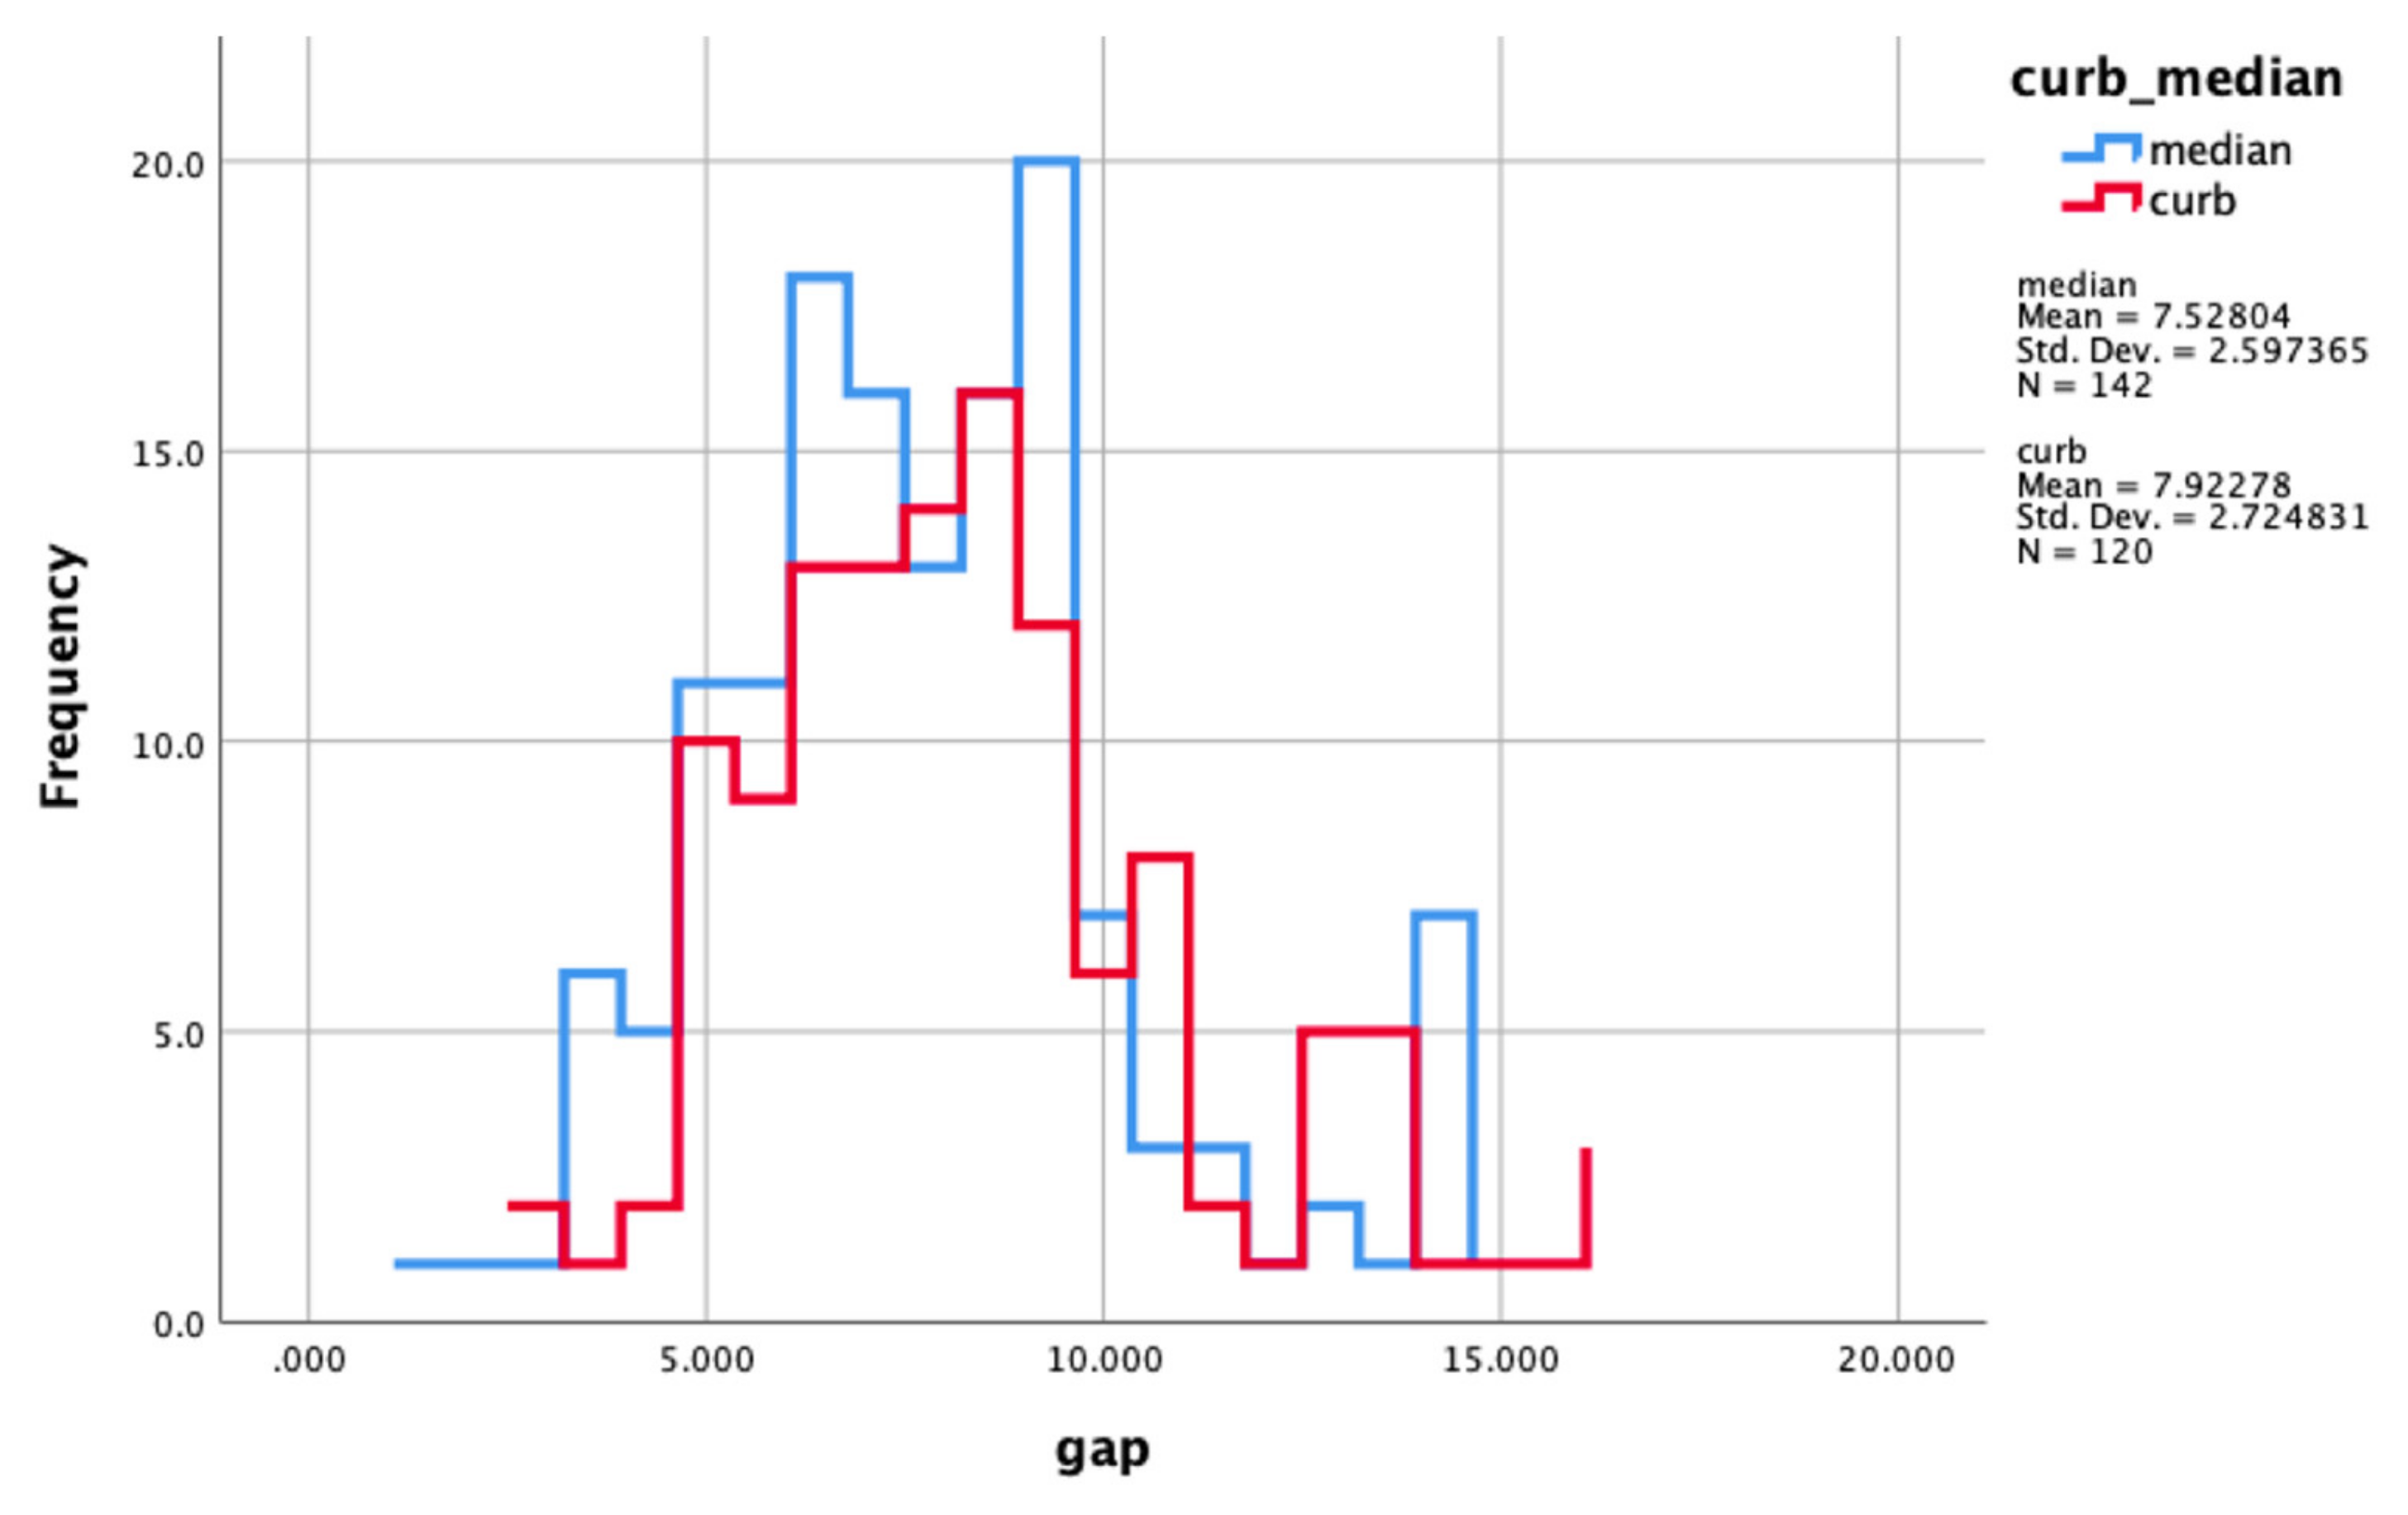
| Gap length (s) | ||||
| Mean | 7.922 | 7.528 | 3.391 | 3.473 |
| Standard deviation | 2.724 | 2.597 | 1.744 | 2.202 |
| Coefficient of variation | 0.344 | 0.345 | 0.514 | 0.633 |
| Vehicle speed (kmph) | ||||
| Mean | 27.554 | 29.198 | 27.831 | 27.700 |
| Standard deviation | 7.686 | 7.505 | 7.109 | 8.339 |
| Coefficient of variation | 0.279 | 0.267 | 0.255 | 0.301 |
| Variable | Curb | Median |
|---|---|---|
| Total waiting time (s) | ||
| Mean | 9.260 | 6.148 |
| Standard deviation | 11.480 | 8.993 |
| Coefficient of variation | 1.240 | 1.462 |
| Crossing time (s) | ||
| Mean | 3.357 | 3.722 |
| Standard deviation | 0.924 | 0.924 |
| Coefficient of variation | 0.275 | 0.269 |
| Time to Cross | Group Size (Same Side) | Waiting until Vehicle | Vehicle Speed | Gap | Total Waiting Time | ||
|---|---|---|---|---|---|---|---|
| Time to cross | Pearson Correlation | 1 | 0.113 | −0.026 | −0.047 | 0.219 ** | −0.05 |
| Sig. (2-tailed) | 0.069 | 0.673 | 0.45 | 0 | 0.426 | ||
| Group size | Pearson Correlation | 0.113 | 1 | 0.047 | −0.021 | 0.184 ** | −0.01 |
| Sig. (2-tailed) | 0.069 | 0.449 | 0.741 | 0.003 | 0.875 | ||
| Waiting until vehicle | Pearson Correlation | −0.026 | 0.047 | 1 | −0.165** | 0.154* | 0.690 ** |
| Sig. (2-tailed) | 0.673 | 0.449 | 0.007 | 0.012 | 0 | ||
| Vehicle Speed | Pearson Correlation | −0.047 | −0.021 | −0.165 ** | 1 | −0.129 * | −0.069 |
| Sig. (2-tailed) | 0.45 | 0.741 | 0.007 | 0.036 | 0.266 | ||
| Gap | Pearson Correlation | 0.219 ** | 0.184 ** | 0.154 * | −0.129 * | 1 | 0.095 |
| Sig. (2-tailed) | 0 | 0.003 | 0.012 | 0.036 | 0.127 | ||
| Total waiting time | Pearson Correlation | −0.05 | −0.01 | 0.690 ** | −0.069 | 0.095 | 1 |
| Sig. (2-tailed) | 0.426 | 0.875 | 0 | 0.266 | 0.127 |
| Gap | |||
|---|---|---|---|
| Predictors | Estimates | CI | p |
| Intercept | 4.77 | 3.55–5.99 | <0.001 |
| Curb/Median | 0.74 | 0.10–1.38 | 0.023 |
| Group | 0.41 | 0.14–0.67 | 0.003 |
| Time to Cross | 0.57 | 0.26–0.87 | <0.001 |
| Observations 261 | |||
| R2/R2 adjusted 0.092/0.082 | |||
| F-statistic: 8.722 on 3 and 257 DF, p-value: 1.569e-05 | |||
| Choice | |||
|---|---|---|---|
| Predictors | Estimates | CI | p |
| Intercept | −0.09 | −0.22–0.05 | 0.193 |
| Gap | 0.09 | 0.08–0.10 | 0.023 |
| Curb/Median | −0.08 | −0.12–−0.04 | 0.003 |
| Group | −0.02 | −0.04–−0.00 | <0.001 |
| Time to cross | −0.04 | −0.06–−0.01 | |
| Vehicle speed | 0.00 | 0.00–0.01 | |
| Nped_no 489 | |||
| Observations 1244 | |||
| Choice | |||
|---|---|---|---|
| Predictors | Estimates | CI | p |
| Intercept | 0.03 | −0.07–0.13 | 0.567 |
| Gap | 0.09 | 0.09–0.10 | <0.001 |
| Curb/Median | −0.07 | −0.11–−0.03 | <0.001 |
| Group | −0.02 | −0.04–0.00 | 0.053 |
| Time to cross | −0.03 | −0.05–−0.01 | 0.001 |
| Waiting until vehicle | 0.00 | −0.01–−0.00 | 0.003 |
| Nped_no 489 | |||
| Observations 1244 | |||
| Choice | |||
|---|---|---|---|
| Predictors | Estimates | CI | p |
| Intercept | −0.07 | −0.20–0.06 | 0.282 |
| Gap | 0.10 | 0.09–0.10 | <0.001 |
| Curb/Median | −0.07 | −0.11–−0.03 | <0.001 |
| Group | −0.02 | −0.03–0.00 | 0.093 |
| Time to cross | −0.03 | −0.05–−0.01 | 0.002 |
| Vehicle Speed | 0.00 | 0.00–0.01 | 0.029 |
| Waiting until vehicle | 0.00 | −0.01–0.00 | 0.004 |
| Nped_no 489 | |||
| Observations 1244 | |||
| Choice | |||
|---|---|---|---|
| Predictors | Estimates | CI | p |
| Intercept | −0.11 | −0.23–0.02 | 0.092 |
| Gap | 0.09 | 0.09–0.10 | <0.001 |
| Curb/Median | −0.07 | −0.10–−0.03 | 0.001 |
| Time to cross | −0.03 | −0.05–−0.01 | 0.002 |
| Vehicle Speed | 0.00 | 0.00–0.01 | 0.020 |
| Waiting until vehicle | 0.00 | −0.01–0.00 | 0.002 |
| Nped_no 489 | |||
| Observations 1244 | |||
© 2020 by the authors. Licensee MDPI, Basel, Switzerland. This article is an open access article distributed under the terms and conditions of the Creative Commons Attribution (CC BY) license (http://creativecommons.org/licenses/by/4.0/).
Share and Cite
Saleh, W.; Grigorova, M.; Elattar, S. Pedestrian Road Crossing at Uncontrolled Mid-Block Locations: Does the Refuge Island Increase Risk? Sustainability 2020, 12, 4891. https://doi.org/10.3390/su12124891
Saleh W, Grigorova M, Elattar S. Pedestrian Road Crossing at Uncontrolled Mid-Block Locations: Does the Refuge Island Increase Risk? Sustainability. 2020; 12(12):4891. https://doi.org/10.3390/su12124891
Chicago/Turabian StyleSaleh, Wafaa, Monika Grigorova, and Samia Elattar. 2020. "Pedestrian Road Crossing at Uncontrolled Mid-Block Locations: Does the Refuge Island Increase Risk?" Sustainability 12, no. 12: 4891. https://doi.org/10.3390/su12124891
APA StyleSaleh, W., Grigorova, M., & Elattar, S. (2020). Pedestrian Road Crossing at Uncontrolled Mid-Block Locations: Does the Refuge Island Increase Risk? Sustainability, 12(12), 4891. https://doi.org/10.3390/su12124891