Article

Circles of Coastal Sustainability: A Framework for Coastal Management

by
Natália M. P. de Alencar
1,2,*,
Martin Le Tissier
3,
Shona K. Paterson
4 and
Alice Newton
1
1
CIMA, Gambelas Campus, University of Algarve, Faro 8005-139, Portugal
2
Faculty of Marine and Environmental Sciences, University of Cádiz, Polígono Río San Pedro, s/n, 11510 Puerto Real, Cádiz, Spain
3
MaREI, the SFI Research Centre for Energy, Climate and Marine, Environmental Research Institute, University College Cork, P43-C573 Cork, Ireland
4
College of Business, Arts and Social Sciences, Brunel University London, Uxbridge UB8 3PH, UK
*
Author to whom correspondence should be addressed.
Sustainability 2020, 12(12), 4886; https://doi.org/10.3390/su12124886
Submission received: 10 May 2020 / Revised: 2 June 2020 / Accepted: 3 June 2020 / Published: 15 June 2020
(This article belongs to the Section Environmental Sustainability and Applications)

Abstract

:
The coastal zone is a space where many social, economic, and political activities intersect with natural processes. In this paper, we present an adaptation of the method of ‘Circles of Sustainability’, used to provide a visual assessment of indicators that define sustainability profiles for cities. It is used as a basis for a ‘Circles of Coastal Sustainability’ (CCS) framework that can be used at multiple spatial scales to assess indicators of critical processes that facilitate/constrain sustainability of the world’s coastal zones. The development of such a framework can support management by identifying key features that influence environmental sustainability and human well-being. CCS presents a holistic assessment of four interdependent boundary domains: Environment and Ecology, Social and Cultural, Economics, and Governance and Policy. This approach improves its utility and usability for decision-makers and researchers. CCS adds to existing assessment frameworks that are often focused on particular themes and/or domains that confine their utility to the context of sustainable development and the UN Agenda 2030 Sustainable Development Goals, which demand an inherently holistic and integrated evaluation. CCS is a holistic framework designed to assess the boundaries to sustainability for socio-ecological systems at multiple scales for the world’s coasts.

1. Introduction

The coastal zones of the world include the ecosystems and socio-economic systems most at threat from the impacts of global environmental change [1,2], and they require a deep understanding of the interrelations between social, economic, political, and environmental dimensions for effective management [3,4]. The biophysical aspects of coastal systems are characterized by constant change: Both natural and anthropogenic drivers lead to material and resource fluxes across the land–ocean interface [5]. Critical goods and services from coastal and marine ecosystems, such as the storage and cycling of nutrients, exploitable resources, filtering of pollutants from inland freshwater systems, and the protection of coastal assets from erosion and storms, are estimated to contribute about 2.5 trillion USD to the global economy each year with a total asset base of at least 24 trillion USD [6]. Coasts also represent recreational, aesthetic, cultural, and spiritual spaces, providing specific senses of place and well-being [7] as well as ‘‘coastal lifestyles’’ [8]. International efforts call for progress to be made towards a more resilient and sustainable future worldwide, including the Sustainable Development Goals (SDGs), the Convention on Biological Diversity (CBD), and the COP21 Paris agreement. However, the magnitude and rate of change of environmental systems induced by human activities have intensified over the last 150 years, leading to significant changes in the structure and functioning of coastal zones. These produce approximately 90% of global fisheries and include nearly 50% of the human population and 75% of megacities, threatening their sustainability as places for human development and well-being [9].
Conflicts concerning ecosystem health and human well-being are recurrent [10]. However, the fragmented nature of governance and management activities in marine and coastal zones has been identified as one of the main limitations to sustainability [11,12]. Increasing demand for resources has led to more stringent public policies to regulate the use of, or access to, natural resources [13] to address the finite character of resources, as well as the limits to the carrying capacity of coastal systems to sustain human activities at different scales.
Sustainable development at the coast requires a holistic perspective that inculcates social/cultural, economic, and governance dimensions as well as environmental dimensions [14,15]. This is necessary to balance good environmental quality status, which enables the provision of ecosystem services, good social development status, and an economic system that focuses on human well-being in a just and participative governance system, as opposed to limitless growth [14,16]. Management of complex systems, including coastal zones, requires data that can lead to understanding across multiple disciplines to link the environment with societal activities, but these have traditionally been difficult to generate [17]. It is important to see data not as individual inputs, but as part of a systems approach that integrates diverse components of coupled human and natural systems to understand socioeconomic and environmental interconnections and to create sustainability solutions [18,19]. Such a systems approach can enable discussions on the current status and future sustainability pathways across all disciplines using the best available information, including expert judgement [4]. The application of an integrated framework does not negate the need for data and disciplinary enquiry, but should rather be viewed as a tool to enquire across disciplines in order to discover emergent properties and complexity. These include: interconnections among multiple key issues; assessment of multiple, often conflicting, objectives; and synergistic interactions to enhance efficiency in one domain while mitigating impacts in others [19,20].
There is no single framework at present to assess status across all dimensions of sustainable development at the coast, although there is a wealth of literature addressing individual sustainability dimensions of coasts. Recent literature highlights the need to address multidisciplinary analysis encompassing the trade-offs between ecosystem services and human wellbeing [21,22]. This article results from a review of existing thematic frameworks and a synthesis to develop a framework that provides a holistic sustainability profile for any given coastal region/locality. This holistic framework, the Circles of Coastal Sustainability (CCS), uses and augments the concept of Circles of Sustainability [23], a method designed to assess domains of ecology, economics, politics, and culture to understand complexity across multiple dimensions and achieve socially and environmentally sustainable outcomes. The framework application is demonstrated through the presentation of a case study that explores limitations and strengths as well as usefulness.

2. Assessment Gap Analysis

Frameworks developed to assess multi-dimensional issues, like sustainability or human well-being, often emphasize either social or environmental perspectives [24,25] or address specific management issues, such as eutrophication [26] or marine litter [27]. This limits the utility of existing frameworks to provide holistic and integrated evaluation, which is needed to define solutions in the context of sustainable development and the SDGs [28], as well as balancing multiple competing and potentially conflicting public goals [29], in order to connect human development with capacity in natural systems to sustain progress [30,31].
Some frameworks go beyond monitoring environmental quality to identify the causes and consequences linked to socio-economic aspects, connecting scientific findings with ‘real-world’ issues, thereby providing a more useful and informed scientific base for resource management decisions [27]. Examples such as the DPSIR (Drivers–Pressures–State–Impact–Response) framework and the Systems Approach Framework (SAF) [4,26,32] span a variety of scales, approaches, and timeframes (see Table 1). Although such frameworks have been used in assessment processes—for instance, the World Ocean Assessment—to incorporate both natural and social aspects of ecosystems, it remains difficult to balance these aspects; often, social aspects are not sufficiently considered.
The Ocean Health Index (OHI) [29] is an example that demonstrates the complexity encountered with approaches like this. The OHI is a visual representation for ongoing assessment of ocean health with respect to ten well-accepted societal goals, closely linked to the ecosystem services concept [33]. It was designed to be a key benchmark against which to compare future progress and to inform comprehensive ocean policy. The index assesses, rather than models, current and future conditions, so it is not a prediction tool, although it does include trends. The OHI includes negative impacts exerted on the oceans as well as the tangible and less-tangible benefits derived from the oceans. OHI assessments use existing information, so the assessments reflect the best available knowledge of the system at the time of the assessment, and are updated regularly. This can require indirect measures to be included in assessments when the direct measures that would ideally be included are unavailable. Thus, the OHI outputs are heavily linked to the quality of the data inputs. The general consensus of reviewers is an acknowledgement of the OHI as a good visual tool, but the complex underlying statistics are based on assumptions that are easily distorted by data quality [34].
A review of other multi-dimensional approaches, analyzed for key focuses and limitations providing comparisons and contrasts, demonstrates the need for a unifying, locally adaptable framework to assess and evaluate sustainability status and options in coastal social–ecological systems. This holistic picture of the state of sustainability of any coastal zone would provide a transformative pathway for transdisciplinary assessment (Table 1). Such a framework should not be constrained by data availability or by traditional disciplinary segregation and segmentation of data and enquiry, which lead to discipline-specific perspectives of what constitutes sustainability of coastal zones.

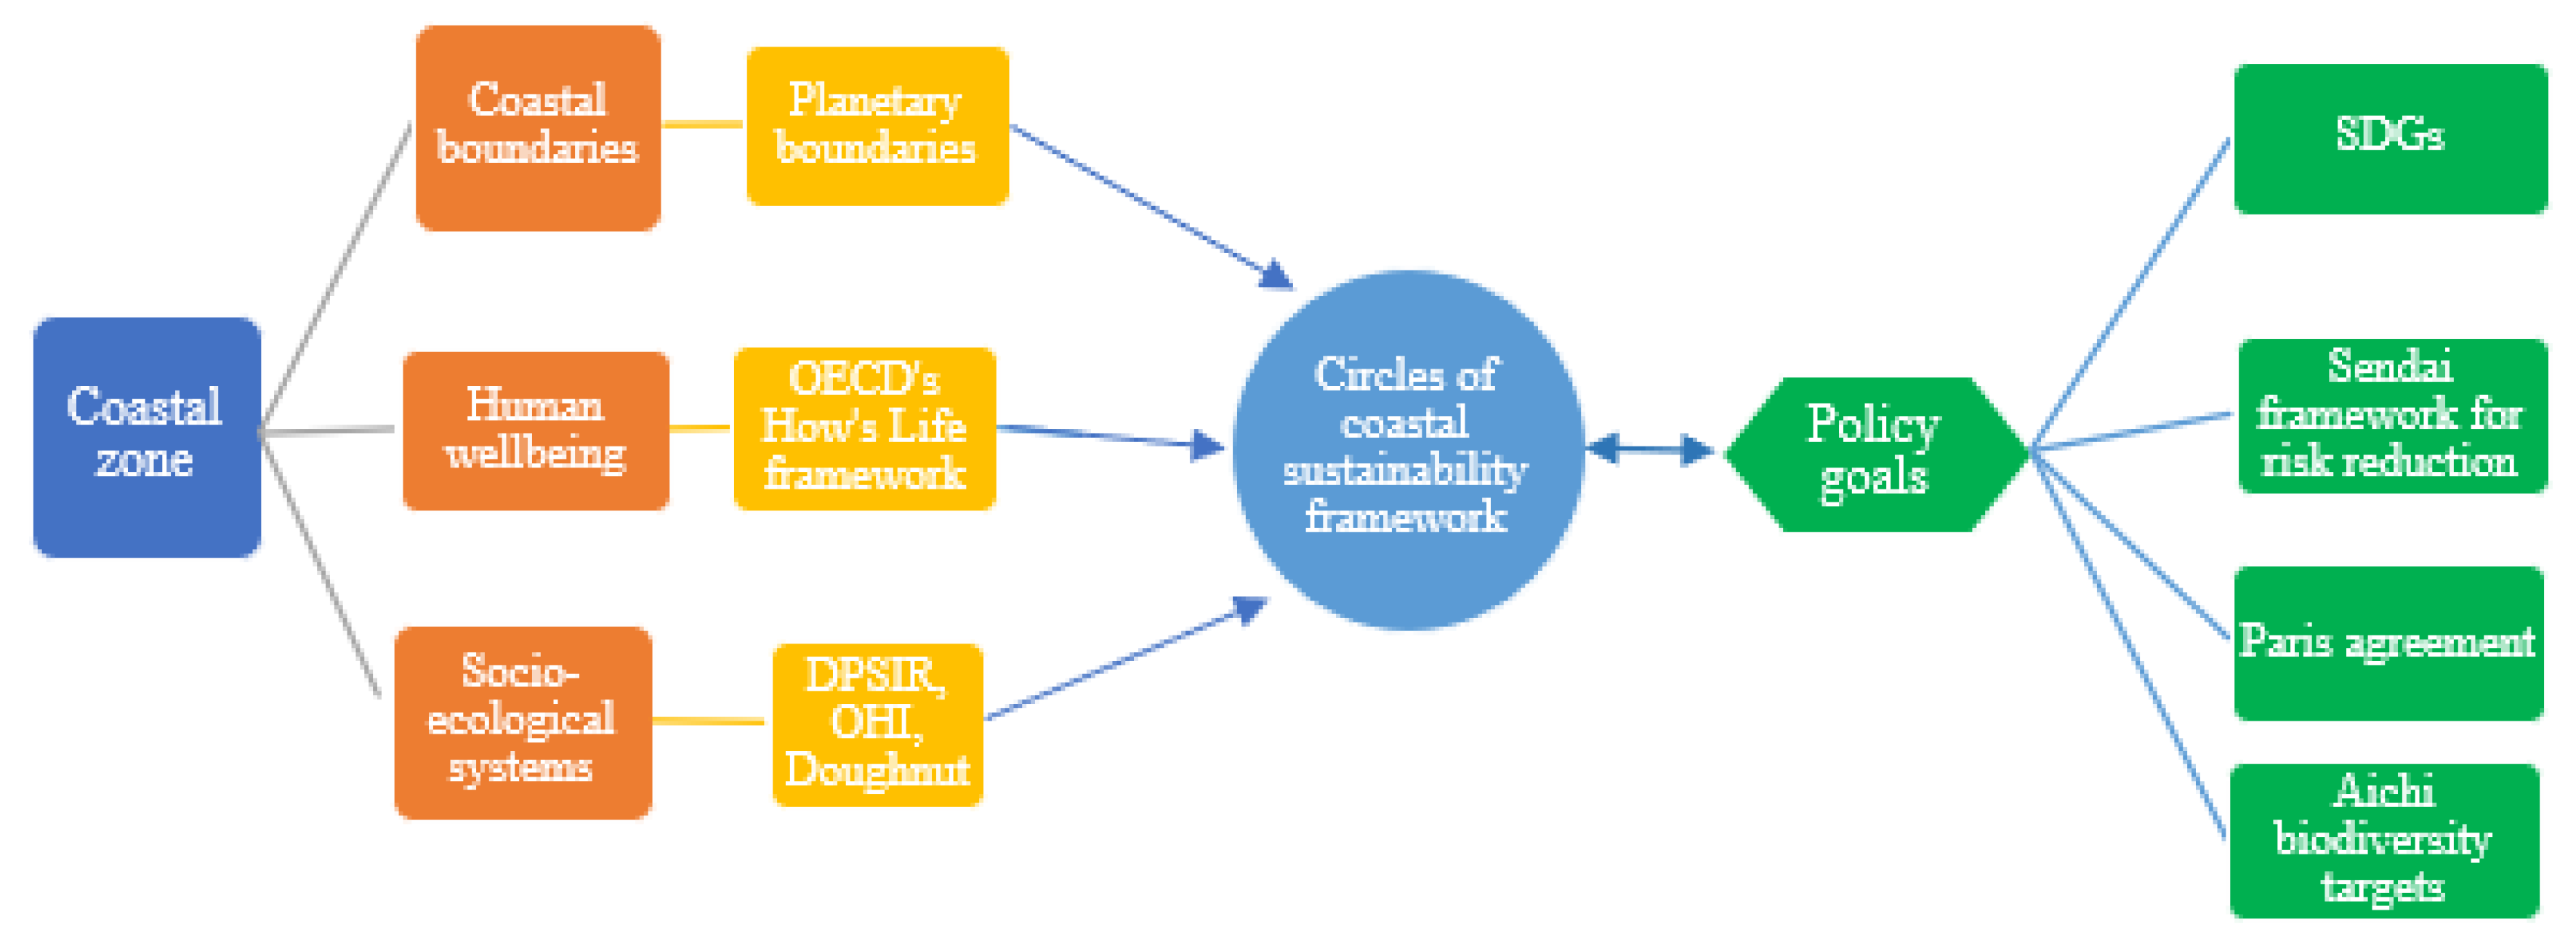
3. The Circles of Coastal Sustainability Approach

A holistic coastal sustainability framework would incorporate international policy goals, e.g., the Sustainable Development Goals (SDGs). It would have the potential to improve the sustainability and management of coastal ecosystems through improved forecasts of change and impacts, as well as providing an overarching mechanism to evaluate the appropriateness of interventions and responses at scale (Figure 1). The SDGs, the Sendai Framework for Disaster Risk Reduction, Paris Agreement, and Aichi biodiversity targets are all examples of international policies designed to tackle societal challenges, such as climate change, extreme events, poverty, marine systems, and health demands [40]. These international agendas demand innovative and multidisciplinary solutions that provide a unifying structure and identify the critical need for pathways to transform at the macro scale [41]; these can be used as policy objectives from an integrated assessment process to achieve sustainable development.
The CCS logic is based upon the concept of a ‘dashboard’, which is common to other frameworks (e.g., [23,29,35]); this summarizes the outputs from an array of information sources [42]. Sustainability is often characterized as coevolution of economic, social, and environmental systems respecting a dynamic ‘triple bottom line’ to attain quality/performance sustainability goals [43]. However, regulation and governance of these three spheres do not happen organically, leading to demarcation of a fourth fundamental category of organization, the political sphere. The role of the political sphere is the regulation of the economic and social spheres and thus of relations with (and within) the environmental sphere [op.cit.]. Such an approach also supports an interdisciplinary organization that includes policy and economics [44,45,46] to describe four interdependent boundary domains for the CCS. These determine whether humanity can continue to develop and thrive [47,48]: (i) Environment and Ecology, (ii) Social and Cultural, (iii) Economics, and (iv) Governance and Policy (Figure 2). An analysis across these four domains is compatible with concepts of ecosystem services that describe “the benefits that people obtain from ecosystems”, classified as supporting services (e.g., nutrient cycling), regulating services (e.g., climate regulation), provisioning services (e.g., food), and cultural services (e.g., recreation) [49].

3.1. CCS Methodology and Interdependency between Domains

The categories of the four domains of the framework are modified to be applied to a coastal setting based on the gap analysis (Table 1) and a series of discussions held between the multi-disciplinary Scientific Committee of Future Earth Coasts (www.futureearthcoasts.org) in 2016. The categories (Figure 2) are generic qualities of sustainability that are sensitive to a range of scales, from local to national and regional conditions, and that can be represented in a way that increases transparency across sectors and scales. The coastal context for each domain and its categories is explained below. The design of the CCS is cognizant of the principles of sustainability assessment. These call for the evaluation of the carrying capacity of system components in order to define the boundaries/thresholds of sustainability and the interconnectedness between coupled environment–human systems to inform decision-making and policy development [50] in the complex context of coastal zones.
Assessment of the categories and analysis across the four domains allows a method of enquiry that transcends reductionist analyses of the traditional narrow fields of individual sciences and sectors by providing a holistic approach to problem-solving, based on a systemic exploration in both the economic and social domains as well as in environmental, political, and ecological areas [51]. The notion of assessment processes to address sustainability of any given domain has increasingly become of interest since the Club of Rome “Limits to growth” report in 1972 [52]. The choice of measurable sub-categories that can summatively be used to define the status of categories and domains of the CCS has been formed on the basis of defining classifications that reflect different levels of resilience, resistance, and hysteresis of local specificity [42]. Concepts such as sustainable development and the tools to achieve it, such as the SDGs, are, in fact, moving concepts, rather than a fixed destination; therefore, continual review of indicators for the CCS is necessary to ensure progress both in terms of achievement as well as direction (priorities at scale). Thus, the framework (Figure 2) presents fixed domains and categories, but allows indicators to be selected based upon local specificity and data availability. Such an architecture of assessment addresses the spectrum of interacting biophysical, social, economic, and governance issues whilst avoiding reductionist efforts focused on individual components that can overlook critical interactions [53].

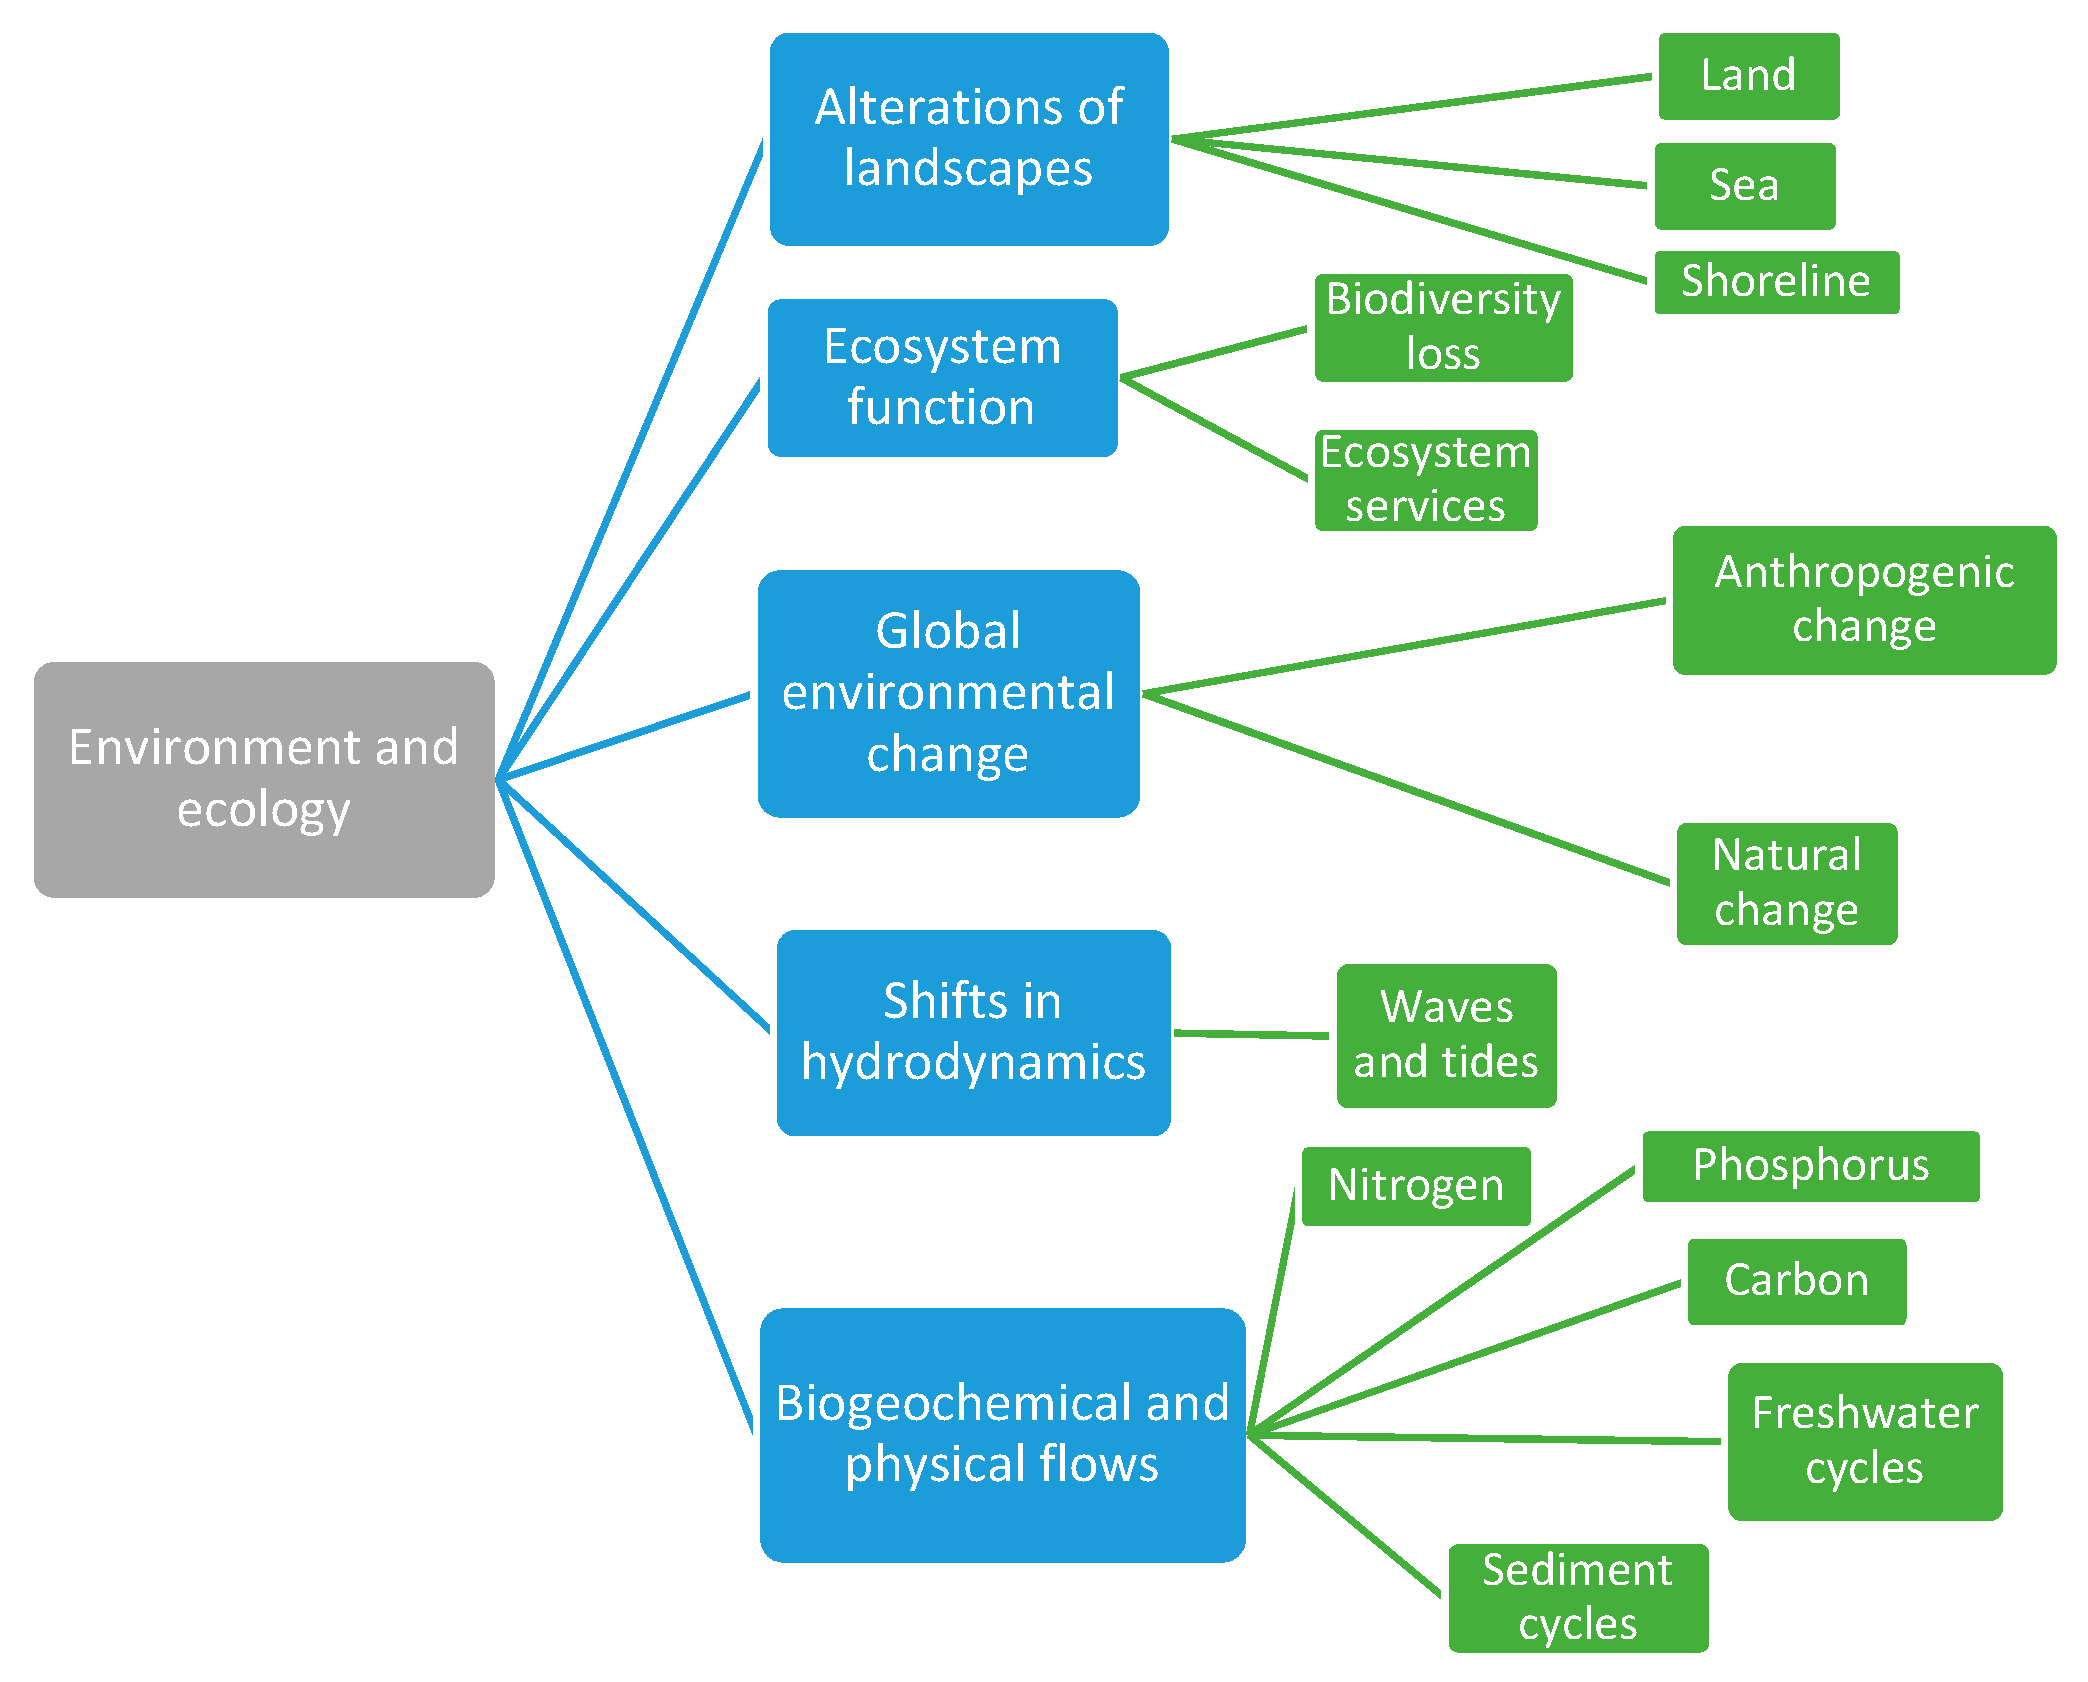
3.1.1. Coastal Context for the ‘Environment and Ecology’ Category

Healthy ecosystems provide opportunities for basic human needs and well-being [54] through the provision of water, food, and shelter [55]. Coastal ecosystems are particularly sensitive to change, and this is exacerbated by increasing anthropogenic pressures. The protection of coastal and marine ecosystems, which support climate change mitigation and the livelihoods of around 3 billion people [28], is encompassed within SDG 14 (Life below Water) and is linked to most of the other 16 SDGs [56]. Examples of exogenic, non-manageable environmental changes [32] that threaten ecosystem service provision include increased sea surface temperature (SST), which also causes sea level rise (SLR) from thermal expansion. SLR threatens coastal populations and uses, putting human settlements at risk, especially in low-lying coasts and islands [57]. For example, Bangladesh has experienced losses in infrastructures, properties, and crops due to flooding events, which are likely to increase with SLR, pressuring its densely populated, complex, coastal, socio-ecological system (SES) [58]. SLR also influences freshwater provision through saltwater intrusion of coastal aquifers [59].
Coastal ecosystems often provide multiple services, from subsistence to recreation, which have been debated in recent literature [21,22]. For instance, mangroves and other wetlands provide not only coastal protection to human settlements and lives from extreme events, such as storm surges and cyclones, but also provide climate mitigation services [60]. Many anthropogenic activities alter natural processes and cycles at the coast. For example, dams disrupt sediment fluxes in coastal areas [61]. Other examples include river channelizing and impermeable surfaces in coastal cities that exacerbate flooding events [60]. Assessing and monitoring the occurrence of these issues is necessary for implementing measures for their prevention and mitigation, while also promoting human well-being. Figure 3 shows the suggested sub-categories for each category of the Environment and Ecology domain. It intends to guide managers in the search for appropriate indicators available in their region.

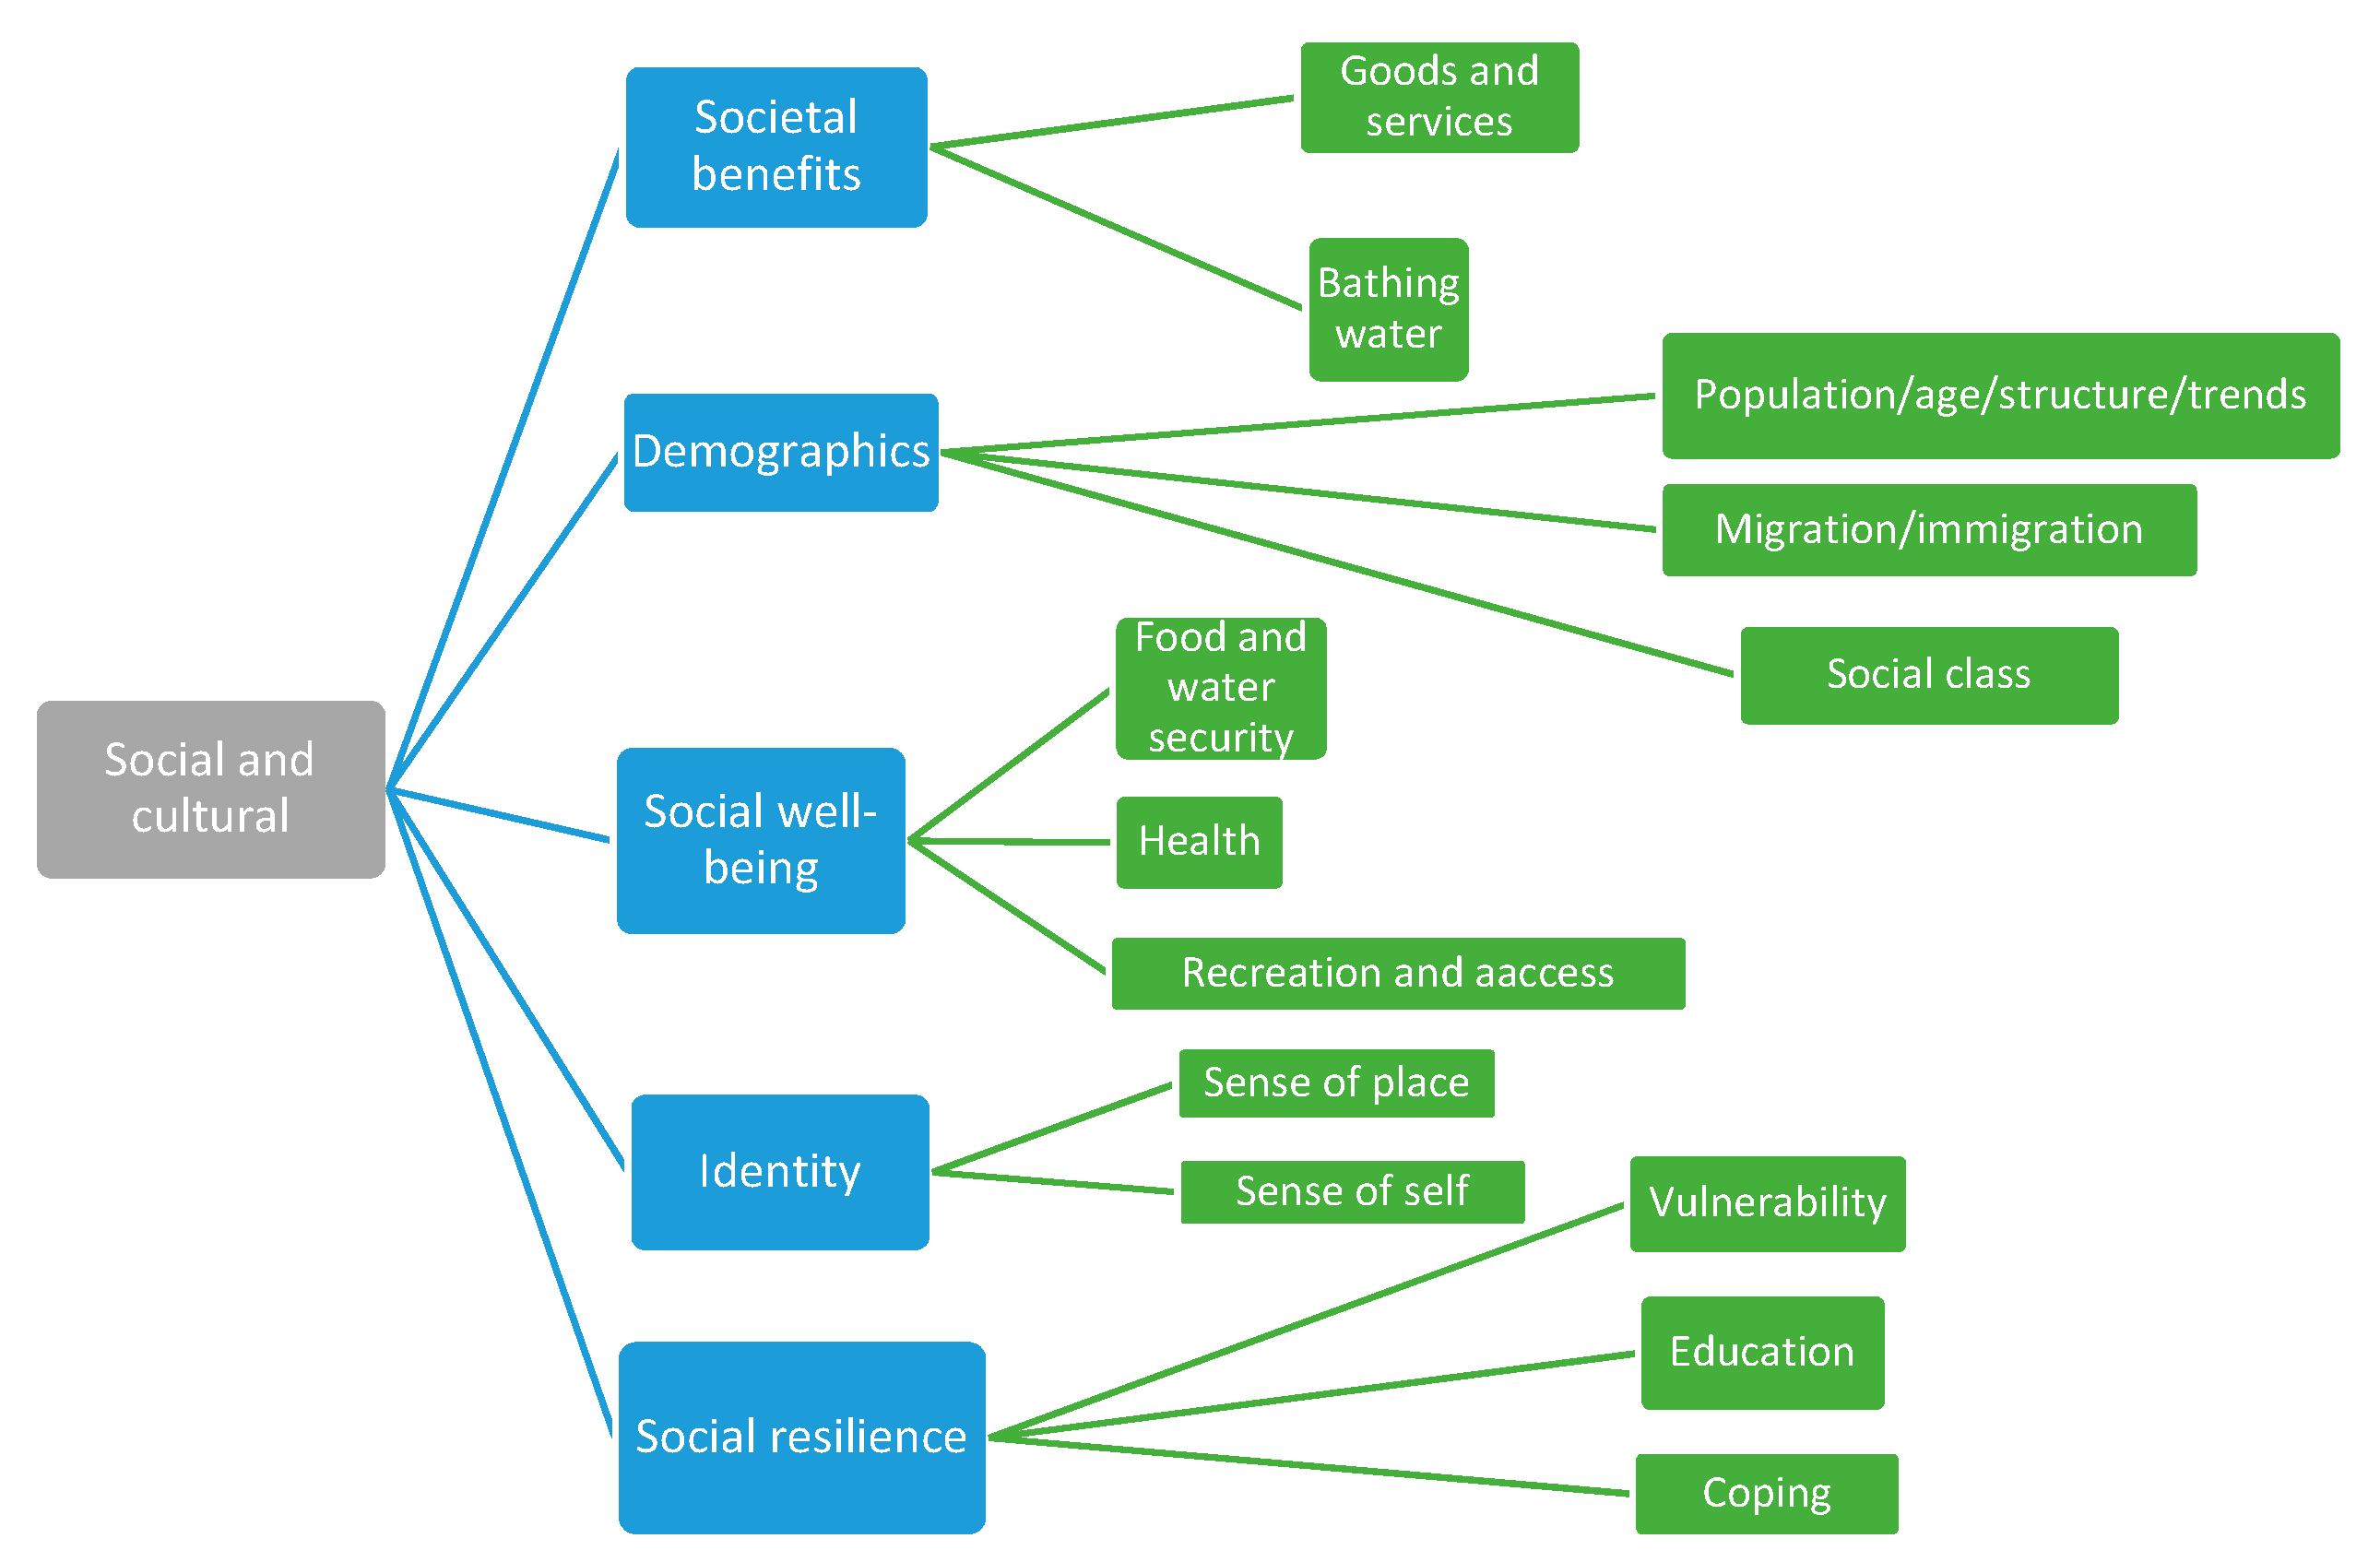
3.1.2. Coastal Context for the ‘Social and Cultural’ Category

Social and cultural aspects are considered in two ways within the framework: First, in the context of benefits derived by humans from coastal ecosystem services to satisfy basic needs of food, water, and health security [32]; second, the degree of resilience to change by coastal populations in the form of education level, poverty, and vulnerability. This rationale follows Raworth’s approach of “safe and just space for humanity within planetary boundaries” described by the Doughnut of Social and Planetary Boundaries Framework [38]—for example, in a socially sustainable area where wastewater treatment and litter collection are efficient, recreational activities are boosted with good health, bathing water quality, and clean beaches. Such conditions also attract visitors, contributing to the local economy and coastal livelihoods [55]. Anthropogenic pressures can lead to higher demands for freshwater, wastewater treatment, and litter collection that may not be met in practice, bringing water scarcity and pollution risks. This is the reality of coastal cities like Barcelona, which has depended on desalination plants to complement the freshwater supply of the area since 2009 [62].
Social and cultural change is often linked to environmental change. For instance, anthropogenic change leading to shoreline alteration, river channelization, and soil impermeabilization increases the risks of flooding, thus putting vulnerable populations at risk. The Mekong River Delta in Vietnam is one of the most densely populated low-lying areas in the world, playing a crucial role in food security and socio-economic development of the region. For this reason, SLR projections pose a big threat to coastal communities in the region, especially in less adaptable areas where poor households are located [63], exacerbating the impact of poverty as a result of the higher health risks associated with floods and polluted water [60].
Figure 4 shows the suggested sub-categories for each category of the Social and Cultural domain. These establish clear links between the provision of ecosystem services, such as sea food and clean waters, with the societal benefits of continuous food provision and good bathing quality for recreation. It acts as a first guide for managers in search of appropriate indicators to perform a holistic assessment of how coastal communities’ social wellbeing is influenced by the environment and vice-versa.

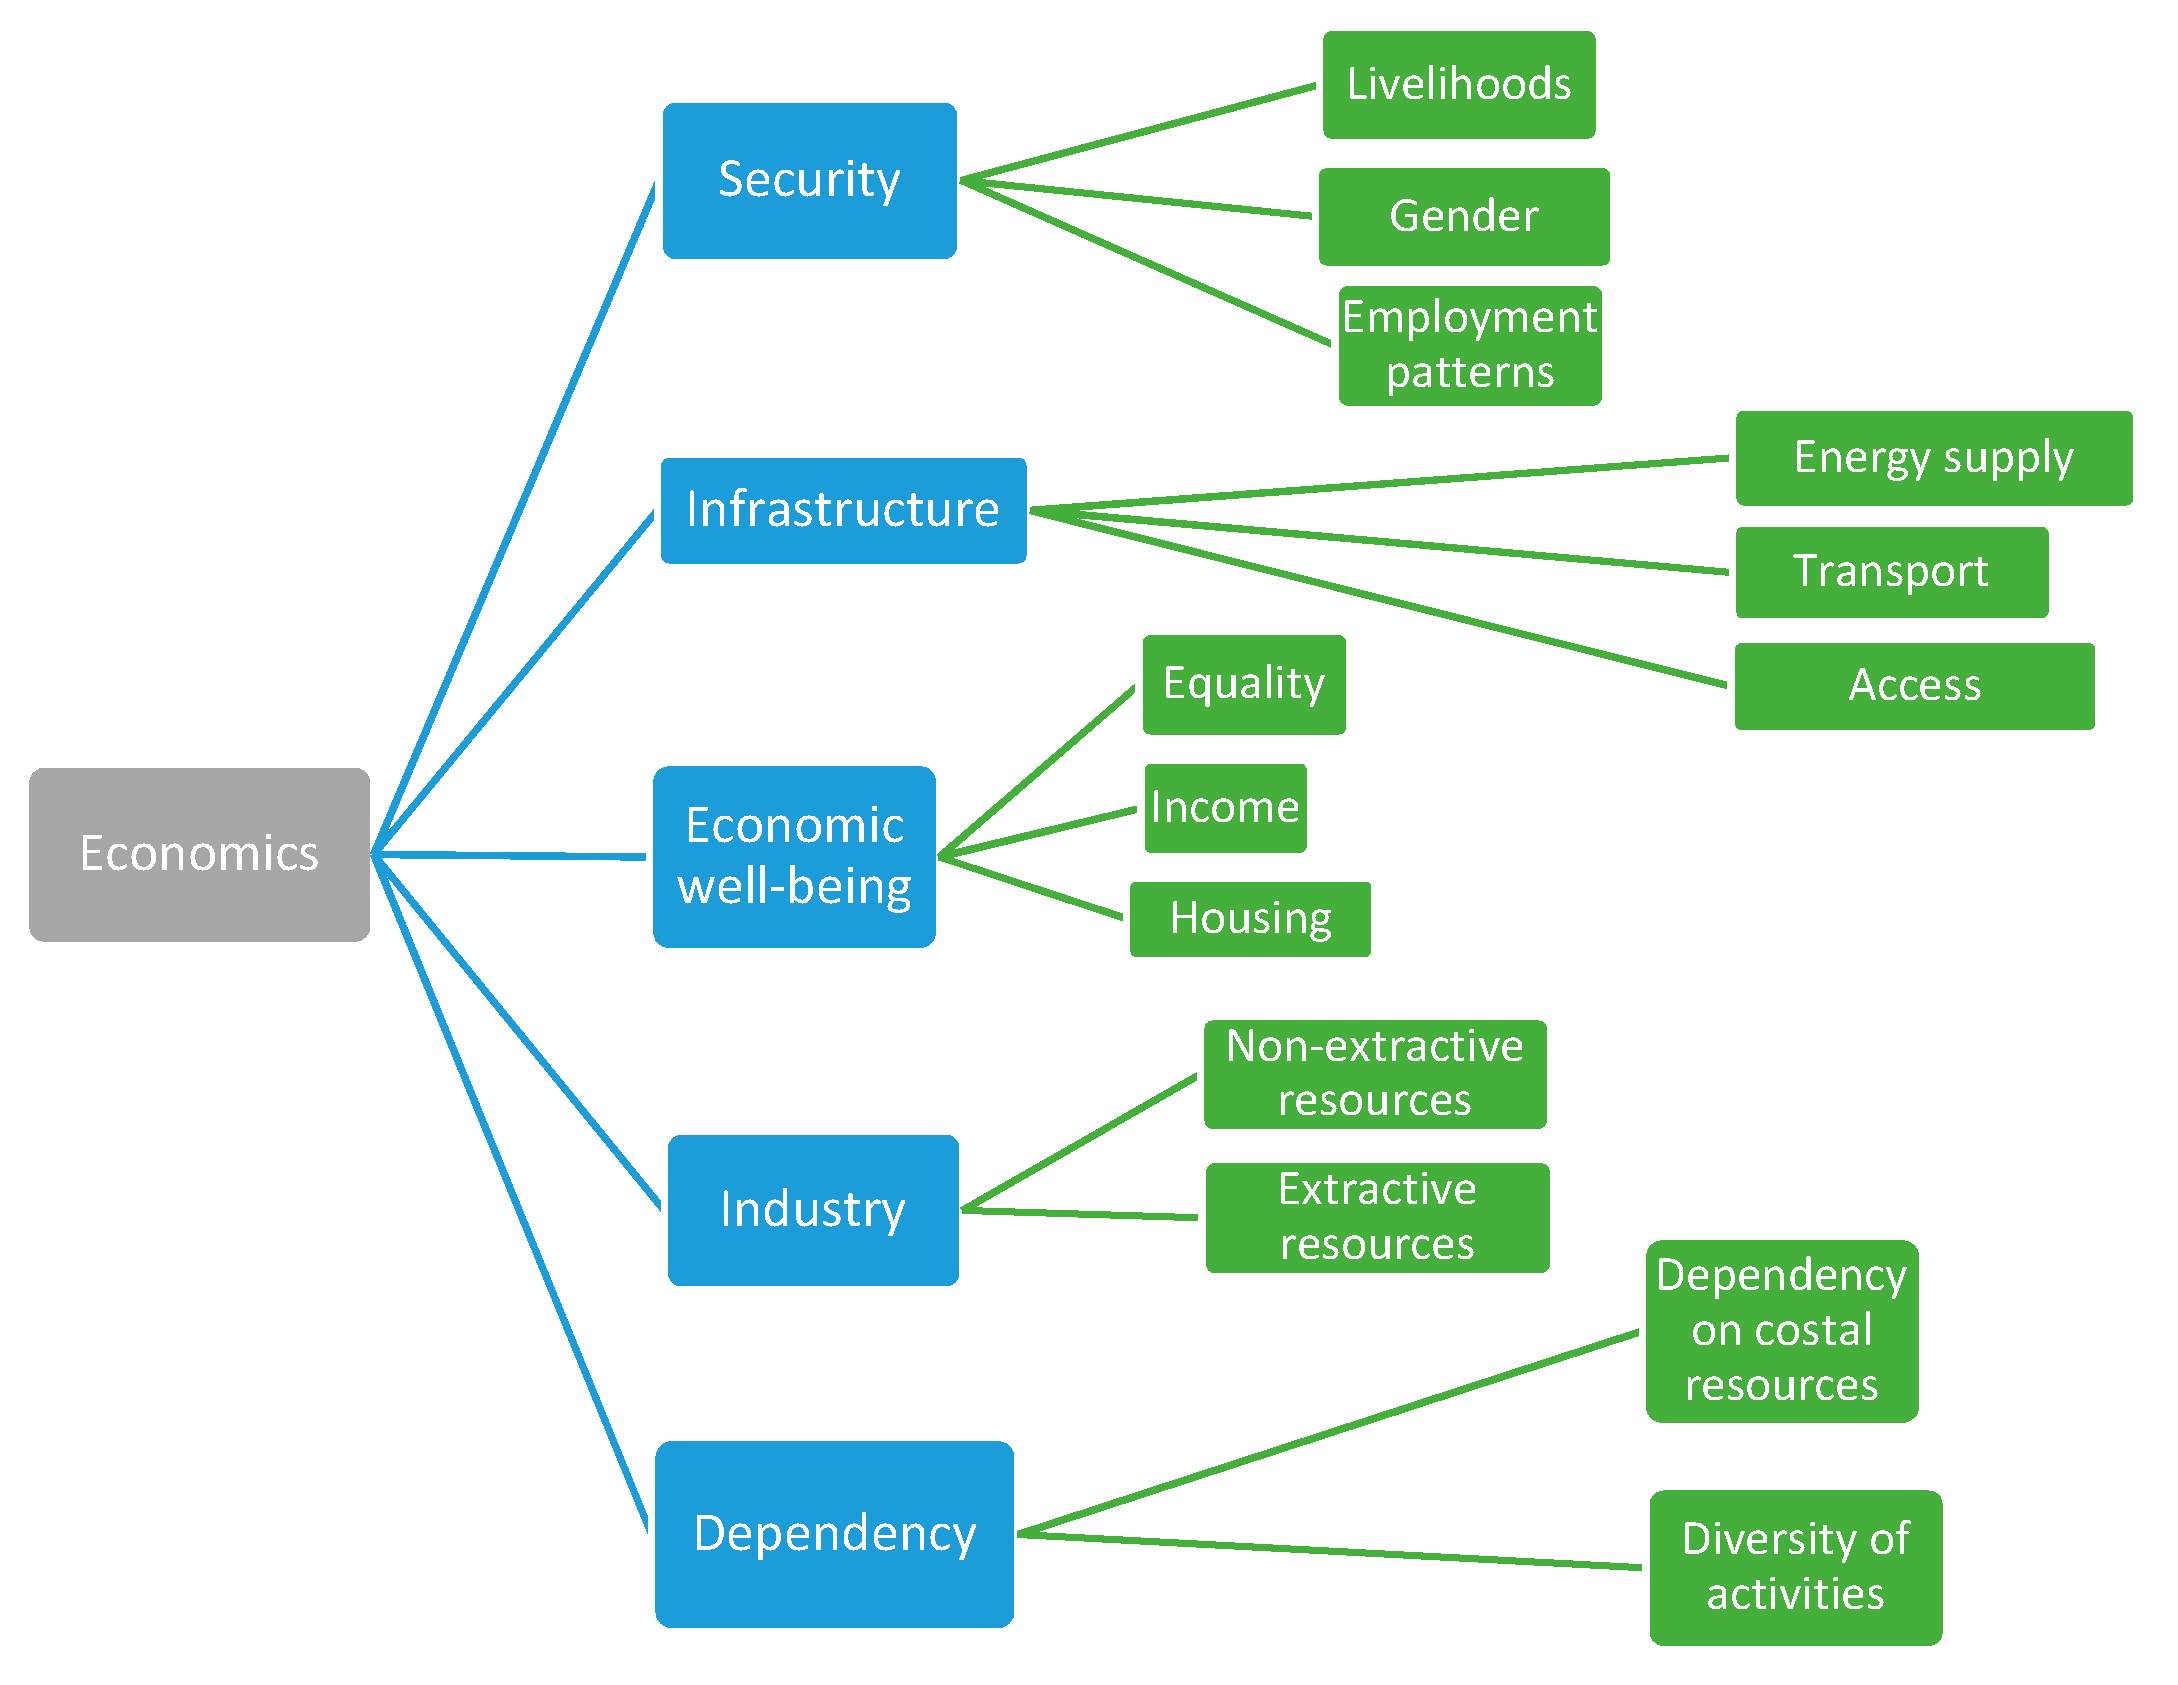
3.1.3. Coastal Context for the ‘Economics’ Category

The global economic system is considered the main driver of change in the Earth’s system. Additionally, the economic activity of the human enterprise continues to grow at a rapid rate, which does not necessarily reflect improvement in the economic prosperity of individuals [64]. A shift towards an economic model where equitable and sustainable well-being is the focus is the new goal, rather than unlimited economic growth that places pressures on planetary boundaries [65]. This is especially true when coastal livelihoods are considered, where the provision of ecosystem services is directly linked to income fluctuations, which is the case of fishing-dependent communities in face of changes in fish stock [55]. To assess the economic prosperity of coastal zones, as well as that of its inhabitants, two approaches have been considered in this domain:
  • The OECD’s [37] material well-being approach explores the diversity of activities that confer financial security to coastal livelihoods and the dependency of the populations on these activities. It includes jobs, housing, wealth, and income. For instance, fish-dependent communities can experience economic vulnerability, as they often face changes in fish stocks and rising costs of fishing effort, leading to lower incomes and other factors that threaten household and individual financial security [66]. These factors pose a risk to economic well-being and require policy responses [54].
  • Assessment of the revenue contribution of each maritime and coastal-related activity to the development of maritime and coastal industries, and the importance that this sector has on the economy. For instance, in Spain, the tourism industry is the economic sector that generates the largest share of GDP of its coastal zones. Economic instabilities in this sector can compromise the economic well-being of coastal communities, as in the case of the decline of the oil and gas production industry in UK, which was one of the largest contributions to the UK’s GDP [54].
An analysis of infrastructure and access is part of the second approach and is related to urbanization and tourism, where improved access through roads, bus stations, airports, and ports is likely to attract new business and stimulate migration. An investigation of the industry diversification and revenue per sector provides an outlook of the contribution of coastal-derived activities to the economy. Pollution and other diminishing factors of environmental quality might also affect livelihoods, where a clear link between environmental quality and human well-being through the continuity of provision of ecosystem services (ES) goods and services is established. Following this idea, the ecosystem services concept follows a political–ecological economics perspective, as suggested by Depietri et al. [44]. It focuses on the importance of ecosystem services to human well-being, rather than seeking to attribute values. This domain addresses the economic sustainability of coastal zones as a proxy to assess SDG progression. Figure 5 shows the suggested sub-categories for each category of the Economics domain, covering the two approaches mentioned.

3.1.4. Coastal Context for the ‘Governance and Policy’ Category

Systems of governance and policy that apply to coastal ecosystem services involve multiple features associated with resource use management, land entitlement and ownership, mediation between conflicting uses, and commitment to local and international agreements and regulations [44,45]. Assessing the effectiveness of governance and politics in coastal zones is a key factor for understanding socio-ecological systems and the implications on biophysical, social, and economic issues. Community-based management instruments, such as civil society organizations, activism, and collective action, are important mechanisms to include communities in ecosystem service use and decision-making [44,67,68]. Education plays an important role in this matter and links social resilience and participation with coastal political ecology.
The quality of environmental legislation and its enforcement directly influences who has access to coastal ecosystem services and the management of uses [69]. Regulations for fisheries and aquaculture, wastewater treatment and disposal, ballast water, deforestation, protected areas, and ecosystem restoration are examples of policies that safeguard ecosystem health and consequently protect coastal-dependent livelihoods. Indirectly, such measures also protect human security against climate change and extreme events; for instance, when natural coastal protection is effective.
Corruption has been identified as one of the main obstacles in coastal governance, where interests of particular groups are favored instead of those of the communities. The concession of licenses for developments in areas of environmental and socioeconomic sensitivity, ignoring the legislation, is one example of the impacts of corruption [70]. In this context, evaluating corruption in coastal-related issues becomes imperative, as ecosystem services that support human well-being might be threatened. Stakeholder conflict, lack of local capital assets and capacity, and weak institutions were also pointed out as challenges to coastal management and governance [70]. Mapping conflicts can provide a proxy of the effectiveness of plans to manage resource use and management.
In terms of sub-category definition, this domain was the most challenging given the availability of data and the distinct mechanisms of control and participation existent in different coastal regions. For this reason, in categories such as ‘Representation and power’ (Figure 6), an ‘Other’ sub-category appears. This allows managers to choose the most appropriate sub-categories and indicators for local adaptation to their zone.

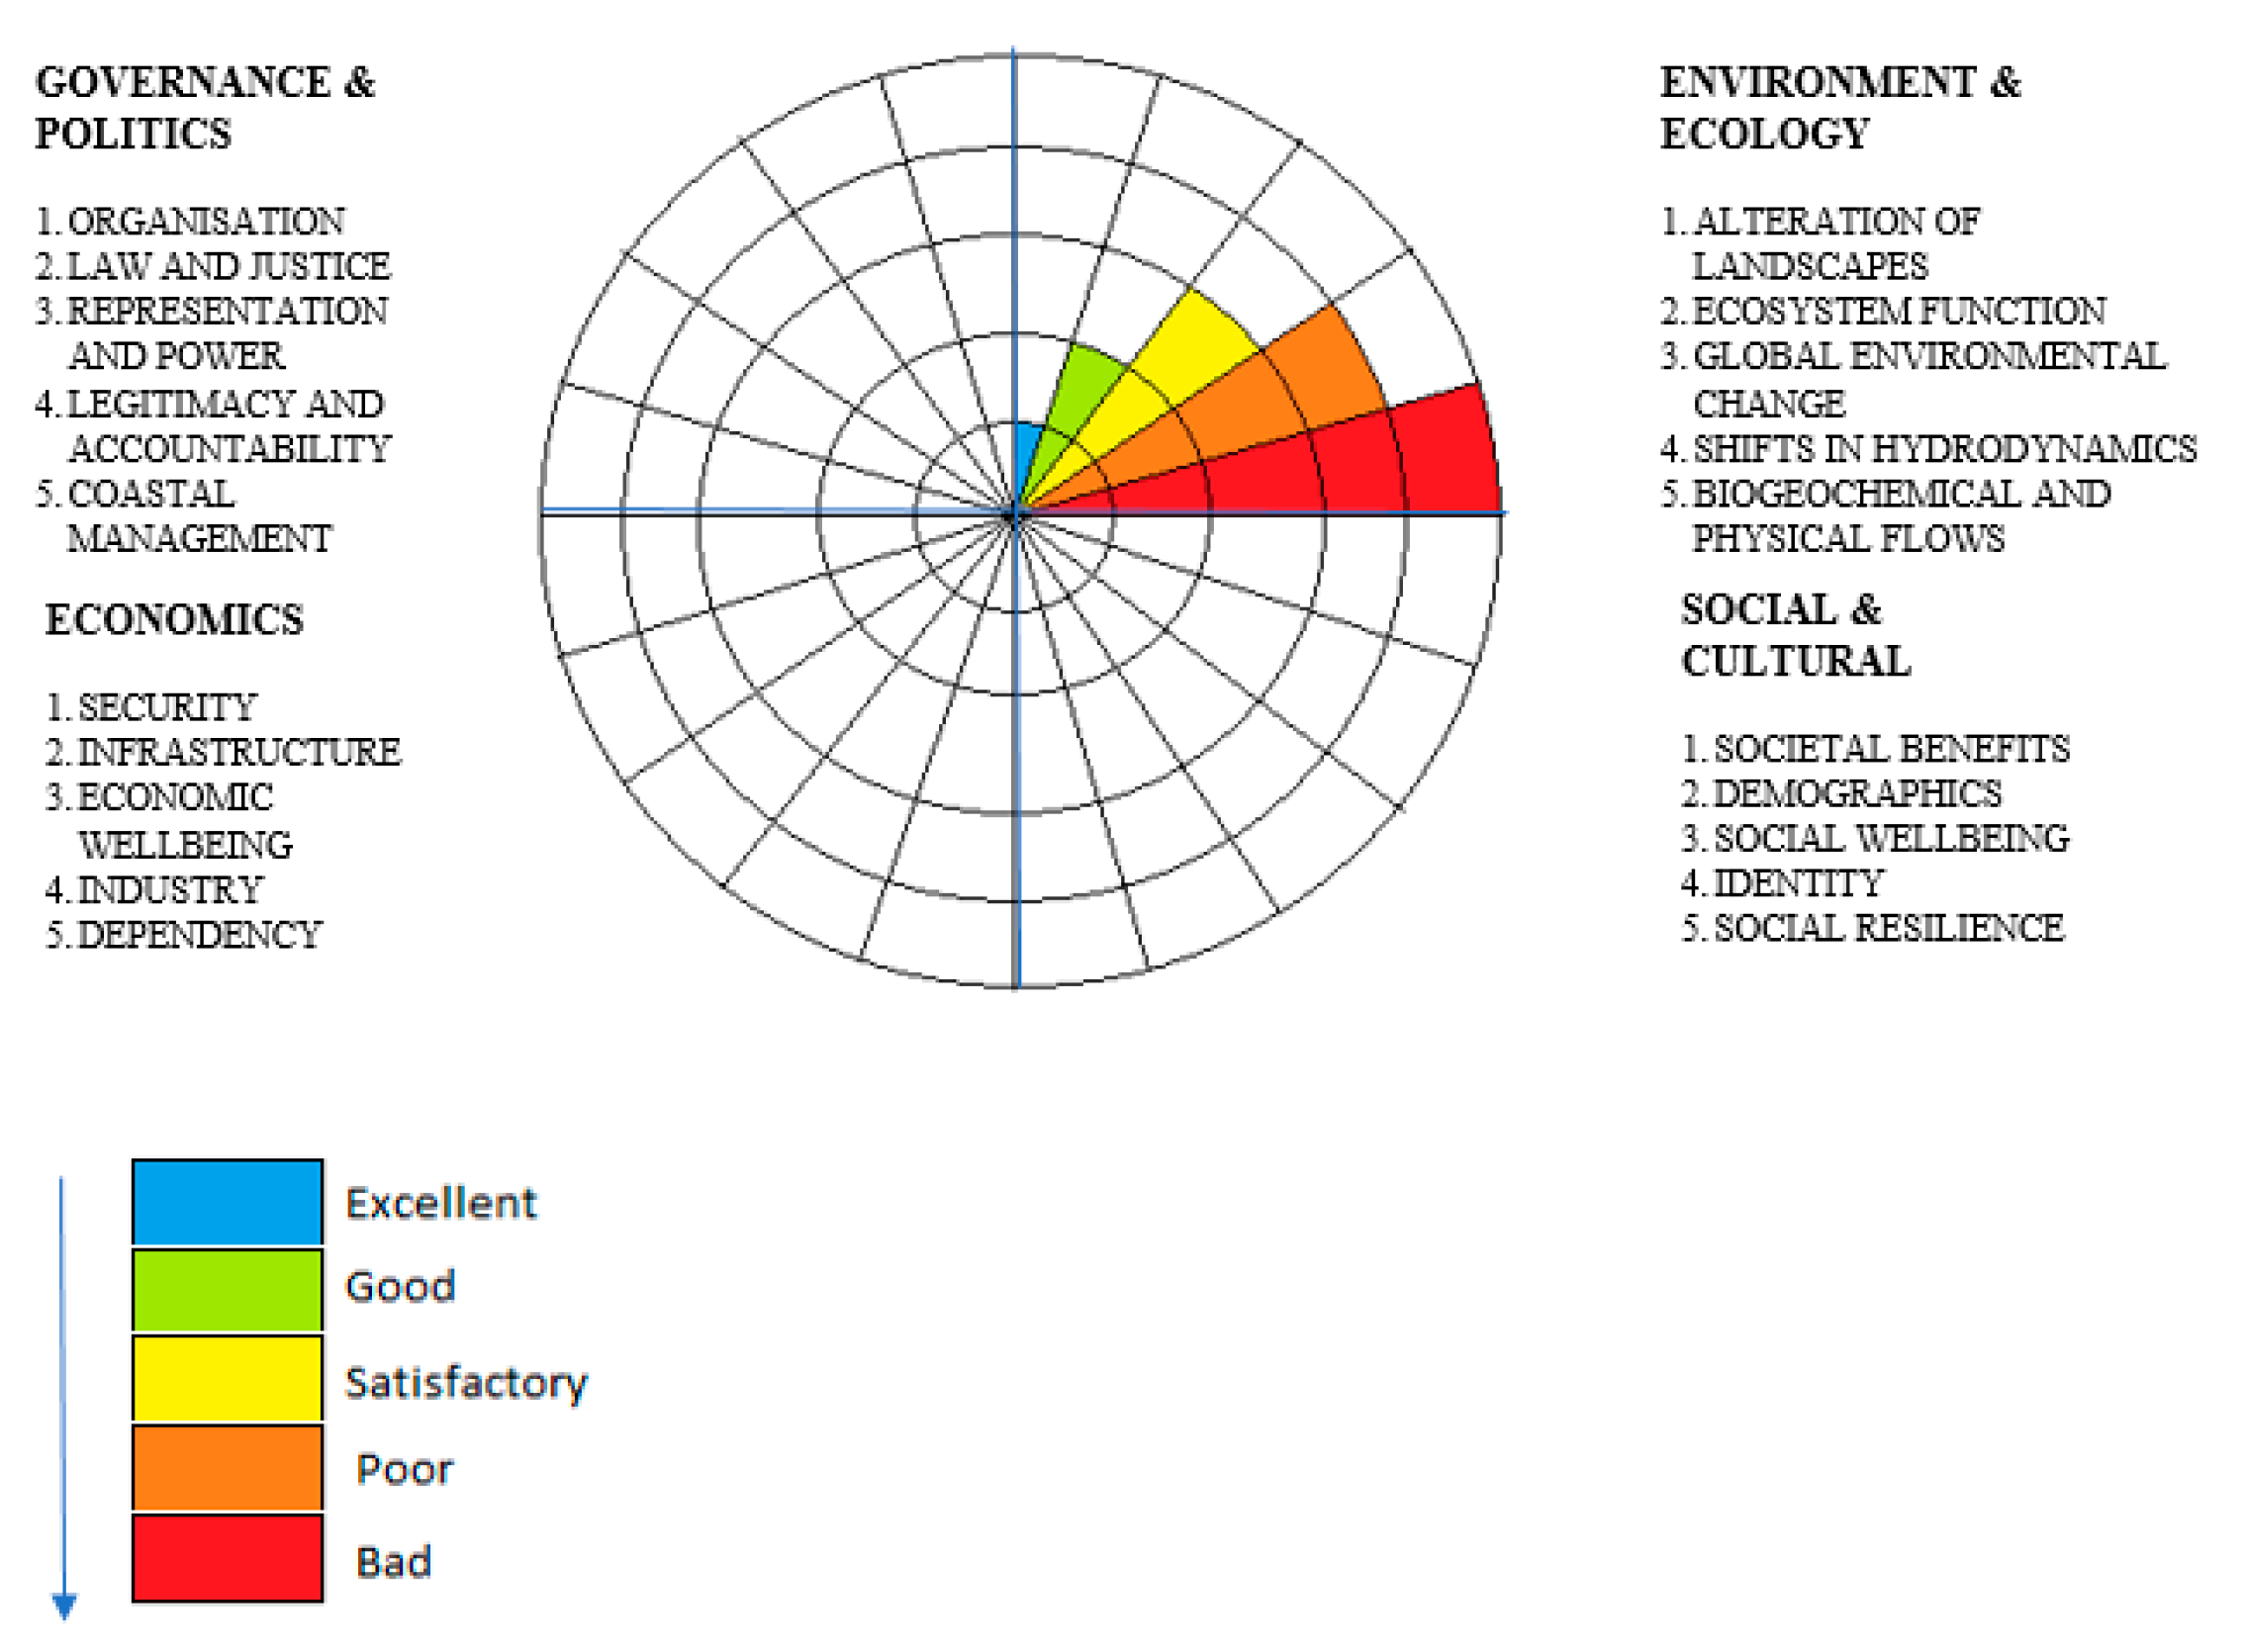
3.1.5. The Circles of Coastal Sustainability Indicators

The implementation of CCS requires a set of indices that reflect the constituent sub-categories and categories. The challenge and complexity of identifying a comprehensive set of indicators has been extensively recognized [42,71]. The choice of indicators that reflect the ‘real-world’ situation of coastal zones and the interconnected relationship that describes socio-ecological systems is important to achieve a holistic and integrated assessment that leads to meaningful management actions for sustainability. The selection of indicators to analyze each category was derived from different sources, as listed in Table 2. These sources were chosen based on their capacity to deliver consistent information to enable a holistic analysis, considering the key concepts chosen to develop the framework: The interdependency between ecosystem services and human well-being. Regarding the indicators, the selection criteria included the practicability of each indicator, the availability of data to support them, and the communicability of the information conveyed by them to managers and other stakeholders. Acknowledging the fact that data availability may vary depending on a range of factors, such as scale and location particularities, the indicators listed on Table 2 are not meant to be considered a fixed set, but a guide. Each category is defined in a way that does not pre-determine the indicator data necessary for its assessment/description, which will allow the data and/or expert judgement that are available from any given location to be used to populate the CCS. Metrics from the indicator source can be modified by critical judgement when scale specificity requires appropriate thresholds/limits to score indicators. These locally adapted metrics can be deployed in differing reporting contexts to permit locally developed sustainability interpretations and indicators [23].
The majority of sustainability indicators are derived from separate analyses of economic, social, and natural processes. In some instances, however, the indicators are integrated across more than one domain. Delivering sustainability requires this connectivity across varying levels of complexity and scale. Indicators allow an expanding set of sentinel observations to be drawn into policymaking. As new knowledge becomes available or the focus of decision-making shifts, underpinning data flows can be augmented or replaced. Indicators can be descriptive, related to performance, efficiency, policy effectiveness, or overall welfare, but, in the context of sustainability, it is their integration across different policy arenas that is most critical.

3.2. Communication of the CCS
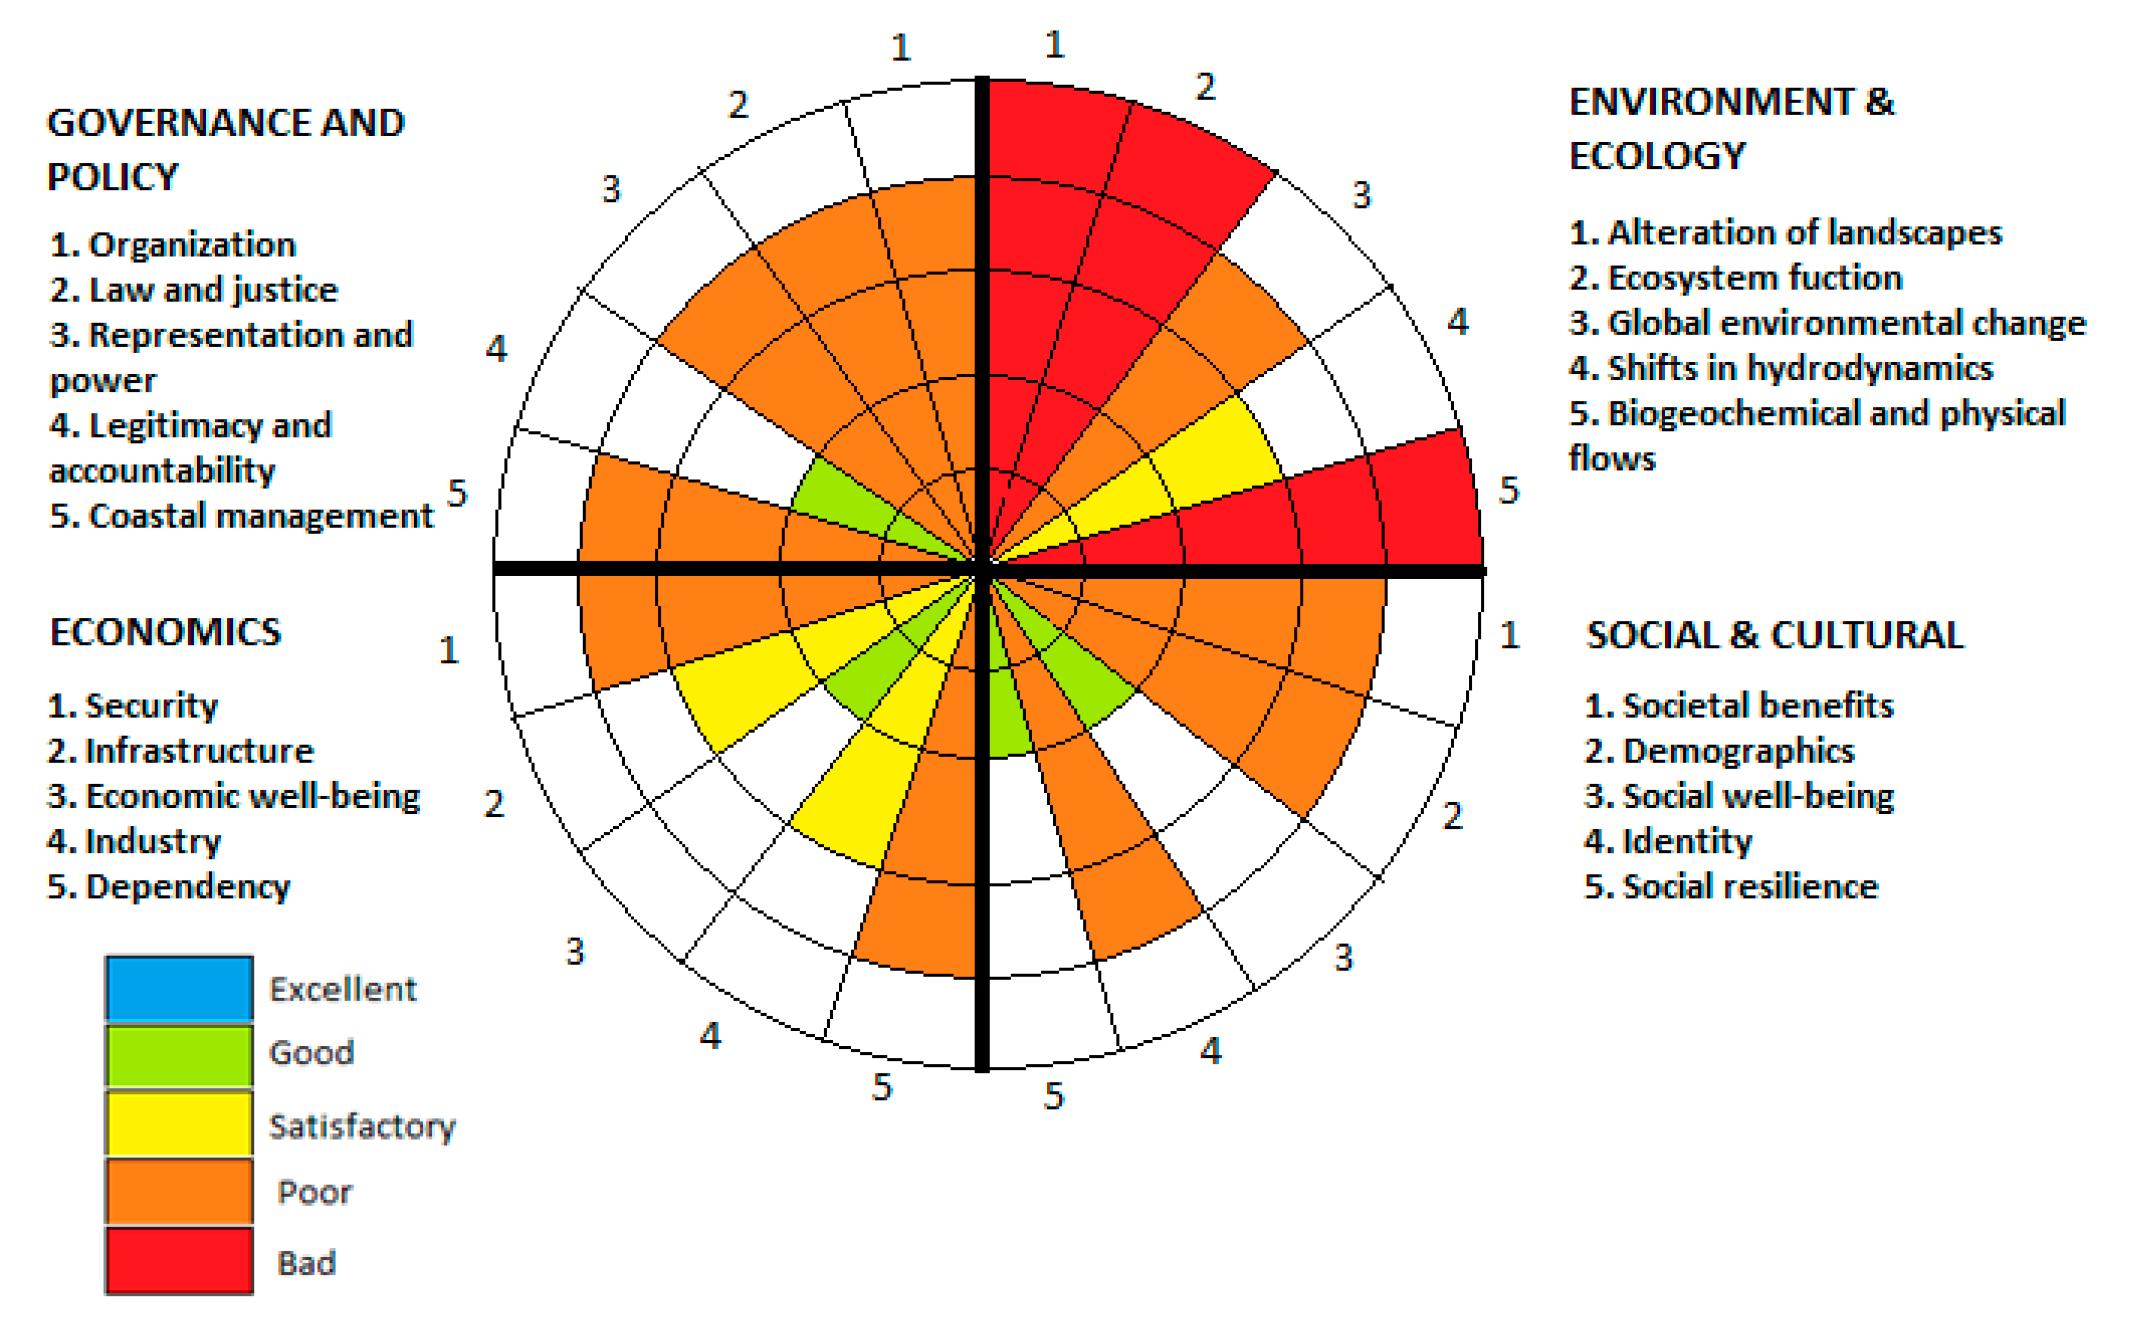
A scoring system on a scale from 1 to 5 was used to rate sustainability levels for each indicator set in each category. Color labels fill the diagram to signal performance relative to others: Blue for ‘excellent’, green for ‘good’, yellow for ‘satisfactory’, orange for ‘poor, and red for ‘bad’, according to the rating attributed (Figure 7). This is inspired by the color scale (blue to red) of the EU Water Framework Directive.
The attribution of points within a category is made by following an averaging across the indicators used in each category. Indicators all have equal weight. A global whole of the circle score is not given, as the framework assumes that no category is more or less important than the other categories, and categories cannot compensate or negate each other. The outcome is that the CCS highlights priority areas that need urgent action, thereby optimizing management and the allocation of economic resources.
The bull’s eye orientation (proximity to the center of the target represents proximity to the sustainability goal) follows the Planetary Boundaries graphical representation, where the progressive distance from the center of the circle represents transgression of boundaries. In the proposed framework, the further the distance from the circle, the higher “unsustainability” scores are attributed. This is the opposite to the OHI representation, where further out from the center represents a larger percentage score. This visual output aims to provide a clear and easy panorama of the four typologies of sustainability analyzed, allowing better communication between the diverse stakeholders involved in coastal management.

4. Case Study

The method was applied to Spain to demonstrate the application of the CCS approach. Spain is the largest country in Southern Europe. It has a territory of 505,990 km2, including the Balearic Islands in the Mediterranean Sea and the Canary Islands, with a total population of 47.02 million. At the time of the study (2010–2011), 44% of the population was living in coastal municipalities, a narrow fringe (0–5 km) only corresponding to 4.2% of the territory. A previous study by O’Neill et al. [65] applied the Safe and Just Space Framework [38] in over 150 countries, combining seven biophysical thresholds to 11 social indicators. Their findings show that Spain transgressed all seven analyzed biophysical thresholds associated with environmental sustainability. The application of the CCS framework aimed to extend this analysis to assess the implications of coastal management on environmental sustainability and human well-being on Spanish coasts. To ensure comparability with the O’Neill et al. [65] study, the data used in our case study also correspond to the 2010–2011 time period. In addition to the data sources identified in Table 2, official data sources were used, such as from the Spanish Ministry of Agriculture, Food, and Environment, which, in this case, had consistent data to support this assessment [86,87,88,89].
Spain’s mainland is bordered to the south and east by the Mediterranean Sea, to the north and northeast by the Bay of Biscay, and to the west and northwest by the Atlantic Ocean. Geopolitically, the Spanish territory is divided into 17 Autonomous Communities; each has political autonomy with distinct cultural, social, economic, and environmental features, and they are further sub-divided into 59 Provinces, 31 of which are coastal. The climate typology of the country is divided into Oceanic, Mediterranean, and Sub-tropical/Tropical (Canary Islands) [86].

4.1. Results

Overall, the CCS shown in Figure 8 use a combined image of all four quadrants. The following sections provide a background to the scoring of each sub-category within each quadrant of the CCS.

4.1.1. Environment and Ecology

In this domain, all categories assessed had a low environmental performance (Figure 8):
  • Alteration of landscapes: It is estimated that there has been a 60% increase in artificial occupation on Spanish coasts from 1987–2011, such that 10.48% of the area up to 10 km from the coast is artificial. The percentage rises to 27.5% when the first 500 m is considered. In urban areas, such as Barcelona, Málaga, and Alicante, this increases up to 45% in the first 2 km from the coast [90] with 70% of the total artificial surface corresponding to residential areas.
  • Ecosystem function: Data on biodiversity loss and on the state of provision of coastal and marine regulating ES indicate an alarming trend with vertebrate species classification as “critically endangered” [88]. Overfishing is identified as one of the main causes of biodiversity loss in the Mediterranean area, where the capture/biomass ratio is out of balance, coupled with a high trend in the presence of invasive alien species, representing possible threats for local and endemic species [90]. Coastal and marine regulating services and provision services (e.g., water regulation, maintenance of soil erosion and fertility, regulation against hazards, and biological control) are in decline, presenting worsening trends in both coastal and marine ecosystems [88].
  • Global environmental change: This category used climate-change-related indicators, such as SLR, SST, and ocean acidification (OA), all of which are projected to increase [86].
  • Shifts in hydrodynamics: Data from the “Strategy for climate change adaptation of the Spanish coast” point to an overall change in terms of wave height for 2070–2100 projections [89].
  • Biogeochemical and physical flows: Nitrogen and phosphorus input points for nutrient footprints trespassed the “biogeochemical flows” planetary boundary in Spain in 2011 [65]. Freshwater cycles, water regulation, and provisioning services in aquifers and coastal systems, as well as water regulation services, are in decline [88]. Overexploitation of water resources is exacerbated by tourism, which consumes 3–4 times more water than a domestic resident. A total of 70% of the tourism in Spain is concentrated in areas at risk of water scarcity and drought. Peaks in water consumption also require optimization of residual water treatment, requiring design of treatment plants to support these peaks [90]. Regarding sediment cycles, it is estimated that around 69.73% of Spanish territory suffers from erosive processes [87], which can be related to the intense decline of coastal zones’ ability to control erosive processes [88].

4.1.2. Social and Cultural

  • Societal benefits: Provisioning services (food, water, biotic materials, and renewable energy), regulating services associated with natural beach nourishment and natural hazard protection, and cultural services, such as recreation opportunities and aesthetic values, were assessed [88]. Except for renewable energy, with a mixed trend, all provisioning services had a worse/worsening declining trend in both coastal and marine environments [88]. Regulating services also presented declining trends (e.g., loss of coastal erosion regulation service), presenting a threat to coastal human settlements [88]. Recreational activities and aesthetic enjoyment services are declining, affecting the social well-being of local inhabitants, as well as the value as a touristic destination [88]. Coastal water quality was assessed as another variable to measure societal benefits, as it is linked to health, cultural, and economic aspects, as well as its importance for tourism [91]. In 2010, 80% of coastal waters had an excellent quality, while over 90% were classified with “sufficient” quality [92].
  • Demographics: According to the Spanish National Statistics Institute, 44% of the population lived in coastal zones in 2010 [93], which can place pressures on public services, including proper sanitary facilities [90]. Other studies have shown that over 26% of the Spanish population was at risk of poverty or social exclusion, higher than the overall EU numbers [89].
  • Social well-being: To measure social well-being, access to beaches, food security, and health were evaluated. Legislation establishes that beaches are a public domain, forbidding private uses to enhance the cultural services provided [94]. Food provision from coastal and marine sources has been experiencing a decline. Large-scale agriculture is the main source of food security in coastal zones [88]. As a proxy for health, bathing water quality was used to assess the occurrence of water-related diseases.
  • Identity: “Sense of place” was used as an indicator of populations’ sense of belonging to nature. The authors of [88] found that this has been experiencing a declining trend in coastal zones attributable to the replacement of traditional lifestyles.
  • Social resilience: This category examined vulnerability and education patterns along Spanish coasts. For vulnerability, the lack of data for social cohesion limited the assessment. To evaluate education, cultural services were assessed based on scientific knowledge, local ecological knowledge, and environmental education. For both coastal and marine ecosystems, this service has an increasing trend [88]. Environmental education initiatives exist in almost all coastal regions, helping to enhance citizen awareness of coastal and marine issues [95].

4.1.3. Economics

It is important to note that during the analyzed time span (2010–2011), Spain was going through an economic recession following the real estate bubble crisis of 2008.
  • Security: Livelihoods and employment patterns were examined. According to data from the Eurostat database [96], from 2005–2014, there was a 12.8% decline in employment along Spanish coasts. Aside from the crisis of 2008, decreases in the fisheries sector may relate to half of Spanish fishing grounds being fished beyond the safe biological limits of sustainability [88]. Employment patterns are seasonal, with large numbers of temporary jobs in the summer to meet the needs of the service and tourism sectors. In the shipbuilding industry, more qualified, permanent jobs exist [88].
  • Infrastructure: In this category, energy supply, maritime transport, and tourism were assessed. In 2010, around 33% of energy generation came from renewable sources, and this is expected to increase [91]. The port industry is very important, with the Port of Algeciras in Andalucia being the most important in the Mediterranean region. The Port of Vigo in the Northwest Atlantic, the Port of Bilbao in the Gulf of Biscay, and the Port of Las Palmas in the Canary Islands are other examples of ports with intense activity. The Canary Islands and the Balearic Islands have high numbers of marinas and moorings, as well as dependency on maritime transport [91]. Tourism infrastructure is well developed, particularly in the Canary and the Balearic Islands and the coastal regions of Murcia, Valencia, and Catalunya [88].
  • Economic well-being: Equality, income patterns, and housing were used to evaluate the economic well-being of the coastal populations, although data only exist at the national level. The Gini index [65] was used to assess equality patterns, where Spain scored 68.6 (out of 100) in 2011. For “the percentage of the population who earn above $1.9 a day” indicator, the country obtained the maximum score. Regarding housing affordability on the average income, bad trends were found [88]. Vacation rentals have become a major issue, where locals find it hard to find affordable long-term properties for rent in coastal cities (e.g., Barcelona and Palma de Mallorca).
  • Industry: The analysis considered tourism, maritime transport, and shipbuilding. The tourism industry alone is responsible for the biggest share of revenue generation in Spanish coastal zones, employing around 272,174 people in 2011, leading to a high economic dependency on tourism (e.g., the Canary Islands) [91]. Regarding non-renewable industries, fisheries, aquaculture, and oil and gas industries were considered. The fisheries industry presents a declining trend, affecting the state of associated provisioning services [91]. In contrast, the aquaculture industry has a growing trend, particularly in Galicia [97]. Data for offshore oil and gas were limited, but for 2010, it is estimated that this sector had a revenue of 16 million Euros [91].
  • Dependency: To assess the level of economic dependency on coastal resources and assets, the percentage of workforce per sector was used. According to a Eurostat analysis on European coasts, in 2010, about 10% of the workforce was engaged in the fisheries, agriculture, and forestry sectors in Spanish coastal zones. On the other hand, around 70% of the workforce was employed in the services sector, where tourism-related activities are predominant [98]. This output points out to a larger dependency on non-extractive activities (e.g., tourism).

4.1.4. Governance and Policy

  • Organization: Citizen participation and interest were analyzed by the existence and typology of civil society associations and NGOs, which indicated that public participation in coastal governance is still below ideal. Only a few environmental-related associations and NGOs are dedicated to coastal-related issues. Many Autonomous Communities have mechanisms to stimulate public participation in environmental issues, a right that is safeguarded by the national Law 27/2006 of 18 of July.
  • Law and justice: In 2010/2011, the coastal zone was regulated by the Law 22/1988, known as “Law of Coasts” (Ley de Costas), which establishes limits of the public domain, aiming to avoid private uses and re-establish public access where needed. It also included the classification of dunes and cliffs as public domain. This brought controversy due to the properties built and acquired before the legislation came into force that were converted into State property [99]. The legislation was criticized by the European Parliament, as it led to social instability by penalizing property owners due to actions of the Central Government, Autonomous Communities, and municipalities that allowed the unsustainable occupation of the coast in the first place. The law’s text was periodically altered before being substituted by a new law in 2013—diminishing the protection limit [94,99]. No normative instruments were found in any of the Autonomous Communities to regulate the adoption of the Integrated Coastal Zone Management (ICZM) [95]. Given the decentralized character of the government system, the existing coastal policies are extremely sectorized, where conflicts of interest between the different spheres of power often arise [100].
  • Representation and power: Analyzing the World Bank indicators on Government Effectiveness and Voice and Accountability, Spain obtained good scores in 2011 [76]. Non-economic interest associations have been reported to have difficulty in influencing decision-making with relevant policy proposals [101], acting as a barrier to promotion of public participation [95]. The activist group “Greenpeace España” has released reports on the state of coastal ecosystems in Spain, such as “A toda costa”, reporting the excessive urbanization in Spanish coasts and demanding restoration actions by the public administrations [102].
  • Legitimacy and accountability: This category measured legitimacy and accountability at a general level, not specifically regarding coastal issues. Using the World Bank indicators [76], for 2011, Spain scored 82 in Control of Corruption, which can be considered a good score.
  • Resource management: Coastal management in Spain is characterized as sectorized within government administration, leading to a lack of policies at the national or Autonomous Community level to enforce ICZM, exacerbated by the 2008 crisis [95]. The Spanish Ministry of Agriculture, Food, and Environment (formerly named MAGRAMA) suffered a cut of around 50% to its funding [90]. According to the Spanish National Ecosystem Assessment, around 70% of the coastal ecosystem services in the country are being poorly managed, highlighting the failure of current coastal management plans to conserve these ES [88].

4.1.5. Case Study Discussion

The outcomes of the case study presented through CCS for Spain have shown how the status of coastal biophysical boundaries is related to the declining provision of coastal ecosystem services, with consequent impacts on the well-being of human communities that depend on these. For example, analysis across the Alteration of Landscape category highlights how human settlements and infrastructures are more vulnerable because coastal protection services cannot properly attenuate the impacts of extreme events. This is a product of massified urbanization, where 10.48% of the national territory in a 10 km coastal strip has been altered through land reclamation, construction on dunes, and draining of wetlands. These alterations and the presence of shoreline-hardening infrastructures disrupt sediment fluxes, leading to erosive processes on the coasts, which also pose a risk to human settlements [103]. The analysis showed a considerable loss of coastal and marine species in Biodiversity Loss, a sub-category of Ecosystem Function, which can be attributed to overfishing and habitat loss and translates into diminished food security due to a decline of provisioning services, impacting human well-being. Economically, it impacts the subsistence of livelihoods based on traditional fisheries, fragilizing this economic activity. The unsustainable management of fisheries resources, allowing overfishing and habitat destruction based on weak policies, contributes negatively to the perpetuation of this [104].
The CCS also illustrated possibly contrasting links between certain economic activities; for instance, an increase in aquaculture fosters food security and job creation, but can be a source of pollution through the release of effluents. The CCS also demonstrated how, while non-extractive sectors may be important sources of revenues to the coastal economy, this can lead to undesirable social and economic outcomes, such as low availability of affordable and long-term housing for local people as many properties are converted into vacation accommodations. This pressures the real estate market with the low offer of long-term properties and leads to speculative prices, negatively impacting the capacity of locals to rent or buy properties in their own cities [105].
The strong decline shown in sub-categories related to provisioning and regulating services from coastal ecosystems, in contrast with those for cultural services related to environmental education and scientific knowledge, showed that a lack of knowledge transference within public administration and public participation is a significant issue for effective coastal management [4,95]. The outcomes of the CCS also highlight challenges in adopting strategies to meet national obligations under the 2030 Agenda and the Sendai and Aichi frameworks [90]. Future projections based on the analysis point to environmental, social, and economic risks if no progress towards integration between the different spheres of coastal management is made and conservation plans are not prioritized. Low progress towards coastal protection and climate change adaptation and low diversification of industries are also a concern if the current trend is followed [90].

5. Conclusions

The need to enhance the integrative character of analytic frameworks is critical to address the complex relationships between marine sustainability and human well-being and to inform policy and decision-making for sound management [106]. The application of the case study highlighted how coastal managers can use the CCS as an integrative framework to guide and focus attention towards priority areas and achieve overall sustainability management across all four pillars of sustainable development. The CCS demonstrates how the classic trade-off between economic and environmental activity can be reformulated as a conflict between the short- and long-term demands and that economic problems do not have purely economic solutions, nor do environmental problems have purely environmental solutions [42]. The results presented here demonstrate that solutions to societal problems must address the society and its relationship with nature as a whole.
The graphical representation of the CCS facilitates the visualization and interpretation of results, simplifying communication between stakeholders from different backgrounds and sectors. The framework also illustrates how degradation of coastal ecosystem services can impact human well-being, and how power relations, its overlaps, and conflicts can influence management and contribute (or not) to the sustainability status of both ecosystems and human well-being. The CCS does not attribute overall ‘scores’ in order to provide focus on a holistic analysis of the multiple and inter-related domains of any specific coastal zone. This aspect also illustrates how definition of categories and sub-categories is important, and the application of averaging across sub-categories should be used with care: Integration across the sub-category of economic well-being in the Spain case study led to a good evaluation of the category, as the outcome for housing contrasted with those for the other sub-categories (Equality and Income).
Similarly to other assessment frameworks, the availability of up-to-date data on environmental monitoring is one of the main challenges for the framework’s application, especially in developing countries, where sampling can be discontinuous and/or absent. Many existing databases for social and economic data, such as from the World Bank, offer a wide range of information for national scales. Regional data are subject to the vagaries of national databases, whose availability and quality may vary widely depending on the country. To address this issue, in addition to using the sub-categories as a guide to source appropriate indicators, a selection of indicators for each category are suggested that do not aim to limit the framework application to a single scale. The use of indicators that better represent the local area is therefore encouraged to be decided upon the judgement of the coastal manager and the data available.
The sustainability challenges of coastal zones are intertwined and interconnected across time, space, organizational level, and subject realm. Linking seemingly disconnected information and understanding threshold levels for change across different disciplines is critical for holistic and integrated policy and management decisions [19,35,107,108]. However, many studies differentiate between different perspectives of global change—such as distinguishing between ecosystem services, environmental footprints, or planetary boundaries [33]—so that information for management is often focused on single issues. This means that the interplay between different domains of interest and development strategies is not resolved [109,110]. CCS is presented as a tool that presents to policy-makers and managers the status of all four critical domains for sustainable development, and to provide an assessment methodology for measuring progress towards sustainable pathways [111] for development of the world’s coastal zones.

Author Contributions

N.M.P.d.A.: Conceptualization, Data curation, Formal analysis, Investigation, Validation, Visualization, Writing—original draft, Writing—review and editing; M.L.T.: Conceptualization, Funding acquisition, Methodology, Resources, Supervision, Validation, Writing—original draft, Writing—review and editing; S.K.P.: Conceptualization, Funding acquisition, Methodology, Resources, Supervision, Validation, Writing—original draft, Writing—review and editing; A.N.: Conceptualization, Funding acquisition, Methodology, Project administration, Resources, Supervision, Validation, Writing—original draft, Writing—review and editing. All authors have read and agreed to the published version of the manuscript.

Funding

This research was funded by the Erasmus Mundus program of Water and Coastal Management, grant number SGA Nr 2016-1891/001-001-EMMC, and the Future Earth Coasts project. This publication was supported by Brunel University London’s UKRI Open Access block grant.

Acknowledgments

This paper is a contribution to the Future Earth Coasts project. Alice Newton acknowledges IMBeR and Future Earth Ocean KAN. This research was funded by the Erasmus Mundus program of Water and Coastal Management and the Future Earth Coasts project.

Conflicts of Interest

The authors declare no conflict of interest.

References

  1. Nicholls, R.J.; Wong, P.P.; Burkett, V.; Codignotto, J.; Hay, J.; McLean, R.; Ragoonaden, S.; Woodroffe, C.D.; Abuodha, P.A.O.; Arblaster, J.; et al. Coastal systems and low-lying areas. In Climate Change 2007: Impacts, Adaptation and Vulnerability. Contribution of Working Group II to the Fourth Assessment Report of the Intergovernmental Panel on Climate Change; Parry, M.L., Canziani, O.F., Palutikof, J.P., van der Linden, P.J., Hanson, C.E., Eds.; Cambridge University Press: Cambridge, UK, 2007; pp. 315–356. [Google Scholar]
  2. Ramesh, R.; Chen, Z.; Cummins, V.; Day, J.; D’Elia, C.; Dennison, B.; Forbes, D.L.; Glaeser, B.; Glaser, M.; Glavovic, B.; et al. Land-Ocean Interactions in the Coastal Zone: Past, present & future. Anthropocene 2015, 12, 85–98. [Google Scholar] [CrossRef] [Green Version]
  3. Lagzdina, E.; Kudrenickis, I.; Ernsteins, R.; Kaulins, J. Coastal sustainable development studies in Latvia: Integrated social-ecological systems governance. Reg. Form. Dev. Stud. 2017, 21, 83–97. [Google Scholar] [CrossRef] [Green Version]
  4. Newton, A.; Elliott, M. A Typology of stakeholders and guidelines for engagement in transdisciplinary, participatory processes. Front. Marine Sci. 2016, 3, 230. [Google Scholar] [CrossRef] [Green Version]
  5. Crossland, C.J.; Baird, D.; Ducrotoy, J.P.; Lindeboom, H. The coastal zone–a domain of global interactions. In Coastal Fluxes in the Anthropocene, 1st ed.; Crossland, C.J., Kremer, H.H., Lindeboom, H., Marshall Crossland, J.I., Le Tissier, M.D.A., Eds.; Springer: Berlin/Herdelberg, Germany, 2005; Volume 1, pp. 1–37. [Google Scholar]
  6. Hoegh-Guldberg, O.; Beal, D.; Chaudhry, T.; Abdullat, A.; Etessy, P.; Smits, M. Reviving the Ocean Economy: The Case for Action; WWF International: Gland/Geneva, Switzerland, 2015; p. 60. [Google Scholar]
  7. Bell, S.L.; Phoenix, C.; Lovell, R.; Wheeler, B.W. Seeking everyday wellbeing: The coast as a therapeutic landscape. Soc. Sci. Med. 2015, 142, 56–67. [Google Scholar] [CrossRef]
  8. Green, R. Coastal Towns in Transition: Local Perceptions of Landscape Change; Springer/CSIRO Publishing: Dordrecht/Collingwood, The Netherlands, 2010. [Google Scholar]
  9. Sekovski, I.; Newton, A.; Dennison, W. Megacities in the coastal zone: Using a driver-pressure-state-impact-response framework to address complex environmental problems. Estuar. Coast. Shelf Sci. 2012, 96, 48–59. [Google Scholar] [CrossRef]
  10. Blackburn, S.; Marques, C. Mega-urbanization on the coast. In Megacities and the Coast: Risk, Resilience and Transformation; Pelling, M., Blackburn, S., Eds.; Routledge: London, UK; New York, NY, USA, 2013; pp. 25–26. [Google Scholar]
  11. Nursey-Bray, M.J.; Vince, J.; Scott, M.; Haward, M.; O’Toole, K.; Smith, T.; Harvey, N.; Clarke, B. Science into policy? Discourse, coastal management and knowledge. Environ. Sci. Policy 2014, 38, 107–119. [Google Scholar] [CrossRef]
  12. Cumming, G.S.; Peterson, G.D. Unifying research on social-ecological resilience and collapse. Trends Ecol. Evol. 2017, 32, 695–713. [Google Scholar] [CrossRef]
  13. Paterson, S.K.; Politi, E.; Ansong, J.; Le Tissier, M. Framing marine spatial planning: Future orientation and innovation as steps to success for global cooperation and sustainability. In Marine Spatial Planning: Methodologies, Environmental Issues and Current Trends; Kitsiou, D., Karydis, M., Eds.; Nova Science Publishers, Inc.: New York, NY, USA, 2018; pp. 197–228. [Google Scholar]
  14. Neumann, B.; Ott, K.; Kenchington, R. Strong sustainability in coastal areas: A conceptual interpretation of SDG 14. Sustain. Sci. 2017, 12, 1019–1035. [Google Scholar] [CrossRef] [Green Version]
  15. Visbeck, M.; Kronfeld-Goharani, U.; Neumann, B.; Rickels, W.; Schmidt, J.; van Doorn, E.; Matz-Lück, N.; Proelss, A. A sustainable development goal for the ocean and coasts: Global ocean challenges benefit from regional initiatives supporting globally coordinated solutions. Marine Policy 2014, 49, 87–89. [Google Scholar] [CrossRef]
  16. Newton, A. A systems approach for sustainable development in coastal zones. Ecol. Soc. 2012, 17, 3–4. [Google Scholar] [CrossRef] [Green Version]
  17. Rumson, A.G.; Hallett, S.H.; Brewer, T.R. Coastal risk adaptation: The potential role of accessible geospatial Big Data. Marine Policy 2017, 83, 100–110. [Google Scholar] [CrossRef]
  18. Espey, J.; Swanson, E.; Badiee, S.; Christensen, Z.; Fischer, A.; Levy, M.; Yetman, G.; De Sherbinin, A.; Chen, R.; Qiu, Y.; et al. Data for Development: A Needs Assessment for SDG Monitoring and Statistical Capacity Development. 2015. Available online: https://sustainabledevelopment.un.org/content/documents/2017Data-for-Development-Full-Report.pdf (accessed on 22 January 2018).
  19. Liu, J.; Mooney, H.; Hull, V.; Davis, S.J.; Gaskell, J.; Hertel, T.; Lubchenco, J.; Seto, K.C.; Gleick, P.; Kremen, C.; et al. Systems integration for global sustainability. Science 2015, 347, 963–972. [Google Scholar] [CrossRef] [Green Version]
  20. McMichael, A.J.; Butler, C.D.; Folke, C. New visions for addressing sustainability. Science 2003, 302, 1919–1920. [Google Scholar] [CrossRef] [Green Version]
  21. Chakraborty, S.; Gasparatos, A.; Blasiak, R. Multiple values for the management and sustainable use of coastal and marine ecosystem services. Ecosyst. Serv. 2020, 41. [Google Scholar] [CrossRef]
  22. Chan, C.; Armitage, D.; Alexander, S.M.; Campbell, D. Examining linkages between ecosystem services and social wellbeing to improve governance for coastal conservation in Jamaica. Ecosyst. Serv. 2019. [Google Scholar] [CrossRef]
  23. James, P. Urban Sustainability in Theory and Practice: Circles of sustainability, 1st ed.; Routledge: London, UK, 2015; pp. 1–260. [Google Scholar]
  24. Raworth, K. A Safe and Just Space For Humanity: Can We Live within the Doughnut? 2012. Available online: https://oi-files-d8-prod.s3.eu-west-2.amazonaws.com/s3fs-public/file_attachments/dp-a-safe-and-just-space-for-humanity-130212-en_0_4.pdf (accessed on 15 February 2018).
  25. Leach, M.; Raworth, K.; Rockström, J. Between social and planetary boundaries: Navigating pathways in the safe and just space for humanity. In World Social Science Report; OECD Publishing, Paris/Unesco Publishing: Paris, France, 2013. [Google Scholar]
  26. Gari, S.R.; Newton, A.; Icely, J.; Lowe, C.D. Testing the application of the systems approach framework (SAF) for the management of eutrophication in the Ria Formosa. Marine Policy 2014, 43, 40–45. [Google Scholar] [CrossRef]
  27. Mathews, R.E.; Stretz, J. Source-to-Sea Framework for Marine Litter Prevention: Preventing Plastic Leakage in River Basins; SIWI: Stockholm, Sweden, 2019. [Google Scholar]
  28. United Nations. Transforming Our World: The 2030 Agenda for Sustainable Development; United Nations: New York, NY, USA, 2015. [Google Scholar] [CrossRef]
  29. Halpern, B.S.; Longo, C.; Lowndes, J.S.; Best, B.D.; Frazier, M.; Katona, S.K.; Kleisner, K.M.; Rosenberg, A.A.; Scarborough, C.; Selig, E. Patterns and emerging trends in global ocean health. PLoS ONE 2015, 10, 1–21. [Google Scholar] [CrossRef] [Green Version]
  30. Turner, R.K.; Daily, G.C. The ecosystem services framework and natural capital conservation. Environ. Resour. Econ. 2008, 39, 25–35. [Google Scholar] [CrossRef]
  31. Simpson, R.D. The “Ecosystem Service Framework”: A Critical Assessment; United Nations Environment Programme: Division of Environmental Policy Implementation; Working Paper Series Ecosystem Services Economics (ESE), Paper No. 5; Routledge: Nairobi, Kenya, 2011. [Google Scholar]
  32. Elliott, M.; Burdon, D.; Atkins, J.P.; Borja, A.; Cormier, R.; de Jonge, V.N.; Turner, R.K. “And DPSIR begat DAPSI(W)R(M)!”-A unifying framework for marine environmental management. Marine Pollut. Bull. 2017, 118, 27–40. [Google Scholar] [CrossRef] [Green Version]
  33. Alcamo, J. Ecosystems and Human Well-Being: A framework for Assessment; Island Press: Washington, DC, USA, 2003. [Google Scholar]
  34. Schuldt, J.P.; Mccomas, K.A.; Byrne, S.E. Communicating about ocean health: Theoretical and practical considerations. Philos. Trans. R. Soc. B 2016, 371, 20150214. [Google Scholar] [CrossRef] [Green Version]
  35. Rockström, J.; Steffen, W.; Noone, K.; Persson, Å.; Chapin, F.S.; Lambin, E.F.; Lenton, T.M.; Scheffer, M.; Folke, C.; Schellnhuber, H.J.; et al. A safe operating space for humanity. Nature 2009, 461, 472–475. [Google Scholar] [CrossRef] [PubMed]
  36. Steffen, W.; Richardson, K.; Rockstrom, J.; Cornell, S.E.; Fetzer, I.; Bennett, E.M.; Biggs, R.; Carpenter, S.R.; de Vries, W.; de Wit, C.A.; et al. Planetary boundaries: Guiding human development on a changing planet. Science 2015, 437, 736–746. [Google Scholar] [CrossRef] [PubMed] [Green Version]
  37. OECD. How’s Life? 2013: Measuring Well-Being; OECD Publishing: Paris, France, 2013. [Google Scholar] [CrossRef]
  38. Raworth, K. A Doughnut for the Anthropocene: Humanity’s compass in the 21st century. Lancet Planet. Health 2017, 1, 48–49. [Google Scholar] [CrossRef]
  39. Atkins, J.P.; Burdon, D.; Elliott, M.; Gregory, A.J. Management of the marine environment: Integrating ecosystem services and societal benefits with the DPSIR framework in a systems approach. Marine Pollut. Bull. 2011, 62, 215–226. [Google Scholar] [CrossRef]
  40. LDC Group. Delivering Our Climate-Resilient Future: Lessons from a Global Evidence Review; LDC Group: Paris, France, 2019. [Google Scholar]
  41. Boyes, S.J.; Elliott, M. Marine legislation–The ultimate “horrendogram”: International law, European directives & national implementation. Marine Pollut. Bull. 2014, 86, 39–47. [Google Scholar] [CrossRef] [Green Version]
  42. Hák, T.; Moldan, B.; Dahl, A.L. Sustainability Indicators. A scientific Assessment; Island Press: Washington, DC, USA, 2007. [Google Scholar]
  43. O’Connor, M. The “Four Spheres” framework for sustainability. Ecol. Complex 2007, 3, 285–292. [Google Scholar] [CrossRef]
  44. Depietri, Y.; Kallis, G.; Baró, F.; Cattaneo, C. The urban political ecology of ecosystem services: The case of Barcelona. Ecol. Econ. 2016, 125, 83–100. [Google Scholar] [CrossRef]
  45. Depietri, Y.; McPhearson, T. Integrating the grey, green, and blue in cities: Nature-based solutions for climate change adaptation and risk reduction. In Nature-Based Solutions to Climate Change Adaptation in Urban. Areas. Theory and Practice of Urban. Sustainability Transitions; Kabisch, N., Korn, H., Stadler, J., Bonn, A., Eds.; Springer: New York, NY, USA, 2017; pp. 91–109. [Google Scholar]
  46. James, P.; Magee, L. Domains of sustainability. In Global Encyclopedia of Public Administration, Public Policy, and Governance, 1st ed.; Farazmand, A., Ed.; Springer: New York, NY, USA, 2016; p. 17. [Google Scholar]
  47. Stockholm Resilience Center. What Is Resilience? An Introduction to Social-Ecological Research. Available online: http://www.stockholmresilience.org/download/18.5ea7abe0139d0dada521ac/resilience_summary_lowX.pdf (accessed on 15 December 2017).
  48. Costanza, R.; Alperovitz, G.; Daly, H.; Farley, J.; Franco, C.; Jackson, T.; Kubiszewski, I.; Schor, J.; Victor, P. Building a Sustainable and Desirable Economy-In-Society-In-Nature; United Nations Division for Sustainable Development: New York, NY, USA, 2012. [Google Scholar]
  49. Millennium Ecosystem Assessment. Ecosystems and Human Well-Being-Synthesis; Island Press: Washington, DC, USA, 2005. [Google Scholar]
  50. Sala, S.; Ciuffo, B.; Nijkamp, P. A systemic framework for sustainability assessment. Ecol. Econ. 2015, 119, 314–325. [Google Scholar] [CrossRef]
  51. Osorio, L.A.R.; Lobato, M.O.L.; Castillo, X.A. An epistemology for sustainability science: A proposal for the study of the health/disease phenomenon. Int. J. Sustain. Dev. World 2008, 16, 48–60. [Google Scholar] [CrossRef]
  52. Meadows, D.H.; Meadows, D.L.; Randers, J.; Behrens, W.W., III. The limits to growth: A report for the Club of Rome’s project on the predicament of mankind. Demography 1973, 10, 289–299. [Google Scholar] [CrossRef]
  53. Lim, M.M.L.; Søgaard Jørgensen, P.; Wyborn, C.A. Reframing the sustainable development goals to achieve sustainable development in the Anthropocene—A systems approach. Ecol. Soc. 2018, 23. [Google Scholar] [CrossRef] [Green Version]
  54. Depledge, M.; Lovell, R.; Wheeler, B.; Morrissey, K.; White, M.; Fleming, L. Future of the Sea: Health and Wellbeing of Coastal Communities; UK Government Office for Science: London, UK, 2017.
  55. Halpern, B.S.; Longo, C.; Hardy, D.; McLeod, K.L.; Samhouri, J.F.; Katona, S.K.; Rosenberg, A.A. An index to assess the health and benefits of the global ocean. Nature 2012, 488, 615–620. [Google Scholar] [CrossRef] [PubMed] [Green Version]
  56. International Council for Science. A Guide to SDG Interactions: From Science to Implementation; Griggs, D.J., Nilsson, M., Stevance, A., McCollum, D., Eds.; International Council for Science: Paris, France, 2017. [Google Scholar]
  57. Newton, A.; Weichselgartner, J. Hotspots of coastal vulnerability: A DPSIR analysis to find societal pathways and responses. Estuar. Coast. Shelf Sci. 2014, 140, 123–133. [Google Scholar] [CrossRef]
  58. Hossain, M.S.; Dearing, J.A.; Rahman, M.M.; Salehin, M. Recent changes in ecosystem services and human well-being in the Bangladesh coastal zone. Reg. Environ. Chang. 2016, 16, 429–443. [Google Scholar] [CrossRef] [Green Version]
  59. García-Menéndez, O.; Morell, I.; Balllesteros, B.J.; Renau-Pruñonosa, A.; Renau-Llorens, A.; Esteller, M.V. Spatial characterization of the seawater upconing process in a coastal Mediterranean aquifer (Plana de Castellón, Spain): Evolution and controls. Environ. Earth Sci. 2016, 75. [Google Scholar] [CrossRef] [Green Version]
  60. Young, A.F. Coastal megacities, environmental hazards and global environmental change. In Megacities and the Coast: Risk, Resilience and Transformation; Pelling, M., Blackburn, S., Eds.; Routledge: London, UK; New York, NY, USA, 2013; pp. 70–99. [Google Scholar]
  61. Syvitski, J.P.M.; Kettner, A. Sediment flux and the Anthropocene. Philos. Trans. R. Soc. A 2011, 369, 957–975. [Google Scholar] [CrossRef]
  62. Estapè, P.E.; Martínez, A.B.; Cervera, F.V. Experience in the operation of the EDR plant at ETAP Llobregat to improve drinking water quality in Barcelona and surroundings. Tecnoaqua 2016, 50–57. (In Spanish) [Google Scholar]
  63. Nguyen, T.T.X.; Woodroffe, C.D. Assessing relative vulnerability to sea-level rise in the western part of the Mekong River Delta in Vietnam. Sustain. Sci. 2016, 11, 645–659. [Google Scholar] [CrossRef]
  64. Steffen, W.; Broadgate, W.; Deutsch, L.; Gaffney, O.; Ludwig, C. The trajectory of the Anthropocene: The Great Acceleration. Anthr. Rev. 2015, 2, 81–98. [Google Scholar] [CrossRef]
  65. O’Neill, D.W.; Fanning, A.L.; Lamb, W.F.; Steinberger, J.K. A good life for all within planetary boundaries. Nat. Sustain. 2018, 1, 88–95. [Google Scholar] [CrossRef] [Green Version]
  66. Turner, R.; Szaboova, L. Improving Access to Health and Wellbeing Support in UK Fishing Communities: Project Report; University of Exeter: Exeter, UK, 2017. [Google Scholar]
  67. Ostrom, E. A General Framework for Analyzing Sustainability of Social-Ecological Systems. Science 2009, 325, 419–422. [Google Scholar] [CrossRef]
  68. Ostrom, E. Institutional analysis, design principles and threats to sustainable community governance and management of commons. In Community Management and Common Property of Fisheries in Asia and the Pacific: Concepts, Methods and Experiences; Pomeroy, R.S., Ed.; International Center for Living Aquatic Resources Management: Manila, Philippines, 1994. [Google Scholar]
  69. Bullock, C.; Kretsch, C.; Candon, E. The Economic and Social Aspects of Biodiversity Benefits and Costs of Biodiversity in Ireland; Stationery Office: London, UK, 2008. [Google Scholar]
  70. Ferrol-Schulte, D.; Wolff, M.; Ferse, S.; Glaser, M. Sustainable Livelihoods Approach in tropical coastal and marine social-ecological systems: A review. Marine Policy 2013, 42, 253–258. [Google Scholar] [CrossRef]
  71. Hák, T.; Janoušková, S.; Moldan, B. Sustainable development goals: A need for relevant indicators. Ecol. Indic. 2016, 60, 565–573. [Google Scholar] [CrossRef]
  72. Atkins, J.P.; Burdon, D.; Elliott, M. Identification of a practicable set of ecosystem indicators for coastal and marine ecosystem service. In Coastal Zones Ecosystem Services: From Science to Values and Decision Making; Schaafsma, M., Turner, R.K., Eds.; Springer: Cham, Switzerland, 2015. [Google Scholar]
  73. UN Statistical Commission. Global Indicator Framework for the Sustainable Development Goals and Targets of the 2030 Agenda for Sustainable Development. 2017. Available online: https://unstats.un.org/sdgs/indicators/Global%20Indicator%20Framework%20after%202020%20review_Eng.pdf (accessed on 1 December 2018).
  74. UNISDR. Sendai Framework for Disaster Risk Reduction 2015–2030. 2015. Available online: https://doi.org/A/CONF.224/CRP.1 (accessed on 1 December 2018).
  75. U.S. Environmental Protection Agency. Climate Change Indicators in the United States, 4th ed.; EPA 430-R-16-004; 2016. Available online: www.epa.gov/climate-indicators (accessed on 15 February 2018).
  76. World Bank. Worldwide Governance Indicators. Available online: http://info.worldbank.org/governance/wgi/index.aspx#reports (accessed on 20 April 2018).
  77. SUSTAIN. Measuring Coastal Sustainability. A Guide for the Self-Assessment of Sustainability Using Indicators and a Means of Scoring Them. 2012. Available online: https://www.msp-platform.eu/projects/measuring-coastal-sustainability-sustain-policy-tool (accessed on 18 November 2017).
  78. DEDUCE Consortium. Indicators Guidelines: To adopt an Indicators-Based Approach to Evaluate Coastal Sustainable Development. 2007. Available online: http://im.umg.edu.pl/images/ksiazki/2007_indicators_guidelines.pdf (accessed on 17 November 2017).
  79. SPI. 2019 Social Progress Index. 2019. Available online: https://www.socialprogress.org/ (accessed on 14 February 2018).
  80. FAO. FAOSTAT Country Indicators. 2017. Available online: www.fao.org/faostat/en/#country (accessed on 14 February 2018).
  81. Halpern, B.S.; Walbridge, S.; Selkoe, K.A.; Kappel, C.V.; Micheli, F.; D’Agrosa, C.; Bruno, J.F.; Casey, K.S.; Ebert, C.; Fox, H.E.; et al. A global map of human impact on marine ecosystems. Science 2008, 319, 948–953. [Google Scholar] [CrossRef] [Green Version]
  82. Ocean Health Index. Available online: http://www.oceanhealthindex.org/methodology/components/chemical-pollution (accessed on 24 April 2020).
  83. United Nations. UN Social Indicators. 2012. Available online: https://unstats.un.org/unsd/demographic/products/socind/ (accessed on 24 April 2020).
  84. Mangroves for the Future. Annual report 2014. 2014. Available online: http://www.mangrovesforthefuture.org/assets/Repository/Documents/2014-MFF-Annual-Report.pdf (accessed on 24 April 2020).
  85. OECD. Income Inequality (Indicator). 2020. Available online: https://www.oecd-ilibrary.org/social-issues-migration-health/income-inequality/indicator/english_459aa7f1-en (accessed on 14 March 2020).
  86. De Castro, M.; Martín-Vide, J.; Alonso, S. El Clima De España: Pasado, Presente Y Escenarios De Clima Para El Siglo XXI. 2005. Available online: https://www.miteco.gob.es/es/cambio-climatico/temas/impactos-vulnerabilidad-y-adaptacion/01_el_clima_de_espana_2_tcm30-178492.pdf (accessed on 7 April 2018).
  87. Magrama. Perfil Ambiental de España 2016. 2016. Available online: https://www.miteco.gob.es/es/calidad-y-evaluacion-ambiental/publicaciones/pae_2016_reducido_tcm30-439388.pdf (accessed on 10 April 2018).
  88. Magrama. Spanish National Ecosystems Assessment. Ecosystems and Biodiversity for Human Well-Being. Synthesis of Key Findings. 2013. Available online: http://www.ecomilenio.es/ecosystems-and-biodiversity-for-human-wellbeing-snea-synthesis-of-key-findings-download/3661 (accessed on 10 April 2018).
  89. Magrama. Estrategia de Adaptación al Cambio Climático de la Costa Española. 2016. Available online: https://www.miteco.gob.es/es/costas/temas/proteccion-costa/estrategiaadaptacionccaprobada_tcm30-420088.pdf (accessed on 11 April 2018).
  90. Observatorio de la Sostenibilidad. Cambios de Ocupación del Suelo en la Costa. 2016. Available online: http://www.datosdelanzarote.com/Uploads/doc/Cambios-de-ocupaci%C3%B3n-del-suelo-en-la-costa-2016-20160819112519134COSTA-16.pdf (accessed on 11 April 2018).
  91. DG MARE. Study on Deepening Understanding of Potential Blue Growth in the EU Member States on Europe’s Atlantic arc; Country paper–final Spain; DG MARE: Brussels, Belgium, 2014. [Google Scholar]
  92. European Environment Agency. Spanish Bathing Water Quality in 2016. 2016. Available online: https://www.eea.europa.eu/themes/water/europes-seas-and-coasts/assessments/state-of-bathing-water/country-reports-2016-bathing-season/spain-2016-bathing-water-report (accessed on 20 April 2018).
  93. Instituto Nacional de Estadística. Anuario Estadístico de España. 2010. Available online: https://www.ine.es/prodyser/pubweb/anuarios_mnu.htm (accessed on 21 April 2018).
  94. Gobierno de España. Ley de Protección y Uso Sostenible del Litoral. 2013. Available online: https://www.boe.es/boe/dias/2013/05/30/pdfs/BOE-A-2013-5670.pdf (accessed on 21 April 2018).
  95. García Sanabria, J.; García Onetti, J.; Barragán Muñoz, J.M. Las Comunidades Autónomas y la Gestión Integrada de las Áreas Litorales de España. 2011. Available online: http://www.upv.es/contenidos/CAMUNISO/info/U0652470.pdf (accessed on 24 April 2018).
  96. Eurostat. Maritime Economy Statistics-Coastal Regions and Sectoral Perspective. 2015. Available online: http://ec.europa.eu/eurostat/statistics-explained/index.php?title=Archive:Maritime_economy_statistics_-_coastal_regions_and_sectoral_perspective (accessed on 16 February 2018).
  97. Dove, C. Galicia Leads Spain in Aquaculture Production. 2010. Available online: https://www.seafoodsource.com/news/aquaculture/galicia-leads-spain-in-aquaculture-production (accessed on 17 May 2018).
  98. Collet, I. Portrait of EU Coastal Regions, Eurostat Agriculture and Fisheries. 2010. Available online: http://edz.bib.uni-mannheim.de/www-edz/pdf/statinf/10/KS-SF-10-038-EN.PDF (accessed on 20 March 2018).
  99. Torres Alfosea, F.J. Cuarenta años de leyes de costas en España (1969–2009). Investig. Geogr. 2010, 52, 167–200. [Google Scholar] [CrossRef] [Green Version]
  100. RISC-KIT. RISC-KIT: Governance: Spain. Available online: http://coastal-management.eu/governance/spain (accessed on 18 May 2018).
  101. Molina, I.; Homs, O.; Colino, C. Sustainable Governance Indicators: 2015 Spain Report; Bertelsmann Stiftung: Gütersloh, Germany, 2015. [Google Scholar]
  102. Observatorio de la Sostenibilidad, Greenpeace España. A Toda Costa. 2018. Available online: https://es.greenpeace.org/es/wp-content/uploads/sites/3/2018/07/A-Toda-Costa-Cast-DEF.pdf (accessed on 19 May 2018).
  103. Semeoshenkova, V.; Newton, A. Overview of erosion and beach quality issues in three Southern European countries: Portugal, Spain and Italy. Ocean. Coast. Manag. 2015, 118, 12–21. [Google Scholar] [CrossRef]
  104. Froese, R.; Winker, H. Minimizing the impact of fishing. Fish. Fish. 2016, 17, 785–802. [Google Scholar] [CrossRef]
  105. Yrigoy, I. The Impact of Airbnb in the Urban Arena: Towards a Tourism-Led Gentrification? The Case-Study of Palma Old Quarter (Mallorca, Spain). 2016. Available online: https://core.ac.uk/download/pdf/154376904.pdf (accessed on 24 April 2018).
  106. Bowen, R.E.; Kress, M.; Morris, G.; Rothman, D.S. Integrating frameworks to assess human health and well-being in marine environmental systems. In Oceans and Human Health: Implications for Society and Well-Being, 1st ed.; Bowen, R.E., Depledge, M.H., Carlarne, P.C., Fleming, L.E., Eds.; Wiley Blackwell: Hoboken, NJ, USA, 2014; Volume 1, pp. 23–48. [Google Scholar]
  107. Mooney, H.A.; Duraiappah, A.; Larigauderie, A. Evolution of natural and social science interactions in global change research programs. Proc. Natl. Acad. Sci. USA 2013, 110, 3665–3672. [Google Scholar] [CrossRef] [Green Version]
  108. Hoekstra, A.Y.; Wiedmann, T.O. Humanity’s unsustainable environmental footprint. Science 2014, 344, 1114–1118. [Google Scholar] [CrossRef]
  109. Cole, M.J.; Bailey, R.M.; New, M.G. Tracking sustainable development with a national barometer for South Africa using a downscaled “safe and just space” framework. Proc. Natl. Acad. Sci. USA 2014, 111, E4399–E4408. [Google Scholar] [CrossRef] [PubMed] [Green Version]
  110. Meyer, K.; Newman, P. The Planetary Accounting Framework: A novel, quota based approach to understanding the planetary impacts of any scale of human activity in the context of the safe-operating-space. Sustain. Earth 2018, 1, 1–21. [Google Scholar] [CrossRef] [Green Version]
  111. Muff, K.; Kapalka, A.; Dyllick, T. The Gap Frame-Translating the SDGs into relevant national grand challenges for strategic business opportunities. Int. J. Manag. Educ. 2017, 15, 363–383. [Google Scholar] [CrossRef]
Figure 1. Framework organization summary. The framework is represented in the center; on the left side is the transdisciplinary content that it intends to include in the assessment, as well as the frameworks used in its creation, and on the right side is the policy goal that it is based on.
Sustainability 12 04886 g001
Figure 2. Graphical representation of the of the CCS showing the domains (in the quadrants) and categories (in the rectangles), which provide descriptors of critical criteria for coastal sustainability.
Sustainability 12 04886 g002
Figure 3. Environment and Ecology domain categories (in blue) and sub-categories (in green).
Sustainability 12 04886 g003
Figure 4. Social and Cultural domain categories (in blue) and sub-categories (in green).
Sustainability 12 04886 g004
Figure 5. Economics domain categories (in blue) and sub-categories (in green).
Sustainability 12 04886 g005
Figure 6. Governance and policy domain categories (in blue) and sub-categories (in green).
Sustainability 12 04886 g006
Figure 7. Example of a graphical representation of the circles of coastal sustainability (CCS) framework. The goal of sustainability is at the center of the circle, the ‘bull’s eye’.
Sustainability 12 04886 g007
Figure 8. The CCS resulting from an analysis of the coastal situation in Spain.
Sustainability 12 04886 g008
Table 1. Summary of key guiding frameworks analyzed during the development of the Circles of Coastal Sustainability (CCS).
FrameworkAuthorsApproachKey focusLimitations
Planetary Boundaries (PB)Rockström et al. [35], Steffen et al. [36].Assessment of the state of biophysical thresholds at a planetary level.Focuses on biophysical processes, measuring thresholds. Does not include social, economic, and political aspects that ultimately drive the root causes resulting in the transcending of identified boundaries.
Ocean Health IndexHalpern et al. [29]Assessment of the state of the world’s oceans considering environmental, social, and economic variables.Focuses on indicators relating ecosystem services to socio-economic aspects of ocean and coastal spaces and interdependency with human well-being. Does not provide an analysis of the governance and policies related to coastal zones.
Circles of Sustainability FrameworkJames et al. [23]Assessment of sustainability in urban settlements integrating social, political, economic, and environmental spheres. Focuses on assessing sustainability and on managing projects directed towards socially sustainable outcomes. Is mostly used for cities and urban settlements.It was developed for urban applications, and does not offer a specific approach to coastal areas.
How’s Life?OECD [37]Assessment of the promises and pitfalls for people’s well-being, highlighting the inequalities across OECD’s countries.Exposes divisions according to age, gender, and education to deliver an assessment of people’s well-being using about 50 indicators.Assesses socio-economic indicators only, aimed specifically at evaluating human well-being.
Doughnut of Social and Planetary Boundaries (Safe and Just Space Framework)Raworth [24,38]Combination of PB and social thresholds, defining a “safe” space for human development within the doughnut.Focuses on the social and ecological as two domains that underpin human well-being. Provides an important critique of literature on the interdependency between social shortfall and ecological overshoot.Provides a holistic complement for the Planetary Boundaries framework by adding social and economic thresholds; it is general and not specific for coastal assessments.
Ecosystem
Services Framework
Atkins et al. [39]Highlights the long-term role that healthy ecosystems play in the sustainable provision of human well-being, economic development, and poverty alleviation.Focuses on how the efficient and effective management of ecosystems (living natural capital) can sustain the provision of vital ecosystem services.Is often used to assess individual services, failing to provide a holistic outlook.
Table 2. Indicator sets used for the selection of indicators for the CCS domains, categories, and sub-categories.
DomainIndicator Set ConsultedCategory/Sub-CategorySuggested Indicators
EnvironmentEcosystem Indicators for Coastal and Marine Ecosystem Services [72]
SDG indicators (Targets 6.6; Goals 13 and 14) [73]
Sendai Framework [74]
U.S Environmental Protection Agency [75]
Planetary Boundaries [36]
1.Alterations of landscapes
Land
  • Land cover (coverage of unaltered beach and dune systems, aquaculture, agricultural land, built-up surfaces, impermeable surfaces, protected areas)
  • People and assets at risk in coastal areas
Sea
  • Land reclamation
  • Change in natural seascape
  • Change in the extent of water-related ecosystems over time
  • Existence and extension of Marine Protected Areas (MPAs)
  • Presence of offshore development activities
Shoreline
  • Change in extent of natural barriers (% cover, ha)
  • Presence of shoreline-hardening infrastructures
2.Ecosystem function
Biodiversity loss
  • Species diversity and abundance, rate of native species extinction
  • Invasive species diversity and abundance
  • Change in area of habitat (per ha)
Services
  • Area of wetlands located in flood risk zones
  • Natural hazard regulation
  • Carbon sequestration
3.Global environmental change
Climate change
  • Ocean acidification trends
  • Changes/predictions in sea level
  • Atmospheric/ocean heat/sea surface temperature changes over time
Natural change
  • Effect on climate parameters (temperature, rainfall, wind)
  • Frequency of extreme events over time (floods, storm surges, hurricanes)
  • Coastal flooding frequency and extent
4.Shifts in hydrodynamics
Waves and tides
  • Current speed and direction (m/s)
  • Tidal range (m)
  • Wave height (m)
5. Biogeochemical and physical flows
Nitrogen and phosphorus
  • Nutrient load to coast (ton/yr)
  • Nitrogen concentration (mg/L)
  • Phosphorus concentration (mg/L)
  • Oxygen – Redox
Carbon
  • Quantity of primary production (g C per unit area/volume)
  • Carbon sequestration
  • Auto-/heterotrophic systems
Freshwater cycles
  • Volume of freshwater
  • Level of water stress: Freshwater withdrawal as a proportion of available freshwater resources
Sediment cycles
  • Erosion/accretion patterns over time
Social and CulturalEcosystem Indicators for Coastal and Marine Ecosystem Services [72]
How’s life? Framework [37]
World Development Indicators [76]
SDG indicator 6.1 [73]
SUSTAIN indicator set [77]
Ocean Health Index [55]
Indicators Guidelines [78]
Social Progress Index [79]
FAO 2017 [80]
Halpern et al. [81]
Ocean Health Index [82]
O’Neill et al. [65]
United Nations 2012 [83]
Depietri et al. [44]
Mangroves for the future [84]
1. Societal benefits
Goods and services
  • Nutrition from seafood consumption (g protein/year or g protein/year/head or per household);
  • Nutrition from non-human seafood consumption (g protein/year)
  • Number of people/businesses who rely on ornamental artifacts (no.)
  • Quantity of biomass harvested for energy production
Bathing water quality
  • Proportion of population without access to improved sanitation facilities (as a proxy for pathogen contamination)
  • Percentage of population served with wastewater systems
  • Land-based organic pollution [80], land-based inorganic pollution (based on run-off from impermeable surfaces), ocean-based pollution based on commercial shipping and port traffic [81,82]
2. Demographics
Population/age structure/trends
  • Percentage of total population living in coastal zones *
  • Healthy life expectancy
  • Demographic dependency
Migration and immigration
  • Coastal population growth progression
Social class
  • Average household income
  • Percentage of population at risk of poverty
  • Percentage of population with a higher education qualification
  • Ratio of first to second and holiday homes
3. Social well-being
Recreation and access
  • No. of transportation means and percentage
  • Percentage of designated bathing beaches with lifeguard provision during the bathing season
Food and water security
  • Undernourishment
  • Proportion of population using safely managed drinking water services
  • Saltwater intrusion occurrence
Health
  • Percentage of inhabitants within 10 km or 30 min of a hospital.
  • Deaths from infectious diseases
  • Coastal water quality
4. Identify
Sense of place/Sense of self
  • No. of tourist/resident population/year
  • No. of visitors to cultural and natural sites per annum
5. Social resilience
Vulnerability
  • Social cohesion
  • Age, disability, and gender
Education
  • Literacy rate of adult population (%)
  • Secondary education gross enrollment ratio
  • Environmental awareness
EconomicsWorld Development Indicators [76]
SDG indicators [73]
Ocean Health Index [55]
Ferrol-Schulte et al. [70]
Mangroves for the future [84]
Indicators Guidelines [78]
SUSTAIN indicator set [77]
Social Progress Index [79]
OECD [85]
1. Security
Livelihoods
  • Percentage of yearly livelihoods (fishing, fish processing, tourism…)
  • Percentage of seasonal livelihoods
  • Access to credit, savings, and insurance
  • Dependency on coastal services
  • Access to social security
Gender
  • Percentage of women employed
Employment patterns
  • Unemployment (by gender)
  • Vulnerable employment
  • Seasonal employment
2. Infrastructure
Energy supply
  • Share of energy generated from renewable sources
  • Percentage of population with access to energy
Transport
  • Percentage of passenger km using something other than private car
  • Percentage of goods transported through ports and by train
Access
  • Existence of ports, airports, and bus stations
  • Existence of roads, waterways, and channels
  • Existence of walking paths
3. Economic well-being
Equality/Income/Housing
  • Gini index
  • Household prosperity
  • Availability of affordable housing
4. Industry
Renewable (non-extractive)
  • Number of economic activities
  • Revenue per sector
Extractive
  • Number of economic activities
  • Revenue per sector
5. Dependency
Resource
  • Percentage of the overall employed workforce by sector
  • Percentage of coastal-dependent jobs
  • Livelihood dependency on coastal ecosystem services
Diversity
  • Degree of livelihood diversification
Governance and PolicyWorld Development Indicators [76]
SDG indicators (5.5) [73]
Depietri et al. [44]
1. Organization
Civil and NGOs
  • Social cohesion
  • Existence/number of environmental-oriented collective action groups
  • Existence/number of environmental-oriented NGOs
2. Law and justice
Legislation
  • Existence of legislation to rule over coastal and marine resources, occupation, litter, wastewater disposal, etc.
Efficacy
  • Existence of protected areas
  • Regulatory quality in coastal issues
Enforcement
  • Rule of law (World Bank, 2016)
  • Environmental conflict resolution and mediation quality
3. Representation and power
Effectiveness
  • Government effectiveness
  • Voice and accountability in environmental issues
  • Number of women occupying representation posts
4. Legitimacy and accountability
  • Democratic quality
  • Corruption control
5. Coastal management
Plans and management
  • Environmental management decentralization level
  • Existence of regulations over fishing, coastal development, aquaculture…
  • Occurrence of stakeholder conflict over coastal resource use

