Table 4 presents the number of total monthly hospitalizations for respiratory diseases from 2008 to 2017. The monthly average number of hospitalizations for respiratory diseases was approximately 2518 people/month, while the annual average was above 30,215 hospitalizations/year. Hospitalizations were concentrated between April and September, which are less rainy months in São Paulo.
Table 5 presents the costs of these hospitalizations. The average monthly cost was around 927,000 USD/month, and the annual average was 11.12 million USD/year. In 2013 and 2014, the highest expenses for hospitalizations were observed at 51 million USD in each year. Between 2008 and 2017, more than 302,000 hospitalizations due to pollutant exposure were observed in São Paulo at a total cost of over 111 million USD for the Brazilian health system [
5], which is equivalent to an average cost of 368.18 USD/hospitalization. According to WHO [
17], improving the air quality by replacing fossil fuels with renewable fuels such as biodiesel could reduce pollutant emissions by 30%, which would have resulted in a total savings for SUS of 33.3 million USD during this period. This value could be invested in urban mobility measures (e.g., bicycle paths, railway lines, and subways) to relieve the use of cars in the expanded center and reduce pollutant emissions.
In the city of São José do Rio Preto in São Paulo state, Mantovani et al. [
33] reported excess hospitalizations for respiratory diseases due to pollutants was on the order of 650 cases in 3 years, which represents an increase in spending of around 50,000 USD for the SUS. In the city of Volta Redonda in Rio de Janeiro state, Paiva [
35] estimated the annual spending on hospitalizations due to pollutant exposure from 2005 to 2007 to be 44,000 USD. Thus, the negative impact of pollutant emissions on the population’s quality of life was observed along with the economic setback to the public health system, which could have used these costs to invest in improving infrastructure to better serve the population.
4.1. Effects of Particulate Matter Emissions
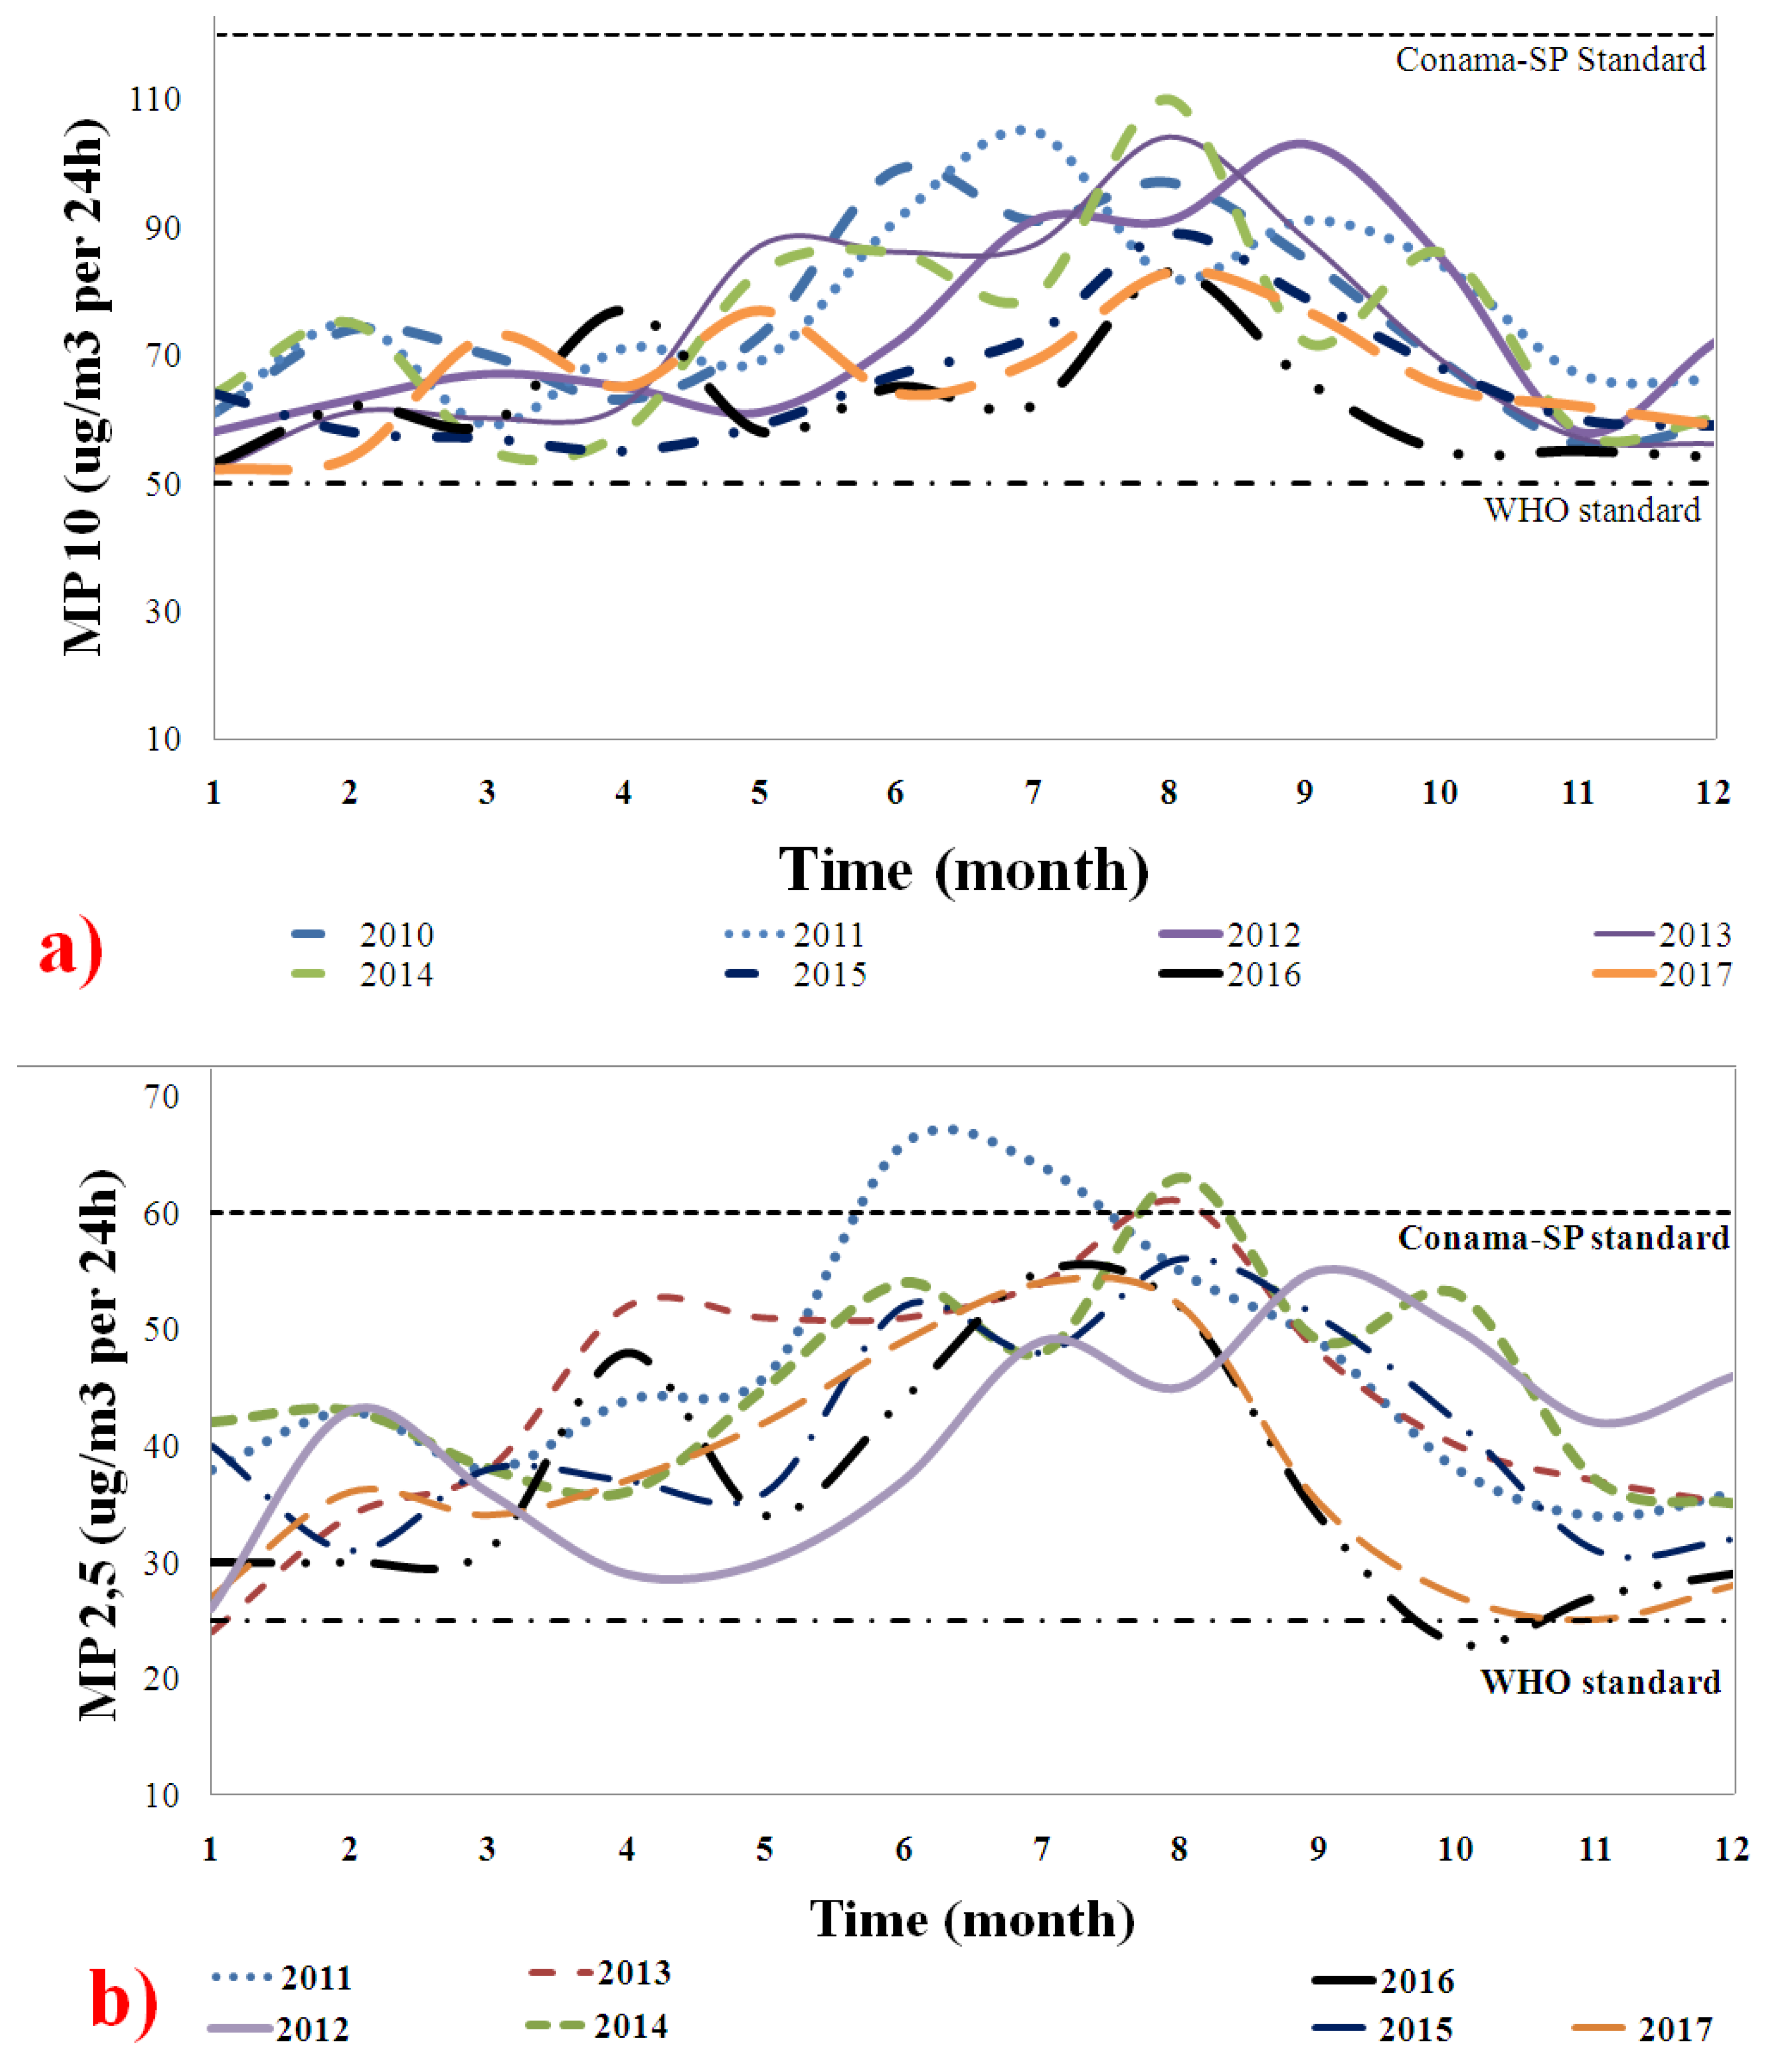
Figure 1 shows the behavior of the (a) PM
10 and (b) PM
2.5 emissions from 2010 to 2017. The concentrations (µg/m
3) per day were compared to the WHO and CONAMA-SP standards to determine whether they exceeded the recommended exposure limits [
17,
36]. The PM
2.5 values were collected from 2011, so no 2010 data were available. Both curves clearly show increased emissions between June and September, which coincides with the periods of no rain. The PM concentrations doubled from the initial values between July and August. Throughout the study period, the PM concentrations were above the recommended WHO standard [
17]. In June and August, the PM concentrations exceeded the Brazilian standard, which is less strict than the WHO standard. These high PM concentrations were due to the burning of fossil fuels and dust from roads and construction. They can cause airway irritation, induce oxidative stress in the lungs and bronchial tubes, and consequently lead to systemic inflammation. They can also cause bronchial remodeling, COPD, and even cancer after chronic exposure [
3,
18]. The PM concentrations were considered extreme and major contributors to the poor respiratory health of the population. Arbex et al. [
3] proved that PM
2.5 can reach the pulmonary alveoli, pass through the bloodstream, and cause COPD. The data for PM
2.5 are alarming and call attention to the lack of rigor regarding compliance to current legislation. The data confirm the difficulty for the government to establish effective public policies for emission control. Sustainable and urban mobility solutions are needed for São Paulo.
Missagia et al. [
32] conducted a similar study in the city of Vitória-ES, monitoring exposure to PM
2.5 emissions for 39 days. They observed that the emissions exceeded the range recommended by WHO for five days of this period and an increase in hospitalization cases for asthma, bronchitis, rhinitis, and seizures of coughs and sneezing. In the city of Rio Branco-Acre, Mascarenhas [
44] found that the PM
2.5 concentration significantly increased during the forest biomass burning period, which increases asthma cases for hospitals in the region in children under 10 years old.
Ghering et al. [
9] followed the first eight years of life of 3863 children in communities in the north, west, and central Netherlands. High PM
2.5 levels were associated with increases of 28%, 29%, and 15%, respectively, in the above regions in the incidence and prevalence of asthma symptoms. Similarly, Pandya et al. [
45] reported increased cases of bronchial asthma and allergic respiratory diseases due to excessive exposure to PM
10 from burning fuels, especially diesel.
Recently, Santos et al. [
39] observed an association between continuous PM
2.5 exposure and increased blood pressure in hypertensive outdoor workers. Similar results were obtained for pregnant women in China [
41]. The association between PM
2.5 and the mortality of people in risk groups has been proven by Erickson et al. [
38] in Canada and Polezer et al. [
46] in Brazil, which demonstrates that this pollutant is one of the most aggressive against humans.
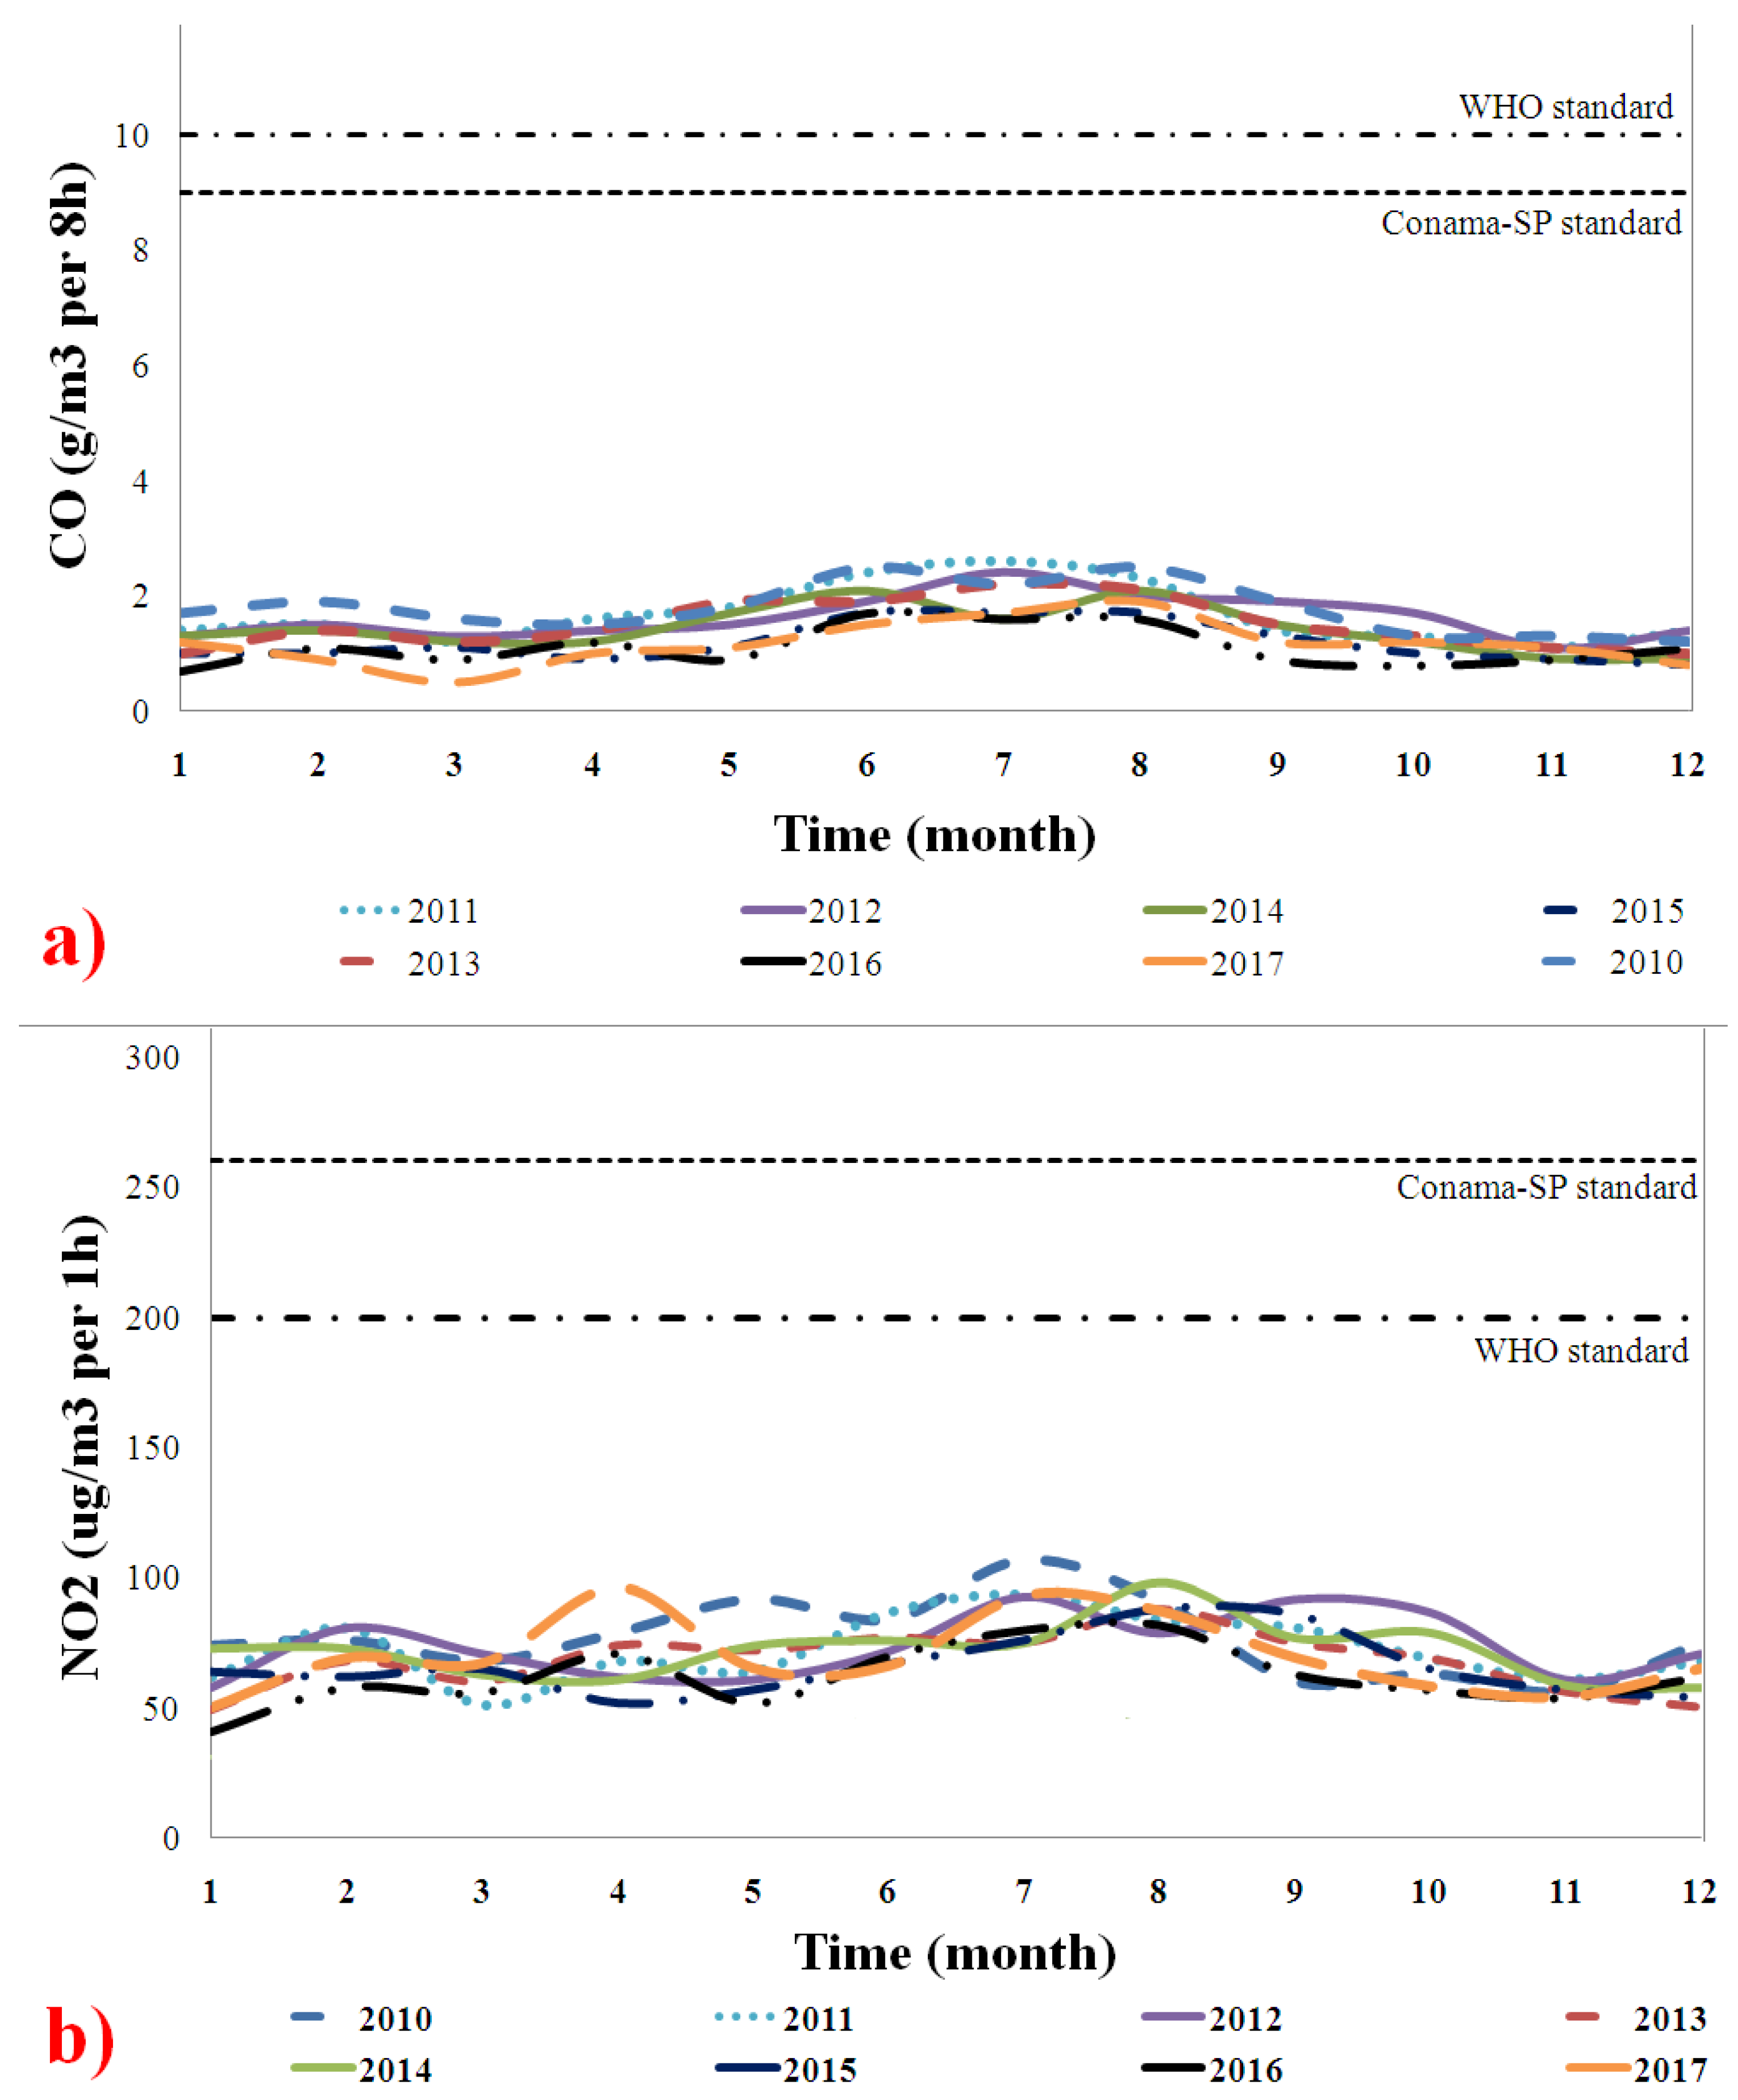
4.2. Effects of Carbon Monoxide (CO) and Nitrogen Dioxide (NO2) Emissions
Figure 2 shows the behavior of (a) CO and (b) NO
2 emissions from 2010 to 2017. The concentrations (µg/m
3) per day were compared with the limits set by the WHO and CONAMA-SP standards. The CO and NO
2 emissions were within the limits of both standards (WHO and CONAMA-SP); this indicates that their harmful effects on the respiratory health of the São Paulo population were neutral or low [
17,
36].
According to Arbex et al. [
3], excessive exposure to CO can cause vomiting, nausea, and dizziness; new-born children are the patients most susceptible to these diseases. In São Paulo, Pacheco [
47] found an association between CO and upper airway infections. Barbosa et al. [
48] analyzed the association between pollution and pediatric emergency care for sickle cell disease patients and found that CO and O
3 were associated with increases in total care of 16.5% and 9.8%, respectively. However, the Brazilian Institute of Geography and Statistics (IBGE) reported that the infant mortality rate in São Paulo fell from 11.91 deaths per 10,000 births in 2010 to 10.91 deaths in 2017 [
49]. This is evidence that controlling these emissions may minimize their effects on the death of children.
Arbex et al. [
3] explained that NO
2 has irritating potential and affects the mucosa of the nose and throat, which causes coughing and allergies. Negrisoli and Nascimento [
50] investigated the prevalence of allergic respiratory diseases in children and considered different urban regions and the flow of vehicles. Their results indicated that areas with intense vehicular traffic have a prevalence of asthma, rhinitis, and other symptoms associated with NO
2 emissions. Vieira et al. [
51] observed that NO
2 caused symptoms typically associated with respiratory diseases in children from the urban area of São Paulo. The entire population exhibited wheezing, which is characteristic of asthma, at some stage of the study.
In the present study, even though the observed emissions were not at significant levels according to national and international standards, the importance of monitoring them and applying corrective actions to minimise exposure was emphasised.
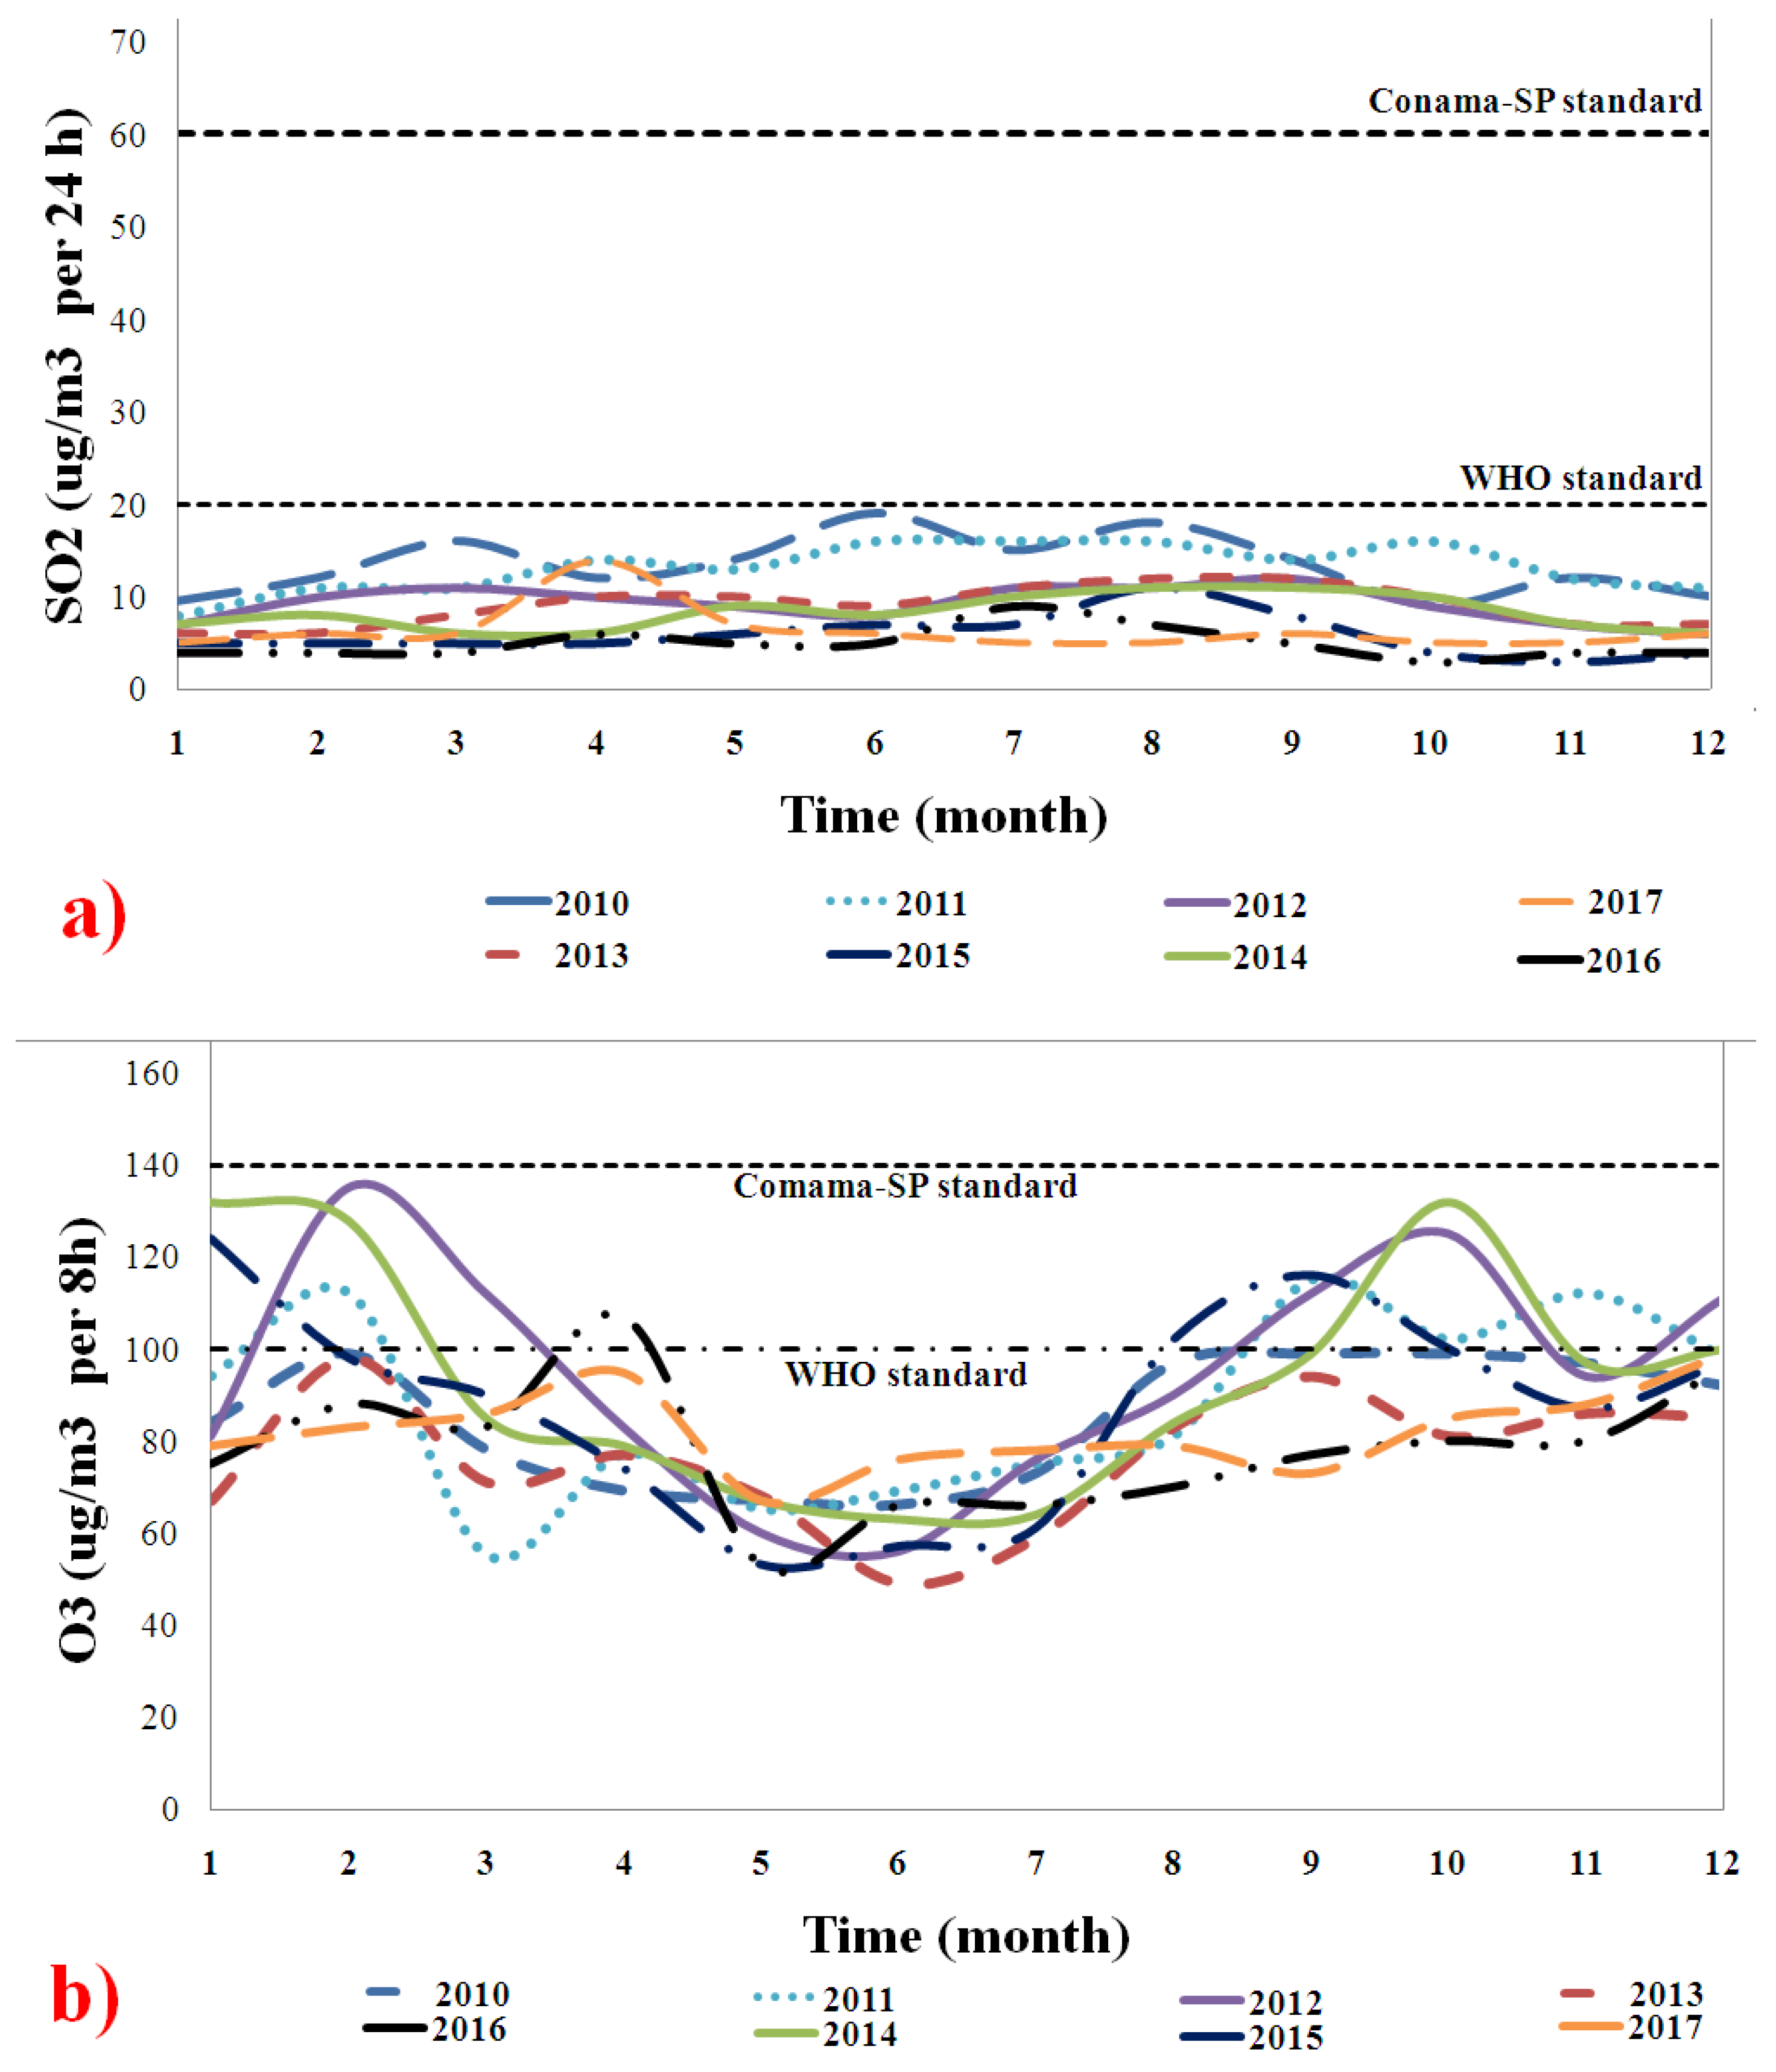
4.3. Effects of Sulfur Dioxide (SO2) and Ozone (O3) Emissions
Figure 3 shows the behavior of (a) SO
2 and (b) O
3 emissions from 2010 to 2017. The concentrations (µg/m
3) per day were compared to the WHO and CONAMA-SP standards. The SO
2 emissions were below the WHO and CONAMA-SP standards throughout the study period.
Arbex et al. [
3] demonstrated that SO
2 may compromise the thyroid, bronchi, and bronchioles, which can cause an allergic reaction and bronchoconstriction. Santos et al. [
15] associated maternal exposure to SO
2 with a low birth weight. Xiaolin et al. [
52] indicated that short periods of exposure to SO
2 can cause changes in lung function and respiratory symptoms. In this study, however, the SO
2 levels were in accordance with the norms, so we cannot make these associations reported in the literature.
Figure 3b shows that O
3 emissions were above the WHO standards in November and February (i.e., rainiest period in São Paulo) for 2010 to 2014. The formation of O
3 is due to the chemical reaction between primary pollutants such as CO, NOx, and hydrocarbons and sunlight [
53]. In São Paulo, the first months of the year are summer; even though it is rainy, the solar incidence and lightning storms are corroborated with the intensification of chemical reactions that produce ozone. The same happens at the end of the year with spring, which is not rainy but has high temperature and solar intensity.
According to Arbex et al. [
3], O
3 induces respiratory inflammation, airway obstruction, coughing, and discomfort. Nardocci [
54] associated the air pollution from the intense traffic with increased respiratory and cardiovascular problems, particularly in the elderly and children, due to O
3. In the city of Cubatão, Jasinski et al. [
55] evaluated the effects of pollution on respiratory morbidity in children and adolescents. Their results showed that chronic effects due to O
3 were observed in children from 0 to 10 years old, while the effects of acute exposure to O
3 was observed in adolescents.
In general, emissions have been observed to be directly related to aggravated cases of respiratory diseases in cities with heavy vehicle traffic, such as São Paulo. The most influential pollutants in this study were PM10, PM2.5, and O3, which exceeded the limits set by the CONAMA and WHO standards and are potentially harmful to the respiratory health of the population.
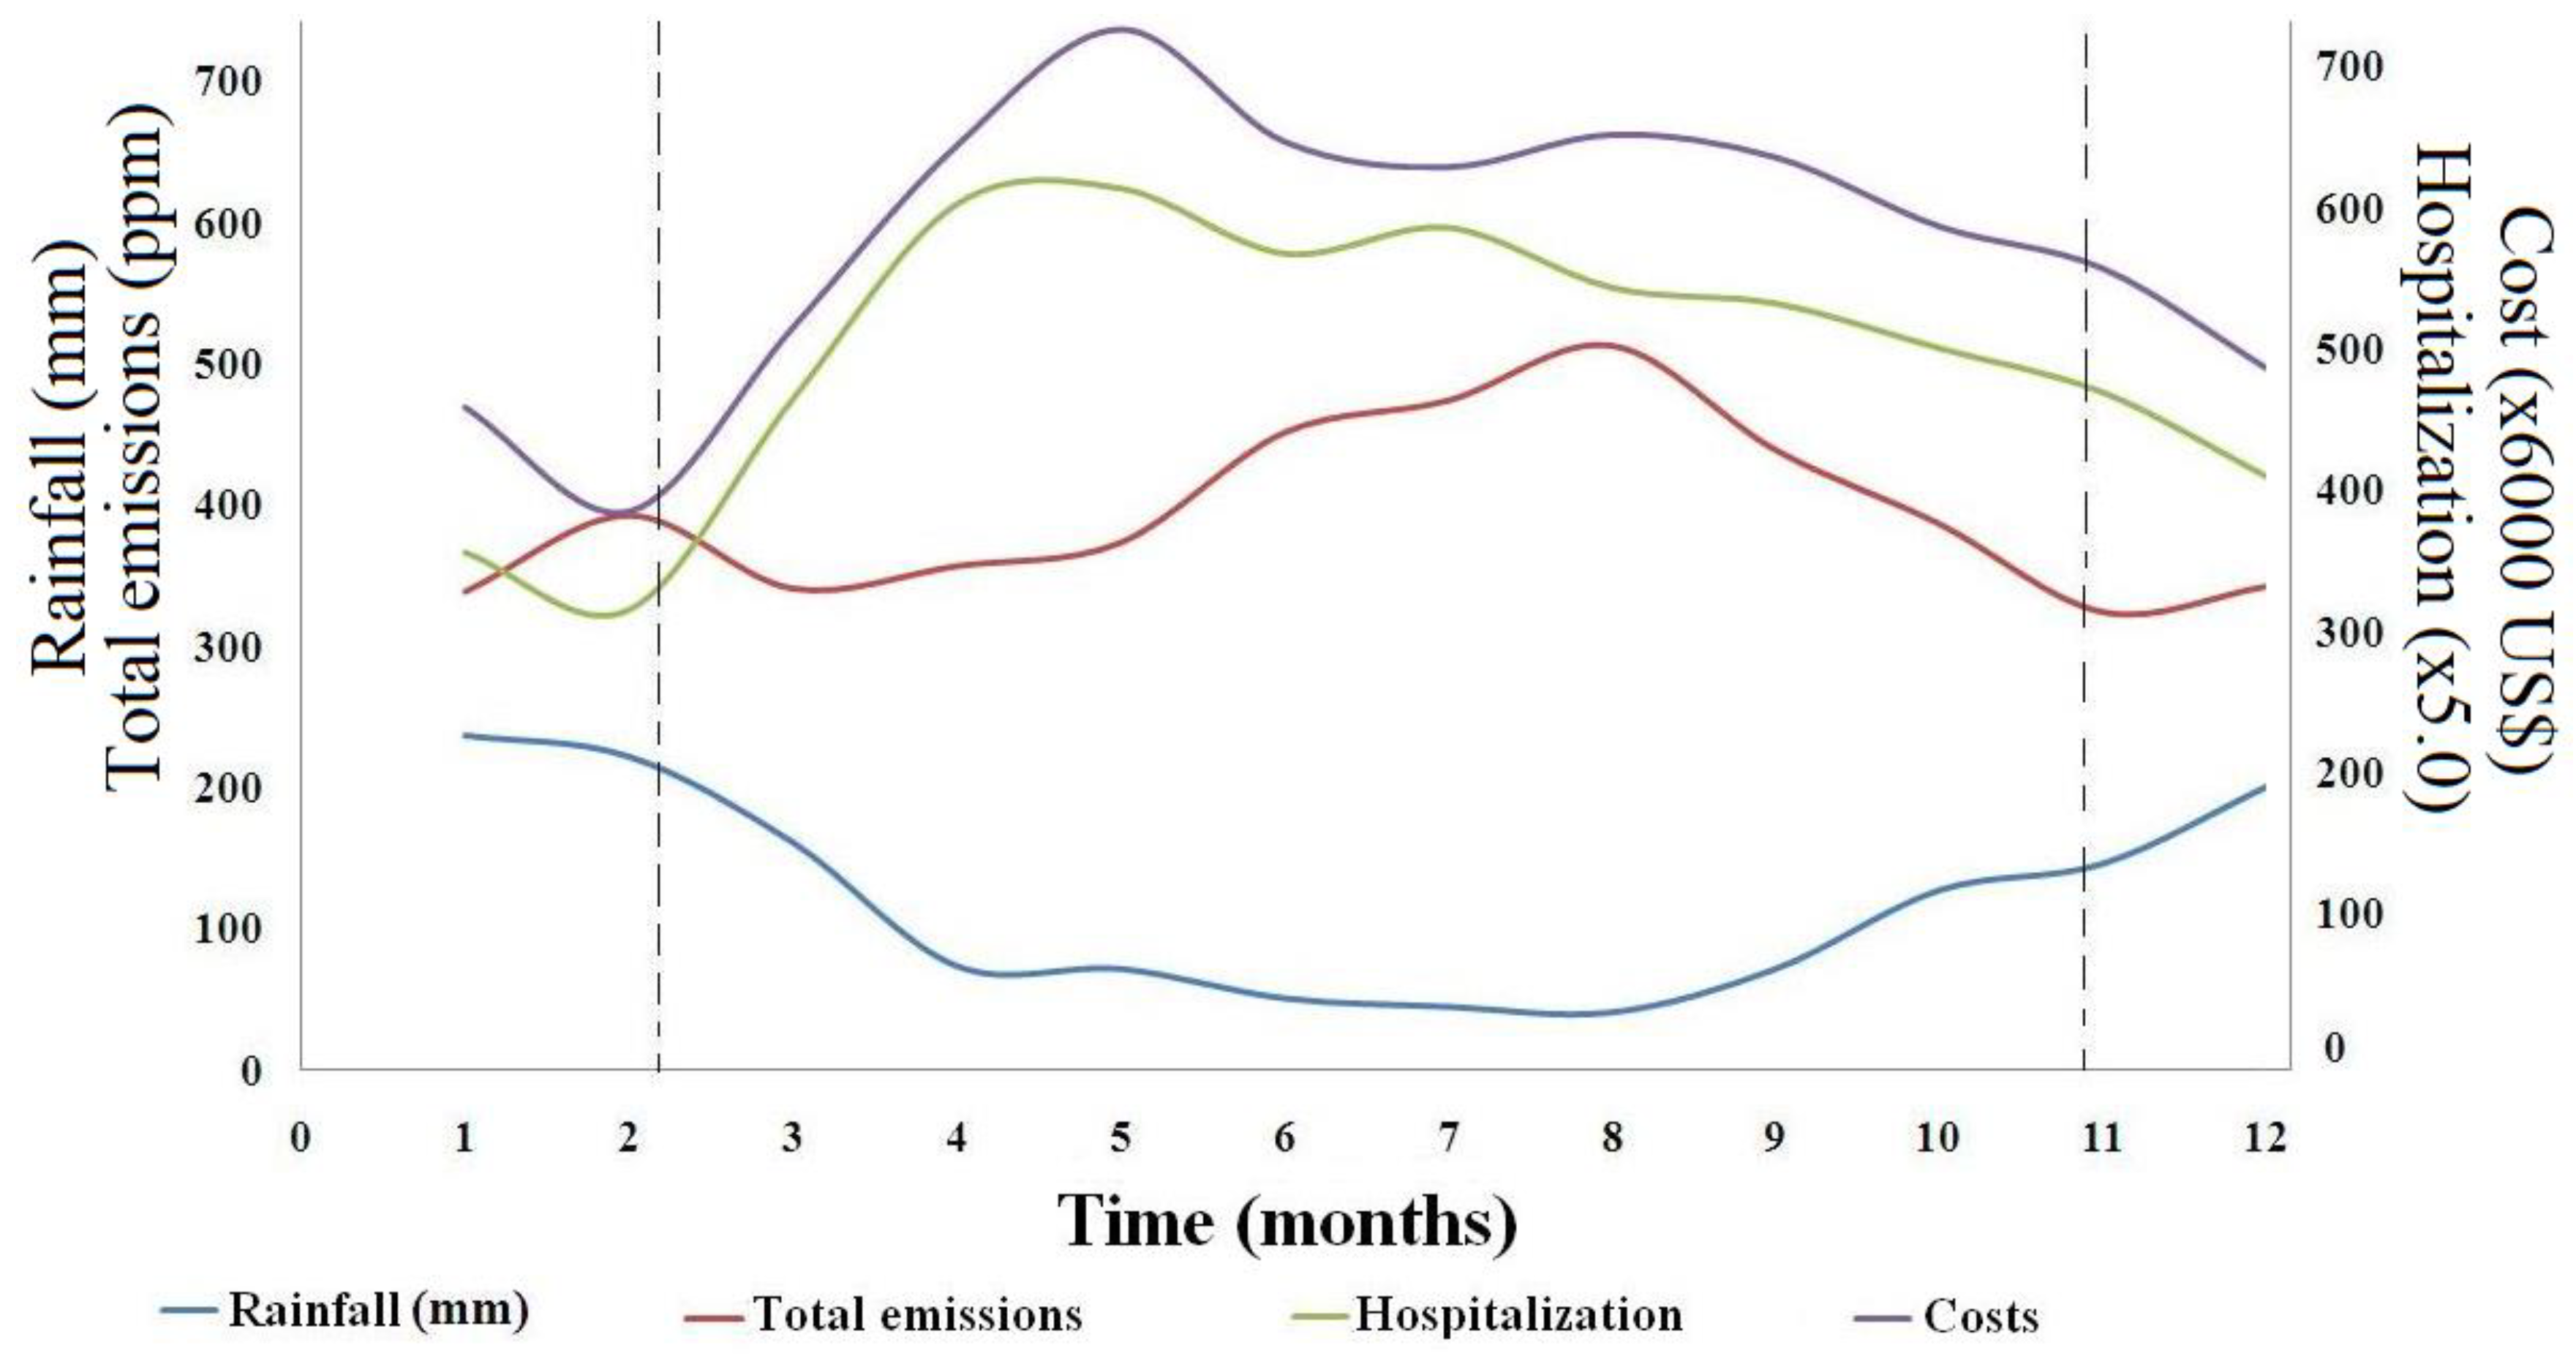
4.4. Rainfall Effect
Figure 4 shows the monthly changes in the total emissions, costs, number of hospitalizations, and rainfall. The data comprised the sum of all emission parameters in the same month from 2010 to 2012. Yu et al. [
16] suggested that the sum of the contributions of all pollutants is the best way to reflect the linear relationship between air pollution and health risks. The same sum was correlated with the costs and number of hospitalizations, which resulted in the curves of the figure. When rainfall decreased, especially in May and September (cold months with the lowest rainfall), there was an increase in pollutant emissions that consequently affected the population’s health by increasing the number of hospitalizations for respiratory diseases. Rain is responsible for gas dispersion and consequently improves the air quality. Therefore, November and February showed a decrease in hospitalizations due to respiratory diseases because of a reduction in emissions.
According to Duhanyan and Roustan [
56] and Zhao et al. [
57], the decrease in the concentration of most polluting gases is associated with the below-cloud scavenging by precipitation, in which atmospheric particles are eliminated by falling raindrops. Aerosol particles released or formed in the atmosphere can be removed by wet scavenging or dry deposition. Wet scavenging is responsible for cleaning the polluted atmosphere [
57]. The process of particulate transport models based on mass continuity equations, which is influenced by raindrop and PM radius, concentration, air temperature and pressure, and the distance of the falling raindrop to the bottom of the cloud [
56].
The climate in the city of São Paulo is very rainy between November and March, which facilitates the removal of pollutants by below-cloud scavenging, improving air quality during this period; the opposite effect is observed between May and September, which has a cold and dry climate. Below-cloud scavenging also explains the removal of the other polluting gases mentioned above [
56,
57].
In the city of São Carlos, Cruz et al. [
58] proved a relationship between the increased hospital admissions due to respiratory diseases and climate change for 2008–2012. Natali et al. [
59] suggested that the increased number of hospitalization cases in children and adolescents due to pneumonia in São Paulo between summer and autumn was because of pollutant emissions. They also linked seasonal climate changes from a single day to increased susceptibility. Kumar and Goel [
60] stated that the lack of rainfall and cold months were mainly related to the onset or worsening of asthma, COPD, and infectious diseases. Cold air can trigger an asthma attack in an individual, and during the winter months there is a clear temperature limit below which mortality increases significantly. The influence of climate and PM
2.5 on human mortality has also been proven in recent studies on 22 countries [
57,
61,
62], which corroborates the results of the present study.
4.6. Correlation of Factors with Costs and Hospitalizations for Respiratory Diseases
Table 6 presents the correlation of pollutant emissions with hospitalization cases. All gaseous pollutants showed a moderate to strong correlation with the hospitalization cases for most years of the study period. For 2012, 2013, 2015, 2016, and 2017, two or more parameters showed moderate or strong correlation with the number of hospitalizations. In 2013, all pollutants showed a strong correlation. This was a year with a water crisis and lack of rainfall, which increased the dry air mass and non-dispersion of pollutants in the atmosphere. Once pollutants became concentrated in the air, overexposure in places with heavy traffic aggravated hospitalization cases for respiratory diseases. The most susceptible patients were the elderly and children. The rainfall index indicated a very strong and inversely proportional correlation with the number of hospitalizations due to respiratory diseases, especially in the colder months of the year.
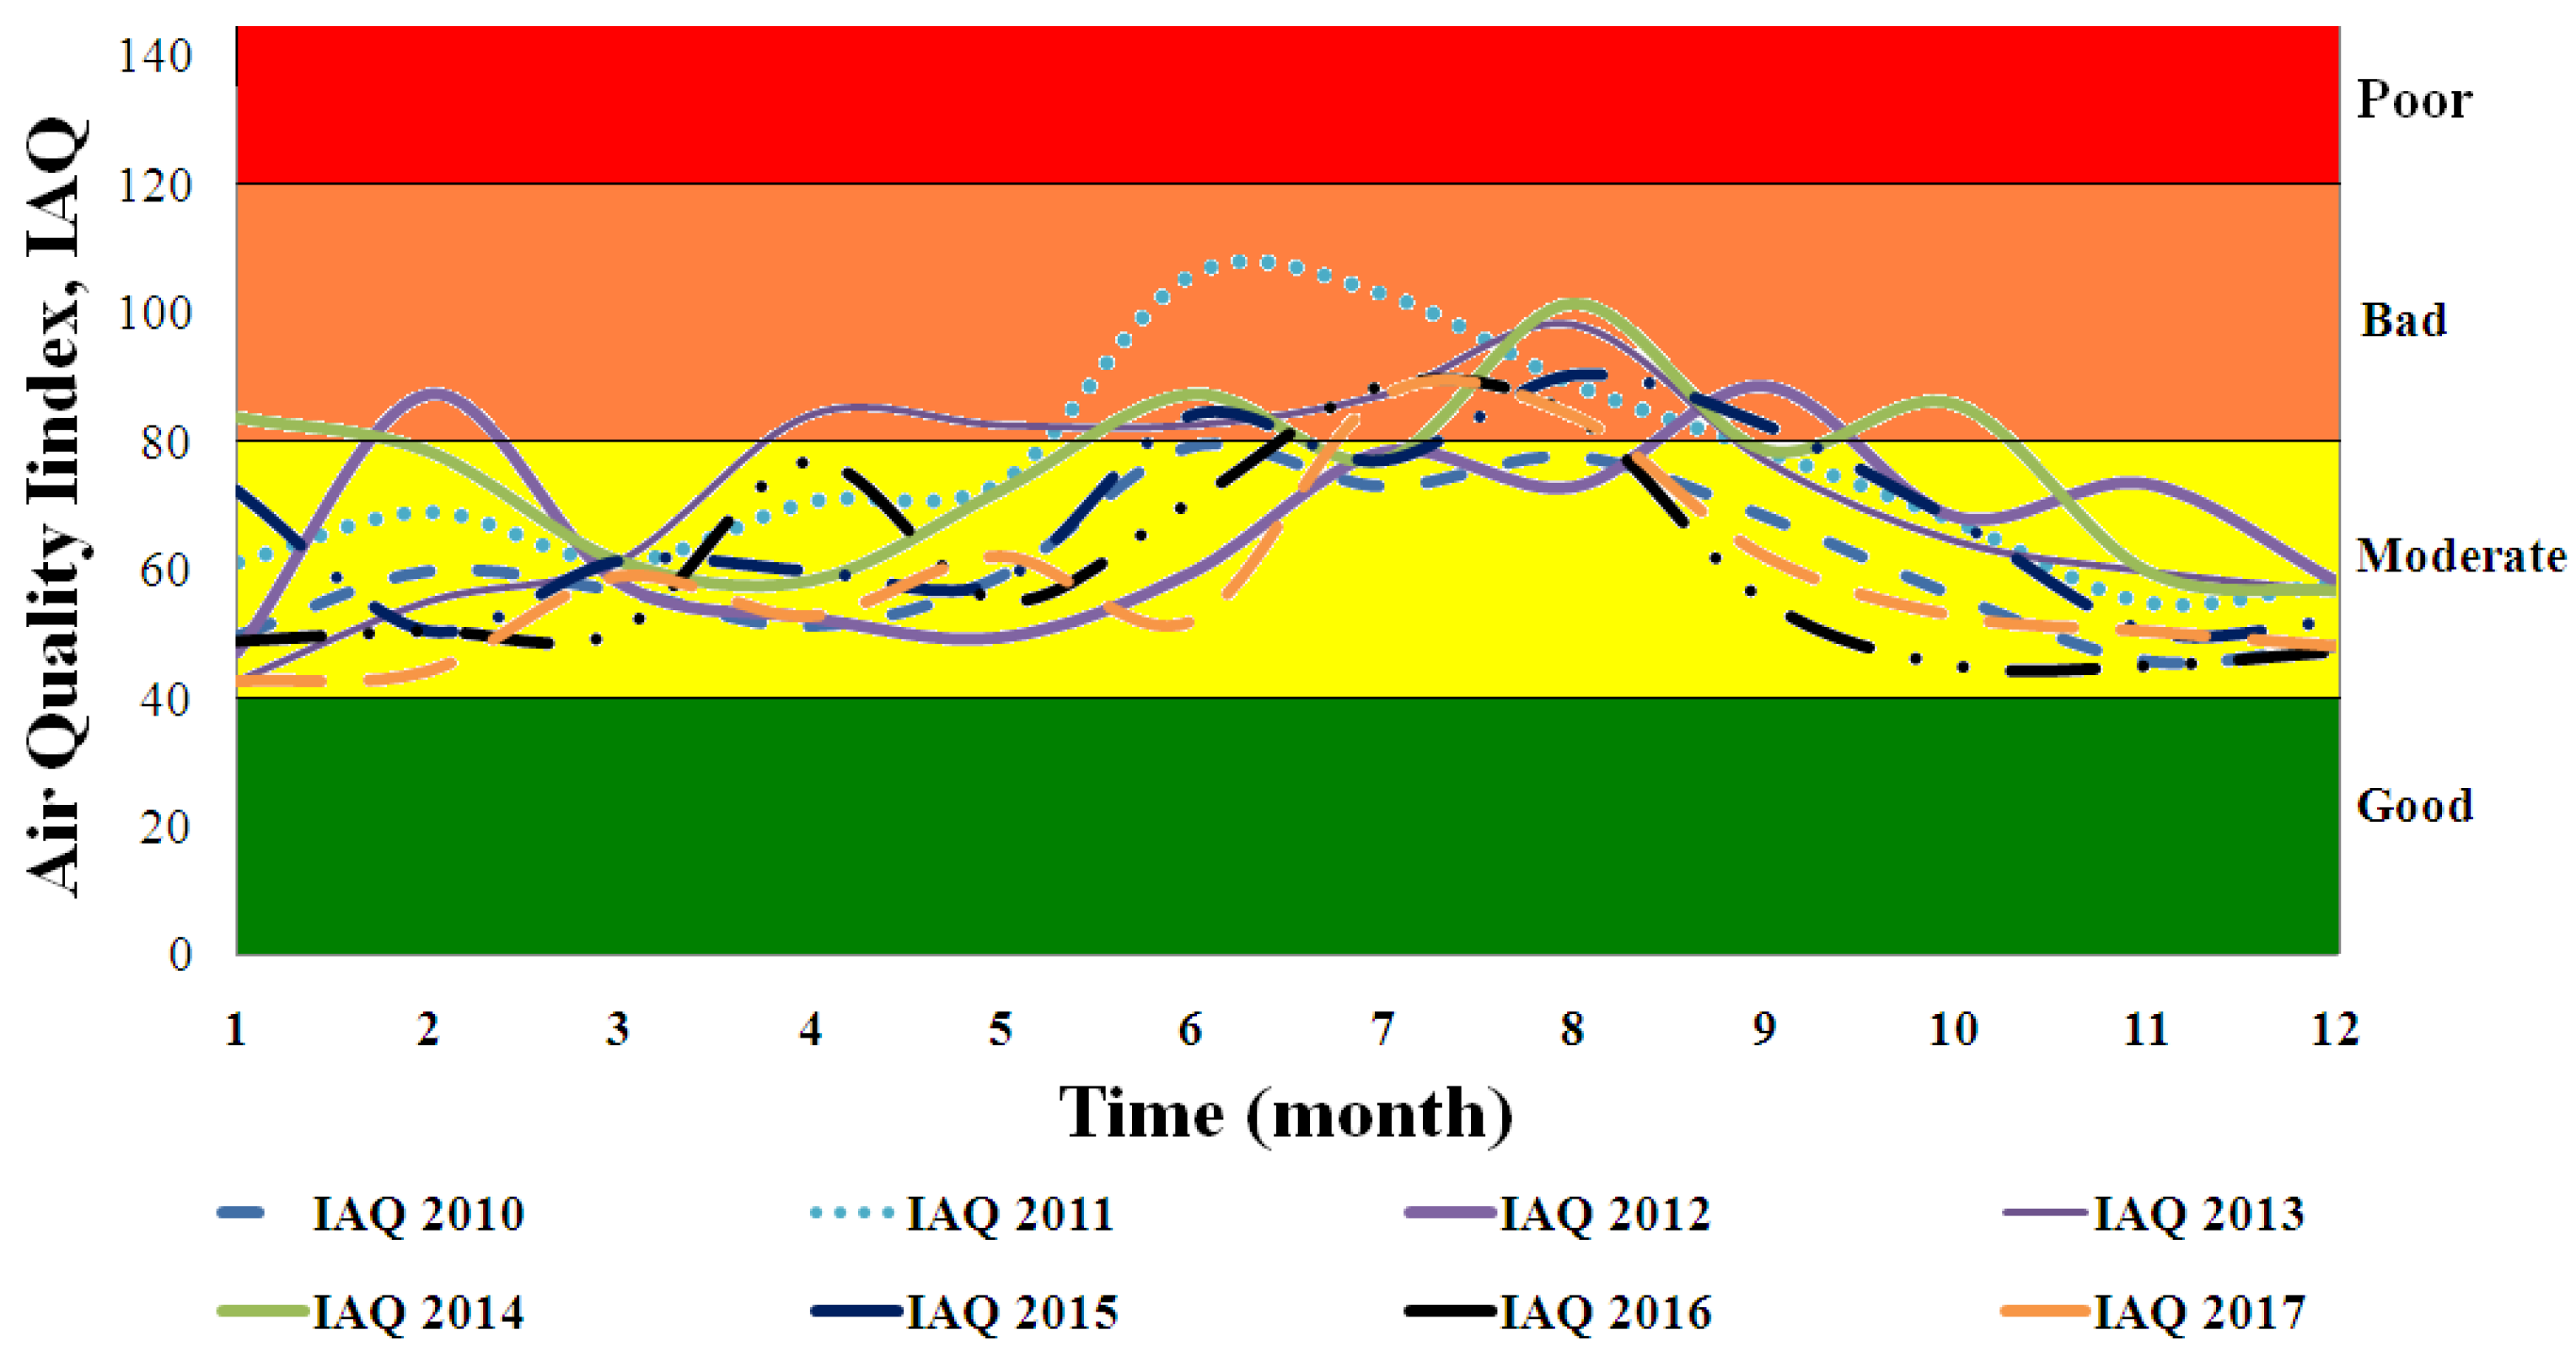
Compared with previous results, the parameters with the strongest influence on hospitalizations due to respiratory diseases were PM
10, PM
2.5, and O
3 because they were above WHO standards throughout the study period and made up the
IAQ values, which also had a medium to strong correlation in the worst years. Arbex et al. [
3] observed that these pollutants are the major causes of respiratory allergic diseases, including symptoms such as coughing, upper airway irritation, and COPD.
The correlations above present evidence but do not confirm a relationship between CO, NO
2, and SO
2 emissions and cases of hospitalizations for respiratory diseases. According to Yu et al. [
16], the influence of any pollutant cannot be ruled out because the total human health risk for exposure to several pollutants is the sum of the risks associated with each air pollutant.
Figure 4 indicates that the costs, emissions, and hospitalizations show parabolic behavior over time. Rainfall shows the same but inversely. Thus, rainfall likely influences the reduction in hospitalizations in rainy periods. Thus, the use of the partial item correlation presented in
Table 7 within the period of lower rainfall should improve the adjustment and prove the validity of the assumptions in this study. For this purpose, data from the beginning of the rainless period (May) to the end of the year (December) were used in the analysis, as during this period there was an increase in hospitalizations. And so, the influence of polluting gases and the air quality index on costs and hospitalizations for respiratory diseases was confirmed since the absolute majority of the correlations were between moderate and strong.
The only parameter that showed a moderate to strong correlation was the rainfall index. However, because the correlation was negative, this indicates that a higher rainfall index meant fewer people were hospitalized for respiratory diseases. Because this parameter had an inverse influence on the number of hospitalized people, the partial item correlation was proposed. The less rainy period was chosen to test the hypothesis, and the correlation from May to December was considered. Thus, the influence of each pollutant in the air of São Paulo on hospitalizations for respiratory diseases could be determined. Machin and Nascimento [
4] also observed that there is a greater correlation between pollutant gas emissions and hospitalizations for respiratory diseases from June to December, in the Midwest Region of Brazil.
Early in the study period, no correlation was observed between costs and gas emissions in São Paulo (only MP
10). However, from 2013 the correlation increased for most parameters and was strong almost every year for PM
10. Thus, the emissions also showed a clear correlation with the increase in hospitalization costs for respiratory diseases in São Paulo. Gao et al. [
7] realized that GHG mitigation strategies can bring about substantial and possibly cost-effective public health co-benefits. These are highly relevant to policymakers and other stakeholders because they demonstrate the compounding value of taking concerted action against climate change and air pollution.
All pollutants showed a moderate to strong correlation in several consecutive years, which indicates that they are potentially direct causes or influences on the development of respiratory diseases and the increasing number of hospitalizations. In 2010, 2011, and 2015, O
3 showed a moderate to strong correlation with high values at the beginning and end of the years, as shown in
Figure 3. However, these values were influenced by rainfall, so correlating O
3 with hospitalizations was difficult. Thus, this research could not confirm that this parameter influenced hospitalizations due to respiratory diseases. Thus, PM was concluded to be the dominant factor influencing the costs and number of hospitalizations for respiratory diseases.
Yanagi et al. [
63] found that cancer incidence in the skin, lungs, thyroid, larynx, and bladder presented correlation coefficients of 0.60–0.80 with exposure to PM
10 for some months of the year. In a similar study for São Paulo, Gouveia et al. [
25] associated inhalable PM with increases of 4.6% in hospitalizations for asthma in children and 4.3% in chronic obstructive pulmonary disease in the elderly. Nascimento and Francisco [
34] found that an increase of 10 µg/m
3 of PM increased the risk of hospitalizations by 13% in the municipality of São José dos Campos. Similarly, Cesar et al. [
64] showed that an increase in PM
2.5 emissions increased the number of hospitalizations for respiratory diseases in children from 7.9% to 8.6% in the less rainy months for the city of Piracicaba. In São José dos Campos, Amancio and Nascimento [
33] estimated the risk of hospitalization for asthma in children to increase by 19% after intense exposure to SO
2 for 3 h. The low rainfall ratios in some months of the year favorably contribute to the non-dispersion of gases and pollutants in the atmosphere. This increased the pollutant concentration, which exposed even more susceptible patients such as the elderly and children to risk.
Vormittag et al. [
65] pointed out that these problems can be solved by using biodiesel to improve air quality, which will have benefits in the area of health. In a life cycle analysis of biodiesel production from used frying oil, Chua et al. [
66] demonstrated that the emission of all gas components (SO
2, CO, NO
2, PM
2.5, and PM
10) was reduced by 90%. They noted that, in a similar survey conducted in the USA for biodiesel made from soybean oil (i.e., edible oil), the reduction in the emitted gas components was 80%. This demonstrates one more advantage of using frying oil instead of edible oil for biodiesel because the former contributes significantly more to reducing emissions and global warming [
67]. They showed that, compared to diesel, biodiesel obtained from waste oils provides a shorter ignition delay and reduced heat release rate as well as slightly higher efficiency. While a small amount of fuel is sacrificed, the hydrocarbon (HC), CO, and PM emissions are reduced. Miranda et al. [
2] also proved that pollutant emissions were reduced and that the power of the generator did not change when biodiesel was used in place of diesel oil. Thus, switching from diesel to the renewable and less polluting biodiesel does not influence engine ignition and is an environmentally sound approach to replacing fossil fuels.
Brazil has had cars running on alcohol for over 50 years. However, the adoption of biodiesel has been slow and gradual. Because of pressure from the oil sector, since it first became available in 2005 to the present, only 10% biodiesel is blended with diesel oil in automobiles with cyclodiesel engines in Brazil. Critics should be reminded that Rudolf Diesel himself, the inventor of cyclodiesel engines, attested to the successful use of peanut oil as a fuel at the 1900 Paris World Exposition. Thus, there is no justification for not fully exchanging diesel oil for biodiesel [
1,
2].
Brazil will continue to feel the ill effects of using diesel oil on human health, and its costs associated with hospitalization for respiratory diseases. As long as politicians and managers do not understand the link between fuel use and human health, money will continue to be spent on healthcare [
7,
68] when it should be invested in other sectors or improving public health infrastructure.
The adoption of policies for the increase of green infrastructures in cities is another option, for according to Abhijith et al. [
69] and Janhäll [
70], these areas are responsible for reducing air pollution in urban zones. They advocate the adoption of green infrastructures such as green walls and roofs on buildings, and tree planting and tall vegetation on streets and roads to improve air quality in cities.
This work shows that the cost on human health is significant due to emissions of gaseous pollutants. Brazil should implement stricter policies to improve the air quality of its major cities and develop a viable alternative to replace diesel vehicles. The substitution of fossil fuels for renewable sources is an alternative [
1,
2], and investment policies in green urban infrastructure should be adopted to minimize the effects of gaseous pollutants on human health in the city of São Paulo [
69,
70].

 ,
, 


