Article

Corporate Social Responsibility and Operating Performance: The Role of Local Character in Emerging Economies

1
School of Management, Harbin Institute of Technology, Harbin 150001, China
2
Business Division, The Institute of Textiles and Clothing, The Hong Kong Polytechnic University, Hunghom, Kowloon, Hong Kong
3
School of Public Administration and Law, Northeast Agricultural University, Harbin 150030, China
*
Author to whom correspondence should be addressed.
Sustainability 2020, 12(12), 4874; https://doi.org/10.3390/su12124874
Submission received: 17 May 2020 / Revised: 27 May 2020 / Accepted: 2 June 2020 / Published: 15 June 2020

Abstract

:
Local character can shape corporate resource accumulation and utilization, especially in emerging economies, and accordingly plays an important role in affecting the performance results of corporate social responsibility (CSR) practices. This paper thus aims to examine how local character affects the performance results of CSR practices. Drawing on the resource dependence theory and resource orchestration view, this study empirically investigates the effects of internal character (in terms of state ownership) and external local character (in terms of eight-dimension infrastructure) on the relationship between CSR and operating performance. Using samples of firms listed in the Chinese CSI 300 (capitalization weighted stock market index) in the years 2012 and 2016 and applying hierarchical multiple regression analysis, this study empirically verifies that CSR has a positive effect on corporate operating performance, and state ownership and infrastructure positively moderate the performance results of CSR efforts. Additionally, the results show that three dimensions (environmental, social, and governance) of CSR practices impact performance differently. Overall, this study unveils the crucial role of the local character on CSR to achieve performance and carries important theoretical and practical implications. Future research should include long panel data to increase statistical power as well as explore the linkage and synergy effect of CSR and governmental social responsibility (GSR).

1. Introduction

A large amount of investment and attention to corporate social responsibility (CSR) has resulted in ongoing debates and inconclusive research findings on whether CSR practices actually benefits the competitiveness of organizations [1,2]. Moreover, CSR comprising environmental, social and corporate governance activities also has a different impact on corporate performance [3,4]. Previous studies have frequently explored the firm-, industry-, and country-specific factors to explain the distinguished performance effects of CSR [5], but still paid little attention to the role of the local character, which may dominate the success or failure of CSR practices [6], particularly in the emerging economies. The local character (e.g., fund, land, and technical infrastructure) usually plays a critical role in shaping corporate resource availability, resource dependence, and competitive positioning [7].
In transition economies with authoritarian regimes, ties to governments can help firms access key regulatory resources, such as insights into new policy and industrial developments [8]. A prevalent formal organizational tie between a focal firm and political institutions is state ownership [9], which refers to the sum of the stakes of a firm that is owned by the government [10]. The ownership arrangement (i.e., state-owned vs. private-owned) is influential to businesses in emerging economies [11] and substantially related to external resource dependence, affecting corporate practices and performance.
Governments supply resources in the form of infrastructures to facilitate efficient and effective economic and socially responsible activities on the part of firms. The infrastructures, which reflect the local character, consist of physical structures (e.g., transportation, electrical, and telecommunications structures or pipelines, etc.) and institutional arrangements (e.g., tax and regulatory regimes, law and order, financial market, business associations, etc.) that support business operations and functions [12]. Infrastructures can be public or of shared access [12], acting as a reference and framework for market interactions and transactions [13]. In emerging economies, the lack of developed physical structures, adequate regulatory discipline, and efficient administration are often criticized as inhibitors of the day-to-day practices of firms [13], thus influencing economic performance [14].
Accordingly, several studies have attempted to explore the differences in aspects such as state ownership (e.g., [15]), subsidies [16], infrastructure development process [17], and investor protection level, which affect the performance outcomes of CSR practices. However, the empirical evidence on the government-related factors is scattered and fragmented, lacking a systematic and fine-grained framework to explain the influence of the local character on the relationship between CSR and performance. Such a gap cannot reflect the true state of the local character, causing mismatching between the academic observation and the practical situation in this area. Thus, this study integrates the resource dependence [18] and resource orchestration [19] perspectives to study the role of the internal character (in terms of ownership) and the external local character (in terms of the eight-dimension infrastructure) on the CSR-performance relationship. Much of resource dependence theory (RDT) focuses on the upside of resource acquisition. Beyond the logic of RDT, the resource orchestration view (ROV) suggests, in turn, that if firms desire a superior performance, their unique resources should be effectively utilized through synchronization, mobilization, and coordination [19]. According to the RDT, state ownership results in heavy resource dependence on the part of governments, endowing state-owned enterprises (SOEs) continuing privileges but sacrificing efficiency in resource utilization. So, SOEs may get benefits by using CSR practices to enhance operational efficiency. Yet private-owned enterprises (POEs) are also likely to enjoy performance enhancement by using CSR to increase external resource accumulation. Grounded in the ROV, infrastructure can support CSR practices through resource utilization. Firms that are able to leverage on developed infrastructures are likely to perform better due to their CSR practices.
China offers an appropriate setting to test these arguments. First, the dominant role of the Chinese government in resource control and infrastructure development is likely to influence corporate operating performance [20]. Second, the imbalance and inefficiency of infrastructure offering and utilization are commonly found in the business environment of China [21]. Using a sample of Chinese CSI 300 firms in the years 2012 and 2016, this study finds that CSR positively affects operating performance, and this effect is stronger when firms are SOEs and in a business environment with a well-developed local character (infrastructure). Moreover, the study further shows that the three dimensions (environmental, social, and corporate governance) of CSR activities impact performance differently.
This study contributes to the existing literature in two ways. First, it adds to the literature on the contingencies of the CSR-performance relationship by focusing on the role of the local character. Despite the popularization of the stakeholder perspective in CSR research, the attention to the roles of government is limited. This study unveils the role of the local character in terms of infrastructure to generate insights into the CSR-performance relationship in emerging countries. Second, this study integrates the RDT and ROV to provide a systematic framework for facilitating CSR success. By considering the mechanisms of resource accumulation and resource utilization, this study shows the derivation of a positive relationship between CSR and operating performance and how the positive relationship can be strengthened by state ownership and local character. Overall, the results shed light on the role and impact of the local character on corporate social activities and enlighten future research on the linkage and synergy effect of CSR and governmental social responsibility (GSR).
The remaining parts of this paper are organized as follows. Section 2 describes the theoretical background and hypotheses of this study. Section 3 provides methods. Section 4 shows the results. Section 5 presents the discussion and conclusions, including the implications, limitations, and a brief further research agenda.

2. Research Background and Hypothesis Development

2.1. CSR Practices

CSR refers to the commitment and efforts of firms to prevent and reduce the negative externalities of their operations and/or social and environmental issues beyond their legal requirements [3]. The concept of CSR is rooted in a framework provided by Carroll [22] called the Pyramid of CSR. The CSR pyramid names four common organizational responsibilities, namely economic, legal, ethical, and philanthropic responsibilities, that reflect the accountability of firms in addressing the adverse impacts incurred in their business operations. Particularly, in recent years, China has issued a number of CSR guidelines to urge firms to address social and environmental problems [23]. Many firms thus engage in CSR activities in compliance to governmental guidelines.
According to the RDT, firms tend to depend on external organizations that provide valuable resources for long-term survival and growth [18,24]. The government is a typical example of such an external organization. CSR plays an important role in developing a good relationship with the government and achieving resource accumulation, which contributes to financial success. Consequently, firms with a higher dependence on government would be inclined to engage in CSR practices. Moreover, CSR practices, as a kind of compliment to the government and response to government signals, help firms attain political legitimacy, which may further help them mitigate the excess of government supervisions and interferences, and accordingly contribute to increasing operational inefficiency, which may bring more operating income.
On the other hand, the ROV suggests that for firms to achieve a desirable performance and outperform their competitors, their unique resources, including those that are internal and external, must be effectively leveraged through synchronization, mobilization, and coordination [19,25]. In emerging countries, governments take the lead in infrastructure development [8,26], as infrastructures form the skeleton for market functions and economic growth, thus enabling (or constraining) the operations of firms. Firms are encouraged to optimize their resource utilization, including the utilization of infrastructure, to obtain optimal operational returns from CSR practices.

2.2. CSR and Operating Performance

CSR is also commonly associated with two distinct performance-enhancing effects, which predominantly stem from resource accumulation and resource utilization [27,28,29]. Resource accumulation refers to an increasing pool of resources; in particular, valuable and hard-to-reproduce external resources, which can improve the competitive position of firms. Many emerging countries have given longstanding support to promoting CSR to address the issues of social and environmental welfare [30]. With a high level of government control in resource allocation in emerging countries, firms that are committed to implementing CSR and put in efforts to do so are likely to obtain more government supports [31,32]. Previous studies have also shown that the implementation of CSR helps firms to gain access to financial and investment resources [2,33], market acceptance of their products and services [34], and support from other stakeholders [35].
On the other hand, CSR can contribute to operating performance by improving resource utilization processes. When firms implement CSR practices, e.g., environmental management, they reinforce the efficiency of physical resource use to increase productivity and reduce waste [36]. CSR focusing on governance activities such as stakeholders’ communication or board governance cumulatively gathers stakeholders’ support and improves management abilities that, in turn, may become the foundation for effective resource deployment. Additionally, firms that are engaged in CSR practices are more apt to improve investment efficiency through reduced information asymmetry and increased stakeholder solidarity [37]. Investment efficiency is important because investors often perceive that socially and environmentally responsible firms use resources more efficiently [38] and are thus more likely to invest in firms that are committed to CSR. Therefore:
Hypothesis 1 (H1).
CSR is positively related to operating performance.

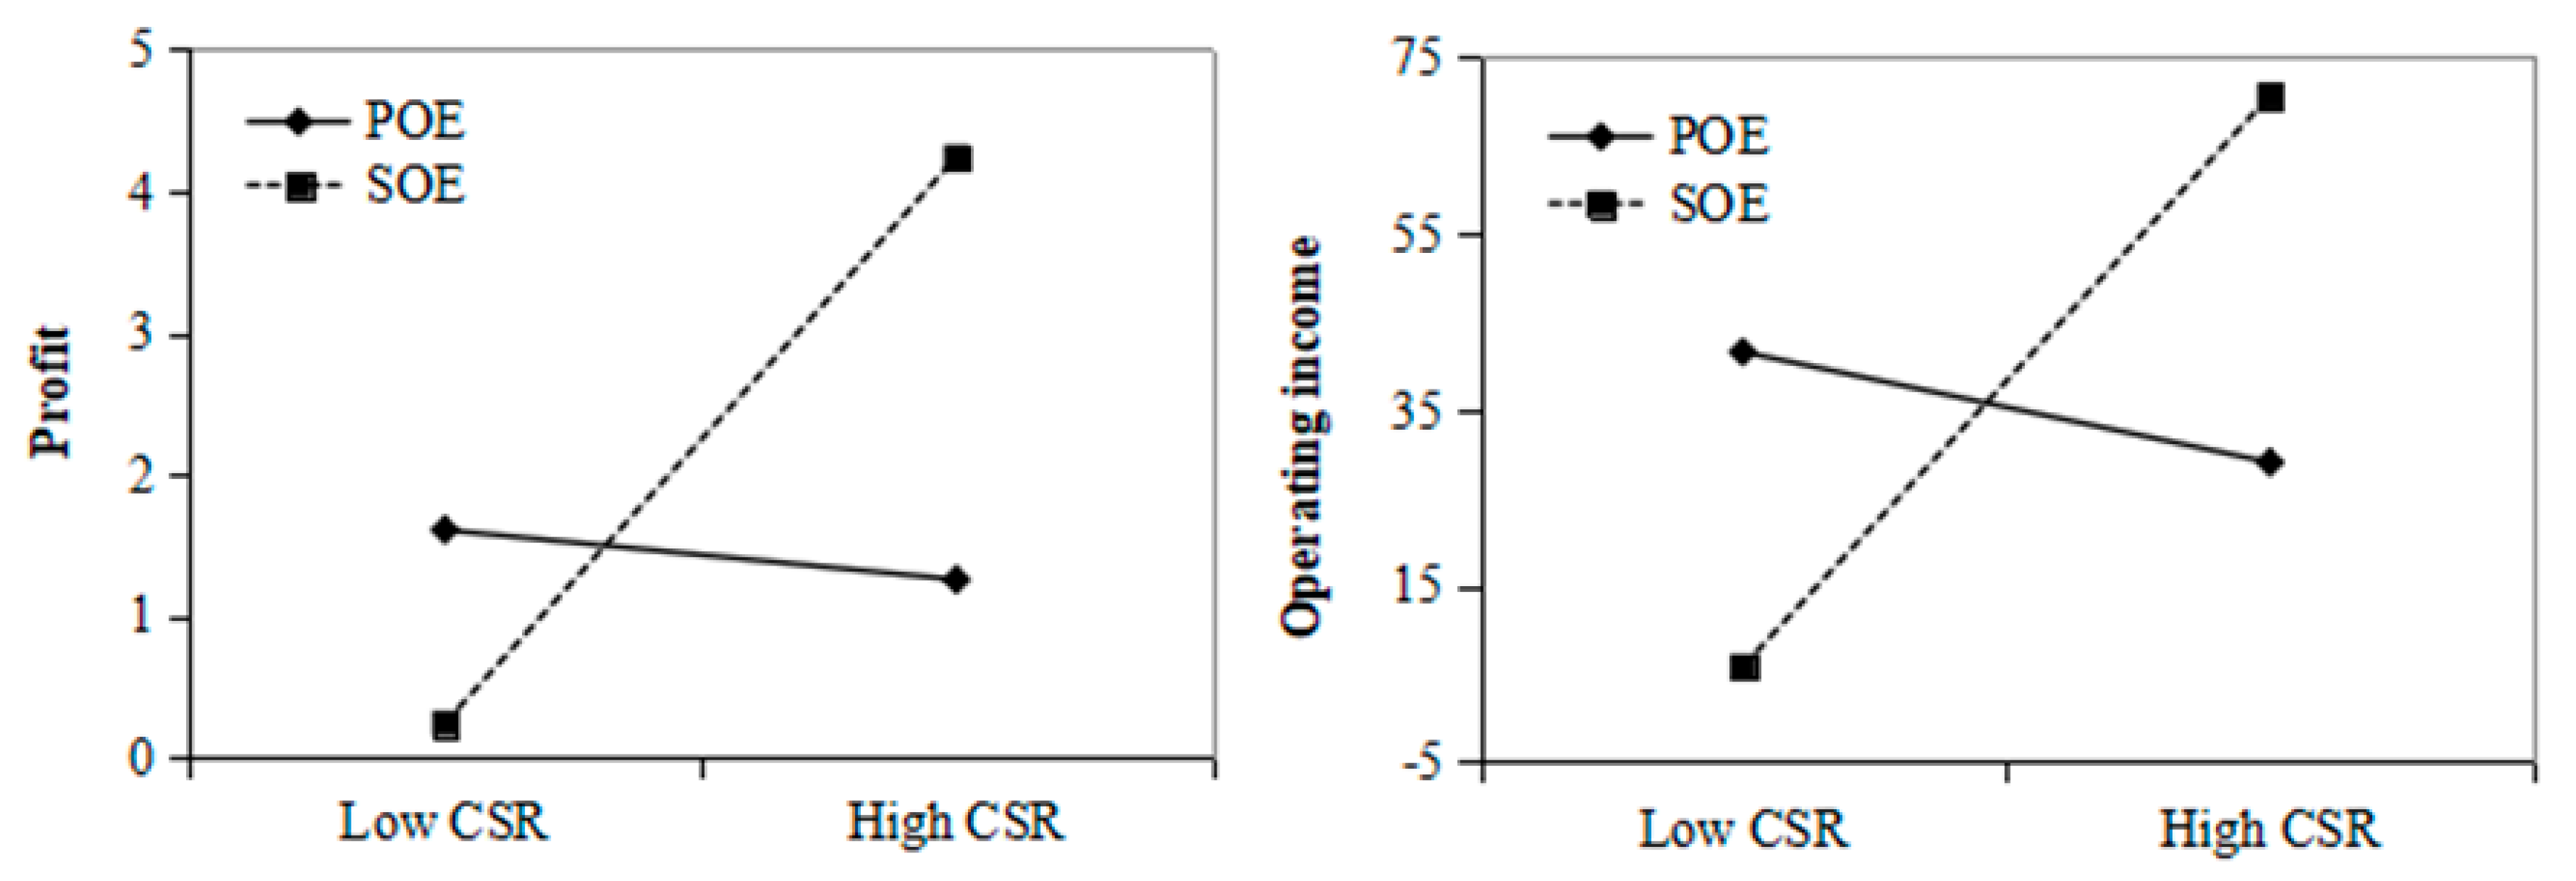
2.3. State Ownership and CSR: Resource Dependence Logic

Firms can be either state-owned or private-owned [15]. SOEs are inherently tied to the government, and managed and operated wholly by the government or partially controlled by them [10]. SOEs remain crucial contributors to the economic and social development of major emerging countries, such as China. The government often allocates preferential resources to SOEs to support the fulfillment of their administrative and political duties [8]. With such resources, such as the latest policy development information, funding, technical assistance, and others, SOEs do not have to worry about political access. In such situations, the additional benefits that CSR brings to SOEs are limited. On the contrary, due to the loose ties with government, POEs often experience discriminatory restrictions in market entry, information asymmetry, and limited access to scarce resources that are not publicly available [39]. Thus, POEs have a greater need to gain access to political resources through CSR practices and are likely to enjoy greater performance benefits from their CSR.
On the other hand, SOEs and POEs also differ in the ability to self-manage and exploit resources [10]. From the ROV, this ownership arrangement implies that SOEs have less managerial discretion with restrictions in resource utilization due to inherent ties with the government. They often lack appropriate capabilities or skills in managing their privileged resources and fail to run companies more efficiently than POEs. In addition, the managers of SOEs may pursue their own interests, e.g., political promotion, which inevitably distorts SOEs’ regular operations, thus hindering the firms’ resource utilization. Since CSR may facilitate daily operations and reduce the inefficiency associated with excessive government dependence, SOEs are likely to benefit more from CSR practices than POEs. Taken together, this study proposes:
Hypothesis 2 (H2).
State ownership moderates the operating performance effects of CSR.

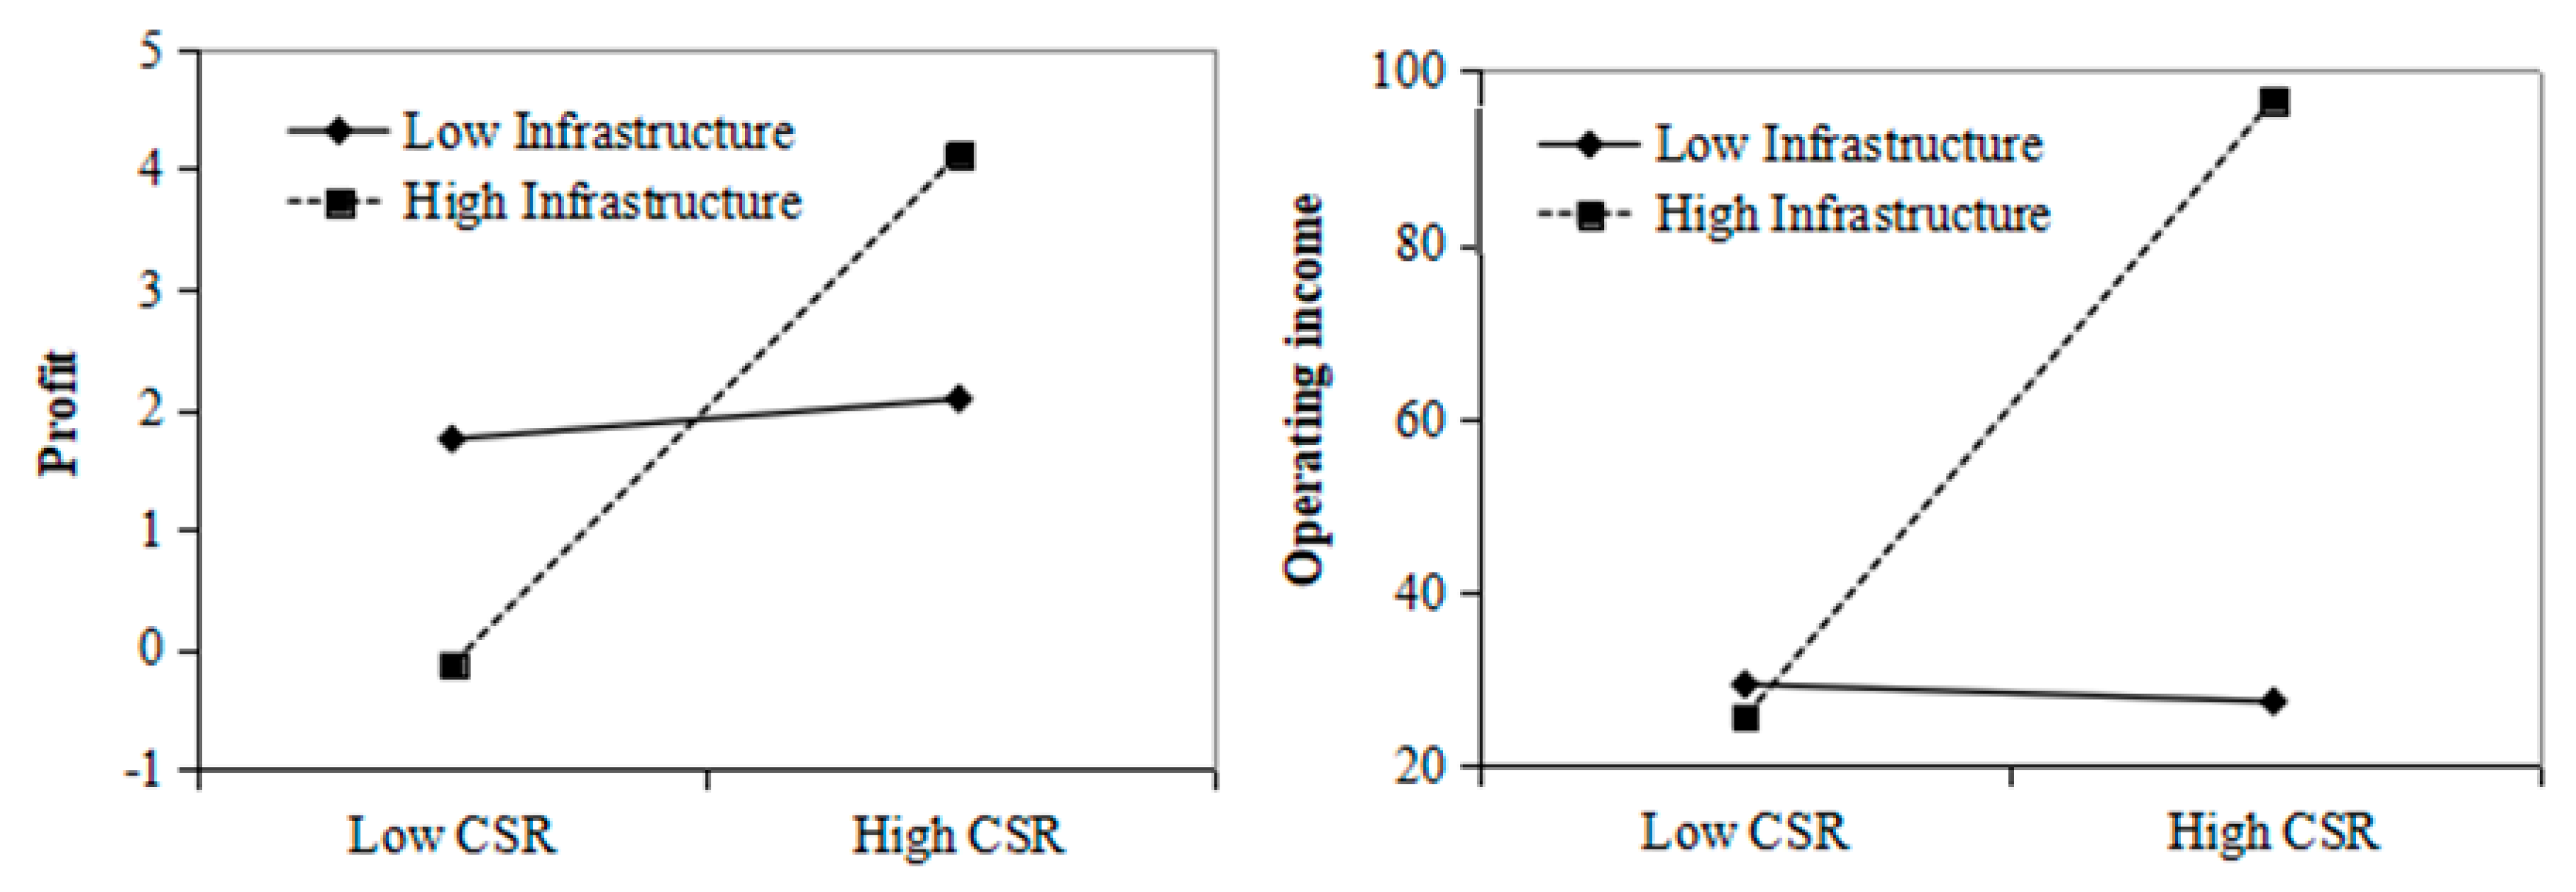
2.4. Infrastructure and CSR: Resource Orchestration Logic

Infrastructures comprise the fundamental facilities and systems that facilitate the functioning of an economy [40]. It is assumed that governments will build adequate physical infrastructures as well as intangible and institutional infrastructures [12], while managing them prudently and efficiently to create an effective business environment for economic growth. However, the infrastructures are often criticized for their lack of efficiency, fairness, and impartiality [8,41], especially in emerging economics where there is often an unfair distribution of scarce resources [8,21]. For example, bureaucratic delays (red tape), inadequate protection of legitimate rights, arbitrary taxes and levies, and incomplete control over corruption, along with the uneven development of physical infrastructures, are ubiquitous in China [21,42]. Infrastructures also exhibit development differences across different regions [43].
According to the Business Environment Index for China’s Provinces 2017, the local character in terms of infrastructure has eight dimensions: (S1) policy openness, justice, and fairness, (S2) involvement, integrity, and efficiency, (S3) legal environment, (S4) tax burden, (S5) financial infrastructure, (S6) human resources, (S7) transportation systems and utilities, and (S8) market environment and intermediary services. In addition to intangible and physical infrastructures (i.e., (S6) human resources and (S7) transportation systems and utilities), the other six dimensions synthesize to form the institutional infrastructure. In accordance with the ROV [19,25], firms that are able to orchestrate and leverage these infrastructures to implement CSR are likely to improve performance. This study discusses the various dimensions of infrastructure to explain their roles in influencing the performance outcomes of CSR implementation.
Policy Openness, Justice, and Fairness. Policy changes and their spillover effects in emerging countries often bring about an unstable and uncertain business environment that adversely affects the ability of firms to plan and make decisions [44]. Opaque government policies only serve to aggravate the misgivings of firms in foreseeing the outcomes of their CSR efforts [45]. On the contrary, when the government offers transparent and fair policies with clear rules and guidelines, firms need not face unnecessary uncertainty and can conduct business in a more orderly and efficient manner [13]. This sort of infrastructure also contributes to the managerial acumen needed for making decisions on CSR [8]. Therefore, clear and fair policies reduce uncertainty and enable firms to optimize their own resource allocation towards a desirable performance of their CSR investment. Thus, based on the ROV, using fair and open policies to form infrastructures that support business operations helps firms in acquiring, orchestrating and leveraging resources for an optimal performance of their CSR efforts [25,46].
Involvement, Integrity, and Efficiency. Studies have argued that excessive government involvement in business activities can lead to rent-seeking [47] and a substantially inefficient use of resources [48]. Rent-seeking is particularly common in transition economies where government corruption is rife [49]. As a result, the transaction costs and operation inefficiency of firms are likely to be exacerbated, which may affect the effectiveness of resource allocation for activities that generate added value [49]. Inefficient government administrations (e.g., red tape) are a form of distraction that not only increases transaction costs but also pulls firms away from focusing on resource accumulation and utilization. Building on resource utilization processes, the positive performance effects of CSR can be increasingly overshadowed. Conversely, an efficient, legally responsible, and ethical government can help firms to achieve operation efficiency and higher levels of discipline in resource allocation, and then translate CSR practices into a higher operating performance.
Legal Environment. An impartial legal environment for business operations protects intellectual property, technology, brand credentials, and contract enforcement. This sort of environment provides a business-friendly infrastructure with equal opportunities and rewards. It facilitates trade activities and collaboration across firms. Firms are also likely to achieve desirable results from their CSR efforts based on a just legal environment which reduces the uncertainty caused by opportunistic behaviors of their trading partners (e.g., contract violations) and unlawful behaviors of their competitors (e.g., counterfeit and piracy). Conversely, if there is lack of well-established property rights or intellectual property protection regulations, operating risks will be higher and undermine the competitiveness of firms [13], as privacy and patent infringements can “siphon away revenue and damage brand image” [50]. Thus, in the absence of a law-based business environment, the economic resources for firms to conduct CSR are not well protected, which introduces uncertainty as to whether their CSR efforts will pose as obstacles to firm performance [51].
Tax burden. A business environment with high tax rates increases organizational financial distress, discourages business establishment and business operation expansion [52], and decreases the amount of investment in non-economic activities, e.g., CSR practices [53,54]. For instance, anecdotes about the high corporate tax burden in emerging economies such as China, Russia, and the Ukraine, abound in the media and in reports [21,55]. Due to the high taxation, firms may face capital constraints which discourage them from proactively undertaking CSR activities, such as employee welfare and training programs, product quality control, and contributing to the community. Accordingly, their labor productivity, reputation, and market competitiveness might be negatively affected, which leads to lower financial returns. On the contrary, tax breaks can provide relief to firms, so that they can introduce innovative CSR activities, which might enable them to undertake environmental product innovations, employee training, and safe production [56]. In this case, corporate resource utilization efficiency is improved to bring about superior performance [52].
Financial Infrastructure. Well-functioning financial markets allow firms to effectively fund their CSR initiatives and share risks [57]. An efficient financial infrastructure facilitates corporate investments by providing necessary capital support. Such a financial infrastructure enables firms to undertake CSR practices and invest efficiently to improve performance. Increasing access to additional financial resources helps to mobilize, coordinate, and deploy resources that exploit market opportunities and allow firms to create value from their CSR practices.
Human Resources. The labor market conditions, particularly the degree of shortage of available skilled workers, are crucial to firms for development and growth [58,59]. The current as well as potential human resources are an important consideration for firms in the development and execution of business plans [60]. Generally, a good human resources infrastructure allows firms to develop human capital to support business operations in a cost-effective and time-efficient manner. More importantly, through a careful selection and utilization of suitable personnel, firms tend to produce innovative ideas, manage their resources effectively, and compete in the marketplace [61]. Firms which are famous for CSR are more likely to attract talents, who are more likely to take innovative approaches to improve resource exploitation as part of corporate strategic practices [46], including those of CSR activities. CSR activities can thus be developed in creative ways and implemented effectively to achieve unprecedented performance [62].
Transportation Systems and Utilities. Transportation and utility reduce operating costs and improve the coordination efficiency of economic resources, thereby generating synergistic effects [57]. A developed utility infrastructure ensures that firms have the capability to process and utilize content-rich information or knowledge in CSR, potentially leading to practices that could improve both social and operating performances. For example, high information technology competency can facilitate information integration and communication, thereby improving the efficiency of operational coordination and the responsiveness to market changes [63]. By contrast, undeveloped utility structures may result in an inefficient use of the resources invested in CSR activities, causing firms to face a negative return from their CSR efforts.
Market Environment and Intermediary Services. Intermediary services offered at a low cost by achieving an economy of scale can help firms to invest in the further development of their core capabilities [64]. Intermediary services, such as offering repositories for the storage, exchange, and circulation of goods, help to alleviate the operating costs in aspects such as land and warehouse [65]. Specialized intermediaries provide the requisite information or contract enforcement needed to consummate transactions that could facilitate the achievement of the firms’ goals, e.g., the adoption of new CSR practices with more specialized guidance. Firms can benefit from different forms of assistance, support, and guidance with specialized knowledge [66]. Industry associations also provide intermediary services, such as providing specialized knowledge on CSR policies that enhance their efficacy. Firms that can fully utilize the available infrastructures in their business environment are likely to gain efficiency, reduce costs, and improve the quality of their CSR practices. They will thereby become less prone to inefficiency or lack of discipline in resource allocation, thus strengthening their operating performance. Accordingly:
Hypothesis 3 (H3).
Local character in terms of infrastructures that consider (S1) policy openness, justice, and fairness, (S2) involvement, integrity, and efficiency, (S3) legal environment, (S4) tax burden, (S5) financial infrastructure, (S6) human resources, (S7) transportation systems and utilities, and (S8) market environment and intermediary services positively moderate the operating performance effects of CSR.

3. Method

3.1. Data Sources and Sample

The secondary data was collected from the Report on Corporate Social Responsibility of China (also known as the Blue Book of Corporate Social Responsibility), Business Environment Index for China’s Provinces, China Stock Market and Accounting Research (CSMAR) database, and corporate annual reports of the sample firms.
The CSR practices data were collected from the Report on Corporate Social Responsibility of China released by the Research Center for CSR under the umbrella of the Chinese Academy of Social Sciences (CASS). The research center is a nonprofit academic research institution, which endeavors to be a first-class, world-renowned institution in China. Since 2008, the CASS has published a series of Blue Books (i.e., Report on Corporate Social Responsibility of China) to promote the development of CSR practices. However, the reports evaluate the CSR practices of publicly listed firms only in 2012 and 2016. Therefore, this study only employs the CSR index in these two years. Moreover, considering the lag between CSR and their impact on operating performance, operating performance data in the following year (a one-year lag) are also collected and analyzed. Therefore, the CSR data used correspond to the years 2012 and 2016, and the performance data used correspond to the years 2012, 2013, 2016, and 2017. The reports offer scores for environmental, social, and governance factors for CSI 300 firms, which are representative firms listed on the Shanghai and Shenzhen Stock Exchanges. The CSI 300 firms have a halo effect and often take a leading role in implementing governmental practices, including governmental guidance on CSR development. In this study, the CSI firms from the year 2016 on the CSR of China are labeled as sample 1 and CSI firms from the year 2012 are labeled as sample 2.
Previous research on CSR in China has generally adopted the Rankings CSR Ratings (RKS) and content analysis for assessing CSR. The data from the RKS are related to the overall CSR score without detailed sub-dimensions, and content analysis suffers the problem of data inaccuracy and opacity. Thus, following previous studies (e.g., [67]), this study collected secondary data from authoritative reports.
The environmental, social, and governance data released are data on (1) environmental factors, including the amount of energy used, water and waste recycled, and carbon emitted, as well as spills and pollution controversies; (2) social factors, including employee turnover, injury rates, health and safety, product quality, philanthropy, and power alleviation controversies; and (3) corporate governance factors, including shareholder interests, board of directors, and information transparency.
The Business Environment Index for China’s Provinces provides data on the different aspects of infrastructure development in each province/municipality. However, the index does not have information for Tibet and Qinghai due to the extremely low responses to the study. Accordingly, companies registered in Tibet and Qinghai are eliminated in this study. The CSMAR, a database with data on the Chinese stock market and economy, offers information on corporate ownership and dates of the initial establishment of the sample firms. The data, such as profit, operating income, and number of employees, were also collected from CSMAR.
Among the CSI 300 firms from the 2017 Report on CSR, 60 firms are simultaneously listed on overseas stock markets and were therefore dropped to minimize the potential influence of overseas regulations [68]. The 240 remaining firms were then categorized into 15 industries (distribution shown in the second column of Table 1) based on the 2012 China Securities Regulatory Commission industrial classification system. The firms were screened based on the two following criteria: (1) removal of firms in Qinghai and Tibet due to the absence of their data in the Business Environment Index for China’s Provinces, and (2) removal of financial firms such as those in the bank and insurance industries due to the particularities of their business operations and financial structures [69]. As a result, a manufacturer who is in Qinghai was removed from the sample, and 33 financial firms were eliminated. A total of 206 eligible firms distributed across 26 provinces of mainland China constituted the final sample 1. According to the statistical results of the China Securities Regulatory Commission, there was a total of 3168 listed companies in mainland China in 2016. Table 1 (sample 1) summarizes the population percentages of the 3168 Chinese listed companies based on industry and final sample distribution by industry, which is largely consistent with the population distribution percentages.
Likewise, there were 54 firms simultaneously listed overseas among the CSI 300 firms from the 2013 Report on CSR. Based on the same two criteria, the remaining 246 firms were screened and 219 eligible firms distributed across 28 provinces/municipalities of mainland China were included in the final sample 2. The sample’s distributions by industry are also shown in Table 1.

3.2. Measures

Corporate social responsibility. The Chinese CSR index was used to measure CSR activities. This index is assessed by the Research Center of CASS for CSR. The CSR activities are evaluated based on three factors: (i) environmental (e.g., emissions, energy saved, and pollution reduced), (ii) social (e.g., employee turnover, health and safety, product quality, and philanthropy), and (iii) corporate governance (e.g., shareholder interests, board of directors, and partners’ communication). These three factors have 13 sub-factors and 49 indicators in the 2017 Report on CSR (see Appendix A Table A1). The rating of each indicator ranges from 0 to 100. This evaluation system is mainly based on ISO26000, GRI 4.0 guidelines, Chinese CSR Report portable guide (CASS-CSR3.0), and CSR reporting metrics of Global 500 firms, etc. Due to the industry heterogeneity, each item and indicator have an industry-specific weight. The weights of the three factors are finally determined using an analytic hierarchy process. According to the examined information of the CSR and annual reports, announcements, and official websites, the initial CSR scores are calculated as:
w i × β k ( α i × a i )
where: wj is the weight of the three factors, j = 1, 2, 3; βk is the weight of the 13 sub-factors, k = 1, 2, …, 13; αi is the weight of the 49 indicators; ai is the score of each indicator; and i = 1, 2,…, 49. Each CSR score is assessed by 3 to 5 experts, who have at least three years of CSR experience and no conflicts of interest with the focal firm. The initial CSR scores were further determined after readjustments were made based on negative CSR information. The final CSR index (from 0 to 100) indicates the comprehensiveness of CSR practices and level of disclosure about CSR information. As a result, this index can be considered as a good proxy.
Corporate operating performance. Two measures of operating performance were used: operating income and profit (i.e., net profits attributable to shareholders). Operating income is the total amount of revenue from business operations, without taking into consideration operating expenses (e.g., depreciation), taxation, or capital structure changes [70]. Profit is the amount of income attributable to shareholders after deducting operating expenses (e.g., cost of goods, sales, and general and administrative expenses) and enterprise income tax. These are absolute values that are not scaled by total assets, as well as appropriate measures of firm operating performance based on the theoretical rationale of this study, as the intention is not to make comparisons among companies, nor examine the performance impact of CSR in the capital market [17]. In addition, there is likely to be a lag between CSR and its impact on operating performance, so the relationship between CSR and operating performance is also evaluated in terms of operating income and profit for one year following the implementation of CSR (a one-year lag).
State ownership. State ownership is first measured as 1 if the firm is an SOE (i.e., a firm controlled by a state agency) and 0 otherwise (i.e., POEs) [15]. Second, state ownership was measured as the percentage of stakes owned by the government. Since the ownership structure does not change often, this measure is an objective indicator with longevity [10].
Infrastructure. The infrastructure is assessed as the extent to which a government affects firms by providing related services in an efficient and non-discriminatory manner [71]. Although there are no unified measures, the key elements include law and order, macroeconomic stability, physical infrastructures, taxes and regulations, etc. [71,72].
In China, the National Economic Research Institute of the China Reform Foundation has launched a major initiative to understand how companies evaluate the quality of government-supported infrastructures. Large random samples of firms have been surveyed to collect assessments of the constraints that firms are facing, which not only include soft institutional arrangements (e.g., laws and policies, regulations, administration, finance, and taxation), but also the physical infrastructures (e.g., transportation, electrical, and telecommunications structures) [57]. This nationwide survey of Chinese firms was launched in 2006 and used a five-point Likert scale. A collection of indicators have also been compiled to assess the business environment in 2006, 2008, 2010, 2012, and 2016. Firm-level responses were then aggregated as an average at the provincial level to generate the province index for each indicator. This study collected the business environment indices in 2012 and 2016 as the proxy of measure for infrastructure. The Business Environment Index for China’s Provinces comprises eight first-level indicators, as provided under H3. Their respective second-level indicators are listed in Appendix A Table A2. The Business Environment Index for China’s Provinces is based on 2122 responses to questionnaires collected nationwide. The eight sub-indices were constructed as the average score of the second-level indicators, which range from 0 (lowest level of development) to 5 (highest level of development).
Control Variables. To test the hypotheses, four control variables that might influence the operating performance of firms were applied. First, firm age was controlled by using the number of years since the establishment of a firm to the given fiscal year. Depending on their age, firms may have different cost structures. Older and more established firms may have more experience in resource orchestration and accumulation and organizational inertia, which are likely to affect firm performance [1]. Second, firm size, with a natural logarithm of the number of total employees to normalize the right-skewed distribution, was controlled [8]. Larger firms are more likely to be resourceful, have political connections [73], and enjoy economies of scale or scope [15]. Third, Debt ratio, measured as the ratio of total debt to total assets, has also been included in previous studies on social-financial performance relationships [74,75]. A firm’s debt ratio indicates the financial constraints its managers face, which in turn influence their discretion in engaging with CSR. Fourth, firms in different life-cycle stages have different levels of growth, availability of resources, investment opportunities, and risk [76], which is expected to affect operating performance. This study controlled for life-cycle dummies using the patterns of corporate net cash flows from operations, financing, and investing that are classified into three stages: growth, mature, and shakeout [76]. Fifth, to control for the possible differences in CSR activities among the industries [77], this study included industry dummies which take the value of 1 if the firm falls into the mining and quarrying, manufacturing, production and supply of electric power, gas and water, and construction (which belongs to the secondary sector) industries, and 0 otherwise. The secondary sector greatly contributes to pollutant emission or discharge [78], so they have to focus more on environmental responsibility than other industries. In addition, the location of the firms is a factor that might affect infrastructure/economic development. The development of infrastructures varies across China’s provinces as a result of uneven economic and institutional reforms [8]. Provinces with a low GDP are often underdeveloped in both physical and institutional infrastructures. Therefore, this study included region dummies to indicate the geographic region (province) in which the firms are located.

3.3. Estimation Methods

The hypotheses were mainly tested by using the following equation:
πt+1/t = β0 + β1CSRtz + β2mod eratorstz + β3CSRtz × mod eratorstz + β4Xz + εt
where πt + 1 and πt are the corporate operating performance at the end of year t + 1 and year t, respectively, and include profit and operating income; Xt is a set of control variables expected to influence the corporate operating income and profit; β0 to β4 are the parameters to be estimated; and εt is an error term. A hierarchical multiple regression analysis is used to test the hypotheses [15]. This study uses a z scoring approach to reduce problems associated with multilinearity among the continuous predicators and moderators in the regression equation [79]. In addition, to address potential multilinearity among the eight infrastructure factors, each multiplicative term was embedded in separate models accordingly [80,81].

4. Results

Table 2 reports the descriptive statistics and Pearson’s correlations for the variables used in the study for sample 1 (results of sample 2 available from the authors on request). A bivariate correlation above the threshold of 0.80, which raises concerns of multicollinearity [82,83], is found between (S3) legal environment and (S7) transportation systems and utilities. It could be that these government infrastructure elements reinforce one another [14,72]. Also, the correlation coefficient between (S3) legal environment and (S7) transportation systems and utilities is 0.83, which does not substantially exceed the threshold. Additionally, the correlations between different measures of operating performance are high enough, but neither pair of variables is included in the same regression model. The variance inflation factor (VIF) of the variables was further checked and did not show any multicollinearity. The VIF values obtained in all the models are below the threshold of 10.00 for regression models [84], thus suggesting that multicollinearity is not an issue in this study.
In Table 2, almost half (46.60%) of the firms in sample 1 are SOEs, and the average infrastructure value for the 206 firms is 3.67. The average values of the eight infrastructure indices indicate that the transportation and utilities level is the highest, and the level of market environment and intermediary services is the lowest. By contrast, nearly 68.04% of the firms in sample 2 are SOEs, and the average infrastructure value for the 219 firms is 3.08.
Table 3 presents results for H1, H2, and H3 for sample 1. Model A and model B denote using profit or operating income (in billions of CNY), respectively, to measure the one-year lag operating performance. Model A1 and model B1 report the baseline model with all the firm-level control variables and proposed moderators (herein, state ownership and infrastructure). As expected, firm size is positively and significantly associated with profit and operating income. Models A2 and B2 add predicators of CSR and show that the coefficient of CSR is positive and statistically significant for both measures of lagged operating performance, thus supporting H1.
Models A3–A4 and B3–B4 show the interactions between CSR and the two moderators, respectively, whereas Models A5 and B5 are the full specified models which include the interactions between CSR and the two moderators simultaneously. In H2, the moderating role of state ownership is considered. The interaction between state ownership and CSR is both positive and statistically significant for both profit (Models A3 and A5) and operating income (Models B3 and B5) in Table 3. However, the interaction is positive and significant in separate models but positive and not significant in full models for sample 2 (results available on request). Thus, H2 is partly supported.
H3 predicts that the eight dimensions of infrastructure positively moderate the relationship between CSR and operating performance. Then, this paper conducted separate regression analyses on the interaction between CSR and single infrastructure indices, i.e., the eight sub-factors. The results for sample 1 are shown in Table 4. Panel A corresponds to the dependent variable of profit in 2017, and Panel B to the dependent variable of operating income in 2017. Since the inclusion of all multiplicative terms in one model may increase the multicollinearity, each interaction was embedded in separate models by following previous studies [85,86]. Models A1 and B1 include only direct effects, which reveal positive and significant relationships between CSR and profit and operating income, and would further support H1. The interaction between CSR and S1 (policy openness, justice, and fairness) is insignificant for both profit and operating income (Models A2 and B2). The same is found for the interaction between CSR and S2 (involvement, integrity, and efficiency) in Models A3 and B3, as well as the interaction between CSR and S5 (financial infrastructure) in Models A6 and B6. Models A4, B4, A5, B5, A7, B7, A8, B8, A9, and B9 show positive and significant moderating effects between CSR and S3 (legal environment), S4 (tax burden), S6 (human resources), S7 (transportation systems and utilities), and S8 (market environment and intermediary services).
The significant interaction effects were plotted using the approach in Aiken and West (1991) [87]. The effect of CSR on the operating performance for SOEs and POEs for sample 1 is shown in Figure 1. The relationship between CSR and operating performance is more positive for SOEs. In contrast, the relationship is negative for POEs (Profit: −0.176; Operating income: −6.275; see Table 3). Figure 2 shows the effect of CSR on the operating performance when firms have different infrastructure levels (e.g., legal environment). Confirming our predictions, the impact of CSR is more positive for firms that are operating in high levels of infrastructure, but tends to be neutral when firms face low levels of infrastructure.
In the following additional analyses, this study took a closer look at the CSR construct by studying each factor separately. To do so, separate regression models were run on each factor [82] of CSR: environmental, social, and governance. The results for sample 1 are summarized in Table 5. In Models A2 and B2, the coefficient of the environmental factor of CSR is insignificantly correlated to both profit and operating income, respectively. Models A3 and A4, in turn, show positive relationships between the social factor (+0.641; p = 0.46) and profit, and the governance factor (+1.040; p = 0.009) and profit. Models B3 and B4 have an insignificant relationship (social: +12.789, p = 0.100; and governance: +9.858, p = 0.167) with the operating performance. These three factors of CSR vary in their contributions to the enhancement of corporate performance.

5. Discussion and Conclusions

Building on the RDT and ROV [19,25], the findings of this study shed light on an important explanation for the differences in the operating performance of firms that adopt CSR practices. In general, the examined data show that CSR practices have an overall positive impact on operating performance deriving from resource accumulation and resource utilization. This study finds a positive correlation between broad CSR practices and operating performance for SOEs and firms that are in a business environment with well-developed infrastructures. Although not hypothesized, this study also reveals that three CSR factors (i.e., environmental, social, and governance) can impact firm performance differently. Previous studies also showed that even though the social factor of CSR practices broadly contributes to financial performance, this is not true of the environmental factor [3], because the former (e.g., the development and marketing of products or services) is considered to be more relevant to the transactions or operational interests of a firm [3]. Additionally, employee welfare and training as social factors of CSR practices are directly related to enhancing employee morale and boosting productivity [88], and hence to the efficiency of resource utilization. In contrast, for many firms, environmental efforts may not be directly related to their operational needs. Additionally, environmental, social and governance factors of CSR practices can have a synergistic effect and benefit firms by providing advantages for both resource accumulation and utilization. These findings provide insights into the role of CSR and contribute theoretically to the extant literature in two ways.

5.1. Theoretical Implications

First, the results of this study help to resolve the debate and mixed findings on the relationship between CSR and corporate performance [5,89]. The current literature has largely focused on examining the influence of economic stakeholders (e.g., shareholders, employees, customers, suppliers, etc.) but overlooked the political stakeholders (i.e., governments) who may substantially affect the performance results of CSR practices in emerging economies. This study addresses this critical gap by showing that the local character in terms of ownership and infrastructure moderates the performance results of CSR efforts. The positive moderating effects suggest that state ownership and infrastructure development in emerging economies such as China facilitate corporate operations. This paper extends the literature on CSR outcomes by systematically investigating the role of the local character in emerging countries.
Second, drawing on the theoretical distinction between resource accumulation and utilization as processes of resource allocation and deployment in organizations, respectively, this study argues that the conflicting insights into the impact of CSR can be rectified by identifying the dual role of the local character in terms of resource administrator and service provider. By considering the advantages of resource accumulation and the disadvantages of resource utilization associated with state ownership, this study finds that SOEs are more capable of improving their operating performance through their CSR practices. The additional benefits that CSR brings to POEs are still limited, although these firms desire a political dependence on the government. Due to government favoritism, compared with SOEs, POEs remain inferior regarding the return from CSR practices. This is almost consistent with the previous research that shows that the local character is still related to restrictions on POEs while supporting SOEs [90,91]. By considering that resource utilization is associated with infrastructure, the findings suggest that firms that carry out CSR practices can orchestrate resources efficiently and effectively to benefit their operating performance. The results contribute to a richer, more fine-grained framework in which the resource dependence and resource orchestration views are integrated to examine the performance implications of organizational CSR actions.

5.2. Managerial and Policy Implications

This study reveals important implications for managers and policymakers, who should understand that both government resource allocation and utilization are related to CSR. First, the literature tends to regard state ownership as an impediment to firm growth due to the inefficiency in resource utilization [10,92]. In this paper, state ownership is found to have a positive effect on CSR practices by improving corporate resource utilization. This is consistent with the view that many SOEs in transitional economies strive to become dynamos that will power the national economy, instead of the predicted dying dinosaurs [93]. SOEs are evolving from conventional hierarchical and bureaucratic structures to more market-oriented forms, although it is not evidenced in this study that POEs benefit more from CSR practices. A possible explanation might be that the CSR actions of POEs do not create more goodwill than SOEs under the Chinese institutional context [91]. Policymakers should make efforts to eliminate institutional imparity and transform governmental constraints into governmental support.
Second, improving the infrastructure should be a priority for emerging markets. Infrastructure support allows for reduced operating costs and higher efficiency and return [94], thereby facilitating effective operations and the CSR success of firms. However, the quantity and quality of infrastructures are challenging corporate operations in emerging economies. In many cases, undeveloped infrastructures result from one country’s inefficient finance and investment, as well as from institutional failures such as weak regulation or lax regulation enforcement [95]. Thus, it is crucial that the government should take due responsibility for developing efficient and effective institutional infrastructure. For example, China has gradually introduced institutional reforms to improve the business environment, such as simplifying administrative procedures and cutting taxes and fees. Effective physical and institutional infrastructures allow companies, particularly small and medium-size enterprises, to grow, operate, and innovate. Despite the notable improvement of physical infrastructure in many emerging economies, policymakers still need to pay attention to increasing investments in intangible infrastructure supply to meet the growing operating demands of firms. The government must emphasize the national business environment and provide intangible infrastructure support through particular measures, e.g., strengthening the supervision of the implementation of infrastructure-related policies at the local government level. Local government agencies can also provide intangible infrastructure support such as job training to improve the ability of professional and administrative personnel.

5.3. Limitations and Future Research Directions

First, although the disclosed environmental, social, and governance practices are used as a proxy in this study to measure CSR, there is the possibility of a discrepancy between the disclosed CSR practices and the actual CSR implementation. Future research might consider collecting first-hand data from surveys and using case studies to further examine the relationship between CSR implementation and operating performance. Second, the analysis in this study relies mainly on cross-sectional data from different years, and the sample is limited to the CSI 300 Index listed companies. Despite their representativeness, large total market capitalization, and halo effect, they are only a part of all Chinese companies. Therefore, the results should be generalized with caution, as their applicability may be limited to the institutional context. Future research should obtain longitudinal data from multiple sources to address this issue. Longitudinal studies can lead to more robust conclusions. This study unearthed the importance of governmental support, namely a form of governmental social responsibility (GSR), in facilitating corporate performance from CSR activity and a possible overall promotion of CSR. CSR and GSR may be inextricably linked. Since the related research results are scattered and fragmented, it would be useful to integrate them within a system analysis, so as to explore the linkage effect and synergy effect of CSR and GSR. This might lead to a more systematic and in-depth understanding of the relationship between CSR and GSR, and provide inspiring insights for relevant institutional arrangements and policy design.

Author Contributions

F.H. drafted the manuscript. X.M. conceptualized and designed the study. C.W.Y.W. contributed to the theories and methods. Y.T. contributed with data and revising the manuscript. All authors have read and agreed to the published version of the manuscript.

Funding

This work is supported by the National Natural Science Foundation of China (Grant No. 71471047), the Humanities and Social Science Foundation of Ministry of Education (Grant No. 15YJC630116), and the Hong Kong Polytechnic University (Grant No. G-SB54).

Conflicts of Interest

The authors declare no conflict of interest.

Appendix A

Table A1. ESG Indices in 2016 on Listed Companies.
FactorSub-factorIndicators
Environmental responsibilityEnvironmental managementEnvironmental management system; environmental investment; environmental training performance; policies/measures/technologies that support environmental product research, development, and sale; whether environmental report is issued
Resource utilizationPolicies/measures/technologies on efficient resource utilization; annual energy consumption amount; total water consumption
Emissions managementEmissions-related policies and types; amount of discharged wastewater; waste emissions/reduction; greenhouse gas emissions; policies/measures/technologies for reducing greenhouse emissions
Ecological protectionPolicies/measures that reduce effects of firms on environment and natural resources
Social responsibilityEmployee rightsEmployee rights protection; non-discriminatory/diversity; prohibitions on child labor/slave labor; turnover rate
Employee trainingTraining system; training performance
Health and safetySafety production system, health and safety investment; accidents/casualties as part of product safety; policies/measures for health and safety
Supply chain responsibilityPolicies/measures for managing supply chain environment and social risks
Government responsibilityResponses and support for government policy; tax amount; employment
Product service and qualityProduct/service quality management system; systems/measures for supporting innovation; R&D investment; customer information protection; after-sales service system; resolution rate of customer complaints
Community responsibilityCharitable strategy and management of donations; donated amounts; community participation and support; support for volunteer activities of employees
Governance responsibilityCorporate governanceBoard of directors and compensation; anticorruption; frequent disclosure of information; participation processes of shareholders; protection of the interests of minority shareholders
ESG managementESG management system/department/personnel; stakeholders communication; issuing of CSR/ESG report; setting up CSR/ESG column on official website; training capabilities in CSR
Table A2. Dimensions of Business Environment Indices in 2016.
Indicator Item
S1 Policy openness, justice, and fairness1.1 Policy openness and transparency; 1.2 Fairness; 1.3 Justice legal enforcement; 1.4 Local protection
S2 Involvement, integrity, and efficiency2.1 Excessive involvement; 2.2 Government efficiency; 2.3 Integrity; 2.4 Government bureaucracy
S3 Legal environment3.1 Judicial Justice and Efficiency; 3.2 Contract execution; 3.3 Protection of property rights and security; 3.4 Protection of intellectual property, technology, and brand
S4 Tax burden4.1 Statutory tax; 4.2 Legally levied taxes; 4.3 Charge, fundraising, apportionment
S5 Financial infrastructure5.1 Formal financial services; 5.2 Loan rate; 5.3 Civil finance; 5.4 Other sources
S6 Human resources6.1 Professional staff; 6.2 Administrative staff; 6.3 Skilled workers
S7 Transportation systems and utilities 7.1 Electrical structures and water and gas supply; 7.2 Railways; 7.3 Others
S8 Market environment and intermediary services8.1 Market demands; 8.2 Excessive competition; 8.3 Intermediary services; 8.4 Industry associations

References

  1. Barnett, M.L.; Salomon, R.M. Beyond dichotomy: The curvilinear relationship between social responsibility and financial performance. Strat. Manag. J. 2006, 27, 1101–1122. [Google Scholar] [CrossRef]
  2. Cheng, B.; Ioannou, I.; Serafeim, G. Corporate social responsibility and access to finance. Strat. Manag. J. 2014, 35, 1–23. [Google Scholar] [CrossRef]
  3. Jayachandran, S.; Kalaignanam, K.; Eilert, M. Product and environmental social performance: Varying effect on firm performance. Strat. Manag. J. 2013, 34, 1255–1264. [Google Scholar] [CrossRef]
  4. Yang, A.S.; Baasandorj, S. Exploring CSR and financial performance of full-service and low-cost air carriers. Financ. Res. Lett. 2017, 23, 291–299. [Google Scholar] [CrossRef]
  5. Javed, M.; Rashid, M.; Hussain, G. When does it pay to be good–A contingency perspective on corporate social and financial performance: Would it work? J. Clean. Prod. 2016, 133, 1062–1073. [Google Scholar] [CrossRef]
  6. Fraussen, B. The visible hand of the state: On the organizational development of interest groups. Public Adm. 2013, 92, 406–421. [Google Scholar] [CrossRef] [Green Version]
  7. Hillman, A.J.; Hitt, M.A. Corporate political strategy formulation: A model of approach, participation, and strategy decisions. Acad. Manag. Rev. 1999, 24, 825–842. [Google Scholar] [CrossRef]
  8. Sheng, S.; Zhou, K.Z.; Li, J.J. The effects of business and political ties on firm performance: Evidence from China. J. Mark. 2011, 75, 1–15. [Google Scholar] [CrossRef]
  9. Sun, P.; Mellahi, K.; Wright, M.; Marler, J.H. The contingent value of corporate political ties. Acad. Manag. Perspect. 2012, 26, 68–82. [Google Scholar] [CrossRef]
  10. Zhou, K.Z.; Gao, G.Y.; Zhao, H. State ownership and firm innovation in China: An integrated view of institutional and efficiency logics. Adm. Sci. Q. 2016, 62, 375–404. [Google Scholar] [CrossRef]
  11. Greve, H.R.; Zhang, C.M. Institutional logics and power sources: Merger and acquisition decisions. Acad. Manag. J. 2017, 60, 671–694. [Google Scholar] [CrossRef]
  12. Padmore, T.; Gibson, H. Modelling systems of innovation: II. A framework for industrial cluster analysis in regions. Res. Policy 1998, 26, 625–641. [Google Scholar] [CrossRef]
  13. Marquis, C.; Raynard, M. Institutional strategies in emerging markets. SSRN Electron. J. 2014, 9, 291–392. [Google Scholar] [CrossRef] [Green Version]
  14. Hinings, C.R.; Logue, D.; Zietsma, C. Fields, governance and institutional infrastructure. In Handbook of Organizational Institutionalism Sage, 2nd ed.; Greenwood, R., Lawrence, T.B., Meyer, R., Oliver, C., Eds.; SAGE Publications Ltd.: Thousand Oaks, CA, USA, 2017. [Google Scholar]
  15. Wang, H.; Qian, C. Corporate philanthropy and corporate financial performance: The roles of stakeholder response and political access. Acad. Manag. J. 2011, 54, 1159–1181. [Google Scholar] [CrossRef]
  16. Maroušek, J.; Hašková, S.; Zeman, R.; Váchal, J.; Vanickova, R. Assessing the implications of EU subsidy policy on renewable energy in Czech Republic. Clean Technol. Environ. Policy 2014, 17, 549–554. [Google Scholar] [CrossRef]
  17. Wong, C.W.; Miao, X.; Cui, S.; Tang, Y. Impact of corporate environmental responsibility on operating income: Moderating role of regional disparities in China. J. Bus. Ethics 2016, 149, 363–382. [Google Scholar] [CrossRef]
  18. Benson, J.K.; Pfeffer, J.; Salancik, G.R. The external control of organizations. Adm. Sci. Q. 1978, 23, 358. [Google Scholar] [CrossRef]
  19. Chirico, F.; Sirmon, D.G.; Sciascia, S.; Mazzola, P. Resource orchestration in family firms: Investigating how entrepreneurial orientation, generational involvement, and participative strategy affect performance. Strat. Entrep. J. 2011, 5, 307–326. [Google Scholar] [CrossRef] [Green Version]
  20. Cao, X.-P.; Ding, Y.; Zhang, H. Social capital, informal governance, and post-IPO firm performance: A study of Chinese entrepreneurial firms. J. Bus. Ethic 2014, 134, 529–551. [Google Scholar] [CrossRef]
  21. Feng, X.; Johansson, A.C.; Zhang, T. Mixing business with politics: Political participation by entrepreneurs in China. J. Bank. Financ. 2015, 59, 220–235. [Google Scholar] [CrossRef] [Green Version]
  22. Carroll, A.B. A three-dimensional conceptual model of corporate performance. Acad. Manag. Rev. 1979, 4, 497–505. [Google Scholar] [CrossRef] [Green Version]
  23. Tang, Y.; Ma, Y.; Wong, C.W.; Miao, X. Evolution of government policies on guiding corporate social responsibility in China. Sustainability 2018, 10, 741. [Google Scholar] [CrossRef] [Green Version]
  24. Ulrich, D.; Barney, J.B. Perspectives in organizations-Resource dependence, efficiency, and population. Acad. Manag. Rev. 1984, 9, 471–481. [Google Scholar] [CrossRef]
  25. Sirmon, D.G.; Hitt, M.A.; Ireland, R.D.; Gilbert, B.A. Resource orchestration to create competitive advantage. J. Manag. 2010, 37, 1390–1412. [Google Scholar] [CrossRef]
  26. Olken, B.A.; Barron, P. The Simple Economics of Extortion: Evidence from Trucking in Aceh. J. Political Econ. 2009, 117, 417–452. [Google Scholar] [CrossRef]
  27. Hawn, O.; Ioannou, I. Mind the gap: The interplay between external and internal actions in the case of corporate social responsibility. Strat. Manag. J. 2016, 37, 2569–2588. [Google Scholar] [CrossRef] [Green Version]
  28. Kim, K.-H.; Kim, M.; Qian, C. Effects of corporate social responsibility on corporate financial performance: A competitive-action perspective. J. Manag. 2015, 44, 1097–1118. [Google Scholar] [CrossRef]
  29. Wang, H.; Tong, L.; Takeuchi, R.; George, G. Corporate social responsibility: An overview and new research directions. Acad. Manag. J. 2016, 59, 534–544. [Google Scholar] [CrossRef]
  30. Wang, H.; Lu, W.; Ye, M.; Chau, K.; Zhang, X. The curvilinear relationship between corporate social performance and corporate financial performance: Evidence from the international construction industry. J. Clean Prod. 2016, 137, 1313–1322. [Google Scholar] [CrossRef]
  31. Bhandari, A.; Javakhadze, D. Corporate social responsibility and capital allocation efficiency. J. Corp. Financ. 2017, 43, 354–377. [Google Scholar] [CrossRef]
  32. Flammer, C. Competing for government procurement contracts: The role of corporate social responsibility. Strat. Manag. J. 2018, 39, 1299–1324. [Google Scholar] [CrossRef]
  33. El Ghoul, S.; Guedhami, O.; Kwok, C.C.Y.; Mishra, D. Does corporate social responsibility affect the cost of capital? J. Bank. Financ. 2011, 35, 2388–2406. [Google Scholar] [CrossRef]
  34. Fombrun, C.J. Reputation: Realizing Value from the Corporate Image; Harvard Business School Press: Boston, MA, USA, 1996. [Google Scholar]
  35. Gangi, F.; Varrone, N. Screening activities by socially responsible funds: A matter of agency? J. Clean. Prod. 2018, 197, 842–855. [Google Scholar] [CrossRef]
  36. Lundgren, T.; Zhou, W. Firm performance and the role of environmental management. J. Environ. Manag. 2017, 203, 330–341. [Google Scholar] [CrossRef] [PubMed]
  37. Benlemlih, M.; Bitar, M. Corporate social responsibility and investment efficiency. J. Bus. Ethics 2018, 148, 647–671. [Google Scholar] [CrossRef]
  38. Arouri, M.; Pijourlet, G. CSR Performance and the value of cash holdings: International evidence. J. Bus. Ethics 2015, 140, 263–284. [Google Scholar] [CrossRef]
  39. Bai, C.-E.; Lu, J.; Tao, Z. Property rights protection and access to bank loans. Econ. Transit. 2006, 14, 611–628. [Google Scholar] [CrossRef] [Green Version]
  40. Jia, N. Are collective political actions and private political actions substitutes or complements? Empirical evidence from China’s private sector. Strat. Manag. J. 2014, 35, 292–315. [Google Scholar] [CrossRef]
  41. Gong, T.; Collins, P.; Chan, H.S. The quality of governance in China and beyond: Introduction to special issue. Public Adm. Dev. 2017, 37, 155–159. [Google Scholar] [CrossRef]
  42. Chen, D.; Li, S.; Xiao, J.Z.; Zou, H. The effect of government quality on corporate cash holdings. J. Corp. Financ. 2014, 27, 384–400. [Google Scholar] [CrossRef] [Green Version]
  43. Zhou, K.Z.; Li, J.J.; Sheng, S.; Shao, A.T. The evolving role of managerial ties and firm capabilities in an emerging economy: Evidence from China. J. Acad. Mark. Sci. 2014, 42, 581–595. [Google Scholar] [CrossRef]
  44. Delios, A.; Henisz, W.J. Political hazards, experience, and sequential entry strategies: The international expansion of Japanese firms, 1980–1998. Strat. Manag. J. 2003, 24, 1153–1164. [Google Scholar] [CrossRef] [Green Version]
  45. Miao, X. China emissions: Stop subsidizing emitters. Nature 2015, 527, 38. [Google Scholar] [CrossRef] [PubMed] [Green Version]
  46. Chadwick, C.; Super, J.F.; Kwon, K. Resource orchestration in practice: CEO emphasis on SHRM, commitment-based HR systems, and firm performance. Strat. Manag. J. 2014, 36, 360–376. [Google Scholar] [CrossRef]
  47. Lazzarini, S.G. Strategizing by the government: Can industrial policy create firm-level competitive advantage? Strat. Manag. J. 2015, 36, 97–112. [Google Scholar] [CrossRef]
  48. Krueger, A.O. Government failures in development. J. Econ. Perspect. 1990, 4, 9–23. [Google Scholar] [CrossRef] [Green Version]
  49. Lee, S.; Weng, D.H. Does bribery in the home country promote or dampen firm exports? Strat. Manag. J. 2013, 34, 1472–1487. [Google Scholar] [CrossRef]
  50. Bird, R.C. The Impact of Coercion on Protecting US Intellectual Property Rights in the BRIC Economies. In Emerging Economies and the Transformation of International Business; Edward Elgar Publishing: Cheltenham, UK, 2006; pp. 431–451. [Google Scholar]
  51. Kor, Y.Y.; Mahoney, J.T. How dynamics, management, and governance of resource deployments influence firm-level performance. Strat. Manag. J. 2005, 26, 489–496. [Google Scholar] [CrossRef]
  52. Hines, J.R. Business tax burdens and tax reform. Brookings Pap. Econ. Act. 2017, 2017, 449–477. [Google Scholar] [CrossRef] [Green Version]
  53. Campello, M.; Graham, J.R.; Harvey, C.R. The real effects of financial constraints: Evidence from a financial crisis. J. Financ. Econ. 2010, 97, 470–487. [Google Scholar] [CrossRef] [Green Version]
  54. Kulczycka, J.; Wirth, H.; Hausner, J. Polish tax policy—Its impact on the mineral sector. Resour. Policy 2017, 52, 72–80. [Google Scholar] [CrossRef]
  55. Johnson, S.; Kaufmann, D.; McMillan, J.; Woodruff, C. Why do firms hide? Bribes and unofficial activity after communism. J. Public Econ. 2000, 76, 495–520. [Google Scholar] [CrossRef]
  56. He, F.; Miao, X.; Wong, C.W.; Lee, S.H.N. Contemporary corporate eco-innovation research: A systematic review. J. Clean. Prod. 2018, 174, 502–526. [Google Scholar] [CrossRef]
  57. World Bank. World Development Report 2006; World Bank: Washington, DC, USA, 2005. [Google Scholar]
  58. Hitt, M.A.; Bierman, L.; Shimizu, K.; Kochhar, R. Direct and moderating effects of human capital on strategy and performance in professional service firms: A resource-based perspective. Acad. Manag. J. 2001, 44, 13–28. [Google Scholar]
  59. Surroca, J.; Tribó, J.A.; Waddock, S. Corporate responsibility and financial performance: The role of intangible resources. Strat. Manag. J. 2010, 31, 463–490. [Google Scholar] [CrossRef]
  60. Huselid, M.A. The impact of human resource management practices on turnover, productivity, and corporate financial performance. Acad. Manag. J. 1995, 38, 635–672. [Google Scholar]
  61. Hitt, M.A.; Xu, K.; Carnes, C.M. Resource based theory in operations management research. J. Oper. Manag. 2015, 41, 77–94. [Google Scholar] [CrossRef]
  62. Hart, S.L.; Milstein, M.B. Creating sustainable value. Acad. Manag. Perspect. 2003, 17, 56–67. [Google Scholar] [CrossRef]
  63. Liu, H.; Wei, S.; Ke, W.; Wei, K.K.; Hua, Z. The configuration between supply chain integration and information technology competency: A resource orchestration perspective. J. Oper. Manag. 2016, 44, 13–29. [Google Scholar] [CrossRef]
  64. York, J.G.; Vedula, S.; Lenox, M.J. It’s not easy building green: The impact of public policy, private actors, and regional logics on voluntary standards adoption. Acad. Manag. J. 2018, 61, 1492–1523. [Google Scholar] [CrossRef]
  65. Hargreaves, T.; Hielscher, S.; Seyfang, G.; Smith, A. Grassroots innovations in community energy: The role of intermediaries in niche development. Glob. Environ. Chang. 2013, 23, 868–880. [Google Scholar] [CrossRef] [Green Version]
  66. Zeng, S.; Xie, X.; Tam, C.M. Relationship between cooperation networks and innovation performance of SMEs. Technovation 2010, 30, 181–194. [Google Scholar] [CrossRef]
  67. Xu, B.; Zeng, T. Profitability, state ownership, tax reporting and corporate social responsibility: Evidence from Chinese listed firms. Soc. Responsib. J. 2016, 12, 23–31. [Google Scholar] [CrossRef]
  68. Chen, Y.-C.; Hung, M.; Wang, Y. The effect of mandatory CSR disclosure on firm profitability and social externalities: Evidence from China. J. Account. Econ. 2018, 65, 169–190. [Google Scholar] [CrossRef]
  69. Jeong, K.H.; Jeong, S.W.; Lee, W.J.; Bae, S.H. Permanency of CSR activities and firm value. J. Bus. Ethics 2016, 152, 207–223. [Google Scholar] [CrossRef]
  70. Hendricks, K.B.; Singhal, V.R.; Stratman, J.K. The impact of enterprise systems on corporate performance: A study of ERP, SCM, and CRM system implementations. J. Oper. Manag. 2006, 25, 65–82. [Google Scholar] [CrossRef]
  71. Hellman, J.; Schankerman, M. Intervention, corruption and capture: The nexus between enterprises and the state. Econ. Transit. 2000, 8, 545–576. [Google Scholar] [CrossRef]
  72. Globerman, S.; Shapiro, D. Governance infrastructure and US foreign direct investment. J. Int. Bus. Stud. 2002, 34, 19–39. [Google Scholar] [CrossRef]
  73. Haveman, H.A.; Jia, N.; Shi, J.; Wang, Y. The dynamics of political embeddedness in China. Adm. Sci. Q. 2016, 62, 67–104. [Google Scholar] [CrossRef] [Green Version]
  74. McWilliams, A.; Siegel, D.S.; Wright, P.M. Corporate Social Responsibility: Strategic Implications*. J. Manag. Stud. 2006, 43, 1–18. [Google Scholar] [CrossRef] [Green Version]
  75. Peng, C.-W.; Yang, M.-L. The effect of corporate social performance on financial performance: The moderating effect of ownership concentration. J. Bus. Ethic 2013, 123, 171–182. [Google Scholar] [CrossRef]
  76. Cuypers, I.R.P.; Koh, P.-S.; Wang, H. Sincerity in corporate philanthropy, stakeholder perceptions and firm value. Organ. Sci. 2015, 27, 173–188. [Google Scholar] [CrossRef]
  77. Waddock, S.A.; Graves, S. The corporate social performance-financial performance link. Strat. Manag. J. 1997, 18, 303–319. [Google Scholar] [CrossRef]
  78. Zhang, Z.; Guo, J.; Hewings, G.J. The effects of direct trade within China on regional and national CO2 emissions. Energy Econ. 2014, 46, 161–175. [Google Scholar] [CrossRef]
  79. Frazier, P.A.; Tix, A.P.; Barron, K.E. Testing moderator and mediator effects in counseling psychology research. J. Couns. Psychol. 2004, 51, 115–134. [Google Scholar] [CrossRef]
  80. Chandler, G.N.; McKelvie, A.; Davidsson, P. Asset specificity and behavioral uncertainty as moderators of the sales growth—Employment growth relationship in emerging ventures. J. Bus. Ventur. 2009, 24, 373–387. [Google Scholar] [CrossRef] [Green Version]
  81. Marquis, C.; Toffel, M.W.; Zhou, Y. Scrutiny, Norms, and Selective Disclosure: A Global Study of Greenwashing. Organ. Sci. 2016, 27, 483–504. [Google Scholar] [CrossRef]
  82. Ahmad, S.; Schroeder, R.G. The impact of human resource management practices on operational performance: Recognizing country and industry differences. J. Oper. Manag. 2002, 21, 19–43. [Google Scholar] [CrossRef]
  83. Tabachniek, B.G.; Fidell, L.S. Book review: Reply to Widaman’s review of using multivariate statistics. Appl. Psychol. Meas. 1984, 8, 471. [Google Scholar] [CrossRef]
  84. Hair, J.F.; Anderson, R.E.; Tatham, R.L.; Black, W.C. Multivariate Data Analysis, 5th ed.; Prentice Hall: Upper Saddle River, NJ, USA, 1998. [Google Scholar]
  85. Dowell, G.; Swaminathan, A. Entry timing, exploration, and firm survival in the early U.S. bicycle industry. Strat. Manag. J. 2006, 27, 1159–1182. [Google Scholar] [CrossRef]
  86. Lin, Z.; Yang, H.; Arya, B. Alliance partners and firm performance: Resource complementarity and status association. Strat. Manag. J. 2009, 30, 921–940. [Google Scholar] [CrossRef] [Green Version]
  87. Toothaker, L.E.; Aiken, L.S.; West, S.G. Multiple regression: Testing and interpreting interactions. J. Oper. Res. Soc. 1994, 45, 119. [Google Scholar] [CrossRef]
  88. Luo, X.; Bhattacharya, C.B. Corporate social responsibility, customer satisfaction, and market value. J. Mark. 2006, 70, 1–18. [Google Scholar] [CrossRef]
  89. Grewatsch, S.; Kleindienst, I. When does it pay to be good? Moderators and mediators in the corporate sustainability–corporate financial performance relationship: A critical review. J. Bus. Ethics 2015, 145, 383–416. [Google Scholar] [CrossRef]
  90. Lu, J.W.; Tan, H. Institutional discrimination and outward FDI from China’s private sector: An institutional escapism perspective. Department of Strategy and Entrepreneurship, China Europe International Business School, 2018; Unpublished working paper. [Google Scholar]
  91. Marquis, C.; Qian, C. Corporate social responsibility reporting in China: Symbol or Substance? Organ. Sci. 2014, 25, 127–148. [Google Scholar] [CrossRef]
  92. Megginson, W.L.; Netter, J.M. From state to market: A survey of empirical studies of privatization. J. Econ. Lit. 2001, 39, 321–389. [Google Scholar] [CrossRef] [Green Version]
  93. Ralston, D.A.; Terpstra, T.J.; Terpstra, R.H.; Wang, X.; Egri, C. Today’s state-owned enterprises of China: Are they dying dinosaurs or dynamic dynamos? Strat. Manag. J. 2006, 27, 825–843. [Google Scholar] [CrossRef]
  94. Park, S.H.; Luo, Y. Guanxi and organizational dynamics: Organizational networking in Chinese firms. Strat. Manag. J. 2001, 22, 455–477. [Google Scholar] [CrossRef]
  95. Rud, J.P. Infrastructure regulation and reallocations within industry: Theory and evidence from Indian firms. J. Dev. Econ. 2012, 99, 116–127. [Google Scholar] [CrossRef]
Figure 1. Interaction Effect between CSR and State Ownership on Operating Performance for Sample 1.
Sustainability 12 04874 g001
Figure 2. Interaction Effect between CSR and Infrastructure on Operating Performance for Sample 1.
Sustainability 12 04874 g002
Table 1. Sample Distribution by Industry Sector.
Industry SectorSample 1 (in Year 2016)Sample 2 (in Year 2012)
n1n2SP (%)PP (%)n1n2SP (%)PP (%)
Farming, forestry, animal husbandry, and fisheries331.461.45552.281.60
Mining and quarrying883.882.40262511.422.37
Manufacturing979646.662.6911611452.0563.55
Production and supply of electric power, gas, and water883.883.1611115.023.29
Construction10104.852.9412125.482.4
Wholesale and retail trades994.374.9613135.946.13
Transport, storage, and postal services994.373.25662.743.33
Information transfer, software, and information technology services272713.116.82773.205.01
Finance332.21241.68
Real estate16167.774.0413135.945.81
Leasing and commercial services552.431.39441.830.88
Administration of water, environment, and public facilities331.461.14220.910.96
Health care and social work110.490.22///0.12
Culture, sports, and entertainment994.371.48331.370.92
Conglomerate220.970.88441.830.88
Total240206100.00246219100.00
n1 = sample firms after removing firms listed in overseas stock market; n2 = sample firms after removing financial firms and firms located in Qinghai and Tibet due to missing data. SP = Sample percentage; PP = Population percentage.
Table 2. Means, Standard Deviations, and Correlations.
VariablesMSD1234567
1. Profit2.454.10
2. Profit (one-year lag)2.875.250.926 **
3. Operating income36.1391.500.769 **0.693 **
4. Operating income (one-year lag)42.78104.730.769 **0.711**0.995 **
5. Firm age19.355.320.0180.011−0.061−0.054
6. Ln(Employee)9.161.170.409 **0.429 **0.471 **0.478 **−0.100
7. Debt ratio0.490.200.182 **0.161 *0.286 **0.290 **0.0840.332 **
8. SO0.470.500.199 **0.234 *0.170 *0.172 **−0.0710.237 **0.078
9. S13.720.160.0510.0400.0180.021−0.015−0.027−0.049
10. S23.620.240.0390.0250.0090.007−0.102−0.071−0.029
11. S33.900.130.0590.0390.0930.096−0.027−0.086−0.003
12. S43.660.160.0810.0600.1330.1290.026−0.0680.038
13. S53.430.36−0.051−0.1010.0460.042−0.182 **−0.077−0.004
14. S63.480.220.0550.0260.1270.1300.038−0.0830.062
15. S74.140.240.1020.0630.1200.118−0.065−0.0580.067
16. S83.420.230.1000.0590.1310.128−0.059−0.0810.088
17. CSR39.7717.140.325 **0.371 **0.341 **0.349 **−0.0380.507 **0.189 **
Variables8910111213141516
9. S1−0.100
10. S2−0.1030.788 **
11. S30.0760.622 **0.431 **
12. S40.189 **0.1200.232 **0.551 **
13. S50.0190.0780.172 **0.320 **0.278 **
14. S60.137 *0.150 *−0.035 **0.647 **0.494 **0.027
15. S70.0900.570 **0.455 **0.827 **0.663 **0.191 **0.674 **
16. S80.0890.336 **0.301 **0.704 **0.490 **0.157 *0.732 **0.790 **
17. CSR0.277 **−0.102−0.149 **−0.124−0.068 **−0.056−0.065 **−0.110−0.049
Note: Descriptive statistics and correlations for sample 1 in 2016 (N = 206). * p < 0.05; ** p < 0.01. Results of life-cycle, industry, and regional dummies are not reported for the sake of brevity. Profit and operating income: in billion CNY.
Table 3. Estimation Results for H1, H2, and H3 in Sample 1 (N = 206).
Panel AModel A1Model A2Model A3Model A4Model A5Model B1Model B2Model B3Model B4Model B5
Dependent VariablesProfit_2017Operating income_2017
Intercept1.4311.784 *1.430 *1.956 *1.635 *36.255 *41.559 *35.260 *44.763 *39.141 *
(0.986)(0.977)(0.960)(0.958)(0.954)(19.058)(19.031)(18.793)(18.700)(18.683)
Firm age0.3700.3440.3360.3050.308−0.895−1.297−1.433−2.021−1.970
(0.343)(0.337)(0.329)(0.330)(0.326)(6.628)(6.568)(6.443)(6.447)(6.382)
Ln(Employee)2.119 ***1.663 ***1.802 ***1.629 ***1.748 ***46.118 ***39.268 ***41.757 ***38.647 ***40.729 ***
(0.374)(0.401)(0.394)(0.393)(0.390)(7.227)(7.812)(7.710)(7.666)(7.646)
Debt ratio0.2100.1730.0630.053−0.00715.040 *14.488 *15.525 *12.148 *11.196
(0.362)(0.356)(0.350)(0.351)(0.347)(7.004)(6.942)(6.843)(6.852)(6.800)
SO1.0720.7420.8100.6580.7316.7061.7542.9570.1761.458
(0.722)(0.719)(0.703)(0.704)(0.696)(13.963)(14.013)(13.753)(13.756)(13.630)
Infrastructure0.1270.1490.0330.040−0.02718.099 *18.418 *16.369 *16.392 *15.227 *
(0.477)(0.468)(0.459)(0.460)(0.454)(9.212)(9.125)(8.979)(8.978)(8.902)
CSR 1.134 **−0.1761.147 **0.102 17.021 *−6.27517.267 *−1.015
(0.399)(0.562)(0.390)(0.569) (7.772)(11.007)(6.624)(11.146)
CSR × SO 2.175 ** 1.732 * 38.703 ** 30.282 *
(0.674) (0.694) (13.190) (13.587)
CSR × Infrastructure 0.980 **0.754 * 18.263 **14.314 *
(0.318)(0.327) (6.210)(6.398)
ΔF6.505 ***8.084 **10.424 **9.492 **7.993 ***8.396 ***4.796 *8.610 **8.649 **6.897 **
Adjusted R20.1950.2230.2590.2550.2750.2450.2590.2870.2870.302
R20.2300.2610.2980.2950.3170.2780.2960.3260.3260.343
ΔR2 0.0310.0380.0340.057 0.0170.0300.0300.047
Note: * p < 0.05; ** p < 0.01; *** p < 0.001. Standard errors are in parentheses. All models included life-cycle, industry, and region dummies, which are not reported for the sake of brevity. Profit and operating income are measured for year t + 1: in billion CNY.
Table 4. Estimation Results for the H3 Regarding Eight Dimensions of Infrastructure in Sample 1 (N = 206).
Panel AModel A1Model A2Model A3Model A4Model A5Model A6Model A7Model A8Model A9
Dependent VariablesProfit_2017
Intercept1.628 *1.988 **2.042 **2.129 *1.873 **1.984 *1.989 *1.948 **1.903 **
−0.842−1.082−1.083−1.06−1.053−1.082−1.056−1.058−1.061
CSR1.132 **1.209 **1.197 **1.196 **1.116 **1.203 **1.178 **1.147 **1.152 **
−0.398−0.411−0.41−0.402−0.4−0.411−0.401−0.402−0.403
CSR × S1 0.316
−0.348
CSR × S2 0.431
−0.406
CSR × S3 0.980 **
−0.33
CSR × S4 1.008 **
−0.302
CSR × S5 0.301
−0.365
CSR × S6 1.156 **
−0.366
CSR × S7 0.981 **
−0.326
CSR × S8 0.943 **
−0.33
ΔF8.095 **0.8241.1298.830 *11.133 **0.6819.994 **9.073 **8.163 **
Adjusted R20.2260.2120.2130.2440.2530.2120.2490.2450.242
R20.260.2812830.3110.3190.2810.3150.3120.308
ΔR20.0310.0030.0040.0330.0410.0030.0370.0330.03
Panel BModel B1Model B2Model B3Model B4Model B5Model B6Model B7Model B8Model B9
Dependent VariablesOperating Income_2017
Intercept22.22235.303 *36.477 *37.7083 *33.26835.636 *35.512 *34.740 *33.941
−16.572−21.207−21.208−20.912−20.641−21.124−20.654−20.834−20.854
CSR16.771 *16.506 *16.400 *16.376 *14.852 *16.644 *16.021 *15.528 *15.597 *
−7.831−8.054−8.031−7.926−7.844−8.019−7.839−7.912−7.918
CSR × S1 3.717
−6.828
CSR × S2 8.075
−7.949
CSR × S3 15.976 *
−6.501
CSR × S4 19.401 ***
−5.923
CSR × S5 9.458
−7.134
CSR × S6 23.025 **
−7.155
CSR × S7 16.934 **
−6.415
CSR × S8 16.740 *
−6.488
ΔF4.586 *0.2961.0326.039 *10.731 **1.75810.355 **6.970 **6.657 *
Adjusted R20.2480.240.2430.2630.280.2460.2790.2660.265
R20.2810.3070.310.3280.3440.3120.3420.3310.33
ΔR20.0170.0010.0040.0220.0380.0060.0360.0250.024
Note: * p < 0.05; ** p < 0.01; *** p < 0.001. Standard errors are in parentheses. All models included separate eight sub-infrastructure variables and control variables, which are not reported due to space constraints. Profit and operating income: in billion CNY.
Table 5. Separate CSR Categories Analyses for Sample 1 (N = 206).
Model A1Model A2Model A3Model A4Model B1Model B2Model B3Model B4
Dependent VariablesProfit_2017Operating Income_2017
Intercept1.4311.705 **1.734 **1.35836.255 *37.349 *39.985 *35.285 *
(0.986)(0.996)(0.978)(0.979)(19.058)(19.378)(19.109)(19.026)
Firm age0.3700.3450.3570.397−0.895−0.995−1.055−0.542
(0.343)(0.342)(0.338)(0.341)(6.628)(6.650)(6.600)(6.618)
Ln(Employee)2.119 ***1.932 ***1.747 ***1.862 ***46.18 ***45.369 ***41.550 ***42.672 ***
(0.374)(0.390)(0.395)(0.392)(7.227)(7.580)(7.709)(7.626)
Debt ratio0.2100.2070.1210.18915.040 *15.025 *13.947 *14.761 *
(0.362)(0.361)(0.359)(0.360)(7.004)(7.020)(7.005)(6.991)
SO1.0720.9380.9750.7866.7066.1695.5102.872
(0.722)(0.724)(0.713)(0.731)(13.963)(14.086)(13.920)(14.201)
Infrastructure0.1270.1560.1270.11518.099 *18.215 *18.099 *17.930 *
(0.477)(0.475)(0.470)(0.473)(9.212)(9.239)(9.171)(9.191)
Environmental 0.641 2.561
(0.393) (7.638)
Social 1.040 ** 12.789
(0.397) (7.747)
Governance 0.6736 * 9.858
(0.366) (7.108)
ΔF6.505 ***2.6666.880 **4.050 *8.396 ***0.1122.7251.923
Adjusted R20.1950.2010.1950.2070.2450.2420.2520.249
R20.2300.2400.2300.2460.2780.2790.2880.285
ΔR2 0.0100.0260.016 0.0000.0100.007
Note: * p < 0.05; ** p < 0.01; *** p < 0.001. Standard errors are in parentheses. All models included life-cycle, industry, and region dummies, which are not reported for the sake of brevity. Profit and operating income: in billion CNY.

