Article

Social Responsibility, Communication and Financial Data of Hospitals: A Structural Modelling Approach in a Sustainability Scope

by
Judit Creixans-Tenas
1,*,
Dolores Gallardo-Vázquez
2 and
Núria Arimany-Serrat
1
1
Department of Business, Faculty of Economics and Business, University of Vic-UCC, 08500 Vic Barcelona, Spain
2
Department of Financial Economics and Accounting, Faculty of Economics and Business, University of Extremadura, 06006 Badajoz, Spain
*
Author to whom correspondence should be addressed.
Sustainability 2020, 12(12), 4857; https://doi.org/10.3390/su12124857
Submission received: 13 May 2020 / Revised: 10 June 2020 / Accepted: 12 June 2020 / Published: 14 June 2020
(This article belongs to the Section Economic and Business Aspects of Sustainability)

Abstract

:
Health is one of the fundamental pillars of public management and should be one of the main objectives of any society that pursues true progress and well-being for its citizens. In recent years, the public health system has been seeking collaborative synergies with the private health system to achieve efficient functioning at the levels of care demand, waiting lists and financial pressure. For this reason, private entities in the hospital field must be analysed through the application of information systems comprised of financial and non-financial indicators. In this organizational context, economic and financial data, communication, and social responsibility are essential to correctly manage the performance of hospital companies. Drawing on stakeholder and dynamic capabilities theories, we have defined a conceptual model that proposes that a greater predisposition to social responsibility actions by hospitals could explain communication practices and economic and financial results. Thus, the main objective of this study is to determine the possible relationship between three important aspects in the management of hospital companies: social responsibility, communication, and economic and financial results. Partial least square technique was applied to estimate a structural equation model to analyse a sample of 122 hospitals operating in Spain. This paper also analyses how communication mediates the relationship between social responsibility and economic and financial results. The main results empirically validate a model that links and predicts the social responsibility actions undertaken by these companies, which are directly related to the business communication that is carried out and the economic and financial results. Related to the implications, managers could adopt strategies once they know that they will contribute to improve their relationships with stakeholders and shareholders.

1. Introduction

Health is an essential pillar of any society’s public management. Consequently, healthcare and hospital assistance are two of the biggest public expenditure items in the government budget [1]. The health sector plays a fundamental role in maintaining the population’s health and well-being, 0 and contributes to a country’s economic development [2]. In recent decades, the structure and organization of the Spanish National Health System (NHS) has changed significantly: the private health sector has gained significant weight in economic and social terms, and approximately 20% of the population, or about ten million Spanish people, regularly use private health services and centres [3].
After the recession of the last decade, the economic and financial situation of Spanish health has been a concern for those directly responsible for public and private spheres. In fact, the austerity of recent years has decreased public spending to cover the needs of the health system, causing deficiencies in its performance [4,5]. Thus, the private health sector is an important agent in Spanish health, as it is a strategic ally of the public health system. At the same time, it contributes to unburdening and saving the public health system, because citizens who have private insurance do not consume, or tend to consume less, public health resources. Private health contributes to the balance of the public health system and to the achievement of key objectives such as guaranteeing equity, sustainability, accessibility and quality of healthcare [3].
The successful management and administration of private entities in the hospital sphere must be verified through the application of information systems comprised of appropriate financial and non-financial data. In this organisational context, communication and social responsibility, as indicators of economic and financial results, are essential to correctly manage the performance of organisations in general, and hospitals in particular [6].
Social responsibility (SR) is important because it implies a new way of doing business, with the voluntary integration of economic, social and environmental concerns into the actions and strategies of business activity [7]. SR practices are a very significant area that has begun to receive attention and consideration in the health sector [1,8]. SR is considered a key commercial strategy by companies worldwide, but the health industry has been slow to respond to the growing expectations of stakeholders in this field [9,10]. Although healthcare organisations such as hospitals have a social mission to help the sick, broader SR strategies have begun to emerge slowly in the healthcare landscape [9,11]. In hospital management, SR activities for stakeholders are important to shape the perceptions of clients/patients and to generate positive relational and transactional results [9,12].
Related to the motivation of the study, private hospital centres in Spain is a topic that has not been researched extensively, so it is a research area with potential. This is particularly true in the current context, with demographic changes that are leading to increasingly ageing populations and, in Spain, a decentralised system for the provision of health services that does not contribute to the containment of spending. Moreover, there are regulations that reflect a clear relationship between business communication and economic and financial results, such as Directive 2014/95/EU, on disclosure of non-financial information or Corporate Social Responsibility (CSR.) The directive was transposed into the Spanish legal system through Royal Decree-Law 18/2017 with application for the financial year beginning on 1 January 2017, subsequently revised by Law 11/2018 published on 29 December 2018 in Spain. Field studies establish that non-financial information or CSR, integrated with financial information, improves hospital management [6]. Furthermore, reputable hospitals improve economic results and satisfy their stakeholders [13]. Therefore, evaluating the economic–financial results, transparency and corporate social responsibility allows evaluating of the reputation of hospitals [13,14]. For this, the monetization of the social value of hospitals according to the polyhedral model [15] reflects the economic and social value of hospitals and allows evaluation as to whether public resources are used appropriately, if relations with stakeholders are adequate and whether the administration contemplates the social responsibility to manage efficiently [6]. With support from the previous ideas, we have outlined our research questions and the objectives of our study.
Consequently, the objective of this research is to demonstrate the close relationship between three important aspects: social responsibility, economic and financial results and transparent communication, for the efficient management and direction of the hospital companies under study. To achieve this aim, the technique of structural equation modelling was used to test empirically a structural model based on data collected from a sample of 122 companies. The analysis was carried out using SmartPLS 3.2.8 and confirmed that hospital companies are favourably inclined to guarantee efficient hospital management—integrating and relating social responsibility—considering the financial statements and transparent communication. The results obtained support a balanced sustainable management between SR, economic and financial results and communication in hospital companies. The main contribution of this study is the conjunction of obtaining good economic and financial results while working on good CSR and good communication, based on the stakeholders and dynamic capabilities theories.
The study, after the introduction, presents in Section 2 a review of the literature referring to the theories considered to support the paper and a theoretical framework to social responsibility, economic and financial results and the communication of hospital companies and their relationships. Subsequently, in Section 3, we present the development and justification of the hypothesis. After, in Section 4, the materials and methods, analysing the data, variables, and methodology used. The results are presented in Section 5. Finally, in Section 6 and Section 7, the discussion of the results and the conclusions of the investigation are presented.

2. Literature Review and Conceptual Model

2.1. Stakeholders and Dynamic Capabilities Theories

Businesses’ perspectives have changed in recent years. Some years ago, the perspective was the maximizing of corporate value for owners and/or shareholders [16]. Later, the importance is placed on the maximization of value for the multiple stakeholders in the organization [17,18]. With this new perspective, the orientation is on the value of individuals or groups who belong to the organizations and who contribute to the creation and distribution of economic value [19]. As a consequence, both the individuals or groups and organizations could reap the benefits from the actions carried out. This set of relationships is formalized in contracts defining rights, objectives, expectations, and responsibilities, and thereby, configuring organizations’ current operational models [20,21] so that their success depends on properly managing these relationships [22].
The stakeholder theory has been incorporated into many studies on CSR [23]. In this context, experts need to take into account the importance of developing a comprehensive discourse with stakeholders and incorporating their responses into globalization scenarios [24,25]. In the context of our study, stakeholders such as customers, suppliers and employees expect companies to behave responsibly to mitigate problems and shareholders expect economic benefits derived from such behaviour [26,27]. Stakeholders and shareholders now try to get involved in companies that share these concerns. Therefore, companies feel they must meet expectations to maintain a good reputation in an increasingly competitive global landscape, to maximize the profit and value generated, and to motivate employees, satisfy customers and attract investors [28,29,30,31,32].
Dynamic capabilities theory has its antecedents in resource-based theory. This first theory seeks to take companies to a higher level of responsibility with a dual-benefit approach (i.e., company and society). In addition, this theory includes the detection and exploitation of opportunities in potential markets, helping organizations execute and apply internal and external resources to achieve sustainable results [33,34]. A key dynamic capability is the process of generating knowledge, which facilitates the execution of strategic plans for the company [35]. Resources and knowledge, such as social responsibility and communication, stimulate dynamic capabilities development [36]. A crucial SR practice is the communication of information about the SR activities companies develop. Therefore, SR plans contribute to generating more accurate reports on responsible firms’ effects on their stakeholders [37,38], as a consequence of the development of dynamic capabilities in the company.

2.2. Theoretical Framework

Private hospital companies function as for-profit entities. For this reason, they must be managed adequately to function properly. This is achieved by periodically undertaking the following actions [39]: carrying out economic and financial analyses using financial statements, to compare achievements and variables in different years and make the most appropriate decisions; using information and communication technologies (ICT) to improve and facilitate communication between managers, professionals and users of hospital companies; voluntarily implementing policies associated with social, economic and environmental aspects of SR.
In relation to the economic and financial indicators of hospital companies, an analysis of financial statements reflects the information that must be considered to explain hospital management strategy, particularly during periods of economic changes [40]. These indicators allow hospital companies to assess their economic and financial situation over time and compare their data with other companies in the same sector. Therefore, variation in indicators and a sector comparison help managers to identify problems and, where appropriate, find the most appropriate solutions [40].
An analysis of profitability and its main explanatory factors is relevant to improve long-term financial performance. A number of variables can explain profitability [41,42], but those with the greatest influence are indebtedness and solvency as internal variables, and the evolution of the market, the business dimension and geographical area as external variables. The decision-making process in hospitals requires financial information from annual accounts and non-financial information, since the health sector responds to more than purely financial issues [41].
If we look for a link with the previous theories that we have raised, different methodological models relate social responsibility to the economic and financial results of organizations. Specifically, the monetization of social value in hospitals uses the polyhedral model with the SPOLY process [15] to collect the economic and social value of organizations and integrate their economic and social responsibility. It is a social accounting model that shows the monetized social value, as a sum of the social value generated by economic activity and the specific social value [43]. Monetizing social value to analyse the efficiency of public spending, through the social accounting of hospitals [6], is also useful to improve relationships with stakeholders, in addition to incorporating social responsibility in efficient management [6,43]. For this reason, stakeholders and dynamic capabilities theories are presented in this context of study, observing their suitability to the study.
The use of ICTs is expanding in hospital companies, since healthcare systems are incorporating new and advanced technologies in healthcare processes to offer more efficient services [44]. Many users now turn to the websites of organisations and institutions to obtain information. In fact, the demand for digital information from health institutions is increasingly necessary and evident. Consequently, access to hospital websites is used as a common means of communication between hospital institutions and stakeholders. Websites serve to capture stakeholders’ attention and increase the market share of these institutions. Thus, for economic or purely social reasons, it is essential that everyone has the same access to the web [45]. ICTs are considered one of the most important agents of change in health, and stakeholders demand increasing transparency in the information provided about health services. If the information is verified and of high quality, it increases the credibility of the system, which in turn, tends to continuously increase the consumption of resources. Thus, the introduction of ICTs helps improve efficiency and propose new models of organization and work [46].
At the same time, looking for the link with the two theories of our study, Corporate Social Responsibility (CSR) initiatives positively influence the brand value; for this reason, CSR and the brand are integrated in organizations, through sincere long-term communication [47]. Therefore, Information and Communication Technologies (ICT) induce greater transparency of organizations and their CSR to improve stakeholder confidence, especially in health centres [48,49]. Furthermore, the transparency in communication of health centres, with adequate corporate governance policies, improves better economic and financial results. The Law 11/2018 of December 28 on non-financial disclosure advocates good CSR communication, as evidenced by AECA’s integrated scoreboard [50]. In addition, the disclosure of non-financial or corporate social responsibility-related information measures the management of organizations and their impact on society to foster a sustainable world economy. In this case, we can also conclude that stakeholders and dynamic capabilities theories are suitable to our context of study.
In recent years, interest in the transparency of entities has increased significantly and one mechanism for the dissemination of this information is through websites [51,52]. There has been a paradigm shift in which both financial results and non-financial indicators have a significant impact on business performance [53,54]. SR is related to the voluntary adoption by companies of social and environmental concerns in the development of their activities and their interactions with stakeholders [28,55]. In addition, the reporting of this information leads to greater awareness of social, ethical and environmental problems, in a world that is fighting against climate change, resource scarcity, poverty and inequality [28,56,57].
Hospital companies are among the organisations that should adopt SR [58] because operations carried out in the health sector have a great social and environmental impact, and involve a large amount of waste for disposal in landfills [59] and high consumption of materials and energy [60]. Hospitals, as institutions that play an important role in the health system, have an impact on the social, economic and environmental issues of healthcare and health promotion [60]. Consequently, SR and the application of its three dimensions influence hospital policy and strategic plans, as well as business communication and dissemination, to reach the maximum number of individuals and groups [61].
Finally, trying to observe the link with the two theories of our study, there are regulations that reflect a clear relationship between business communication on economic and financial results. Specifically, according to Directive 2014/95/EU of the European Parliament and of the Council, the disclosure of non-financial or CSR-related information by organizations, together with financial information, must be reported in an integrated way, according to the recommendations of the “Conceptual Framework for the preparation of the Integrated Report” of the International Integrated Reporting Council (IIRC) and the National Securities Market Commission (CNMV) to make financial and non-financial management information visible. Its communication is mandatory in the Public Interest Entities (EIP); therefore, in the case of hospitals, the communication and transparency of financial and non-financial results is an inescapable commitment [62,63,64]. In the case of hospitals, when a good reputation is enjoyed, economic results improve and are maintained, due to the satisfaction of interest groups and the attraction of talented professionals; these competitive advantages of the hospital are fundamental assets with a clear economic translation [13]. On the other hand, evaluating the economic–financial results, transparency, and corporate social responsibility, allows evaluation of the reputation of hospitals [13,14]. Both theories are very suitable and perfectly support the framework proposed in this study.
For hospital management to be optimal, it is not enough that all these aspects are implemented individually: the three actions must complement each other and interact [39]. Numerous studies [40,65,66] separately analyse the financial statements, communication and SR of hospital companies. However, there is no research that also examines the relationship between these three concepts. This is precisely the novelty of this study. The conceptual model is shown below (Figure 1).
Thus, the causal relationships between SR and two strategic variables of the company are studied: communication and economic and financial results

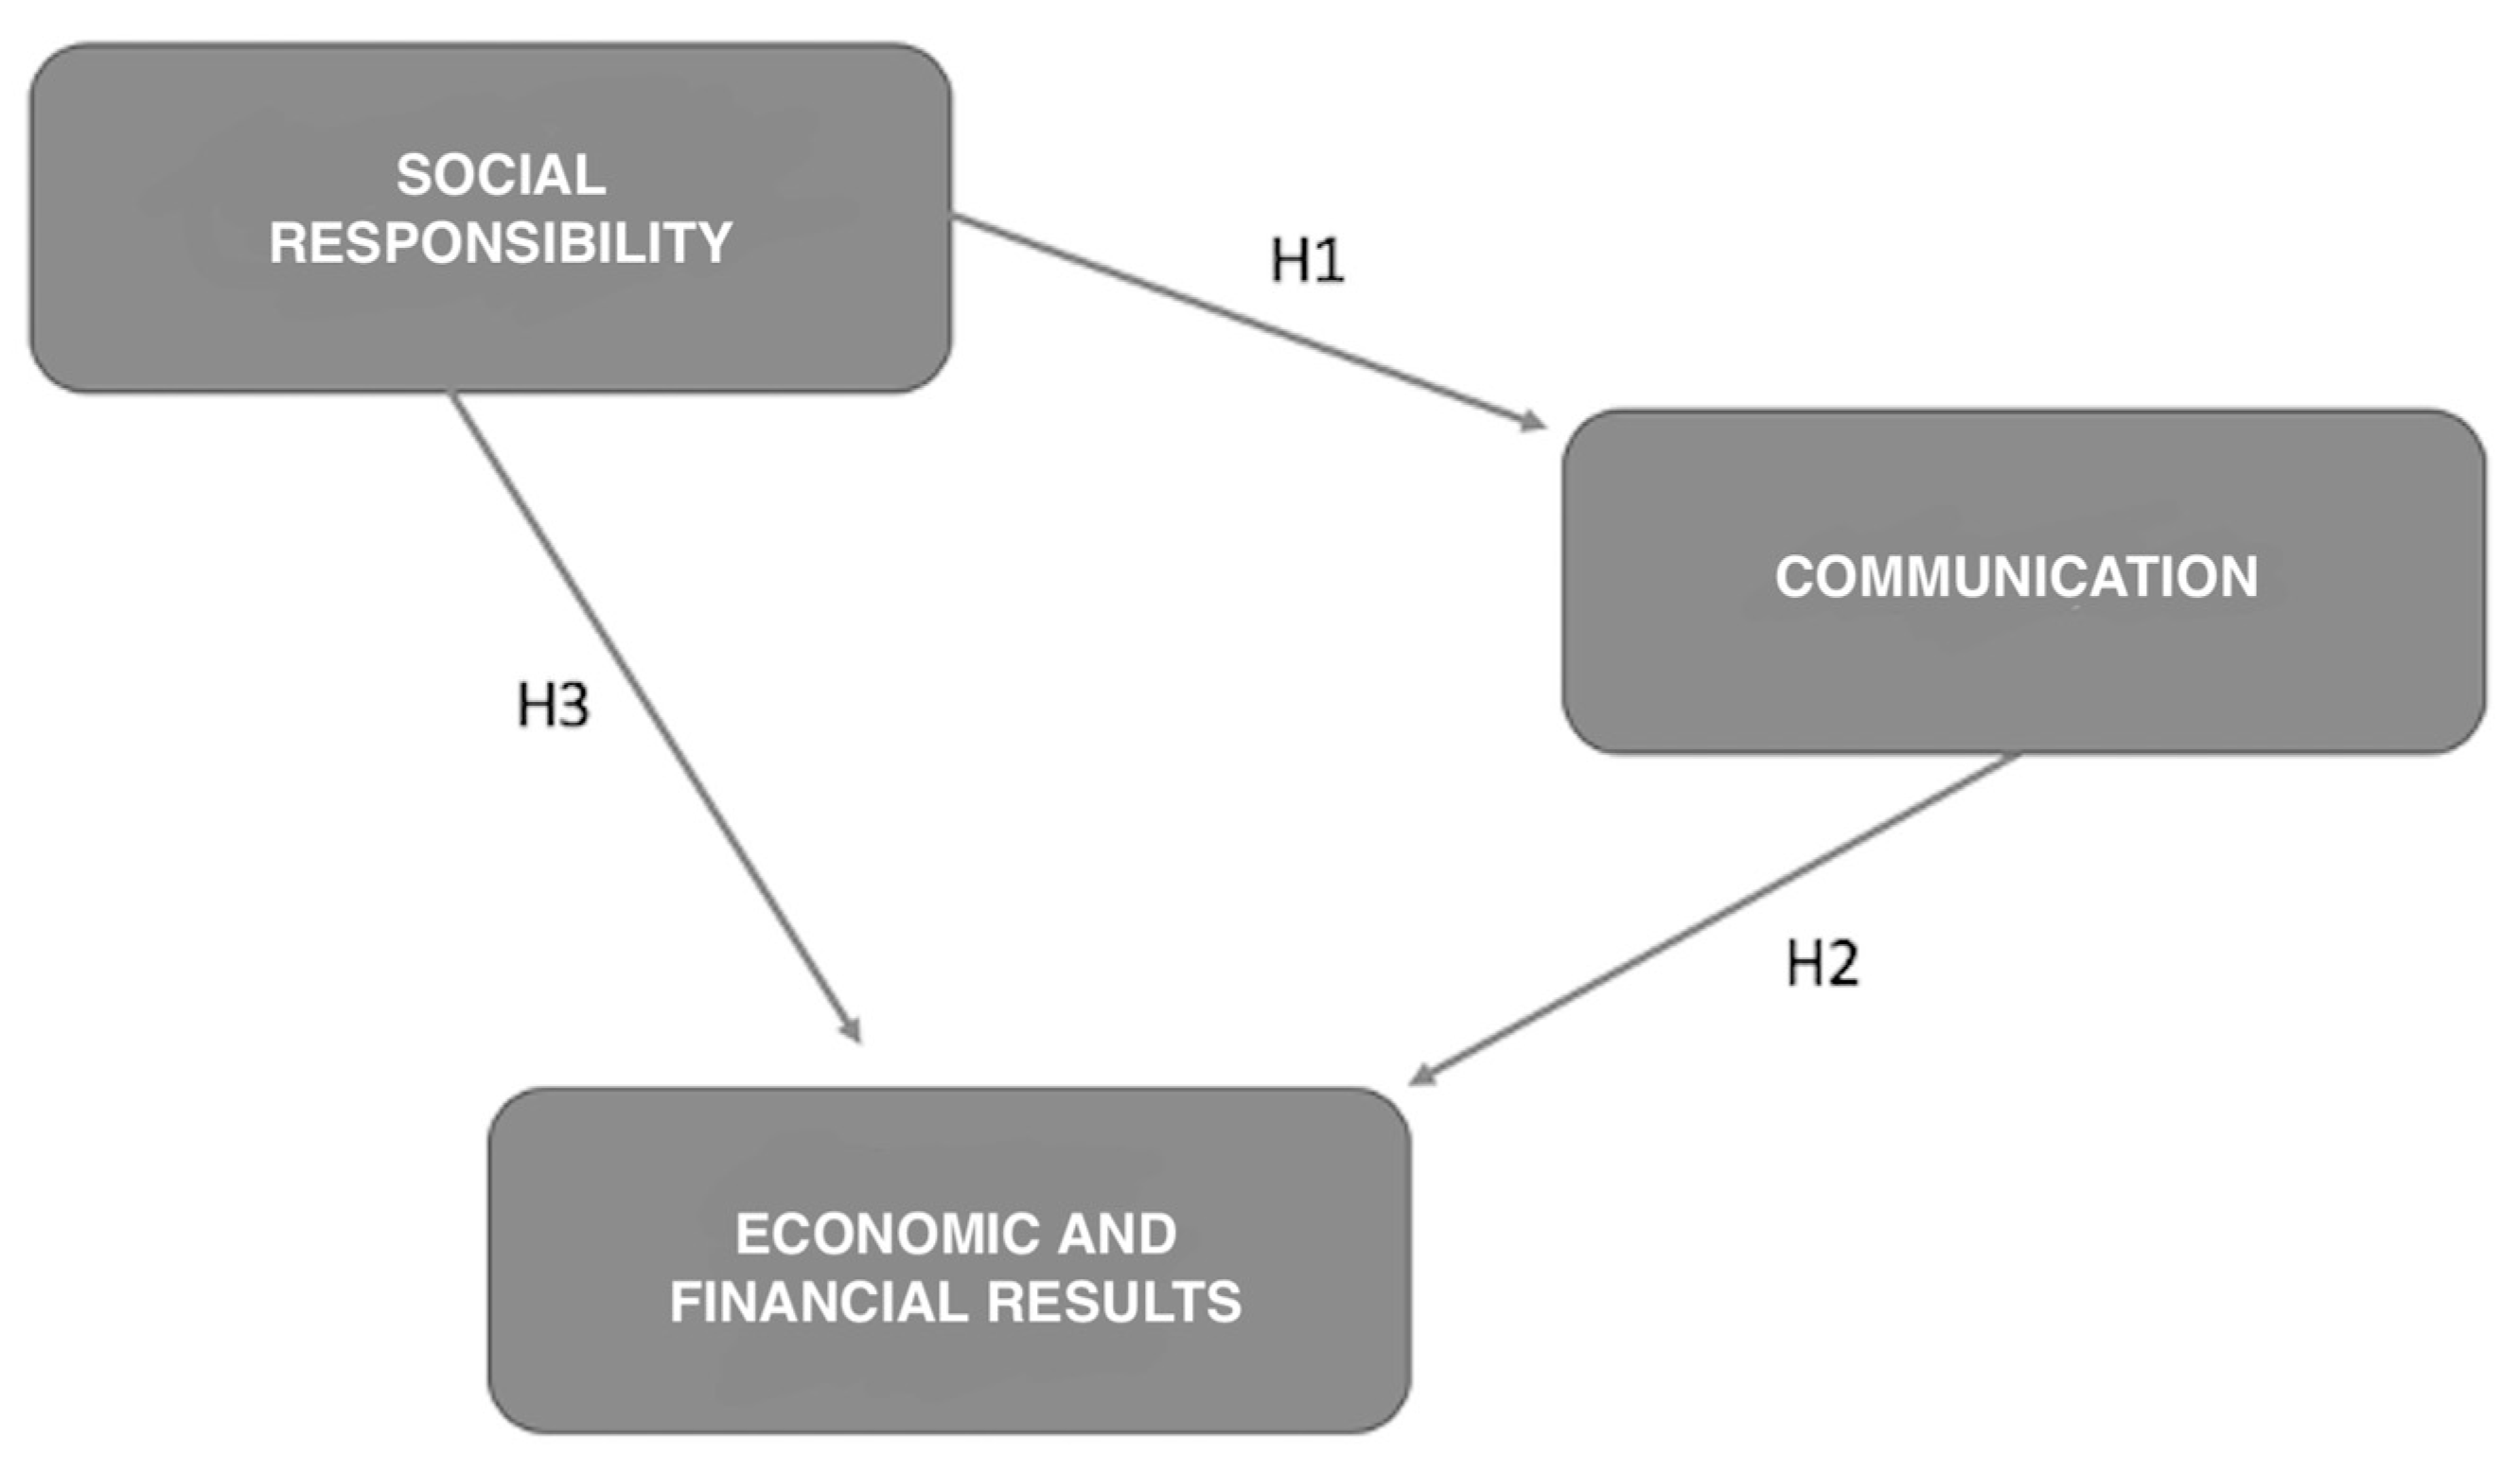
3. Development and Justification of Hypothesis

3.1. The Effect of Social Responsibility on Business Communication

Several authors affirm that it is not enough to perform SR actions: they must be communicated effectively, internally and externally, to the company’s stakeholders [67,68]. As stated by [67], organisations that promote SR initiatives will have greater power to communicate them and thus evoke positive reactions among stakeholders.
The internet has become a powerful instrument for business communication. Many companies have corporate websites that are completely dedicated to reporting their SR practices [69,70]. The corporate website is one of the fundamental tools for disseminating the company’s SR policies, mission and results. Transparency and the web communication of health organizations’ SR indicators is vital. Health organisations attach increasing importance to web communication to reach users and enhance transparency, in accordance with appropriate SR policy [68,71,72]. Hence, communication plays a fundamental role in SR practice and is not simply a mechanism for transmitting SR objectives, intentions or activities. It is based on a continuous process of exploration, construction, negotiation and modification between stakeholders [69,70,71,72,73]. Given these arguments, the first hypothesis of the study is:
Hypothesis 1 (H1).
A greater predisposition towards social responsibility actions by hospitals explains the increase in communication practices undertaken by them.

3.2. The Effect of Business Communication on Economic and Financial Results

The academic literature has not yet confirmed the influence of business communication and marketing on economic and financial results. Studies like those of Morales and Jarne [74] and Marston [75] found a positive relationship between communication and marketing and financial data. In addition, the study by Morales and Jarne [74] indicated that companies with the highest rates of disclosure and communication, especially regarding accountability and transparency, are those that obtain the best economic and financial results. More specifically, the study by Lee [76] shows that one of the variables that influences hospital profitability is communication and business marketing.
The disclosure of financial information has evolved, along with the concept of SR and the associated legislation [77]. Reporting of financial information only generates the desired results if it is disclosed to stakeholders along with non-financial information [78]. Therefore, the financial information that is now mandatory in most companies is not sufficient to satisfy the needs of stakeholders or shareholders [79,80]. Thus, to establish better communication with their stakeholders, companies must, generally voluntarily, communicate SR activities as well as financial data [28,77,81]. Hence, the second hypothesis of the study is:
Hypothesis 2 (H2).
The good communication practices implemented by hospitals explain the better economic and financial results that they achieve.

3.3. The Effect of Social Responsibility on Economic and Financial Results

Examinations of the relationship between SR and financial returns have produced controversial results. Some researchers argue that there should be a positive relationship between the disclosure of a company’s SR results and its financial data, because informing and improving SR disclosure can enhance a company’s reputation, which attracts stakeholders [66,82,83,84]. In contrast, another group of researchers argue that when companies make an effort and allocate resources to improving SR performance, operating costs and the price of the product should increase. Therefore, the impact on the product market and the stock market is negative [85,86].
In a study by Chen et al. [87], it was affirmed that profitable companies may have additional resources to report and improve corporate social performance. In addition, the publicity and improvement in SR can provide a significant competitive advantage for these companies, and therefore, complement their economic objectives in the short term. In addition, Braam et al. [88] concluded that companies with greater efficiency and competitive capacity, measured in terms of profitability and sales growth, are those with the best SR practices or actions.
In recent years, the importance of disclosure of financial and non-financial indicators has become evident, especially in companies of economic interest, which is already mandatory. To determine a good relationship between these two types of indicators, it is relevant that the indicators are considered of quality and are referenced in the academic literature [89,90,91]. In addition, it must be taken into account that the analysed hospitals—although they are not entities of economic interest and are not obliged to disclose financial information—there are many publications referring to Spain that indicate that non-financial information has extensive monitoring [92,93]. Finally, non-financial indicators, specifically RS, create added value for hospital companies, replacing the old profit maximization objective [94]. This leads to the third hypothesis:
Hypothesis 3 (H3).
A greater predisposition towards social responsibility actions by hospitals explains the improvement in the economic and financial results that they achieve.

4. Materials and Methods

4.1. Structural Equations Models

The methodology of structural equations models (SEM), which is considered appropriate in the field of business management research, was used to answer the research question and relate the three main research variables. Statistical software developed by Ringle et al. [95] was used to develop the SEMs. It consists of component-based analysis or partial least squares (PLS) and is called SmartPLS. Thus, the causal relationships between SR and two strategic company variables, communication and economic and financial results, were examined.

4.2. Population and Sample Selection

To carry out the research, a sample of companies selected at the end of 2019 was worked through the SABI database. The period considered was 2018, as this was the last year with unconsolidated financial statements available in this database. Active companies that undertake hospital activities were considered (Table 1).
After eliminating extreme values and outliers, the final sample included 122 companies from the 393 companies in the population. This sample is representative since, considering operating income, it accounts for 83% of the total population.
The Roldan and Sánchez-Franco table [96] was used to determine the sample size. Figure 1 shows a model with three latent variables and three relationships between latent variables. Therefore, if an average effect size is assumed, as defined by Cohen [97], and to obtain a power of 0.80 and an alpha level of 0.05, a minimum sample of 76 cases is required. Following this rule, with the sample of 122 companies, the minimum number of cases required to estimate the proposed model is also met [98].

4.3. Creation and Measurement of Variables

None of the three defined constructs are directly observable, so to approximate their values, scales of measurement formed by several indicators were drawn up. Table 2 shows the selected indicators for each construct, as well as the source and the authors who have used them. All indicators were searched for in the corresponding sources from January 2019 to March 2019. The indicators that are marked in bold are those that were finally accepted in the model, that is, those that were validated for the different scales of the constructs.
The Social Responsibility indicators used are recognized by the regulations transposed from Directive 2014/95/EU to the Spanish legal system according to Royal Decree-Law 18/2017 of non-financial information or CSR; they are also in tune with international standards and with the indications of the GRI and the Integrated Reporting (IR). Furthermore, hospital companies analysed as public interest companies must follow this transposed regulation. Moreover, the existing literature establishes which SR indicators should be considered in hospitals.
Firstly, it is important to determine if these companies have accreditations, certifications or quality awards reported on their web pages. Accreditations are related to the ability of a hospital to follow best practices in administrative care and management using quality management tools. Organizations have different management system standards to meet their needs and those of stakeholders. Certifications issued by the International Organization for Standardization (ISO) are widely used in the health system [66,99]. For its part, the Social Responsibility Disclosure Index was also included as an indicator. This index provides a numerical value to each hospital depending on the information available on SR on its web pages [100].
To calculate the SR4, SR5 and SR6 indicators, the existence of the characteristics detailed in Table 3 was verified on the website. Each of the three indicators is comprised of ten characteristics or items that must be carried out. These characteristics have been determined based on the items that must appear in the sustainability reports. The most widely used sustainability report model is the one proposed by the Global Reporting Initiative (GRI). This guide provides many indicators and is used by thousands of public and private institutions around the world, as it focuses on the internationalization of social norms, public information, and transparency [50,104]. In this case, each item behaves as a dichotomous variable and is given the value 1 when it is satisfied or 0 if it is not.
To determine the indicators of C, the recent literature establishes what variables should be considered in the disclosure of data through hospital websites. In this way, the authors determine that a hospital develops good web communication whenever it is present on social networks, has web quality, has a large number of visits on its website and has a good appearance in the main web search engines [101,102,103].
Finally, as financial indicators, the economic and financial data that are most used for analysis in the business field have been taken into account, among which solvency, indebtedness and profitability stand out. To calculate these indicators, the economic and financial data have been consulted in the SABI database and the calculation of the appropriate ratios has been carried out [50,54,76,101].

5. Results

5.1. Global Model Fit Assessment

In order to evaluate the model, we proceed to analyse its overall adjustment [100]. The analysis of the model’s goodness of fit implies the study of some adjustment tests available for PLS after a bootstrapping technique was applied [106,107]. First, the standardized root means square test (SRMR), which can have a maximum recommended value of 0.08, according to Henseler et al. [108]; second, the unweighted least squares discrepancy (d_ULS) and geodetic discrepancy (d_G) tests [106]; third, the correlation of the root means square residual covariance (RMStheta), which must have values extremely close to 0 and less than 0.12 according to Henseler, Hubona and Ray [106] and Henseler, Ringle and Sarstedt [109].
In this study, SRMR index’s value was 0.067, lower than the maximum recommended. The adjustment tests d_ULS and d_G gave values of 1.211 and 0.428, respectively, lower than the 95th percentile, which show that the existing discrepancy is non-significant. Finally, the RMStheta produced a value of 0.107 [106], which is close to zero and within the allowed limit. At this moment, and in view of the results obtained, we can confirm that the model’s general goodness of fit is satisfactory.

5.2. Measurement Model Evaluation

In reflective measurement models, as in this study, the model must be evaluated in relation to its internal consistency or reliability of the scales [110]. Individual reliability is evaluated by examining the loads of each item (λ) and the loadings or correlations of each indicator with its construct. Once the model has been refined, the set of indicators is obtained with the appropriate loads to continue, which are shown in Table 4. It can be seen that all the loads of the indicators exceed the criterion of being greater than 0.707 and that, under no circumstances, are loads below 0.5, as stated by Chin and Dibbern [111]. In addition, a total of 14 indicators has been retained from the initial 20.
The recommendations of Vadenberg and Lance [112] are used to interpret the composite reliability values of the constructs. According to these authors, values above 0.8 for this indicator are considered sufficient when the research is still incipient and exploratory. As can be seen in Table 4, all model constructs have values of composite reliability greater than 0.8, specifically 0.935 for SR, 0.804 for communication and 0.932 for financial data, and values of Cronbach’s Alpha greater than 0.8, specifically 0.889 for SR, 0.804 for communication and 0.876 for economic and financial results. These values confirm the internal consistency of the constructs.
The average variance extracted (AVE) indicates the average amount of variance explained by each indicator. Hair et al. [110] recommend that AVE values should be greater than 0.50, which means that more than 50% of the variance of the construct is due to its indicators. The AVE values in this study range between 0.523 and 0.704, and are 0.523 for communication, 0.704 for SR and 0.643 for the economic and financial results. These are satisfactory values, so the convergent validity of the constructs of the model is given as satisfactory (Table 4).
Finally, the discriminant validity of the model constructs was verified by analysing both Fornell and Larcker’s criterion [36] and the heterotrait-monotrait (HTMT) ratio. First, as we can observe in Table 5, all the model’s constructs meet the conditions established [109,113] (0.723 > 0.462 and 0.632; 0.821 > 0.415 and 0.462; 0.833 > 0.632 and 0.415). Second, the HTMT ratio was compared with a predefined threshold of 0.85 [114]. Based on these criteria, all constructs accomplish the discriminant validity criteria. Therefore, the results confirm that all the constructs under study meet the established criteria (see Table 5).

5.3. Structural Model Evaluation

Once the measurement model has been accepted as satisfactory, the structural model must be correctly interpreted to verify whether it considers the relationships between the latent variables indicated by the theory [115,116].
The evaluation of the structural model assumes finally the verification of the hypotheses between the latent variables. First, it will be necessary to analyse whether the model’s path coefficients (β) have values greater than 0.2 and ideally greater than 0.3 [117] (see Table 6).
Later, an analysis of the path’s significance verifies whether there is empirical support to corroborate the set of hypotheses formulated in the study. If the β are found to be significant, the research hypotheses can be supported. To perform this analysis, a bootstrap test of 10,000 subsamples is generated, and a Student’s t-distribution of a tail with (n − 1) degrees of freedom is used, where n is the number of subsamples [110]. Table 6 shows the results that can be considered satisfactory; all the structural paths in the model are significant, although with different levels of significance, so all the model hypotheses are supported. Thus, SR contributes to C and EFR; C contributes to EFR. The results were found to have positive and significant effects, with the following values: H1, β values of 0.221, H2 β values of 0.453 and H3 β values of 0.288, respectively.
Finally, the fundamental objective of the SEMs is prediction. According to Chin [118], the predictive power of the structural model is evaluated by the R2 values of the dependent constructs. The values of R2 were calculated for the dependent constructs included in the structural model. Following Falk and Miller [119], all dependent constructs show appropriate R2 values that exceed the established minimum value of 0.1. Specifically, the values were 0.254 for communication and 0.314 for economic and financial results. In addition, R2 values lead to the following interpretation: both constructs, communication and economic and financial results, present a moderate level of explanation, at 25.4% and 31.4%, respectively. The exact contribution of the predictive constructs on the explained variance R2 of each of the endogenous constructs of the model is given by the absolute value of multiplying the path coefficient (between two constructs) by the value of the correlation existing between said constructs [119]. Moreover, the f2 value measures the size of effects introduced in the model. The f2 values of 0.02, 0.15, and 0.35 indicate a weak, medium, and large effect, respectively [120]. This model’s relationships have values of 0.070 and 0.095. These results show that our model has adequate structural properties and good explanatory power. In addition, according to Chin [118], in this study, it can be affirmed that the prediction of the constructs is relevant because positive Stone–Geisser Q2 index values were obtained, once a blindfolding procedure was applied—0.087 for communication and 0.215 for economic and financial results, both greater than 0. This way, the model has significant predictive capacity [117,118].

5.4. Simple Mediation Analysis

In order to investigate the mediating effect of communication in the relationship between social responsibility and economic and financial results, we have carried out a test of simple mediation. It would indicate a direct causal relationship between social responsibility and economic and financial results, meaning that a good set of SR practices is necessary for superior economic and financial results. Moreover, we will observe that the relationship between SR and economic and financial results changes as a consequence of the communication. To this end, the causal effect of the variable SR can be divided into two: (i) an indirect effect of SR on economic and financial results through communications (a × b), and (ii) a direct effect on economic and financial results (c’).
We have to demonstrate the existence of a direct effect of SR on economic and financial results [121]. Moreover, following [122], in order to test the mediation, two steps were conducted: (i) the indirect effects (a × b) were determined through a bootstrapping technique with 5000 samples [118,123], and (ii) the type of effect and the magnitude of the indirect effects in relation to the total effect were determined. The mediation hypotheses developed for the mediation effects are: H1: SR has a positive and direct effect on EFR of hospitals (c’) and H2: The relationship between SR and EFR is positively mediated by the C. The significance or insignificance of the indirect and direct effects determines the type of mediation between the variables [124]. The results of the mediation analysis indicate that SR has a positive and significant direct effect on EFR (H1: c’), according to the value of 0.259sig (Table 7). Moreover, H2 has been confirmed. Based on these results, we can conclude that C has a mediating effect between SR construct and EFR (H2: a × b). The result of the indirect effect is 0.214sig and a total effect of 0.538sig (Table 7). Finally, we assessed the Variance Accounted For (VAF) = (a × b)/ (c’ + a × b). As VAF is slightly over 20% (Table 7), it means that the direct effect SR-EFR exists and it expresses a partial mediation [125] between SR and economic and financial results by means of communication.

6. Discussion

The model was empirically tested, using a sample of 122 Spanish hospital companies. The SEM was estimated using consistent partial least squares (PLS). The selected variables accomplish the consistency requirements of the measurement model and the data support the hypotheses at different levels of robustness. The results show that all the structural routes in the model are significant, at a significance level of 5%, with compatible model hypotheses. The positive signs of the ß coefficients of the different relationships in the model reveal the expected behaviour. Specifically, good communication explains up to 21.22% of the economic and financial results of hospital entities, and the social responsibility variable explains 14.95% of the economic and financial results, and 7.85% of business communication.
In view of the results obtained, the hypotheses are verified in the environment of hospitals, so the model predicts that: (i) More SR policies in hospital companies encourage better business communication; (ii) Good business communication has a positive impact on the economic and financial results of hospital companies; (iii) The implementation of SR actions is beneficial at economic and financial level for hospitals.
Previous information reveals that all hypotheses were validated in this study, which demonstrates that SR is a significant determinant in improving business communication and economic and financial results. The current results confirm that companies that develop SR initiatives offer the best conditions to achieve better financial performance and guarantee that relations with stakeholders are better due to the impact they have on business disclosure. Thus, the study corroborates that the exercise of SR can influence the communication and dissemination of hospitals, which Bradley and Botchway [67] and Langstaff and Brzozowski [68] confirm. This should motivate managers of hospitals to focus on responsible management and to communicate it effectively, internally and externally, to stakeholders, to obtain positive reactions between them, as suggested by Langstaff and Brzozowski [68] and Singh et al. [72].
In addition, the second hypothesis was validated, since good business communication practices applied by hospitals can strengthen the economic and financial results they obtain, which is in line with the findings of Morales and Jarne [74] and Marston [75]. This shows that the companies with the highest rates of communication of their results and their SR activities are those that end up obtaining the best economic and financial data. Therefore, it is essential that for good business management and for a good relationship with stakeholders, hospitals continuously communicate their economic and financial activities and their SR. This coincides with the conclusions of Gonçalves et al. [28], Akmese et al. [77] and Lock and Seele [81].
The current SR model includes the identification and definition of intangibles that are linked to the external operations of companies (for example, customers, suppliers, communities, financial institutions and public administrations), which adds to the importance of the strategies of SR. In addition, the results confirm that SR directly and positively influences the economic and financial results of hospital organisations. This result is consistent with previous research, such as that of Akisik and Gal [82], Conesa et al. [66] and Wang et al. [83].
The idea proposed by Chen et al. [87] is clearly corroborated. In this idea, the actions of advertising, marketing and improvement in SR can provide a significant competitive advantage for these companies and, therefore, complement and exceed their economic objectives. Obviously, compliance with support theories is ensured, stakeholders are supported by the policies followed by hospital companies and the management of resources is adequate.

7. Conclusions

This research supports the literature on SR and financial indicators by providing a more holistic view of the implications of SR in efficient hospital management. The main objective of this study has been to determine the possible relationship between three important aspects in the management of hospital companies: social responsibility, communication, and economic and financial results. To this end, we have, based on stakeholder and dynamic capabilities theories, defined a conceptual model, proposing that a greater predisposition to social responsibility actions by hospitals could explain communication practices and economic and financial results. The fulfilment of the three hypotheses validates the model and satisfies the relationships proposed; at the same time, it corroborates the suitability of the theories applied in this study.
The research includes the selection of a set of indicators that link SR, communication and economic and financial indicators with clear results. More specifically, of the initial 20 indicators, 14 were validated. SR validates the SR1, SR3, SR4, SR5 and SR6 flags—five of the initial six. Communication validates indicators C1, C2, C3 and C4—four of the initial six. Finally, economic and financial results validate the indicators EFR1, EFR2, EFR4, EFR5 and EFR8—five of the initial eight. Furthermore, the proposed model accepts and validates a broad set of indicators, which adds strength and solidity to the study. In this process of filtering and selecting indicators of each of the variables, we can also conclude that the theories of stakeholders and dynamic capabilities have been validly applied and managed.
These results support the idea that balanced management between SR, financial indicators and communication allows companies to operate in a more socially responsible way and guarantee long-term sustainability. Furthermore, the dissemination of SR helps to ensure that all three dimensions reach stakeholders effectively and that SR generates better economic and financial results in hospital entities, managing better dynamic capabilities.
Regarding the theoretical framework and the empirical study, a clear relationship between financial statements, communication and social responsibility of Spanish hospital companies is evident. Research and academic literature endorse the interaction of financial indicators, communication and social responsibility in the proper management of hospital entities [43]. These results verify the hypotheses raised in the hospital companies under study, therefore, SR policies in hospital companies promote better business communication. In addition, its communication has a positive impact on the economic and financial level, and the RS actions of hospital companies improve economic and financial indicators. Therefore, the research confirms that good hospital management must include the timely analysis of the financial statements, transparent communication, and clear SR actions in hospital companies.
In addition, the main contribution of the research is the predictive model, which has robust relationships between the actions of social responsibility undertaken by hospital companies with their communication and with the economic and financial indicators of the analysis of financial statements of hospital companies.
The structural model of the investigation presents a correct operation, with significant values regarding the relationships between SR, communication and financial indicators derived from the analysis of financial statements. Therefore, the model endorses the clear relationship between Social Responsibility, transparent communication and the economic and financial results of hospitals, in line with existing regulations, such as Directive 2014/95/EU transposed into the Spanish legal system, and the academic literature that this relationship corroborates [13,14]. The research also supports the relationship between the economic value and the social value of hospitals and their timely communication to foster relationships with stakeholders, essential in the efficient management of the hospital environment [6].
In terms of academic and management implications, the results provide the basis for a theoretical understanding of the important relationship between SR activities, transparent corporate communication, and the economic and financial results of hospital organizations. In addition, certain measurement indicators used can contribute to the efficiency of hospital management. Regarding management implications, the results can inspire new management strategies to improve relationships with stakeholders and shareholders. Managers must assess what initiatives—socially responsible—should be implemented with timely communication to obtain better results.
A limitation of the study corresponds to the number of observations used and the period of time in which the observations were collected, since some observations come from web pages that are updated relatively frequently. According to Conesa et al. [66], the analysis of the websites of hospital companies is limited in terms of temporal validity, since they are updated in short periods of time. This research responds to a specific moment in time and controlling the quality of hospital web information is difficult due to the numerous subjective variables involved, and accessing certain content on websites is difficult due to the lack of standardization in the place of location.
In future investigations, more observations will be contemplated to improve the definition of the constructs, with periods of time that include several observations on the web pages in the period under study. The new observations will contemplate monetized indicators of the social value and emotional value of hospitals, in line with previous research [6], and will be extended to public hospitals of great interest to society.

Author Contributions

Conceptualization, J.C.-T., D.G.-V. and N.A.-S.; Data curation, J.C.-T.; Formal analysis, J.C.-T.; Investigation, J.C.-T., D.G.-V. and N.A.-S.; Methodology, J.C.-T., D.G.-V. and N.A.-S.; Project administration, J.C.-T., D.G.-V. and N.A.-S.; Supervision, J.C.-T., D.G.-V. and N.A.-S.; Validation, J.C.-T., D.G.-V. and N.A.S.; Visualization, J.C.-T., D.G.-V. and N.A.-S.; Writing—review and editing, J.C.-T., D.G.-V. and N.A.-S. All authors have read and agreed to the published version of the manuscript.

Funding

This research received no external funding.

Conflicts of Interest

The authors declare no conflict of interest.

References

  1. Hossain, M.S.; Yahya, S.B.; Rahman, S.; Sobhani, F.A.; Rahman, R. Corporate Social Responsibility in Healthcare: A case of Islamic Banks (IBs) in Bangladesh. Bangladesh J. Med. Sci. 2019, 18, 567–573. [Google Scholar] [CrossRef] [Green Version]
  2. Desai, P.S.; Chandawarkar, M.R. Aligning CSR activities of health care sector to developmental needs of India. J. Pharm. Sci. Res. 2016, 8, 1008. [Google Scholar]
  3. Institute for Health Development and Integration. Sanidad Privada, Aportando Valor. Análisis de Situación; IDIS: Madrid, Spain, 2018. [Google Scholar]
  4. Martín, J.J. El sistema nacional de salud español ante la gran recesión. Cuad. Relac. Labor. 2016, 34, 315–334. [Google Scholar]
  5. Martínez, A.; Smith, K.; Llop-Gironés, A.; Vergara, M.; Benach, J. La mercantilización de la sanidad: El caso de Catalunya. Cuad. Relac. Labor. 2016, 34, 335–355. [Google Scholar]
  6. San-Jose, L.; Retolaza, J.L.; Bernal, R. Índice de valor social añadido: Una propuesta para analizar la eficiencia hospitalaria. Gac. Sanit. 2019, in press. [Google Scholar] [CrossRef] [PubMed]
  7. Sánchez, J.P.; Yañez-Araque, B.; Moreno-García, J. Moderating effect of firm size on the influence of corporate social responsibility in the economic performance of micro-small-and medium-sized enterprises. Technol. Forecast. Soc. Chang. 2020, 151, 119774. [Google Scholar] [CrossRef]
  8. Jamali, D.; Hallal, M.; Abdallah, H. Corporate governance and corporate social responsibility: Evidence from the healthcare sector. Corp. Gov. 2010, 10, 590–602. [Google Scholar] [CrossRef] [Green Version]
  9. Limbu, Y.B.; Long, P.; Manveer, M. Corporate social responsibility and hospital brand advocacy. Int. J. Pharm. Healthc. Mark. 2019, 14, 159–174. [Google Scholar] [CrossRef]
  10. Lubis, A.N. Corporate social responsibility in health sector: A case study in the government hospitals in Medan, Indonesia. Bus. Theor. Pract. 2018, 19, 25–36. [Google Scholar] [CrossRef]
  11. Takahashi, T.; Ellen, M.; Brown, A. Corporate social responsibility and hospitals: US theory, Japanese experiences, and lessons for other countries. Healthc. Manag. For. 2013, 26, 176–183. [Google Scholar] [CrossRef]
  12. Hansen, S.D.; Dunford, B.B.; Boss, A.D.; Boss, R.W.; Angermeier, I. Corporate social responsibility and the benefits of employee trust: A cross-disciplinary perspective. J. Bus. Ethics 2011, 102, 29–45. [Google Scholar] [CrossRef]
  13. Navarro, I.M.; Mira, J.J.; Lorenzo, S. Desarrollo y validación de un cuestionario para medir la reputación de los hospitales. Gac. Sanit. 2012, 26, 444–449. [Google Scholar] [CrossRef] [PubMed] [Green Version]
  14. Eiras, C.E.; Rubio, V.O. Incentivos financieros en la mejora de la calidad asistencial. Informe SESPAS 2012. Gac. Sanit. 2012, 26, 102–106. [Google Scholar] [CrossRef] [PubMed] [Green Version]
  15. Retolaza, J.L.; San-Jose, L.; Ruíz-Roqueñi, M. Social Accounting for Sustainability: Monetizing the Social Value; Springer: Cham, Switzerland, 2016. [Google Scholar]
  16. Freeman, R.E. A Stakeholder Theory of the Modern Corporation; Pincus, L.B., Ed.; Perspectives in Business, Ethics; McGraw-Hill: Singapore, 1998; pp. 171–181. [Google Scholar]
  17. Kiessling, T.; Isaksson, L.; Yasar, B. Market orientation and CSR: Performance implications. J. Bus. Ethics 2016, 137, 269–284. [Google Scholar] [CrossRef]
  18. Martínez-Ferrero, J. Consecuencias de las prácticas de sostenibilidad en el coste de capital y en la reputación corporativa. Span. Account. Rev. 2014, 17, 153–162. [Google Scholar] [CrossRef] [Green Version]
  19. Asher, C.; Mahoney, J.M.; Mahoney, J.T. Towards a property rights foundation for a stakeholder theory of the firm. J. Manag. Gov. 2005, 9, 5–32. [Google Scholar] [CrossRef]
  20. Fassin, Y.; de Colle, S.; Freeman, R.E. Intra-stakeholder alliances in plant-closing decisions: A stakeholder theory approach. Bus. Ethics Eur. Rev. 2016, 26, 97–111. [Google Scholar] [CrossRef]
  21. Walsh, J. Taking stock of stakeholder management. Acad. Manag. Rev. 2005, 30, 426–452. [Google Scholar] [CrossRef]
  22. Freeman, R.; Philips, R. Stakeholder theory: A libertarian defense. Bus. Ethics Q. 2002, 12, 331–349. [Google Scholar] [CrossRef]
  23. Martínez-Martínez, D.; Herrera Madueño, J.; Larrán Jorge, M.; Lechuga Sancho, M.P. The strategic nature of corporate social responsibility in SMEs: A multiple mediator analysis. Ind. Manag. Data Syst. 2017, 117, 2–31. [Google Scholar] [CrossRef]
  24. Richter, U.H.; Dow, K.E. Stakeholder theory: A deliberative perspective. Bus. Ethics Eur. Rev. 2017, 26, 428–442. [Google Scholar] [CrossRef]
  25. Rauf, F.; Voinea, C.L.; Azam, H.B.; Fratostiteanu, C. Moderating effect of polítical embeddedness on the relationship between resources base and quality of CSR diclosure in China. Sustainability 2020, 12, 3323. [Google Scholar] [CrossRef] [Green Version]
  26. Fernandez-Feijoo, B.; Romero, S.; Ruiz, S. Effect of stakeholders’ pressure on transparency of sustainability reports within the GRI framework. J. Bus. Ethics 2014, 122, 53–63. [Google Scholar] [CrossRef]
  27. Chiarini, A.; Opoku, A.; Vagnoni, E. Public healthcare practices and criteria for a sustainable procurement: A comparative study between UK and Italy. J. Clean. Prod. 2017, 162, 391–399. [Google Scholar] [CrossRef]
  28. Gonçalves, T.; Gaio, C.; Costa, E. Committed vs oportunistic corporate and social responsibility reporting. J. Bus. Res. 2020, in press. [Google Scholar]
  29. Pérez, A. Corporate reputation and CSR reporting to stakeholders: Gaps in the literature and future lines of research. Corp. Commun. Int. J. 2015, 20, 11–29. [Google Scholar] [CrossRef] [Green Version]
  30. Goergen, M.; Chahine, S.; Wood, G.; Brewster, C. Public listing, context and CSR: The effects of legal origin. J. Comp. Int. Manag. 2016, 19, 47–73. [Google Scholar]
  31. Becchetti, L.; Ciciretti, R.; Hasan, I.; Kobeissi, N. Corporate social responsibility and sharaholder’s value. J. Bus. Res. 2012, 65, 1628–1635. [Google Scholar] [CrossRef]
  32. Roca, L.C.; Searcy, C. An analysis of indicators disclosed in corporate sustainability reports. J. Clean. Prod 2012, 20, 103–118. [Google Scholar] [CrossRef]
  33. Kachouie, R.; Mavondo, F.; Sands, S. Dynamic marketing capabilities view on creating market change. Eur. J. Mark. 2018, 52, 1007–1036. [Google Scholar] [CrossRef]
  34. Teece, D.J. Explicating dynamic capabilities: The nature and microfoundations of (sustainable) enterprise performance. Strateg. Manag. J. 2007, 28, 1319–1350. [Google Scholar] [CrossRef] [Green Version]
  35. Sarkar, S.; Coelho, D.M.; Maroco, J. Strategic orientations, dynamic capabilities, and firm performance: An analysis for knowledge intensive business services. J. Knowl. Econ. 2016, 7, 1000–1020. [Google Scholar] [CrossRef]
  36. Bitencourt, C.C.; Santini, F.D.; Ladeira, W.; Santos, A.C.; Teixeira, E.K. The extended dynamic capabilities model: A meta-analysis. Eur. Manag. J. 2020, 38, 108–120. [Google Scholar] [CrossRef]
  37. Galbreath, J. Building corporate social responsibility into strategy. Eur. Bus. Rev. 2009, 21, 109–127. [Google Scholar] [CrossRef]
  38. Ramachandran, V. Strategic corporate social responsibility: A ‘dynamic capabilities’ perspective. Corp. Soc. Responsib. Environ. Manag. 2011, 18, 285–293. [Google Scholar] [CrossRef]
  39. Bernal-Conesa, J.A.; De Nieves-Nieto, C.; Briones-Penalver, A.J. CSR and technology companies: A study on its implementation, integration and effects on the competitiveness of companies. Int. Cap. 2016, 12, 1529–1590. [Google Scholar] [CrossRef] [Green Version]
  40. Sánchez, B.G.; Sampedro, E.L.; Conde, J.G. La evaluación del rendimiento en los hospitales públicos españoles: Una primera aproximación. Rev. Iberoam. Contab. Gestión 2009, 14, 1–11. [Google Scholar]
  41. Bem, A.; Predkiewicz, K.; Predkiewicz, P.; Ucieklak-Jez, P. Determinants of Hospital’s Financial Liquidity. Proc. Econ. Financ. 2014, 12, 27–36. [Google Scholar] [CrossRef] [Green Version]
  42. Benton, W. A Profitability Evaluation of America’s Best Hospitals, 2000–2008. Decis. Sci. 2013, 44, 1139–1153. [Google Scholar] [CrossRef]
  43. Retolaza, J.L.; San-Jose, L.; Ruiz-Roqueñi, M. Monetarizing the social value: Theory and evidence. CIRIEC 2015, 83, 43–62. [Google Scholar]
  44. Calvo, M.A. Herramientas para la participación ciudadana virtual y su desarrollo en las webs del Sistema Sanitario Público de Andalucía. Rev. Española Doc. Científica 2016, 39, 1–17. [Google Scholar] [CrossRef] [Green Version]
  45. Moreira, R.; Faria, P.; Alexandre, I.; Alturas, B. Qualidade dos sítios Web da Administraçao Pública Portuguesa. Rev. Ibérica Sist. Tecnol. Inf. 2016, 20, 78–98. [Google Scholar]
  46. Cerci, U.O. Social media use of hospitals in terms of communication and public relations. Turkish Online J. Des. Art Commun. 2017, 7, 192–202. [Google Scholar] [CrossRef]
  47. Manzano, J.A.; Simó, L.A.; Pérez, R.C. La responsabilidad social como creadora de valor de marca: El efecto moderador de la atribución de objetivos. Rev. Dir. Econ. Empresa 2013, 22, 21–28. [Google Scholar]
  48. Calvo, M.A. Calidad y características de los sitios web de los hospitales españoles de gran tamaño. Rev. Española Doc. Científica 2014, 37, e032. [Google Scholar] [CrossRef] [Green Version]
  49. García Lacalle, J.; Pina, V.; Royo, S. The unpromising quality and evolution of Spanish public hospital web sites. Online Inf. Rev. 2011, 35, 86–112. [Google Scholar] [CrossRef]
  50. AECA. Información Integrada: El Cuadro Integrado de Indicadores (CII-FESG) y su Taxonomía XBRL.; Asociación Española de Contabilidad y Administración de Empresas: Madrid, Spain, 2018. [Google Scholar]
  51. Nevado-Gil, M.T.; Gallardo-Vázquez, D. Información sobre Responsabilidad Social contenida en las páginas webs de los ayuntamientos. Estudio en la región del Alentejo. Rev. Española Doc. Científica 2016, 39, e150. [Google Scholar] [CrossRef] [Green Version]
  52. Russo, F. What is the CSR’s Focus in Healthcare? J. Bus. Ethics 2016, 134, 323–334. [Google Scholar] [CrossRef]
  53. Hinze, A.K.; Sump, F. Corporate social responsibility and financial analysts: A review of the literature. Sustain. Account. Manag. Policy J. 2019, 10, 183–207. [Google Scholar] [CrossRef]
  54. De Villiers, C.; Marques, A. Corporate social responsibility country-level predispositions, and the consequences of choosing a level of disclosures. Account. Bus. Res. 2016, 46, 167–195. [Google Scholar] [CrossRef] [Green Version]
  55. Servera-Francés, D.; Piqueras-Tomás, L. The effects of corporate social responsibility on consumer loyalty through consumer perceived value. Econ. Res. 2019, 32, 66–84. [Google Scholar]
  56. García, J.L.S.; Sanz, J.M.D. Climate change, ethics and sustainability: An innovative approach. J. Innov. Knowl. 2018, 3, 70–75. [Google Scholar] [CrossRef]
  57. Sapena, J.; Almenar, V.; Apetrei, A.; Escrivá, M.; Gil, M. Some reflections on poverty eradication, true development and sustainability within CST. J. Innov. Knowl. 2018, 3, 90–92. [Google Scholar] [CrossRef]
  58. Khalaf, A.M.; Alsharqi, O.Z.; Al-Borie, H.M.; Ashoor, M.M.; Al-Orige, A.S. Corporate Social Responsibility and Brand Image: An Empirical Investigation of Private Sector Hospitals in Saudi Arabia. Int. Bus. Res. 2016, 9, 91. [Google Scholar]
  59. Jarousse, L.A. Environmental sustainability programs for hospitals. Trustee 2012, 65, 22. [Google Scholar]
  60. Weisz, U.; Haas, W.; Pelikan, J.M.; Schmied, H. Sustainable hospitals: A socio-ecological approach. GAIA Ecol. Perspect. Sci. Soc. 2011, 20, 191–198. [Google Scholar] [CrossRef] [Green Version]
  61. Gillet-Monjarret, C. Assurance reports included in the CSR reports of French firms: A longitudinal study. Sustain. Account. Manag. Policy J. 2018, 9, 570–594. [Google Scholar] [CrossRef]
  62. Rivera-Arrubla, Y.A.; Zorio-Grima, A.; García-Benau, M.A. El concepto de informe integrado como innovación en reporting corporativo. J. Innov. Knowl. 2016, 1, 144–155. [Google Scholar] [CrossRef] [Green Version]
  63. Vitolla, F.; Raimo, N.; Rubino, M. Appreciations, criticisms, determinants, and effects of integrated reporting: A systematic literature review. Corp. Soc. Responsib. Environ. Manag. 2019, 26, 518–528. [Google Scholar] [CrossRef]
  64. García-Sánchez, I.M.; Martínez-Ferrero, J.; Garcia-Benau, M.A. Integrated reporting: The mediating role of the board of directors and investor protection on managerial discretion in munificent environments. Corp. Soc. Responsib. Environ. Manag. 2019, 26, 29–45. [Google Scholar] [CrossRef] [Green Version]
  65. Leela, V. Corporate social responsibility in hospitals: Need for transparent CSR initiatives for internal and external stakeholders. Int. J. Bus. Ethics Dev. Econ. 2014, 3, 1–11. [Google Scholar]
  66. Conesa, J.A.; De Nieves, C.; Briones, A.J. Aplicación de un modelo de ecuaciones estructurales para analizar los sistemas de gestión en la integración de la RSC y su influencia en la estrategia y el performance de las empresas tecnológicas. Rev. Met. Cuant. Econ. Emp. 2016, 21, 77–102. [Google Scholar]
  67. Bradley, O.J.; Botchway, G.O. Communicating corporate social responsibility (CSR) in the coffee industry: An examination of indicators disclosed. Sustain. Account. Manag. Policy J. 2018, 9, 139–164. [Google Scholar] [CrossRef]
  68. Langstaff, K.; Brzozowski, V. Managing environmental sustainability in a healthcare setting. Healthc. Manag. For. 2017, 30, 84–88. [Google Scholar] [CrossRef] [PubMed]
  69. Gómez, L.M.; Chalmeta, R. Corporate Responsibility in US corporate websites: A pilot study. Public Relat. Rev. 2011, 3, 93–95. [Google Scholar] [CrossRef]
  70. Tang, L.; Li, H. Corporate social responsibility communication of Chinese and global corporations in China. Public Relat. Rev. 2009, 35, 199–212. [Google Scholar] [CrossRef]
  71. Bai, X.; Chang, J. Corporate social responsibility and firm performance: The mediating role of marketing competence and the moderating role of market environment. Asia Pac. J. Manag. 2015, 32, 505–530. [Google Scholar] [CrossRef]
  72. Singh, R.K.; Murty, H.R.; Gupta, S.K.; Dikshit, A.K. An overview of sustainability assessment methodologies. Ecol. Indic. 2011, 15, 281–289. [Google Scholar] [CrossRef]
  73. Gómez, L.M. Me gusta o te sigo: Análisis de la comunicación de prácticas de Responsabilidad Social Corporativa a través de los medios sociales. Corresp. Análisis 2013, 3, 89–109. [Google Scholar] [CrossRef]
  74. Morales, F.; Jarne, J. E-gobierno corporativo: Evidencia en Chile sobre la divulgación de información en internet. Capic Rev. 2009, 7, 45–62. [Google Scholar]
  75. Marston, C. Financial reporting on the Internet by leading Japanese companies. Corp. Commun. 2003, 8, 23–34. [Google Scholar] [CrossRef]
  76. Lee, M. Financial Analysis of National University Hospitals in Korea. Osong Public Health Res. Perspect. 2015, 6, 310–317. [Google Scholar] [CrossRef] [PubMed] [Green Version]
  77. Akmese, H.; Cetin, H.; Akmese, K. Corporate social responsibility reporting: A comparative analysis of tourism and finance sectors of G8 countries. Proc. Econ. Fin. 2016, 39, 737–745. [Google Scholar] [CrossRef] [Green Version]
  78. Du, S.; Bhattacharya, C.B.; Sen, S. Maximizing business returns to corporate social responsibility (CSR): The role of CSR communication. Int. J. Manag. Rev. 2010, 12, 8–19. [Google Scholar] [CrossRef]
  79. Cohen, J.R.; Holder-Webb, L.L.; Nath, L.; Wood, D. Corporate reporting of nonfinancial leading indicators of economic performance and sustainability. Account. Horiz. 2012, 26, 65–90. [Google Scholar] [CrossRef]
  80. Morros, J. The integrated reporting: A presentation of the current state of art and aspects of integrated reporting that need further development. Int. Cap. 2016, 12, 336–356. [Google Scholar] [CrossRef] [Green Version]
  81. Lock, I.; Seele, P. The credibility of CSR (corporate social responsibility) reports in Europe. Evidence from a quantitative content analysis in 11 countries. J. Clean. Prod. 2016, 122, 186–200. [Google Scholar] [CrossRef] [Green Version]
  82. Akisik, O.; Gal, G. The impact of corporate social responsibility and internal controls on stakeholders’ view of the firm and financial performance. Sustain. Account. Manag. Policy J. 2017, 8, 246–280. [Google Scholar] [CrossRef]
  83. Wang, D.H.; Chen, P.H.; Yu, T.H.; Hsiao, C.Y. The effects of corporate social responsibility on brand equity and firm performance. J. Bus. Res. 2015, 68, 2232–2236. [Google Scholar] [CrossRef]
  84. Lo, S.F. Performance evaluation for sustainable business: A profitability and marketability framework. Corp. Soc. Responsib. Environ. Manag. 2010, 17, 311–319. [Google Scholar] [CrossRef]
  85. Brammer, S.; Millington, A. Does it pay to be different? An analysis of the relationship between corporate social and financial performance. Strateg. Manag. J. 2008, 29, 1325–1343. [Google Scholar] [CrossRef]
  86. Tang, Z.; Hull, C.E.; Rothenberg, S. How corporate social responsibility engagement strategy moderates the CSR-financial performance relationship. J. Manag. Stud. 2012, 49, 1274–1303. [Google Scholar] [CrossRef]
  87. Chen, L.; Feldmann, A.; Tang, O. The relationship between disclosures of corporate social performance and financial performance: Evidences from GRI reports in manufacturing industry. Int. J. Prod. Econ. 2015, 170, 445–456. [Google Scholar] [CrossRef]
  88. Braam, G.J.; De Weerd, L.U.; Hauck, M.; Huijbregts, M.A. Determinants of corporate environmental reporting: The importance of environmental performance and assurance. J. Clean. Prod. 2016, 129, 724–734. [Google Scholar] [CrossRef]
  89. Mion, G.; Loza Adaui, C.R. Mandatory Nonfinancial Disclosure and Its Consequences on the Sustainability Reporting Quality of Italian and German Companies. Sustainability 2019, 11, 4612. [Google Scholar] [CrossRef] [Green Version]
  90. Fernández-Guadaño, J.; Sarria-Pedroza, J.H. Impact of corporate social responsibility on value creation from a stakeholder perspective. Sustainability 2018, 10, 2062. [Google Scholar] [CrossRef] [Green Version]
  91. Loprevite, S.; Ricca, B.; Rupo, D. Performance sustainability and integrated reporting: Empirical evidence from mandatory and voluntary adoption contexts. Sustainability 2018, 10, 1351. [Google Scholar] [CrossRef] [Green Version]
  92. Sierra-Garcia, L.; Garcia-Benau, M.A.; Bollas-Araya, H.M. Empirical analysis of non-financial reporting by Spanish companies. Admin. Sci. 2018, 8, 29. [Google Scholar] [CrossRef] [Green Version]
  93. Gallego-Álvarez, I.; Lozano, M.B.; Rodríguez-Rosa, M. Analysis of Social Sustainability Information in a Global Context According to the New Global Reporting Initiative 400 Social Standards. Sustainability 2019, 11, 7073. [Google Scholar] [CrossRef] [Green Version]
  94. Porter, M.E.; Kramer, M.R. Creating Shared Value. In Managing Sustainable Bbusiness; Springer: Dordrecht, The Netherlands, 2019; pp. 323–346. [Google Scholar]
  95. Ringle, C.M.; Wende, S.; Will, A. Smart PLS 3.0 (beta). EEUU. 2005. Available online: http://www.smartpls.de (accessed on 1 May 2019).
  96. Roldán, J.L.; Sánchez-Franco, M.J. Variance-Based Structural Equation Modeling: Guidelines for using Partial Least Squares in Information Systems Research. In Research Methodologies, Innovations and Philosophies in Software Systems Engineering and Information Systems, Information Science Reference; Mora, M., Gelman, O., Steenkamp, A., Raisinghani, M.S., Eds.; IGI Global: Hershey, NY, USA, 2012; pp. 193–221. [Google Scholar]
  97. Cohen, J. Statistical Power Analysis for the Behavioral Sciences; Hillsdale: Erlbaum, NJ, USA, 1988. [Google Scholar]
  98. Barroso, M.J. Procesos de Asociación Entre Empresas y ONGD. Un Modelo de eExito Desde la Perspectiva del Marketing de Relaciones; Universidad de Extremadura: Badajoz, Spain, 2015. [Google Scholar]
  99. Sánchez, D.; Subiela, B.J. La comunicación de la responsabilidad social corporativa en las organizaciones españolas con mejor reputación. Sphera Public 2016, 2, 39–53. [Google Scholar]
  100. Creixans-Tenas, J. Las Empresas Hospitalarias Españolas en el Contexto Europeo: Análisis de Los Estados Financieros, Comunicación y Responsabilidad Social; Universitat de Vic-UCC: Barcelona, Spain, 2018. [Google Scholar]
  101. Benitez, M.; Faba-Perez, C. Presence of social networks in the health sector: A case-study on the best positioned hospitals in the world. Ibersid 2016, 10, 21–30. [Google Scholar]
  102. Costa-Sanchez, C.; Túnez-Lopez, M.; Videla-Rodriguez, J.J. Spanish hospitals in the social web. The management of Facebook and Twitter by Hospital Sant Joan de Deu (Barcelona). Rev. Lat. Comun. Soc. 2016, 71, 1108–1130. [Google Scholar]
  103. Gutiérrez-Ponce, H.; Creixans-Tenas, J.; Arimany-Serrat, N. Características de las páginas web de los hospitales de la Comunidad de Madrid: Relación entre la calidad web y la responsabilidad social corporativa. Rev. Española Doc. Científica 2018, 41, e194. [Google Scholar] [CrossRef] [Green Version]
  104. Rodríguez, A.; Calle, C.; Zöller, B.; Pons, A.; Benavente, Y.; Durán, N. Responsabilidad social corporativa en los hospitales catalanes: ¿qué nos dicen sus webs? Rev. Comun. Salud 2017, 7, 13–28. [Google Scholar] [CrossRef] [Green Version]
  105. McGain, F.; Naylor, C. Environmental sustainability in hospitals—A systematic review and research agenda. J. Health Serv. Res. Policy 2014, 19, 245–252. [Google Scholar] [CrossRef]
  106. Henseler, J.; Hubona, G.; Ray, P.A. Using PLS path modelling in new technology research: Updated guidelines. Ind. Manag. Data Syst. 2016, 116, 2–20. [Google Scholar] [CrossRef]
  107. Henseler, J. Partial Least Squares Path Modeling: Quo Vadis? Qual. Quant. 2018, 52, 1–8. [Google Scholar] [CrossRef] [Green Version]
  108. Henseler, J.; Dijkstra, T.; Sarstedt, M.; Ringle, C.; Diamantopoulos, A.; Straub, D.; Ketchen, D.J.; Hair, J.; Hult, G.; Calantone, R.J. Common beliefs and reality about PLS: Comments on Rönkkö and Evermann. Organ. Res. Methods 2013, 17, 182–209. [Google Scholar] [CrossRef] [Green Version]
  109. Henseler, J.; Ringle, C.M.; Sarstedt, M. Testing measurement invariance of composites using partial least squares. Int. Mark. Rev. 2016, 33, 405–431. [Google Scholar] [CrossRef]
  110. Hair, J.F.; Ringle, C.M.; Sarstedt, M. PLS-SEM: Indeed a silver bullet. J. Mark. Theory Pract. 2011, 19, 139–152. [Google Scholar] [CrossRef]
  111. Chin, W.W.; Dibbern, J. An introduction to a permutation-based procedure for multi-group PLS analysis: Results of tests of differences on simulated data and a cross cultural analysis of the sourcing of information system services between Germany and the USA. In Handbook of Partial Least Squares: Concepts, Methods and Applications in Marketing and Related Fields; Esposito, V., Chin, W.W., Henseler, J., Wang, H., Eds.; Springer: Berlin, Germany, 2010; pp. 171–193. [Google Scholar]
  112. Vadenberg, R.J.; Lance, C.E. A review and synthesis of the measurement in variance literature: Suggestions, practices, and recommendations for organizational research. Organ. Res. Methods 2000, 3, 4–70. [Google Scholar] [CrossRef]
  113. Edgington, T.M.; Bentler, P.M. Contemporary Reporting Practices Regarding Covariance-Based SEM with a Lens on EQS. In Research Methodologies, Innovations and Philosophies in Software Systems Engineering and Information Systems; Mora, M., Gelman, O., Steenkamp, A.L., Raisinghani, M., Eds.; Information Science Reference: Hershey, PA, USA, 2012; pp. 166–192. [Google Scholar]
  114. Henseler, J.; Ringle, C.M.; Sarstedt, M. A new criterion for assessing discriminant validity in variance-based structural equation modelling. J. Acad. Mark. Sci. 2015, 43, 115–135. [Google Scholar] [CrossRef] [Green Version]
  115. Wright, R.T.; Campbell, D.E.; Thatcher, J.B.; Roberts, N. Operationalizing multidimensional constructs in structural equation modeling: Recommendations for IS research. Commun. Assoc. Inf. Syst. 2012, 30, 367–412. [Google Scholar] [CrossRef] [Green Version]
  116. Hair, J.F.; Risher, J.; Sarstedt, M.; Ringle, C. When to use and how to report the results of PLS-SEM. Eur. Bus. Rev. 2019, 31, 2–24. [Google Scholar] [CrossRef]
  117. Chin, W.W. The partial least squares approach to structural equation modelling. Mod. Methods Bus. Res. 1998, 295, 295–336. [Google Scholar]
  118. Chin, W.W. How to write up and report PLS analyses. In Handbook of Partial Least Squares: Concepts, Methods and Applications; Esposito, V., Chin, W.W., Henseler, J., Wang, H., Eds.; Springer: Berlin, Germany, 2010; pp. 655–690. [Google Scholar]
  119. Falk, R.; Miller, N. A Primer for Soft Modeling; University of Akron Press: Akron, OH, USA, 1992. [Google Scholar]
  120. Leal-Rodríguez, A.L.; Ariza-Montes, J.A.; Roldán, J.L.; Leal-Millán, A.G. Absorptive capacity, innovation and cultural barriers: A conditional mediation model. J. Bus. Res. 2014, 67, 763–768. [Google Scholar] [CrossRef]
  121. Preacher, K.J.; Hayes, A.F. Asymptotic and resampling strategies for assessing and comparing indirect effets in multiple mediator models. Behav. Res. Methods 2008, 40, 879–891. [Google Scholar] [CrossRef]
  122. Roldán, J.L.; Cepeda, G. Seminario Modelos de Ecuaciones Estructurales Basados en la Varianza: Partial Least Squares (PLS) Para Investigadores en Ciencias Sociales, 3rd ed.; Universidad de Sevilla: Sevilla, Spain, 2016. [Google Scholar]
  123. Williams, J.; MacKinnon, D. Resampling and distribution of the product methods for testing indirect effects in complex models. Struct. Equ. Model. J. 2008, 15, 23–51. [Google Scholar] [CrossRef] [Green Version]
  124. Nitzl, C.; Roldan, J.L.; Cepeda, G. Mediation analyses in Partial Least Squares path modeling: Helping researchers discuss more sophisticated models. Ind. Manag. Data Syst. 2016, 116, 1849–1864. [Google Scholar] [CrossRef]
  125. Hair, J.F.; Hult, G.T.; Ringle, C.M.; Sarstedt, M. A Primer on Partial Least Squares Structural Equation Modeling (PLS-SEM), 2nd ed.; SAGE: New York, NY, USA, 2017. [Google Scholar]
Figure 1. Proposed conceptual model.
Sustainability 12 04857 g001
Table 1. Description of the sample used in the investigation.
DatabaseSABI
Period2018
StatusActive companies
National activity code8610–Hospital activities
Type of companyMercantile companies
Business dimensionLarge and medium enterprises
Typology of annual accountsUnconsolidated accounts
Availability annual accounts2018 financial year available
Geographic locationSpain
Final sample122 companies
Table 2. Measurement indicators of the constructs.
CONSTRUCTINDICATORDESCRIPTIONSOURCEAUTHORS
Social Responsibility (SR)SR1N° of quality accreditations and certificationsCorporate website[66,99]
SR2Number of awards receivedCorporate website[66,99]
SR3Social responsibility disclosure indexCorporate website[100]
SR4Number of general sustainability aspectsCorporate websiteTable 3
SR5Number of social aspectsCorporate websiteTable 3
SR6Number of environmental aspectsCorporate websiteTable 3
Communication (C)C1Number of social networksCorporate website[101,102]
C2Web qualityCorporate website[103]
C3Average of monthly visitors on the websiteSimilar web[101]
C4Number of incoming links in Google searchGoogle Search[102]
C5Number of incoming links in Yahoo searchYahoo Search[102]
C6Nº of items in the press in which it appearsMyNews Database[101]
Economic and financial results (EFR)EFR1Operating incomeSABI database[50,54]
EFR2Return on assets (ROA)SABI database[101]
EFR3Return on equity (ROE)SABI database[101]
EFR4SolvencySABI database[76]
EFR5IndebtednessSABI database[50]
EFR6Personnel productivitySABI database[50]
EFR7Cash flows from operating activitiesSABI database[76]
EFR8Cash flows from investment activitiesSABI database[76]
Table 3. Description of the items that comprise the indicators SR4, SR5 and SR6.
SR4: Number of general sustainability aspects
1It has a director, department or head of SR[50,104]
2SR policy available
3Strategic plan available
4A quality management system is available
5Sustainability reports are compiled
6Sustainability reports have external validation
7It has adopted the United Nations Global Compact
8The identity, mission, vision and values of the hospital are defined
9There is an exclusive section dedicated to sustainability or SR
10Economic, environmental and social aspects are separated
SR5: Number of social aspects
1Code of ethics available[50,104]
2Equality plan is available
3Concerns about the reconciliation between work and family life
4It cares about diversity management
5Solidarity projects are available
6Corporate volunteer programs are carried out
7Training for employees
8Media are asked to express doubts or suggestions
9Information on medical knowledge is disclosed
10Job creation is encouraged
SR6: Number of environmental aspects
1Environmental policy is available[50,104,105]
2It participates in activities related to protection of the natural environment
3Energy saving is considered to achieve higher levels of efficiency
4Water saving is considered to achieve higher levels of efficiency
5The reduction of emissions of gases and waste is considered
6The introduction of alternative energy sources is positively valued
7There is a concern to minimize the environmental impact
8Consumables and products with low environmental impact are used
9The use of recyclable containers and packaging is valued
10Data related to environmental improvement are specified
Table 4. Items’ individual reliability.
Construct IndicatorsLoadings (λ)Cronbach’s AlphaComposite ReliabilityAVE
Social Responsibility 0.8890.9350.704
SR10.742
SR30.767
SR40.851
SR50.925
SR60.964
Communication 0.8470.8040.523
C10.766
C20.798
C30.713
C40.742
Economic Financial 0.8760.9320.643
Results
EFR10.934
EFR20.887
EFR40.932
EFR50.717
EFR80.806
Note: AVE = average extracted variance; SR = Social Responsibility; C = Communication; EFR = Economic Financial Results.
Table 5. Discriminant validity of constructs.
Fornell-Larcker CriterionHTMT
ConstructsSRCEFRSRCEFR
SR0.723
C0.4620.821 0.486
EFR0.6320.4150.8330.5880.432
Note: SR = Social Responsibility; C = Communication; EFR = Economic Financial Results.
Table 6. Contrast of hypotheses, correlation coefficients, and variance explained.
HypothesesPath Coefficients (β)T-statistic (Bootstrap)Explained Variance (%)Relationship Validation
H1: SR → C0.2014.437 ***7.85%Validated
H2: C → EFR0.4537.684 ***21.22%Validated
H3: SR → EFR0.2883.722 ***14.95%Validated
*** p < 0.001 (based on t(499), two-tailed test) t(0.05;499) = 1.96; t(0.01;499) = 2.59; t(0.001;499) = 3.31.
Table 7. Hypotheses Mediating Effects Tests.
Direct EffectsCoefficientBootstrap 90% CI
Percentile
H1: c’0.259sig0.0220.474
a0.509sig0.3650.670
b0.324sig0.2170.459
Indirect EffectPoint EstimatePercentileVAF
H2: a * b0.214sig0.0180.3960.306 (30.6%)
Total Indirect Effect0.538sig

