Article

Performance Assessment of a Hybrid System with Hydrogen Storage and Fuel Cell for Cogeneration in Buildings

1
LERMA Lab, College of Engineering and Architecture, International University of Rabat, Sala El Jadida 11100, Morocco
2
CUR″EnR&SIE″, Faculty of Sciences El Jadida–Chouaib Doukkali University, El Jadida 24000, Morocco
3
Faculty of Sciences, Mohammed V University, Rabat 10000, Morocco
*
Author to whom correspondence should be addressed.
Sustainability 2020, 12(12), 4832; https://doi.org/10.3390/su12124832
Submission received: 17 April 2020 / Revised: 25 May 2020 / Accepted: 27 May 2020 / Published: 12 June 2020
(This article belongs to the Special Issue The Circular Economy as a Promoter of Sustainability)

Abstract

:
The search for new fuels to supersede fossil fuels has been intensified these recent decades. Among these fuels, hydrogen has attracted much interest due to its advantages, mainly cleanliness and availability. It can be produced from various raw materials (e.g., water, biomass) using many resources, mainly water electrolysis and natural gas reforming. However, water electrolysis combined with renewable energy sources is the cleanest way to produce hydrogen while reducing greenhouse gases. Besides, hydrogen can be used by fuel cells for producing both electrical and thermal energy. The aim of this work was towards efficient integration of this system into energy efficient buildings. The system is comprised of a photovoltaic system, hydrogen electrolyzer, and proton exchange membrane fuel cell operating as a cogeneration system to provide the building with both electricity and thermal energy. The system’s modeling, simulations, and experimentations were first conducted over a short-run period to assess the system’s performance. Reported results show the models’ accuracy in analyzing the system’s performance. We then used the developed models for long-run testing of the hybrid system. Accordingly, the system’s electrical efficiency was almost 32%. Its overall efficiency reached 64.5% when taking into account both produced electricity and thermal energy.

1. Introduction

The deployment of renewable energy sources (RES) as green energy producers, such as solar energy, wind, geothermal, and biomass, as well as the search for new sources of fuel (e.g., hydrogen and biogas) have been intensified these last decades in order to supersede fossil products (e.g., coal, oil, natural gas) [1,2,3,4,5]. The latter currently produce more than 70% of the global electricity needs [6]. Therefore, Morocco as a sunny country, with an average daily global radiation of about 5 kWh/m² [7], is putting more emphasis on solar energy. It aims to increase the proportion of RES from 42% in 2020 to 52% in 2030 [8] in order to meet the increase of electricity consumption. This will reduce its dependence on fossil products, which is currently around 90% [6]. Thus, many research and development (R&D) institutions (e.g., IRESEN—Institut de Recherche en Energie Solaire et Energies Nouvelles, MASEN—Moroccan Agency for Solar Energy) have been built, and many RES plants (e.g., Noor in Ouarzazate) have been deployed [9]. Furthermore, this North African country was involved, through MASEN, in the DESERTEC project, which had the intention of deploying solar plants using concentrated solar systems and photovoltaic (PV) systems and wind parks in the desert of the Middle East and Northern Africa (MENA) [10]. These plants had the aim to provide the EU–MENA region (European Union, Middle East, and Northern Africa) with electricity through the transnational electricity distribution network, which can be made up of high-voltage direct current (HVDC) transmission cables [10].
However, the intermittent nature and the production uncertainty of RES necessitate the use of efficient storage systems in order to store their overproduction, which is then used when there is no production. Among the current energy storage systems (e.g., batteries, superconductors, molten salts, hydrogen, biogas) [11,12], the storage of electricity in the form of hydrogen has attracted much interest these last decades due to its various advantages, such as cleanliness and efficiency [13]. In fact, since hydrogen has a small density at ambient conditions, the increase of its density, which implies the diminution of its volume, is highly required for its storage. It can be stored in three different states depending on its application, storage size, temperature, and pressure: (i) its compression into high pressure gas cylinders, (ii) its storage as a liquid, and (iii) its storage in a solid state in the metal and non-metal hydrides [14,15,16,17,18,19,20,21]. In fact, copious amounts of hydrogen exist in nature; however, most of this element is combined with other atoms (i.e., only exists as part of other molecules), such as water. Therefore, the generation of hydrogen is mandatory. It can be produced from various raw materials (e.g., water, biomass, fossil fuels) using many resources, mainly water electrolysis and natural gas reforming [7,22,23]. In fact, fossil fuels (e.g., oil, natural gas, coal) produce just over 96% of the world’s total hydrogen, while almost 4% is generated by water electrolysis [24]. However, water electrolysis, especially when combined with RES, is the cleanest way to produce hydrogen while reducing greenhouse gases [23,24]. This is attributed to its multiple benefits, such as cleanliness, water availability, and high purity of the produced hydrogen [24]. There are various types of electrolyzers, such as the proton exchange membrane (PEM) electrolyzer, the alkaline electrolyzer, and the solid oxide electrolyzer [24,25,26,27]. The difference between these types, which manifests on their electrolytes and operating temperature, has been reviewed in [24,26,27,28].
The produced and stored hydrogen can be used by fuel cells, which can be used as combined heat and power (CHP) systems (e.g., reciprocating engines, micro-turbines, stirling engines, fuel cells) in order to generate electricity, thermal energy, and water simultaneously from the exothermic reaction between hydrogen and oxygen [13,29]. These systems have higher efficiency than the conventional power cycles. Due to their various benefits, such as modularity, higher efficiency (about 85–90%), cleanliness, and low noise level, fuel cells are extensively deployed in vehicles and buildings [13,22]. Besides, the operating temperature, the electrolyte, and the used fuel are the most important properties used for the classification of fuel cells. The authors in [29,30,31] have reviewed the different types of fuel cells as well as their different characteristics. For instance, the proton exchange membrane (PEM) fuel cell is the most appropriate for micro-cogeneration applications due to its numerous advantages, such as quick start-up and load following, high power density, low temperature, and less corrosion [22,32].
On another note, the modeling and the performance assessment of these types of systems have been extensively studied in the past few years in order to make their deployment easier and evaluate their behavior and performance under various conditions. In addition, several software tools, such as HOMER, TRNSYS, RETScreen, and Dymola/Modelica, have been developed for hybrid systems’ modeling and simulation [33]. For instance, a mathematical model of the solar cells’ electrical circuit has been developed by the research community in order to assess its performance under various weather conditions (e.g., solar irradiation, temperature) [34,35,36]. The solar cell’s simplest model is the single-diode model, which is based on a current source in parallel to a diode, while the most improved model is the two-diode model [37,38]. This latter contains an additional diode, a series resistance Rs, and a shunt resistance Rsh [37,38]. Regarding the converters’ models, they have been described with more detail in our previous work, which is introduced in [39]. Besides, the hydrogen electrolyzer models can be classified, according to recent works [40,41,42,43,44,45,46,47,48,49], into three categories based on their state (e.g., steady state or dynamic conditions) and spatial dimensions (e.g., 0-D, 1-D, 2-D, or 3-D): (i) analytical models that are based on approximations and assumptions; (ii) semi-empirical models, which use experiments to validate theoretical models; and (iii) mechanistic models that are based on physics and electrochemistry laws. Concerning hydrogen storage, numerous models have been developed in order to study the behavior of its different types [44,48,50,51]. In addition, numerous analytical models [52], mechanistic models [49,52,53,54], and empirical models [48,52,54,55,56,57] have been developed for the purpose of assessing the performance and the behavior of the different types of fuel cells and estimating and predicting their current/voltage relationship.
The work presented in this article is a part of two projects. The first project, named PROPRE.MA (PROductivité Photovoltaïque à l’échelle REgionale dans tout le Maroc), is funded by IRESEN and managed by the Faculty of Sciences Semlalia Marrakech (FSSM) [58,59,60]. It aims at mapping the productivity and the efficiency of three different technologies of PV panels (monocrystalline silicon, polycrystalline silicon, and amorphous silicon) in 21 different locations in Morocco. The second project, named MIGRID, is an ongoing project aiming at deploying a micro-grid (MG) system comprised of PV panels in order to generate electricity from solar irradiation; wind turbines to generate electricity from the wind; batteries for storing the overproduction of electricity in order to use it when there is no production; converters (e.g., DC/DC converters, AC/DC converters, and DC/AC converters); a hydrogen electrolyzer to produce hydrogen using the overproduction of our RES systems; hydrogen tanks to store the produced hydrogen; a fuel cell that uses the stored hydrogen and the air’s oxygen for supplying the building with both valuable electricity and thermal energy when needed; and finally, the electric grid in order to feed electricity to the building when there is no production, i.e., when there is no hydrogen left and the batteries are empty. Mainly, the main aim of the MIGRID project is to test some approaches (e.g., dimensioning and control strategies) and validate the components’ models using experiments [39,61,62]. Therefore, the hybrid system that we have considered in this article is comprised of a PV system, an electrolyzer for hydrogen production, and a PEM fuel cell that is principally operating as a CHP system in order to provide the building with both valuable electrical and thermal energy.
The aim of the work presented in this paper is towards efficient integration of a hybrid system into buildings together with its performance assessment. Thus, the main contributions in this article are twofold: (i) modeling, simulating, and experimenting the hybrid system and showing the accuracy of the developed models, and (ii) using the validated models for studying the behavior of the hybrid system over one year and assessing its performance when operating as a CHP system for supplying the building with both electrical and thermal energy.
The remainder of this article is structured as follows. The proposed hybrid system is described with more detail in Section 2. Section 3 introduces the modeling of the MG system’s components. The obtained simulation and experimental results are presented in Section 4. Finally, the main conclusions and perspectives are given in Section 5.

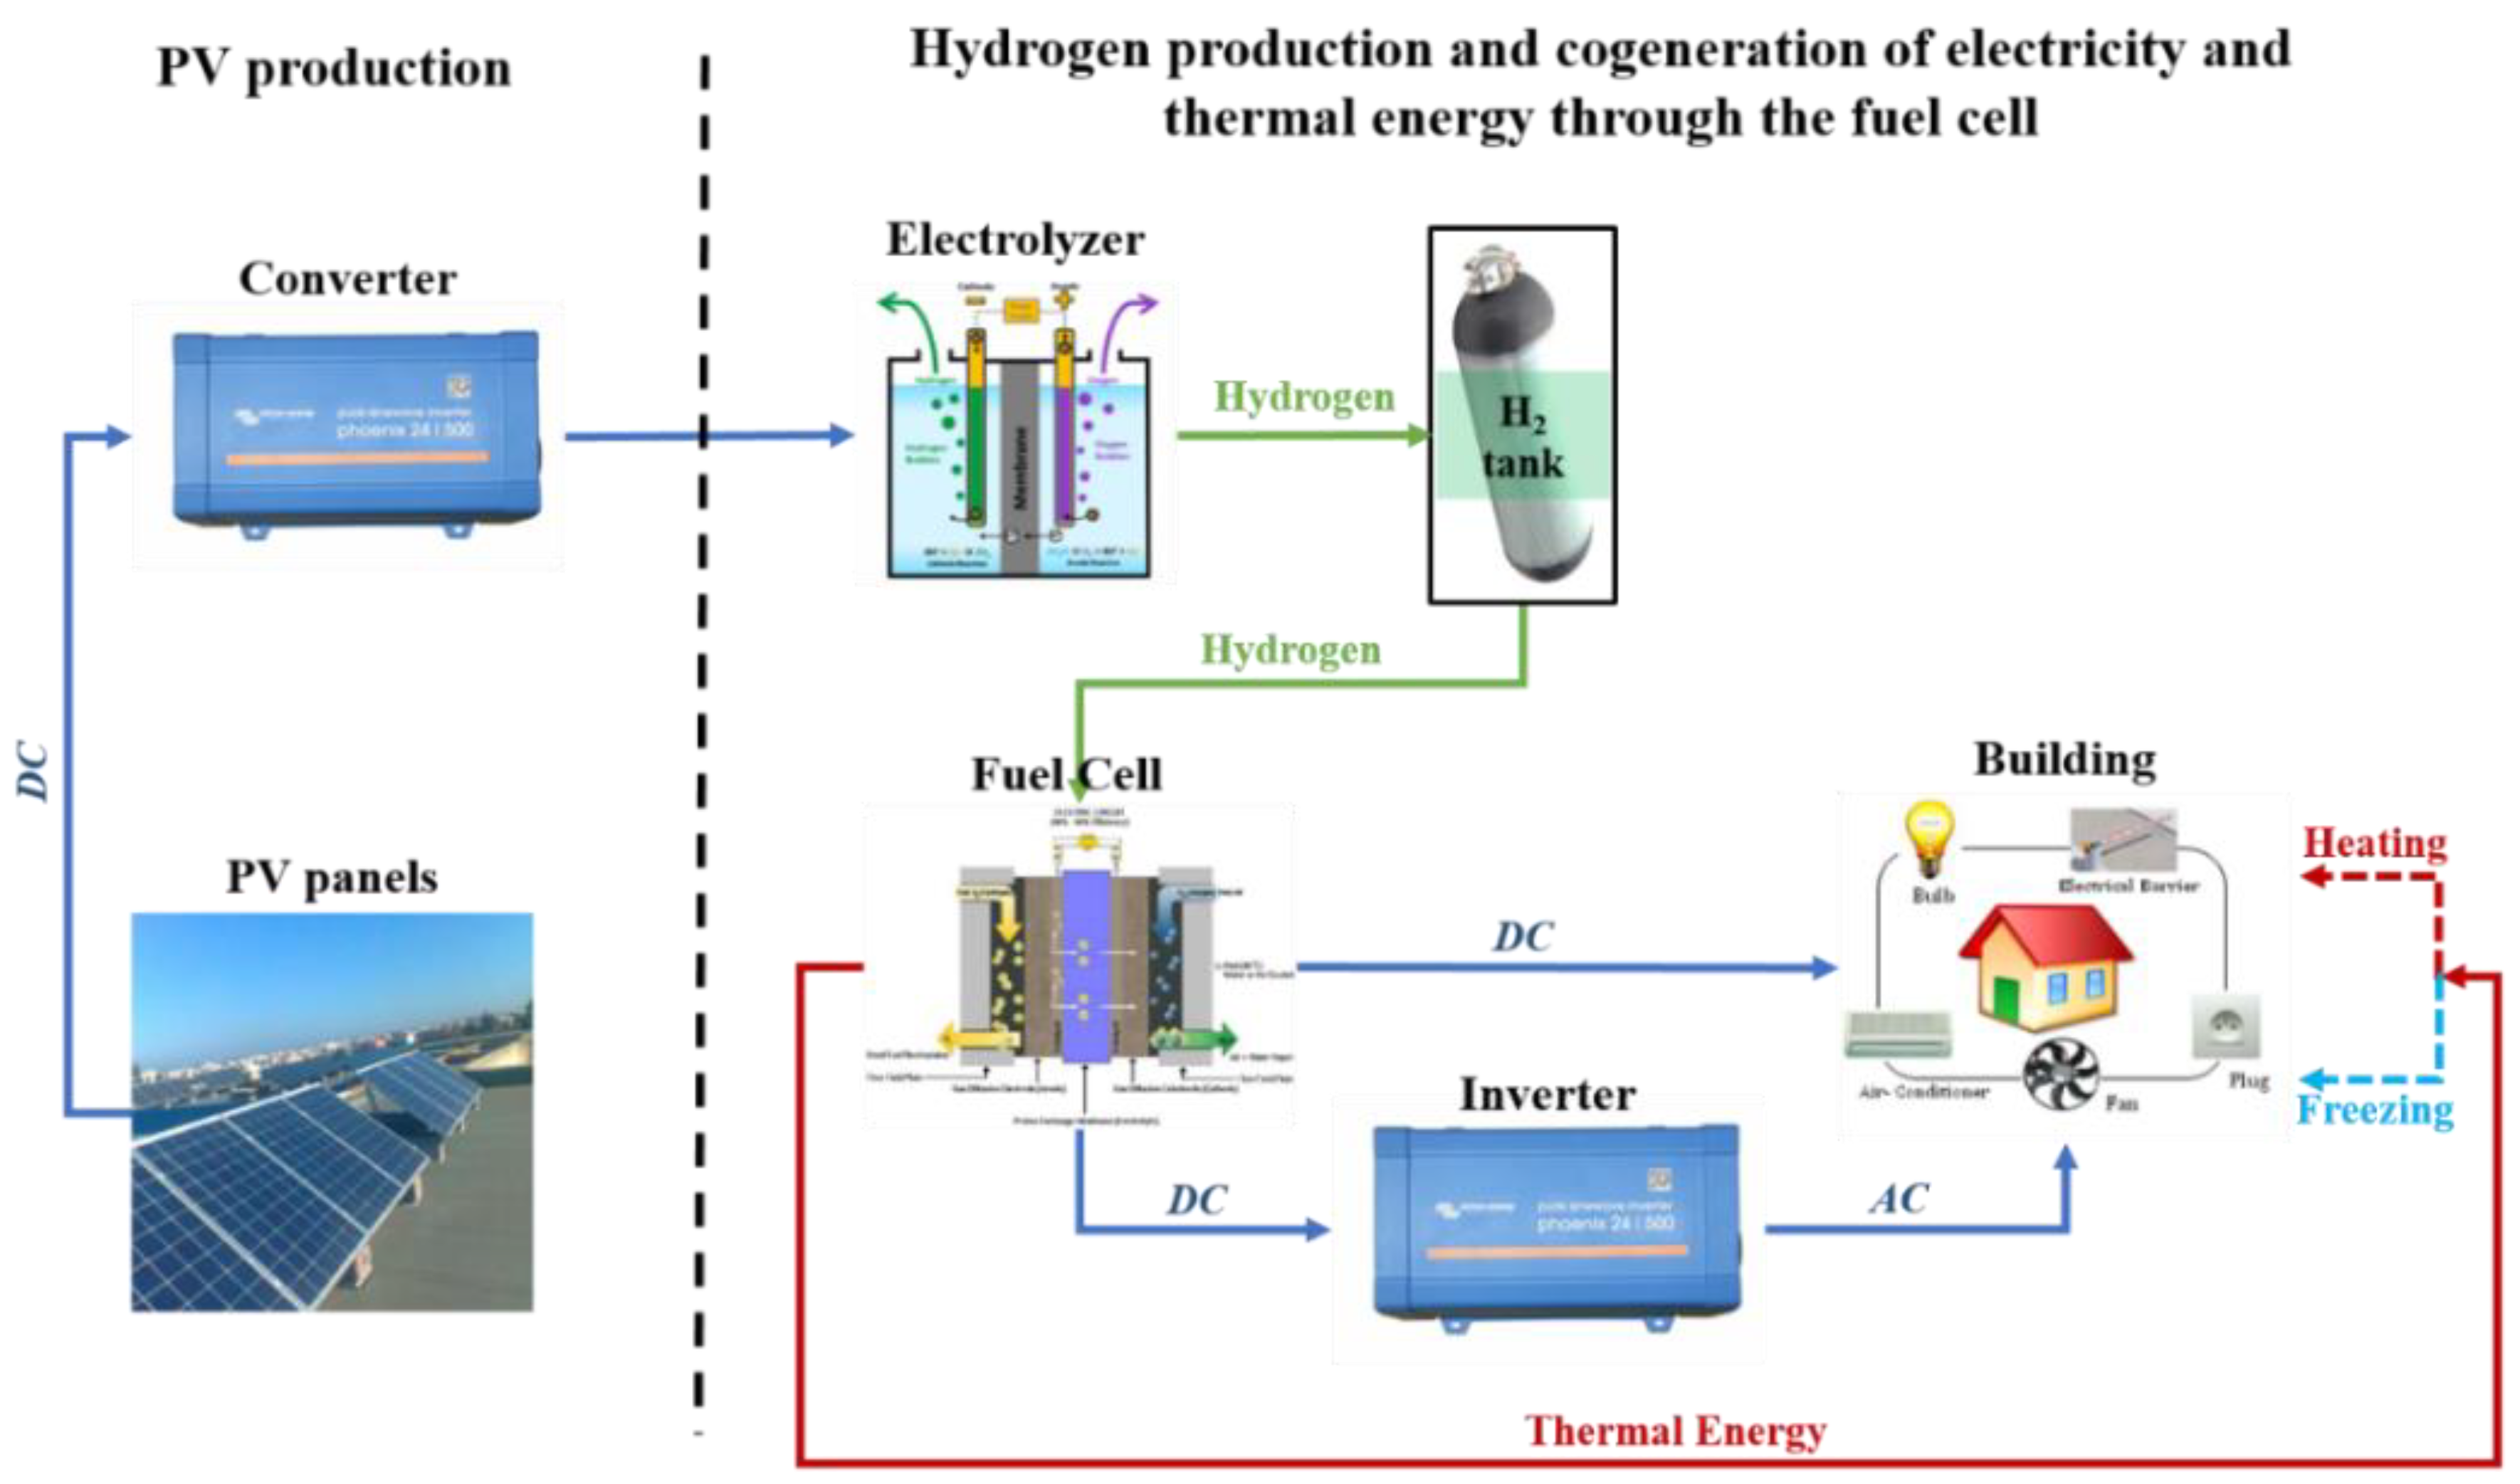
2. Hybrid System’s Description

Figure 1 depicts the architecture of the proposed hybrid system. It is comprised of PV panels, converters, a hydrogen electrolyzer, hydrogen tanks, and a fuel cell. Actually, as a part of the PROPRE.MA project, the PV system used in this experiment is set up in the Faculty of Sciences El Jadida (latitude 33.22 °N, longitude 8.48°W, altitude 24 m, and 2.1 km away from the Atlantic Ocean) in Morocco, more precisely on the roof of the physics department building. It is comprised of PV panels in order to generate electricity from solar irradiation and an inverter in order to convert the direct current (DC) generated by the PV panels into an alternative current (AC) [63]. Concerning the PV panels, we installed 8 polycrystalline silicon PV modules, which were manufactured by Solar World, type Sun module plus. Each module had a rated power of about 255 W, an open circuit voltage (VOC) equal to 37.6 V, and a short circuit current (Isc) of about 8.81 A, as presented in Table 1. In this experiment, we chose to work with the polycrystalline silicon PV modules due to their cost-performance ratio compared to the monocrystalline and amorphous ones. Besides, these PV modules are tilted by 30° for the purpose of capturing the maximum solar irradiation and then producing the maximum amount of electrical energy.
Regarding the inverter that is manufactured by SMA, type Sunny boy 2000HF-30, it has already been reported with more detail by the authors in [59]. It is noteworthy that we chose the city of El Jadida because of its weather conditions (e.g., moderate temperature), and also the PV system was already set up in this city in the frame of the project. Concerning the data acquisition, an acquisition platform comprised of many sensors and electronic cards was installed in order to obtain the PV system’s data as well as the weather data. Regarding the PV system’s data, it was measured using current and voltage sensors, which were integrated into the inverter. The chosen sampling time in this experiment was 5 min, and the data could be accessed via a Bluetooth modem or transferred by means of an Ethernet or Internet network [60,64]. As for the weather data, a weather station was deployed near the PV panels in order to collect some meteorological data, such as wind speed and direction, solar irradiation, and the ambient and PV module’s temperature. Mainly, it was comprised of several sensors: (i) a temperature sensor for measuring the ambient temperature; (ii) a Pt100 temperature sensor for capturing the PV module’s temperature; (iii) an anemometer for determining the wind speed; (iv) a wind vane in order to measure the wind direction; (v) two small PVs (one tilted by 30° and the other horizontal), with a rated power of about 20 W each, in order to measure the in-plane and horizontal solar irradiances, which are proportional to their short circuit current; and (vi) a PC-duino and Raspberry pi in order to gather, process, and store the measured data [63,64]. Furthermore, an electrolyzer was used to produce hydrogen, which was stored and then used when needed. The used PEM electrolyzer, which had an operative power consumption of about 800 W and produced hydrogen with a purity of about 99.999% (see Table 2 for more characteristics), is manufactured by Heliocentris, type HG 100. It was used in order to produce hydrogen using deionized water and electricity.
The produced hydrogen was stored in hydrogen tanks so that it could be used later by the fuel cell for producing both valuable electrical and thermal energy according to the building’s need. The PEM fuel cell used in this experiment, which had a rated power of about 1.2 kW, an output voltage in the range of 20–36 VDC, and a rated current of around 65 ADC (see Table 3 for more features), is manufactured by Heliocentris, type Nexa 1200. Concerning the DC produced electricity, an inverter was used in order to convert it into an AC for feeding the building’s AC appliances. Besides, several current and voltage sensors were deployed in order to measure the power in its different branches. In addition, the hydrogen flow and temperature of the fuel cell’s stack and hydrogen tanks were measured using an integrated flow meter and temperature sensors. In fact, the fuel cell was purchased together with these sensors, which were fully embedded into its acquisition system. The measured data were then stored and visualized using a software tool, which was provided by the same company that manufactured the fuel cell.
Regarding the produced thermal energy ( Q ), it could be used for either heating the building in the winter time using an air to air heat exchanger or cooling it during the summer period using a refrigeration process. It is computed using Equation (1):
Q = ρ a i r V a i r C p , a i r ( T f i n a l T i n i t i a l )
where ρ a i r is the density of the air (kg/m3), V a i r being the volume of the heated air (m3), C p , a i r represents the specific heat capacity of the air (kJ/kg.K), and T f i n a l and T i n i t i a l are the final and initial temperatures of the air, respectively (K) [65,66]. In order to capture most of the produced thermal energy by the fuel cell, we deployed a box at the fuel cell’s heat exhaust. Firstly, the used fuel cell system, which is presented in Figure 2, is constituted of hydrogen tanks, a 1.2 kW PEM fuel cell (see Table 3), converters (DC/DC converter and inverter), batteries to provide the computer used for data visualization (e.g., fuel cell’s current and voltage, hydrogen flow rate, stack temperature) with the needed electricity, and a DC load.
Regarding the deployed box, the volume of the air trapped into it was approximately equal to 0.0478 m3. Besides, an IoT/Big Data platform, which consisted of three temperature sensors (DS18B20), an Arduino Nano board, and Raspberry pi, was developed and deployed for the aim of measuring the temperature of the air trapped in the box [61]. Then, the collected data was sent by means of the Raspberry pi to a cluster, where it was processed, stored, and visualized. It could also be visualized and extracted using a web application that we had already developed. Finally, the temperature data was used in order to compute the amount of produced thermal energy using Equation (1).

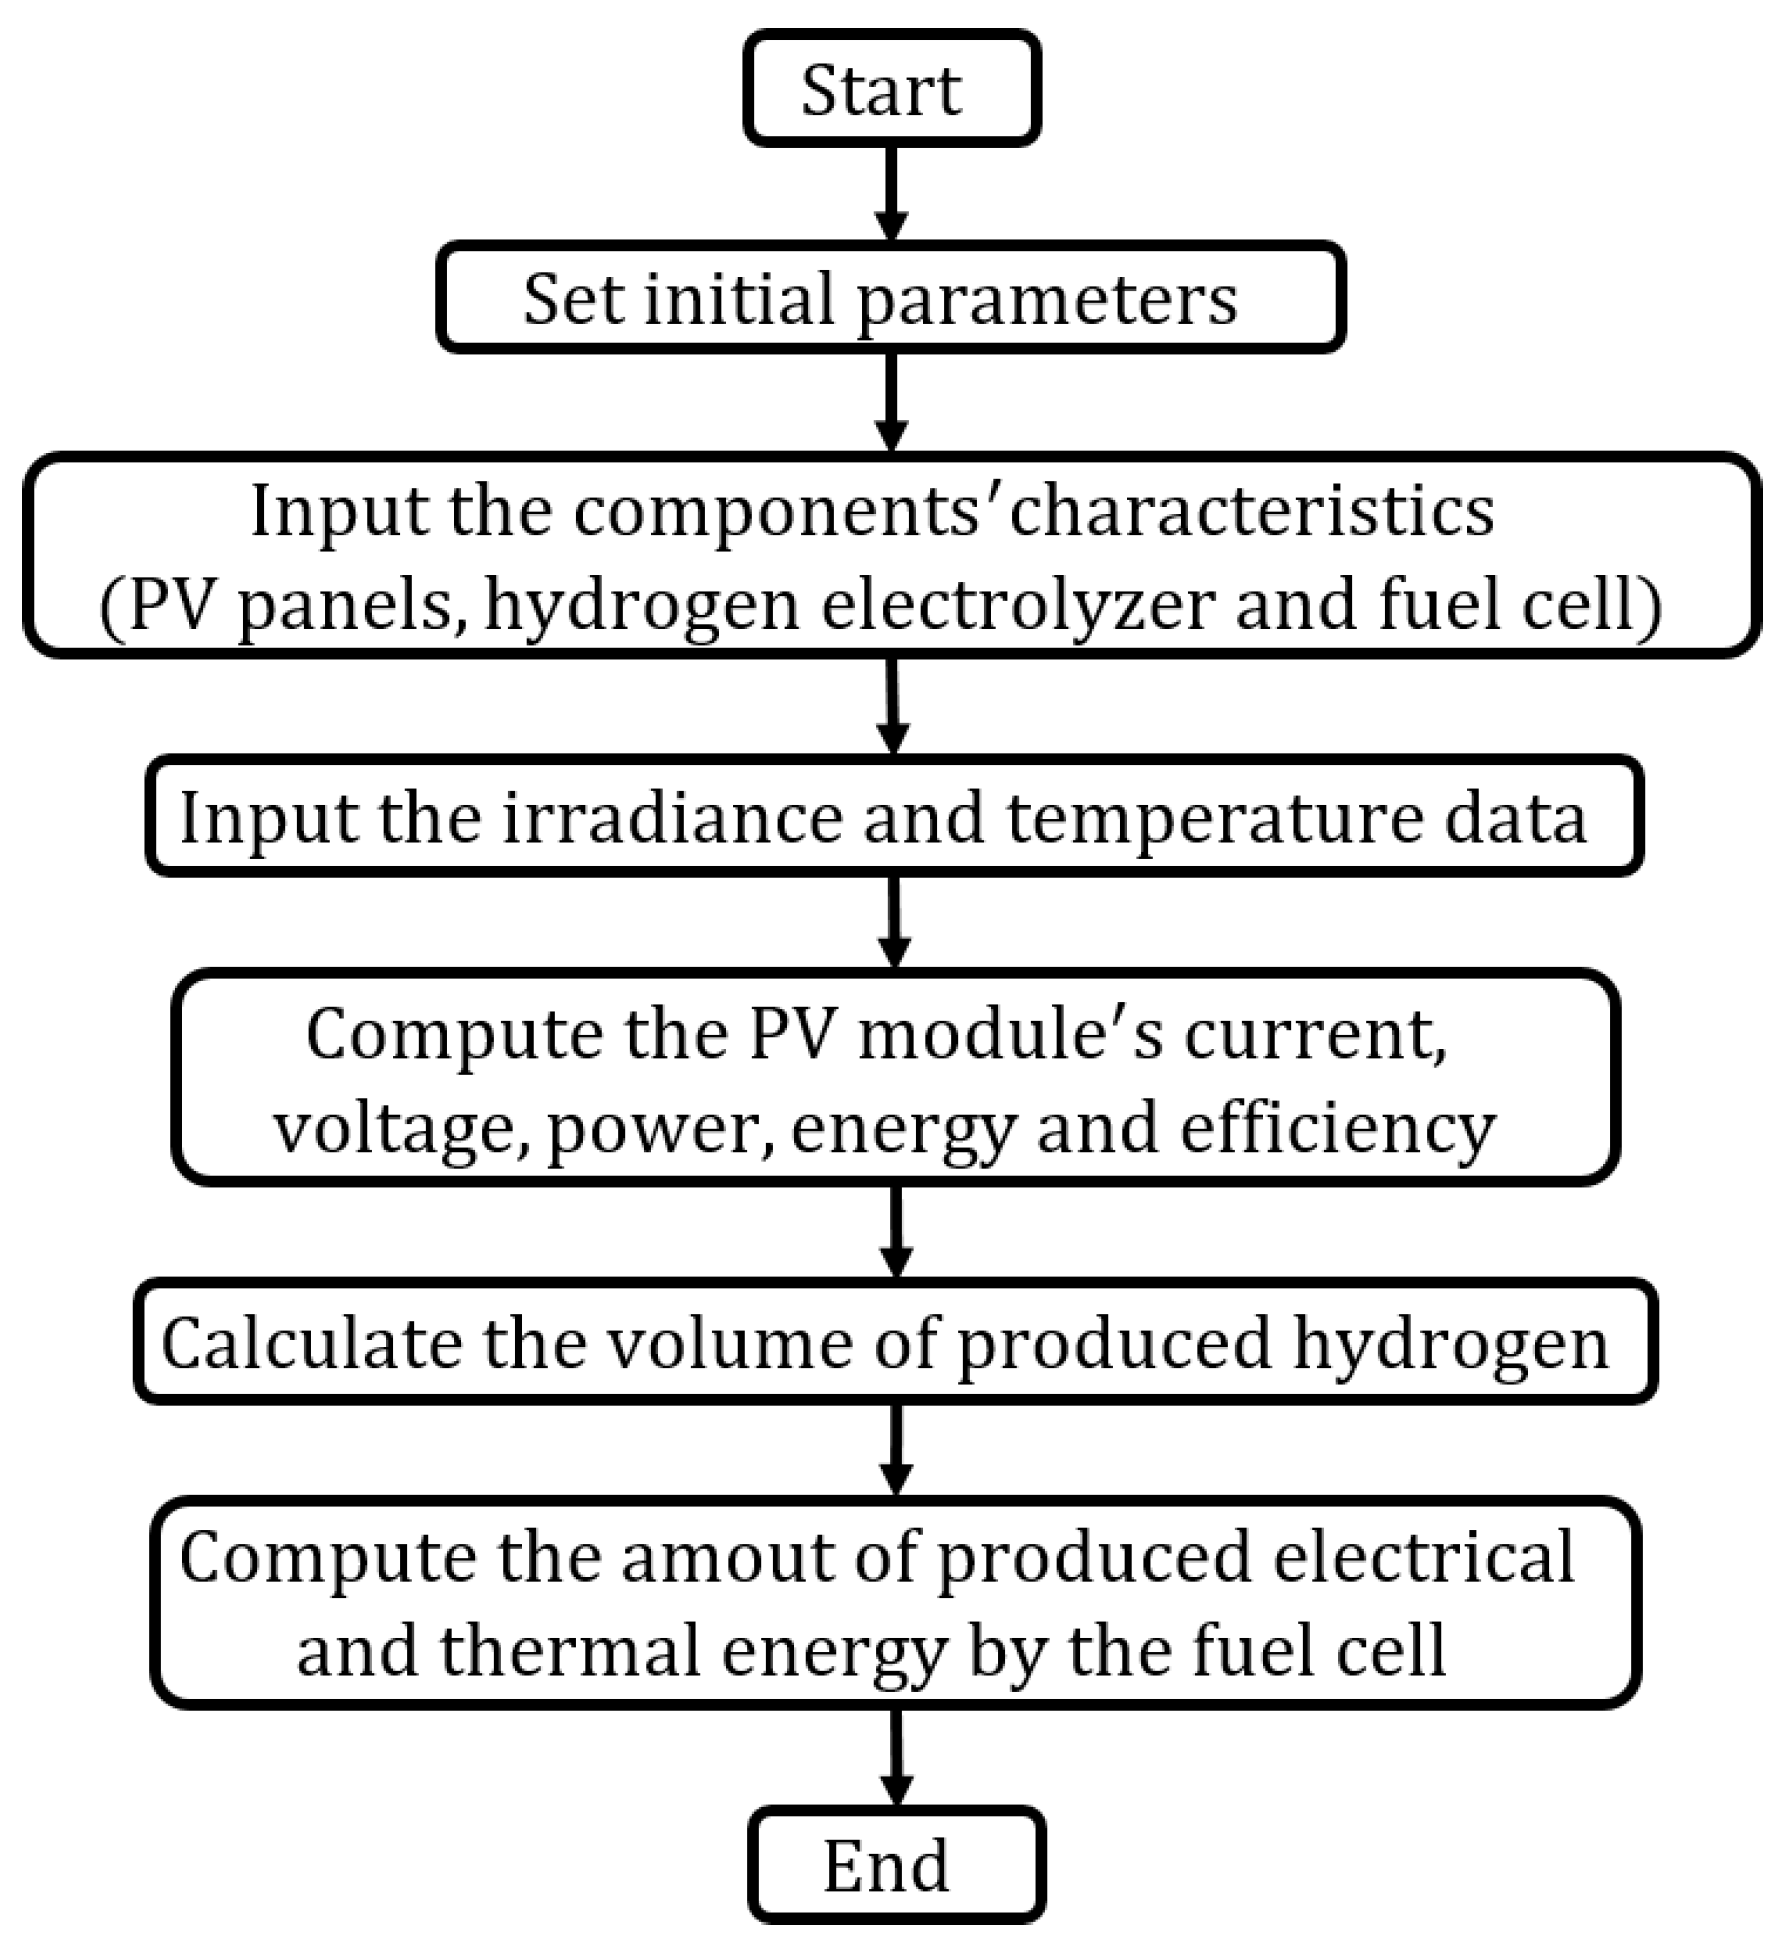
3. System’s Modeling

In this section, the system’s components (e.g., PV panels, converters, hydrogen electrolyzer, hydrogen tanks, and fuel cell) have been modeled and then connected in order to build the system’s model. Then, the simulation was conducted under MATLAB using similar experimental conditions (e.g., solar irradiation, ambient temperature). Figure 3 presents the flowchart diagram of the system’s model. It shows mainly the different phases followed for computing the components’ production, i.e., power, hydrogen volume, and thermal energy. Besides, the remainder of this section is devoted to the description and development of the models of the system’s components.

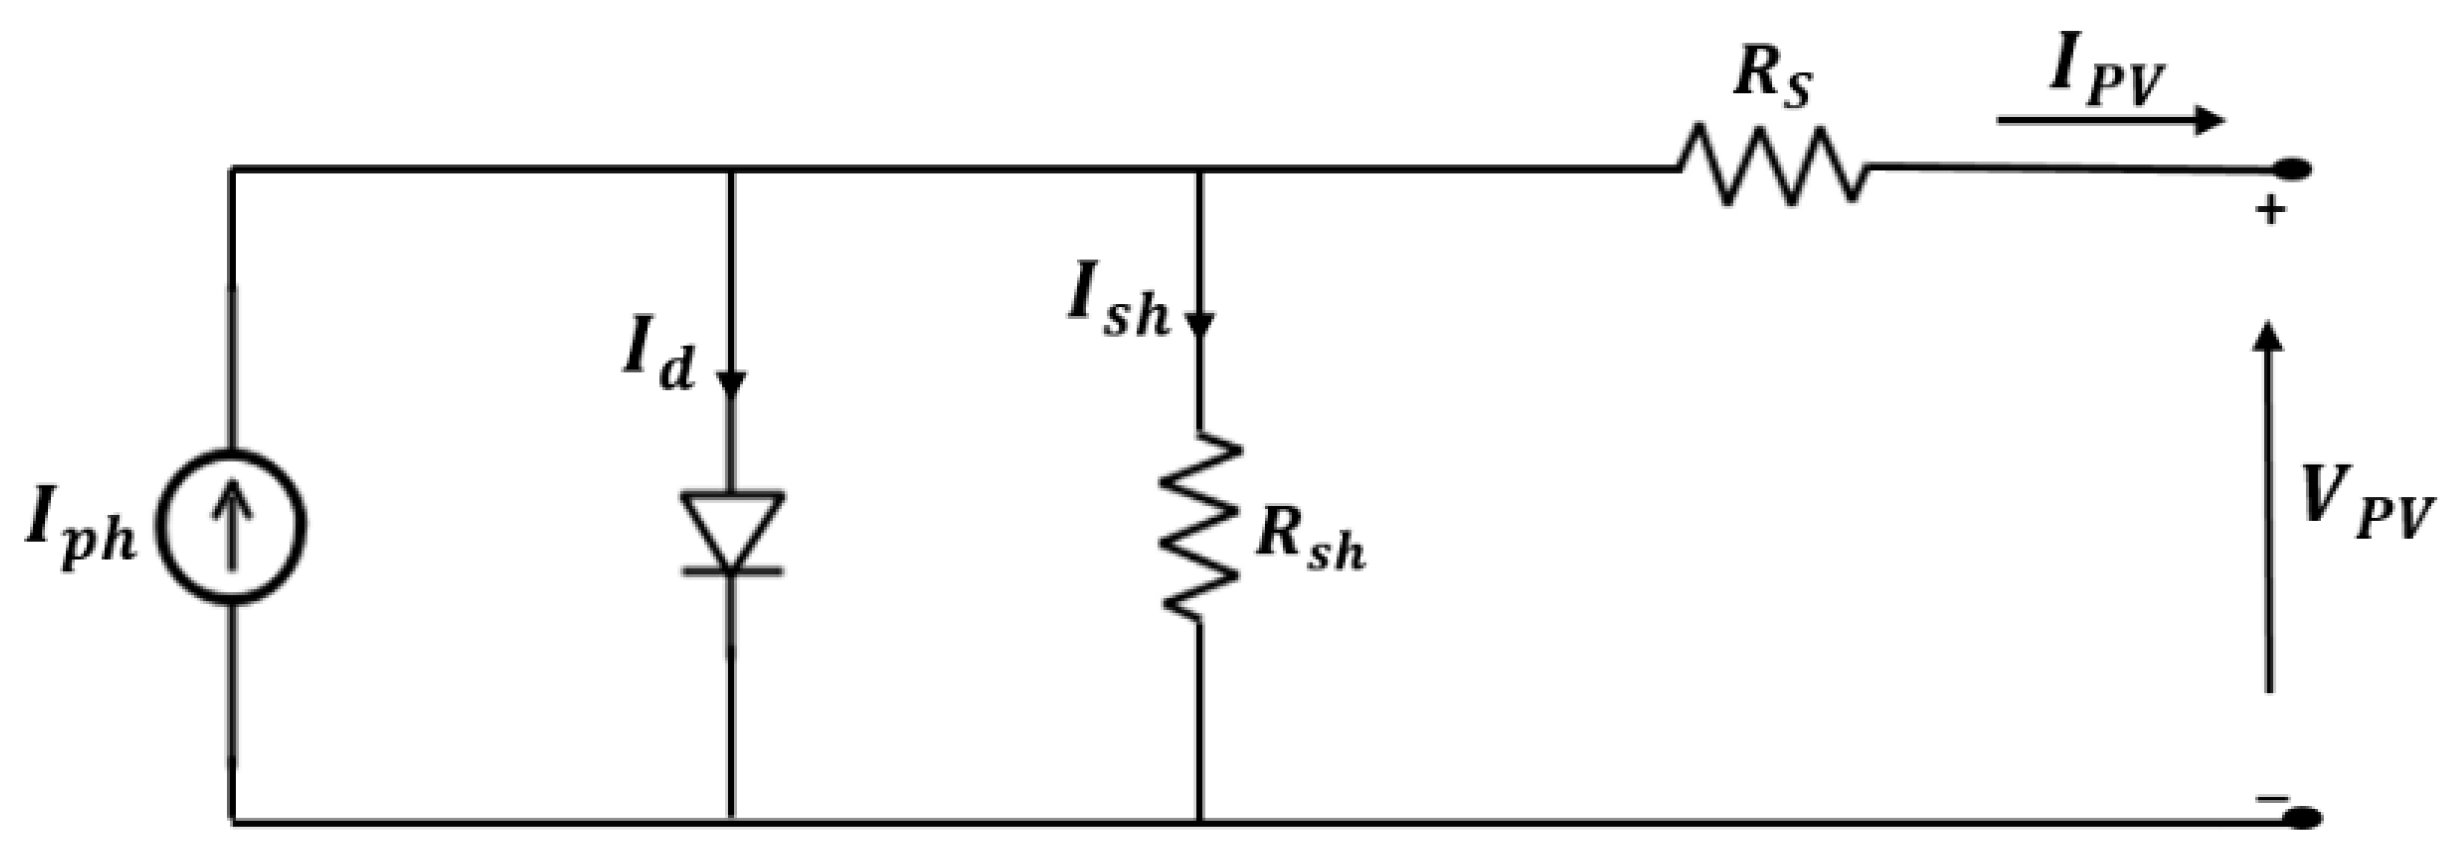
3.1. PV System’s Model

PV solar panels have been extensively used in order to produce electricity from solar irradiation. Many PV technologies have been developed these last decades, such as crystalline silicon (c-Si) solar cells, thin film cells, and multi-junction cells. In fact, the most used and manufactured ones are the crystalline silicon (c-Si) solar cells. These latter are classified into three categories, namely, monocrystalline silicon (mc-Si), polycrystalline silicon (pc-Si), and amorphous silicon (a-Si). The polycrystalline silicon PV modules are the most used due to their cost-performance ratio compared to the monocrystalline and amorphous ones. Therefore, their modeling and performance assessment is extremely needed in order to evaluate their behavior and performance under various conditions (e.g., solar irradiation, temperature). Thus, based on the Gow and Manning model [35,36,39] and the Shockley diode equation, a mathematical model of the solar PV cells’ equivalent electrical circuit has been developed. This model consists of a current source parallel to a diode, a series resistance R s , and a shunt resistance R s h , as shown in Figure 4.
From the electrical circuit of the PV cell, which is illustrated in Figure 4, the equation of the PV cell’s I P V - V P V characteristic is expressed using Equation (2):
I P V = I p h I d I s h
where I p h is the photocurrent, I d being the diode current, and I s h is the shunt current [35,36,39]. Using the Shockley diode equation as well as the expressions of the photocurrent and the shunt current presented in our previous work [39], the I P V - V P V characteristic of the PV module can be given by Equation (3):
I P V = N p I p h N p I s [ exp ( q   ( V P V N s + I P V R s N p ) n K T ) 1 ] N p V P V N s + I P V   R s R s h
where N p is the number of parallel cells in a module, I s being the diode saturation current (A), q stands for the electron charge (1.6 × 10⁻¹⁹ C), N s represents the number of series cells in a module, n is the diode ideality factor, K being the Boltzmann constant (1.38 × 10⁻²³ J/K), and T represents the module’s temperature (K). Regarding the converter (e.g., DC/DC converter and DC/AC converter) models, they have been reported and described with more detail in our previous work, presented in [39]. They were used in order to connect the different components, convert and adapt the variable voltages of the different energy sources to a constant one that could be consumed by the loads, and control the energy flow provided by the different energy sources based on the loads’ consumption.

3.2. Hydrogen Electrolyzer Model

Hydrogen can be produced, as stated above, from various raw materials (e.g., water, biomass, fossil fuels) using many resources, mainly water electrolysis and natural gas reforming [7,22,23,24]. Since the main purpose of using hydrogen is to supersede fossil fuels, water electrolysis, especially when using the electricity produced by RES (e.g., solar energy), remains the cleanest method for hydrogen generation from non-fossil fuels while reducing greenhouse gases due to its multiple advantages, such as cleanliness, availability of water, and the high purity of produced hydrogen [24]. Actually, based on the electrolyte and the operating temperature, hydrogen electrolyzers are categorized into three types, namely, the alkaline electrolyzer, the PEM electrolyzer, and the solid oxide electrolyzer [24,26,28]. Besides, the PEM electrolyzer is the most used, especially in buildings, due to its various benefits compared to the other electrolyzers, such as a compact system design, rapid system response, high dynamic operation, high efficiency, and high purity of produced hydrogen [26].
The PEM electrolyzer is constituted of a cathode, an anode, and a solid polymer membrane (electrolyte). It is an electrochemical device that is used for producing both hydrogen and oxygen from electricity and deionized water. In fact, deionized water is inserted into the anode electrode, where it is separated into a hydrogen proton (H+) and oxygen (O2). The hydrogen proton is then transported to the cathode electrode through the electrolyte. In the cathode, where a DC current is applied, the hydrogen proton consumes electrons for producing hydrogen gas (H2) [24]. Equations (4) and (5) present the reactions that take place at the PEM electrolyzer’s electrodes (anode and cathode, respectively).
H 2 O   2 H + + 1 2 O 2 + 2 e
2 H + + 2 e   H 2
Regarding the modeling of hydrogen electrolyzers, several models, which are based especially on their polarization curve as well as the volume of the produced hydrogen, have been proposed in order to simulate their behavior under different conditions and compute the produced hydrogen’s volume [45]. The assessment of their performances is also based on the evaluation of the temperature and the pressure of their electrodes and electrolytes. However, these two parameters could be neglected for the sake of simplicity. In fact, the authors in [45] reviewed four models used for estimating the electrolyzers’ behavior as well as computing the produced hydrogen’s volume, while indicating the degree of complexity of each model. Then, the four models were compared to an electrolyzer’s real behavior. The aim was to validate and assess the accuracy of these models. Finally, the authors in [45] found that the responses of the four models were too close to the real response of the device, with slight errors. For all these reasons, and for the sake of simplicity, the simplest model, which depends on the applied current, was used in order to estimate the behavior of the electrolyzer and the produced hydrogen’s volume. This equivalent circuit model is comprised of a DC voltage source in series with a resistor, which symbolizes the internal electrical losses [45]. Actually, the produced hydrogen’s volume ( V H 2 in m3) is calculated using Equation (6):
V H 2 = n c   R   I e z   T   t z   P   F
where n c is the number of electrolyzer cells, z stands for the number of electrons (2 for hydrogen and 4 for oxygen), R is the gas constant (8.3145 J/mol·K), P represents the working pressure of the electrolyzer (Pa),   I e z being the applied current to one of the electrolyzer’s cells (A), F stands for the Faraday constant (96485.33 C/mol), T represents the operating temperature of the electrolyzer (K), and finally t is the operating time of the electrolyzer (second).
The produced hydrogen has to be stored and then used when it is needed by the building. In fact, since hydrogen has a small density at ambient conditions (1 kg of hydrogen is equivalent to 11 m3 [14]), its storage necessitates the increase of its density and thus the diminution of its volume. Actually, based on its application, storage size, temperature, and pressure, different methods of reversibly storing hydrogen exist: (i) its compression into high pressure gas cylinders, (ii) its storage as a liquid, and (iii) its storage in a solid state in the metal and non-metal hydrides [14]. For instance, the high pressure gas cylinders are the most used systems for storing hydrogen, with a maximum pressure of 20 MPa [14]. This is attributed to the fact that they are currently the best known and understood methods [67]. In this case, the hydrogen is in its gaseous state, with a density of 0.089886 kg/m3 at 0 °C and 1 bar [14]. On another note, hydrogen gas, which is not an ideal gas, could be described by the Van der Waals equation (Equation (7)):
P = n R T V n b a n 2 V 2
where P represents the gas pressure (Pa), n being the number of moles (mol), R stands for the gas constant that is equal to 8.314 J/K·mol, T is the gas absolute temperature (K), V represents the gas volume (m3), b being the occupied volume by hydrogen molecules that is equal to 2.661 × 10⁻⁵ m3/mol, and finally a stands for the dipole interaction or repulsion constant, which is equal to 2.476 × 10⁻² m6·Pa/mol2 [14].
As for liquid hydrogen, it can be stored in cryogenic tanks at −253 °C, which is found in a small zone between its triple point and its critical point, and ambient pressure [14]. Since liquefying hydrogen implies an increase of its volumetric energy density (70.8 kg/m3), a reduction of storage volume compared to the high pressure gas cylinders is achieved [67]. However, the liquefaction of hydrogen needs too much energy to be performed, which makes it a very expensive process. The expensive cost of this method is also caused by the fact that the cryogenic tanks have to be thermally insulated in order to avoid the boiling of hydrogen (−252.879 °C) [14]. Finally, hydrogen can be stored in its solid state, with a density equal to 70.6 kg/m3 at a low temperature (−262 °C) [64] in metal-hydrides and non-metal hydrides. For the metal-hydrides, the metals, the intermetallic compounds, and their alloys combine with hydrogen in order to form solid metallic hydrides [14,15,16]. The metal-hydrides are considered to be an excellent alternative to hydrogen storage due to their high volumetric energy density (70.6 kg/m3); however, they have a low specific energy (kWh/kg), which leads to heavier storage tanks. In addition, the high cost of metals makes their use on small-scale applications limited [67]. For these reasons, the non-metal hydrides have attracted much interest these last years due to their small weights [67]. They are a combination between some reactive non-metals, mainly, carbon, boron, nitrogen and oxygen, and hydrogen [67]. Alas, they still have the issue of not binding with hydrogen as strongly as the metal-hydrides [67].
In this work, we have chosen to store it in its gaseous state using pressurized tanks. The pressurized tanks used in this work have a recommended charging pressure of 10 bar, a maximum storage temperature of about 50 °C, and a storage capacity of 500 l. Besides, since the electrolyzer works on the same pressure as the hydrogen tanks (10 bar), there is no need for a dedicated compressor, and then V H 2 is also the volume of hydrogen stored in the pressurized tanks.

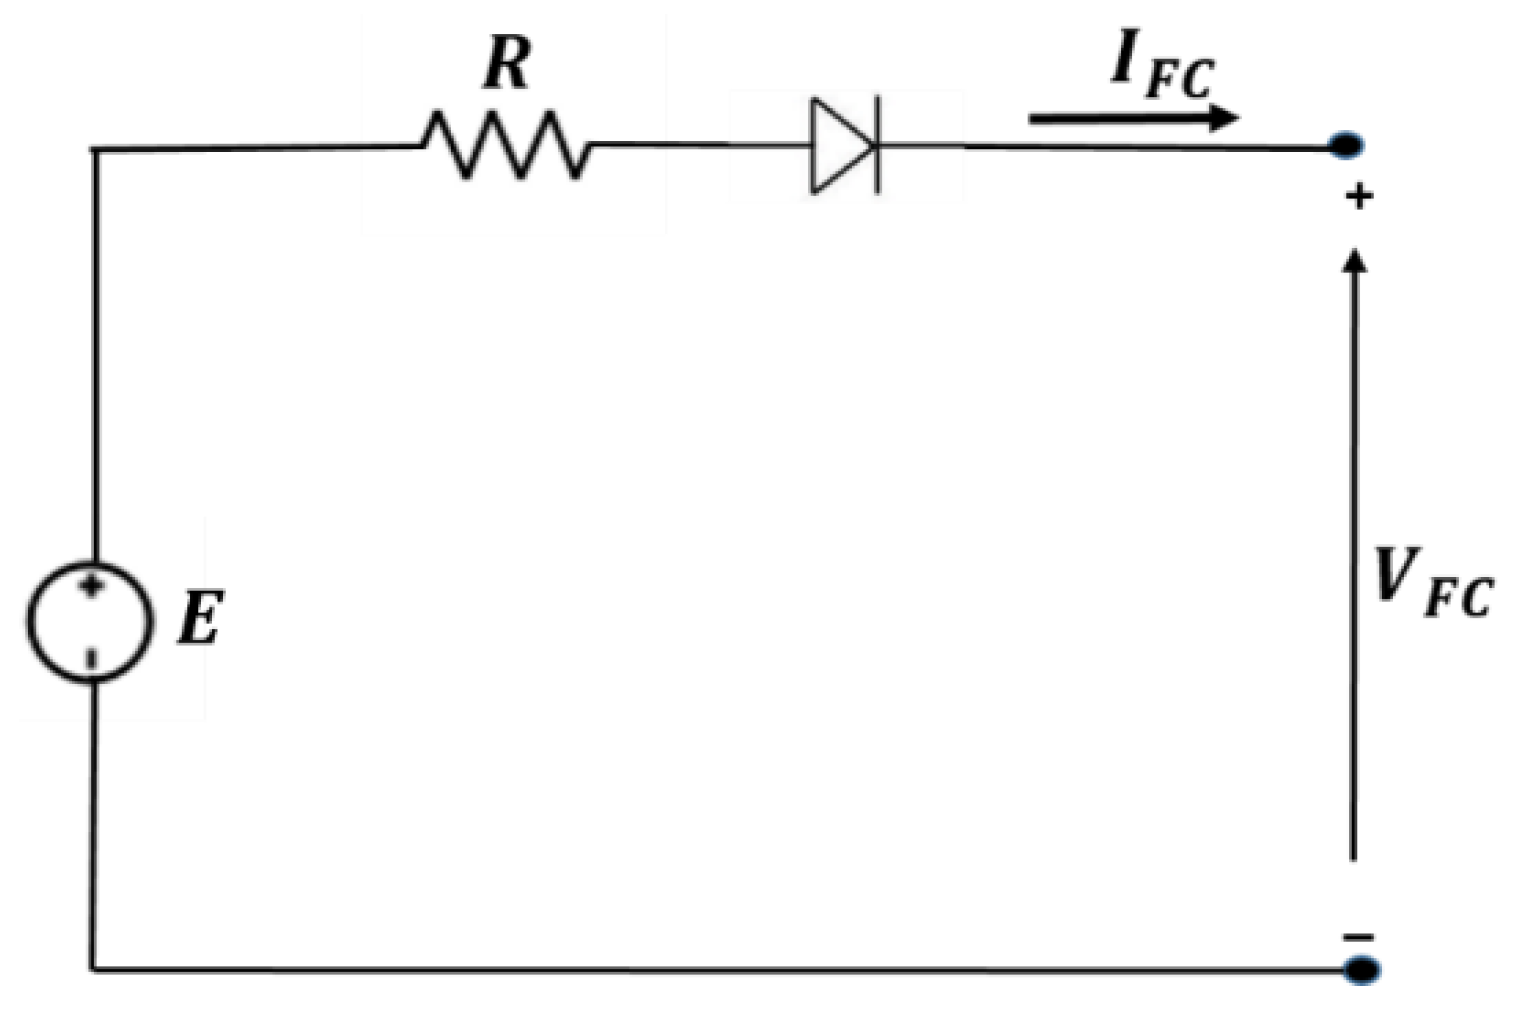
3.3. Fuel Cell’s Model

Fuel cells have been extensively used these last decades in both vehicles and buildings for producing valuable electricity, thermal energy, and water from the combination of hydrogen and oxygen. This is attributed to their various benefits, mainly, cleanliness, modularity, low noise level, and higher efficiency, which could achieve 85–90% [13,22]. Actually, based on the operating temperature and the used fuel and electrolyte, fuel cells are categorized into different types, mainly, alkaline fuel cells (AFCs), phosphoric acid fuel cells (PAFCs), sulphuric acid fuel cells (SAFCs), proton exchange membrane fuel cells (PEMFCs), molten carbonate fuel cells (MCFCs), direct methanol fuel cells (DMFCs), solid polymer fuel cells (SPFCs), and solid oxide fuel cells (SOFCs) [24,30,31]. In fact, the most suitable fuel cells for micro-cogeneration applications are the low temperature PEMFCs working around 80 °C, and the high temperature SOFCs operating in the range of 600–1000 °C. However, the PEMFC, which is comprised of two platinum catalyzed porous electrodes and separated by a solid polymeric membrane electrolyte, is still the most used for micro-cogeneration applications. This is attributed to its multiple benefits, mainly, high power density, quick start-up and load following, less corrosion, and a low operating temperature [22,32].
Like the PEM electrolyzer, the PEMFC is comprised of a cathode, an anode, and a solid polymer membrane (electrolyte). It is an electrochemical device that generates electricity, thermal energy, and water from the exothermic reaction between hydrogen and oxygen. Actually, hydrogen, which is delivered to the anode, is divided into electrons (e) and hydrogen protons (H+). The latter goes across the solid polymer membrane in order to achieve the cathode. In this latter, the oxygen (oxidant) has been provided, and thus it is combined with hydrogen protons in order to form water (H2O) [29]. The reactions that take place at the PEMFC’s anode and cathode can be expressed by Equations (8) and (9), respectively:
H 2   2 H + + 2 e
2 H + + 1 2 O 2 + 2 e   H 2 O
Concerning the modeling of PEMFCs, several models (i.e., analytical [52], mechanistic [52,54], and empirical [52,54]) and software tools [68] have been developed and reported in the literature for estimating and predicting their current/voltage relationship, and assessing their behavior under different circumstances. In our simulations, and for the sake of simplicity, we used the model developed and presented in [57] for the purpose of assessing the performance of our PEMFC and, therefore, estimating the amount of produced electrical energy. The used model is comprised of a controlled voltage source in series with a resistor, as presented in Figure 5.
A diode was also used in order to prevent the current flowing into the fuel cell’s stack. From the electrical circuit of the fuel cell, which is presented in Figure 5, the fuel cell’s stack voltage ( V F C ) is computed using Equation (10):
V F C = E R I F C
where I F C is the fuel cell’s stack current (A), R being the internal resistance (Ω), and E stands for the controlled voltage source (V). The detailed description of this model as well as the computation of the controlled voltage source ( E ) are presented in [57]. Besides, the amount of generated thermal energy is computed using the enthalpy change Δ H r of the reaction, which is equal to −285.84 kJ/mol of H 2 , especially when the generated water is in a liquid state. The enthalpy change of this exothermic reaction is expressed by Equation (11):
Δ H r = Δ G + T Δ S
where Δ G represents the Gibbs free energy, T being the stack’s temperature, and Δ S stands for the entropy [65]. The reaction’s enthalpy change is divided into three fractions: (i) the amount of energy responsible for the water vaporization ( Δ H v a p = 44.01 kJ/mol), (ii) the Gibbs free energy that represents the maximum usable produced energy (i.e., electrical and thermal energy) ( Δ G = −237.2 kJ/mol of H 2 ), and finally (iii) the amount of generated heat ( T Δ S = −4.63 kJ/mol of H 2 ) [22]. However, only a small fraction of the Gibbs free energy could be used to supply the building with both electrical and thermal energy, since most of it is used for increasing the hydrogen gas temperature as well as the temperature of the fuel cell, mainly the frame, the electrodes, and the electrolyte. The amount of the energy, which is lost being used in increasing the temperature of the fuel cell as well as the hydrogen gas, is calculated using Equation (12):
Q l o s t = m C p ( T f i n a l T i n i t i a l )
where m is the mass of the fuel cell’s components (kg), C p stands for the specific heat capacity of the fuel cell’s components (kJ/kg.K), and T f i n a l and T i n i t i a l represent the final and the initial temperature of the fuel cell’s components, respectively (K).

4. Simulation and Experimental Results

This section focuses on the simulations and experimentations of the deployed hybrid system. This was performed in two phases. First, technical integration and testing was carried out in order to validate the components of the system. Besides the technical integration of the components including equipment and software in preparation of the experiments, real testing scenarios were established and tested for validating the system’s models over a short-run period using both simulations and experimentations. In the second phase, virtual test runs were carried out to test the performance of the hybrid system for day-to-day use, and during one year of simulations.

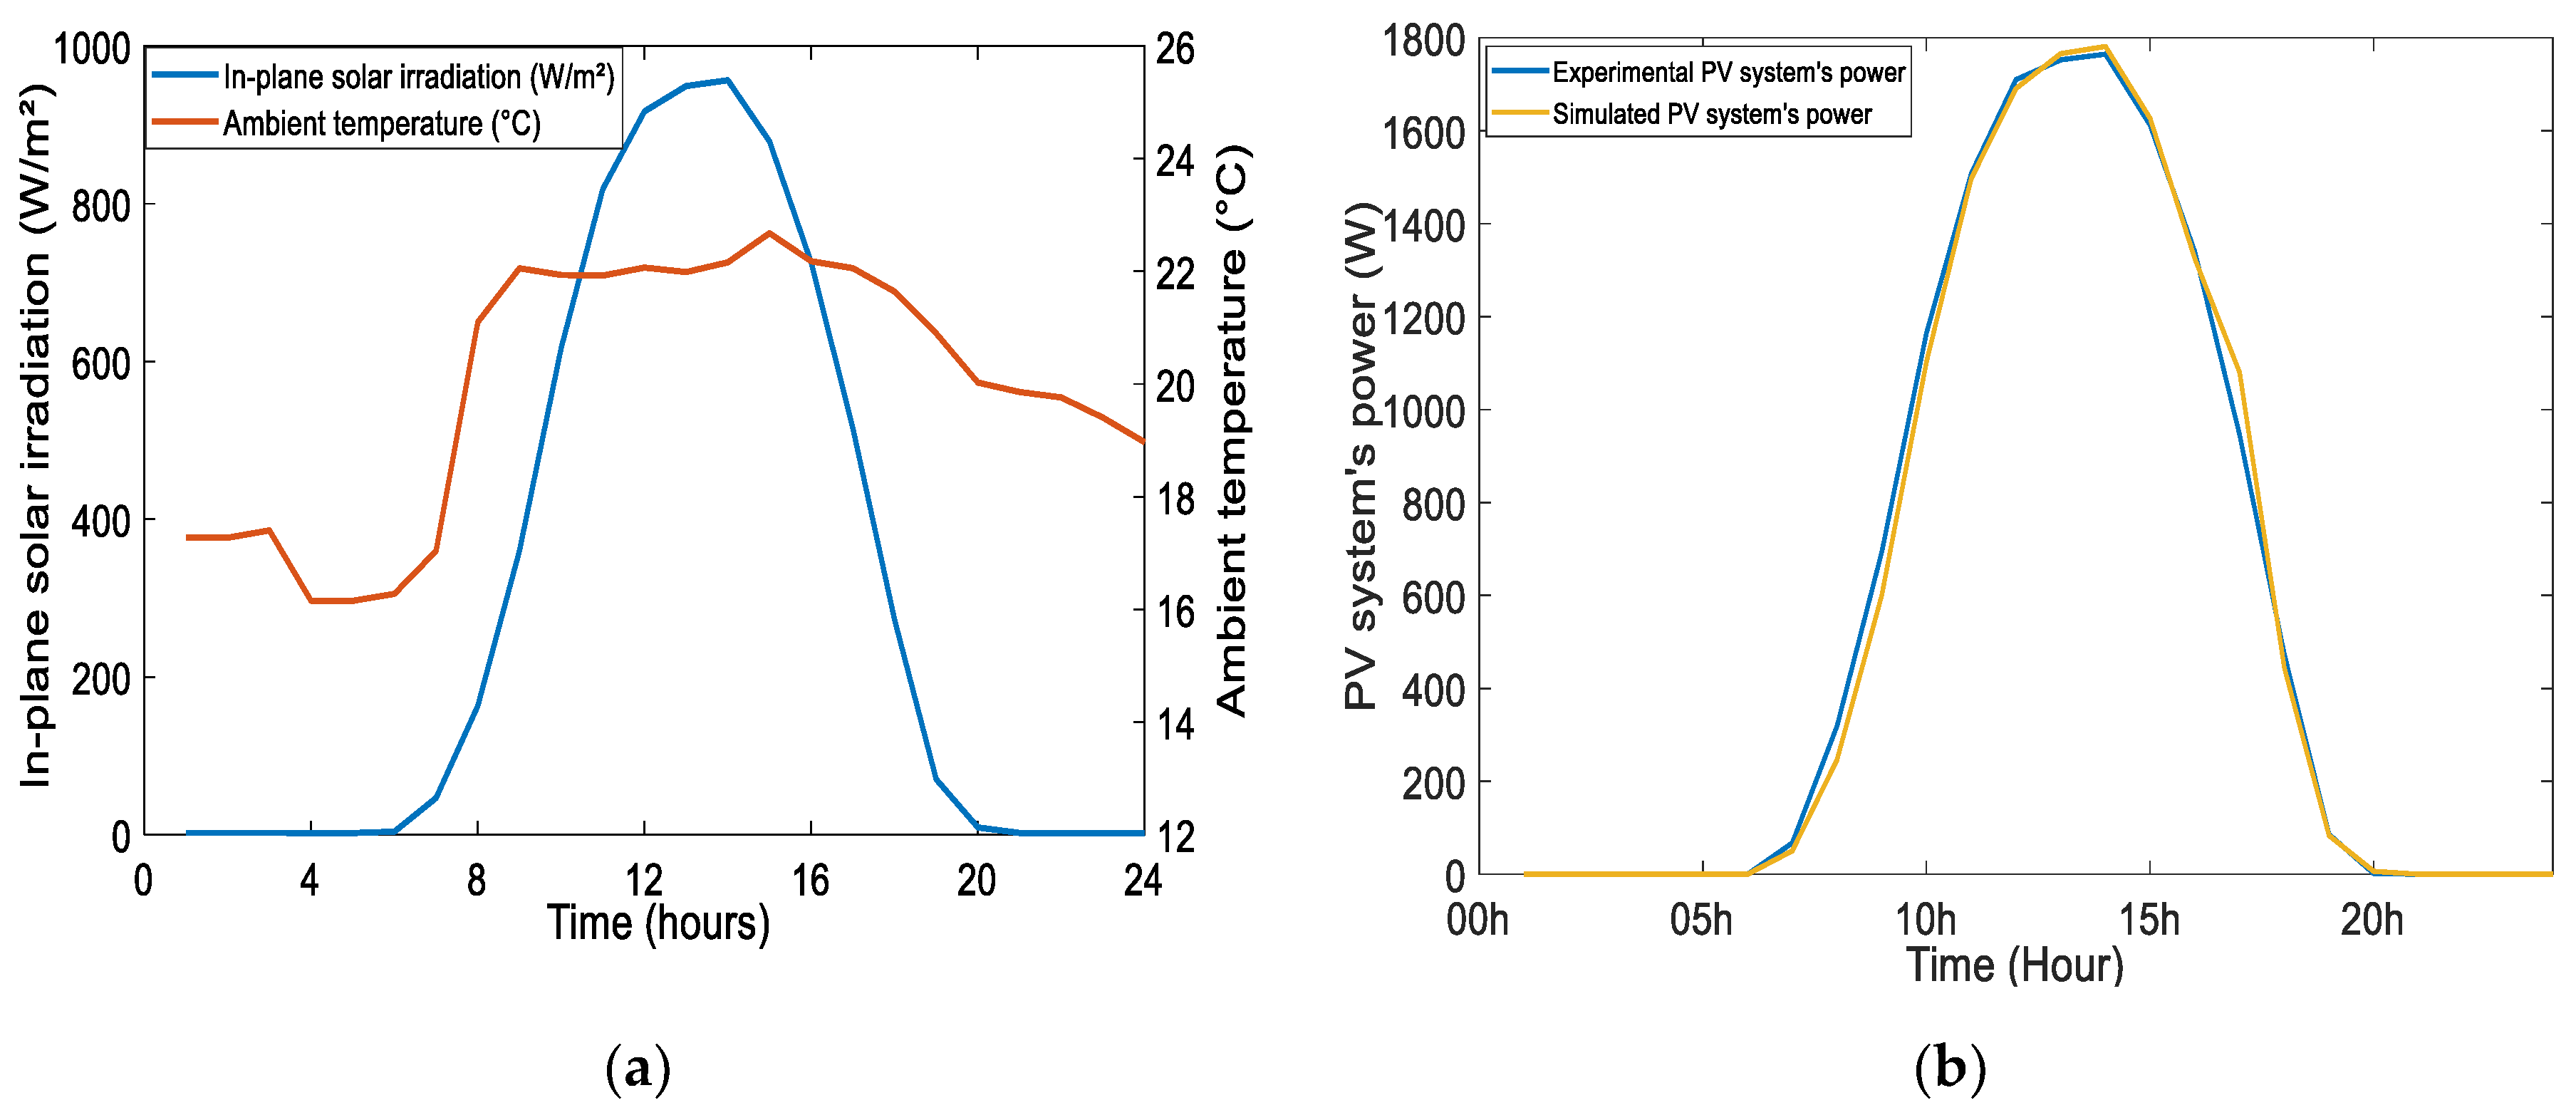
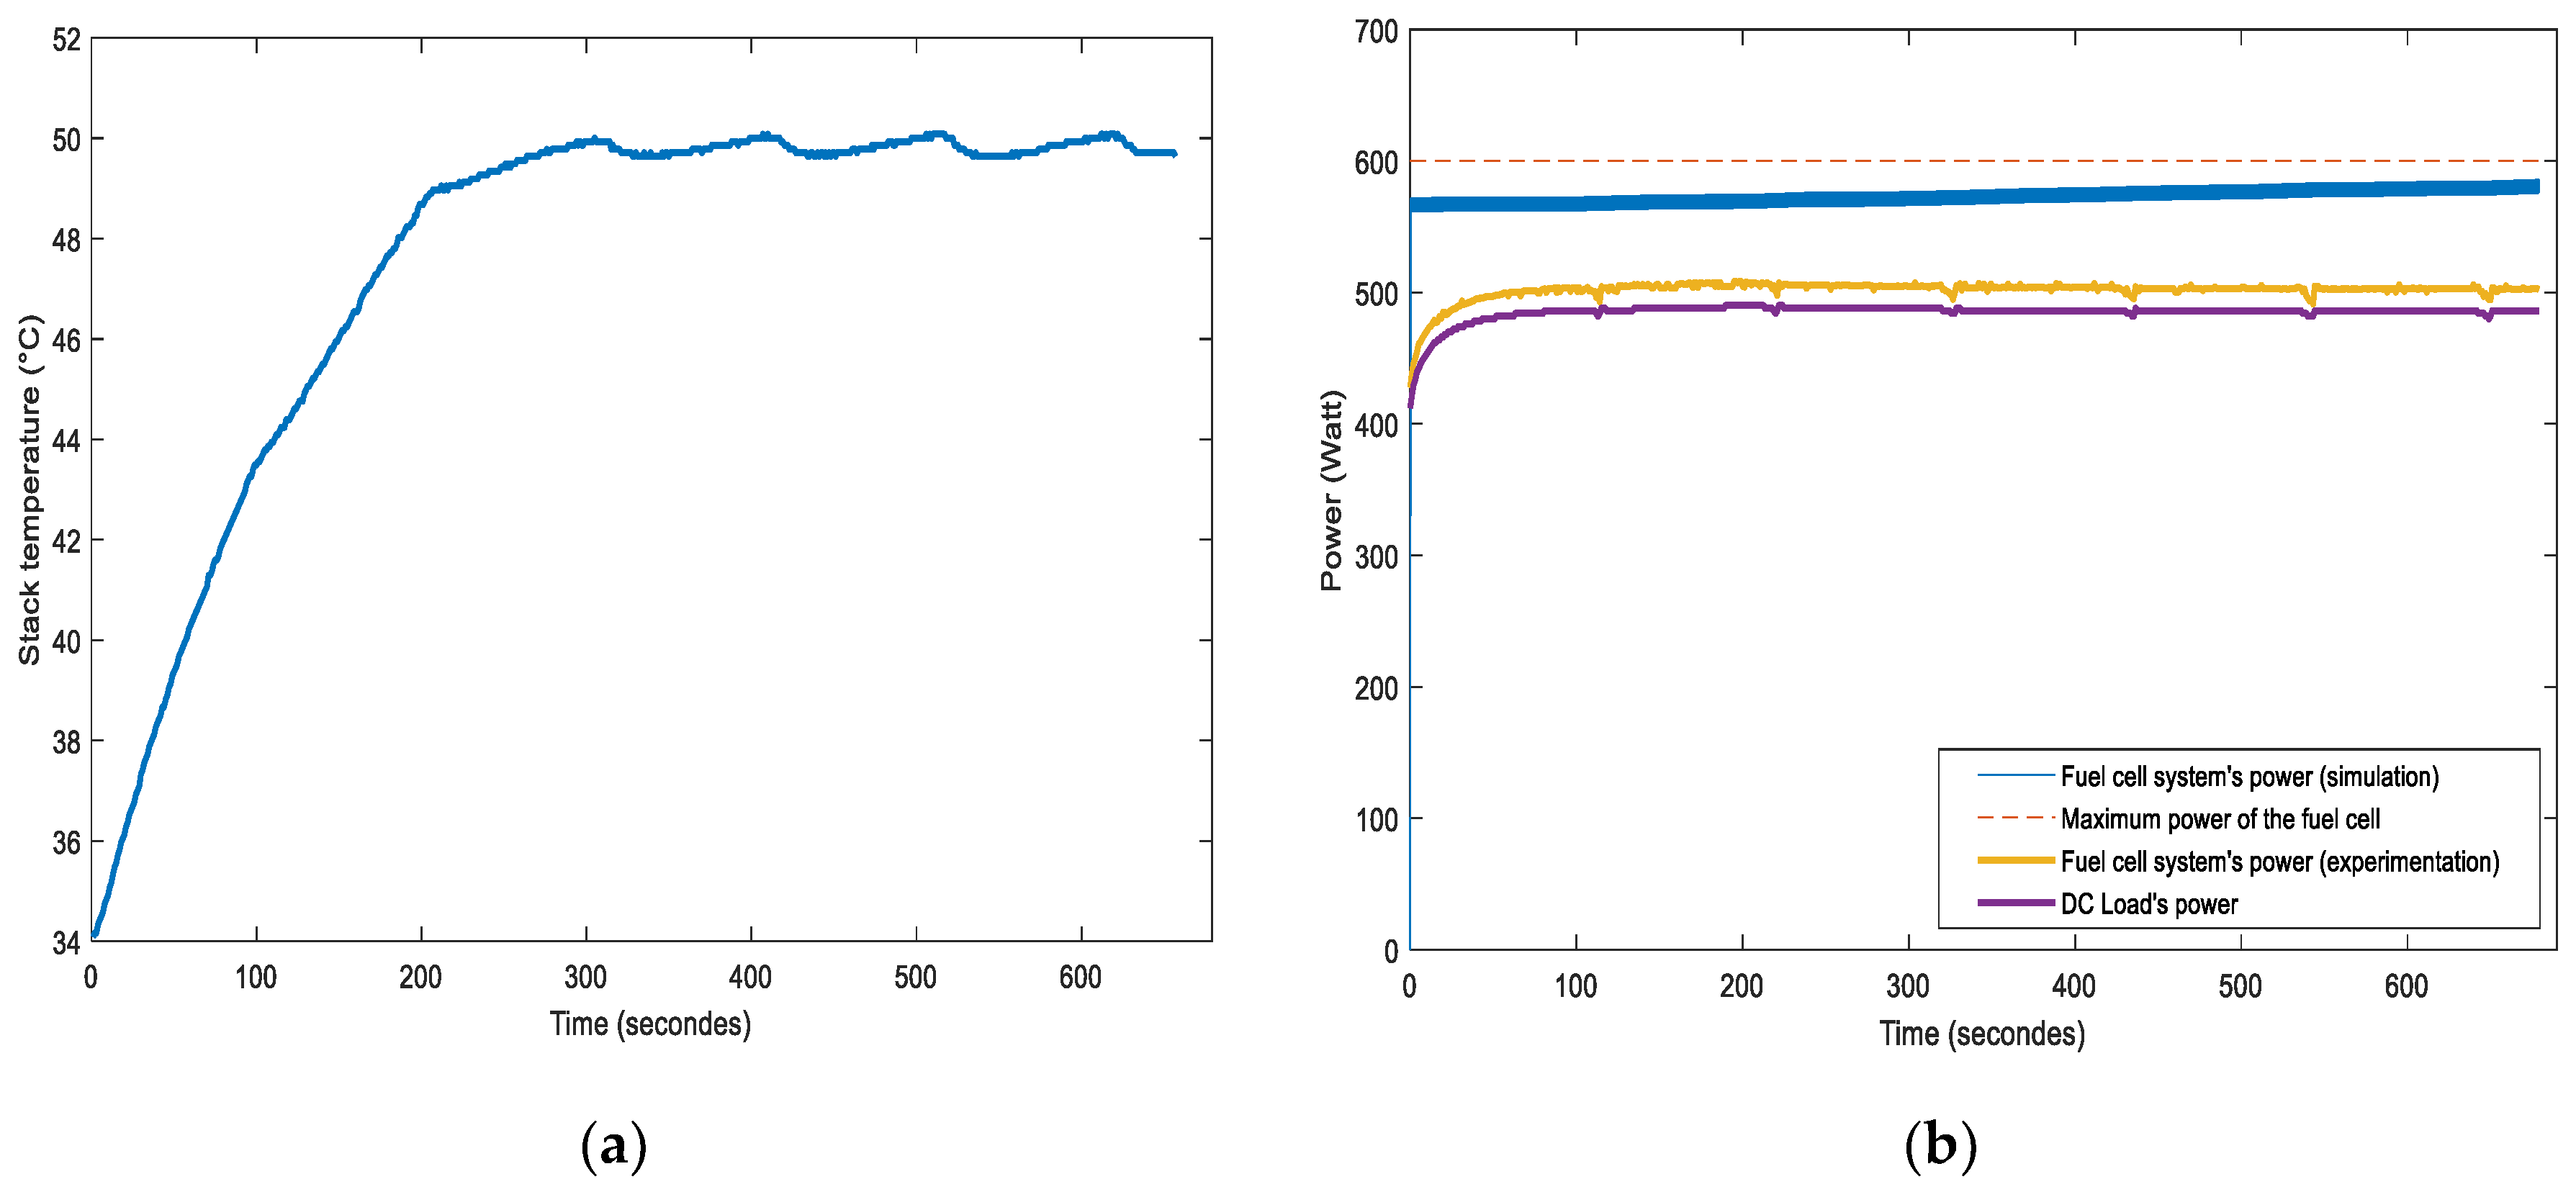
4.1. Results of Short-Term Simulations and Experimentations of the Hybrid System

Regarding the PV system’s model, which is presented in Section 3, it was implemented into MATLAB. Then, it was simulated under the same experimental conditions, namely, the solar irradiation and the ambient temperature, in order to assess the performance of the system. In fact, an experiment was conducted over 24 h in order to collect the data to be used for simulating and validating the system’s model. For instance, Figure 6a depicts the in-plane solar irradiation and the ambient temperature during 24 h. These data were measured using our deployed weather station (more details in [63,64]), and were used in order to simulate the system’s model. In fact, we noticed that the maximum solar irradiation exceeded 900 W/m² and the ambient temperature was moderate. This is attributed to the freshness brought by the Atlantic Ocean. Besides, Figure 6b presents the simulation and the experimental results of the power generated by the PV system during 24 h. We observe that there is no production during the night since there is no solar irradiation. However, after sunrise, the PV production rises until achieving its maximum, which is almost 1.8 kW at midday, and then declines until sunset. Moreover, we observe that the simulation and experimental results match very well. Furthermore, the simulation and experimental produced energies were computed and found equal to 13.3 kWh and 13.44 kWh, respectively. Hence, the relative error between the simulation and experimental results was found equal to 1.04%. This latter shows the accuracy of the system’s model and its good approximation of the real-world scenarios.
Concerning the fuel cell’s modeling, we used the model described in Figure 5 in order to assess its performance and determine the amount of produced electrical and thermal energy [57]. Once the model was implemented into MATLAB/Simulink, many simulations were carried out under the same experimental conditions. The stack’s temperature (Figure 7a) that achieves 50 °C; the H 2 flow rate at the entrance of the fuel cell, which is approximately 5.92 nl/min; and the load’s power (Figure 7b) were measured during the experiment and used as inputs to our model. Then, the simulation and experimental results were reported in order to assess the fuel cell’s performance and determine the amount of produced electrical and thermal energy. Figure 7b depicts the simulation and experimental results of the fuel cell system as well as the load’s power. We can obviously observe that the fuel cell system’s power is always higher than the load’s power in both the simulation and experiment. The difference between the experimental fuel cell system’s power and the load’s power, which is around 20 W, is consumed by the auxiliary components (e.g., valves, fans), which are extremely needed for the fuel cell’s operation. Besides, the difference between the simulated and experimental power of the fuel cell is attributed to the fact that its electrical efficiency was taken in the simulation equal to 50%; however, this efficiency varied around 50% in the experiment according to the load’s consumption. On another note, the difference between the reference electric power ( P R ) given by the manufacturer for a 50% efficiency (600 W) and the simulated fuel cell system’s power does not achieve 10%, as depicted in Figure 7b. This shows the accuracy of the fuel cell’s model.
Regarding the amount of generated thermal energy, it was estimated using the reaction’s enthalpy change. In fact, we used the hydrogen flow rate, which was converted into mol/min using the hydrogen’s density and molar mass, and the system’s efficiency, which was approximately equal to 50%, in order to compute the total amount of generated thermal energy. This latter was found approximately equal to 33.58 KJ/min. Accordingly, the total amount of the generated heat throughout the entire experiment was 380.46 kJ. Alas, most of this energy was used for increasing the fuel cell’s temperature (e.g., frame, electrodes, and electrolyte) and the hydrogen gas temperature. The amount of energy used for increasing the fuel cell’s temperature was found approximately equal to 379.14 kJ. It was computed by Equation (12) using the mass of the fuel cell, the stack’s temperature, and the average specific heat capacity of the fuel cell’s components (0.881 KJ/Kg.K for the frame and 1.32 KJ/Kg.K for the electrodes and electrolyte). Moreover, the quantity of energy consumed for preheating hydrogen was found to be 0.0268 kJ. It was computed by Equation (12) using the hydrogen flow rate that was converted into kg/min, the specific heat capacity of hydrogen (10.140 kJ/kg.K), and the difference of hydrogen’s temperature, which did not exceed 0.5 °C. Hence, the amount of usable energy, which could be released outside the fuel cell, was approximately 1.2930 kJ.
For the aim of comparing the theoretical and experimental results and thus validating this computation methodology, the temperature of the air trapped into the box (Figure 2) was measured. Figure 8 presents the variation of the temperature of the air trapped into the box (the average value of the three sensors). Then, for computing the heat released by the fuel cell, we assumed that the air’s density did not change with temperature. So, the released heat was computed by Equation (1) using the density of the air (1.2 kg/m3), the volume of the air trapped in the box (0.0478 m3), the specific heat capacity of the air (1.005 kJ/kg.K), and the temperature variation throughout the experiment (K). The amount of released heat was found equal to 1.265 kJ. Therefore, we concluded that the theoretical and experimental results were approximately similar, with a slight error (a relative error of about 2.2%). This error could be provoked by many reasons, mainly the measurement noises and the lack of stability of the temperature sensors, the box was not totally insulated, and not taking into consideration the variation of some factors with temperature such as air density.
After validating the system’s components models, they were connected and used in order to simulate and assess the performance of the proposed hybrid system (Figure 1) during one year. It is worth noting that the electrolyzer was not modeled, but we used the manufacturer data, since it was not operating well during our experiment.

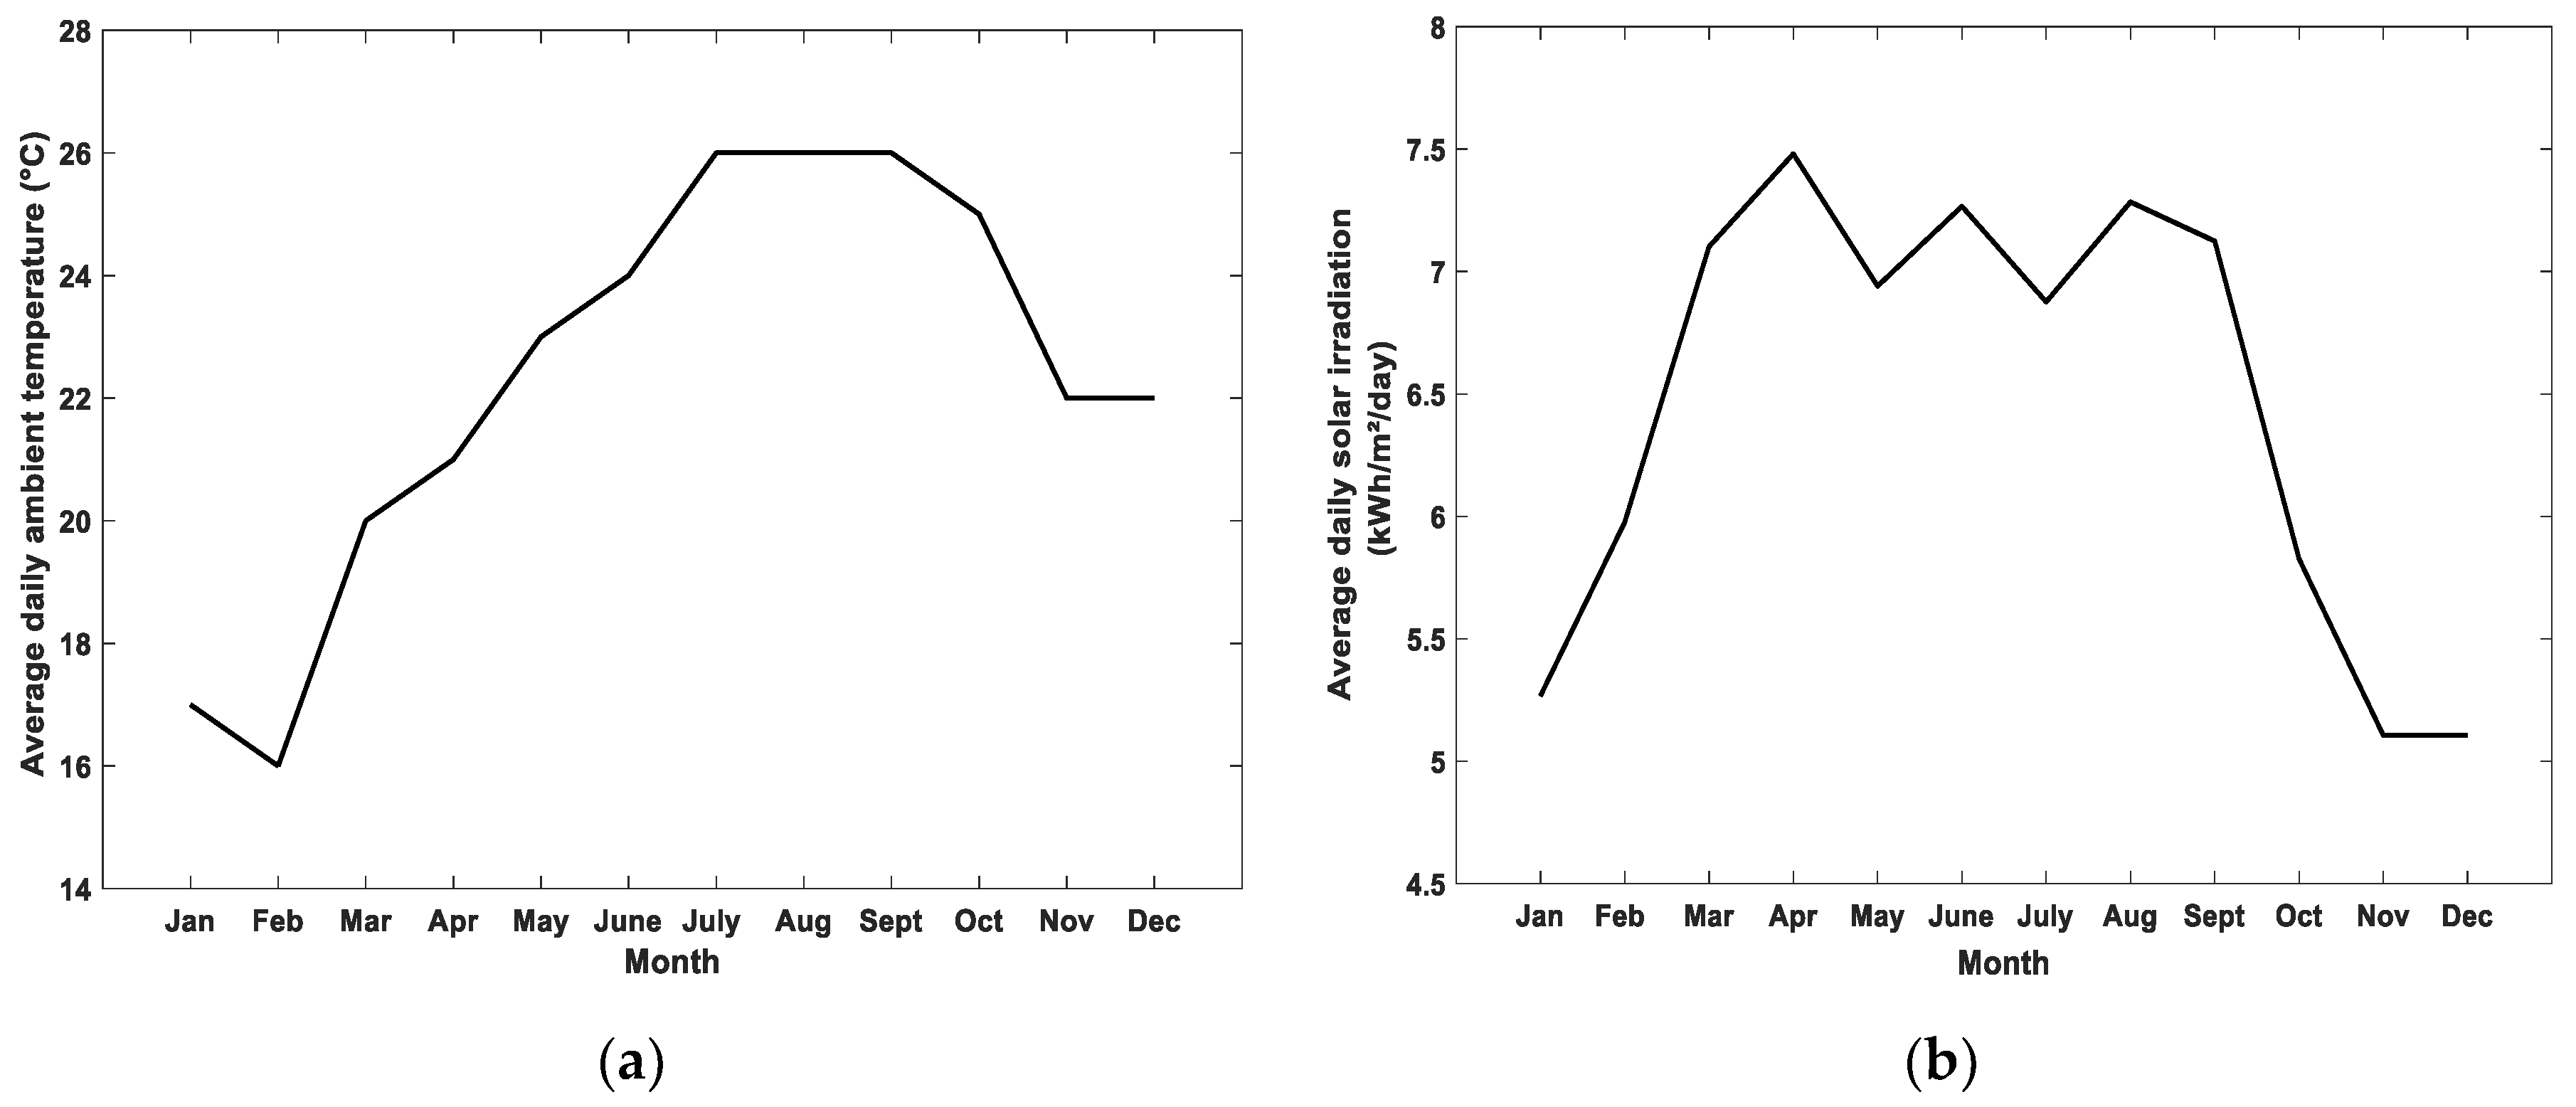
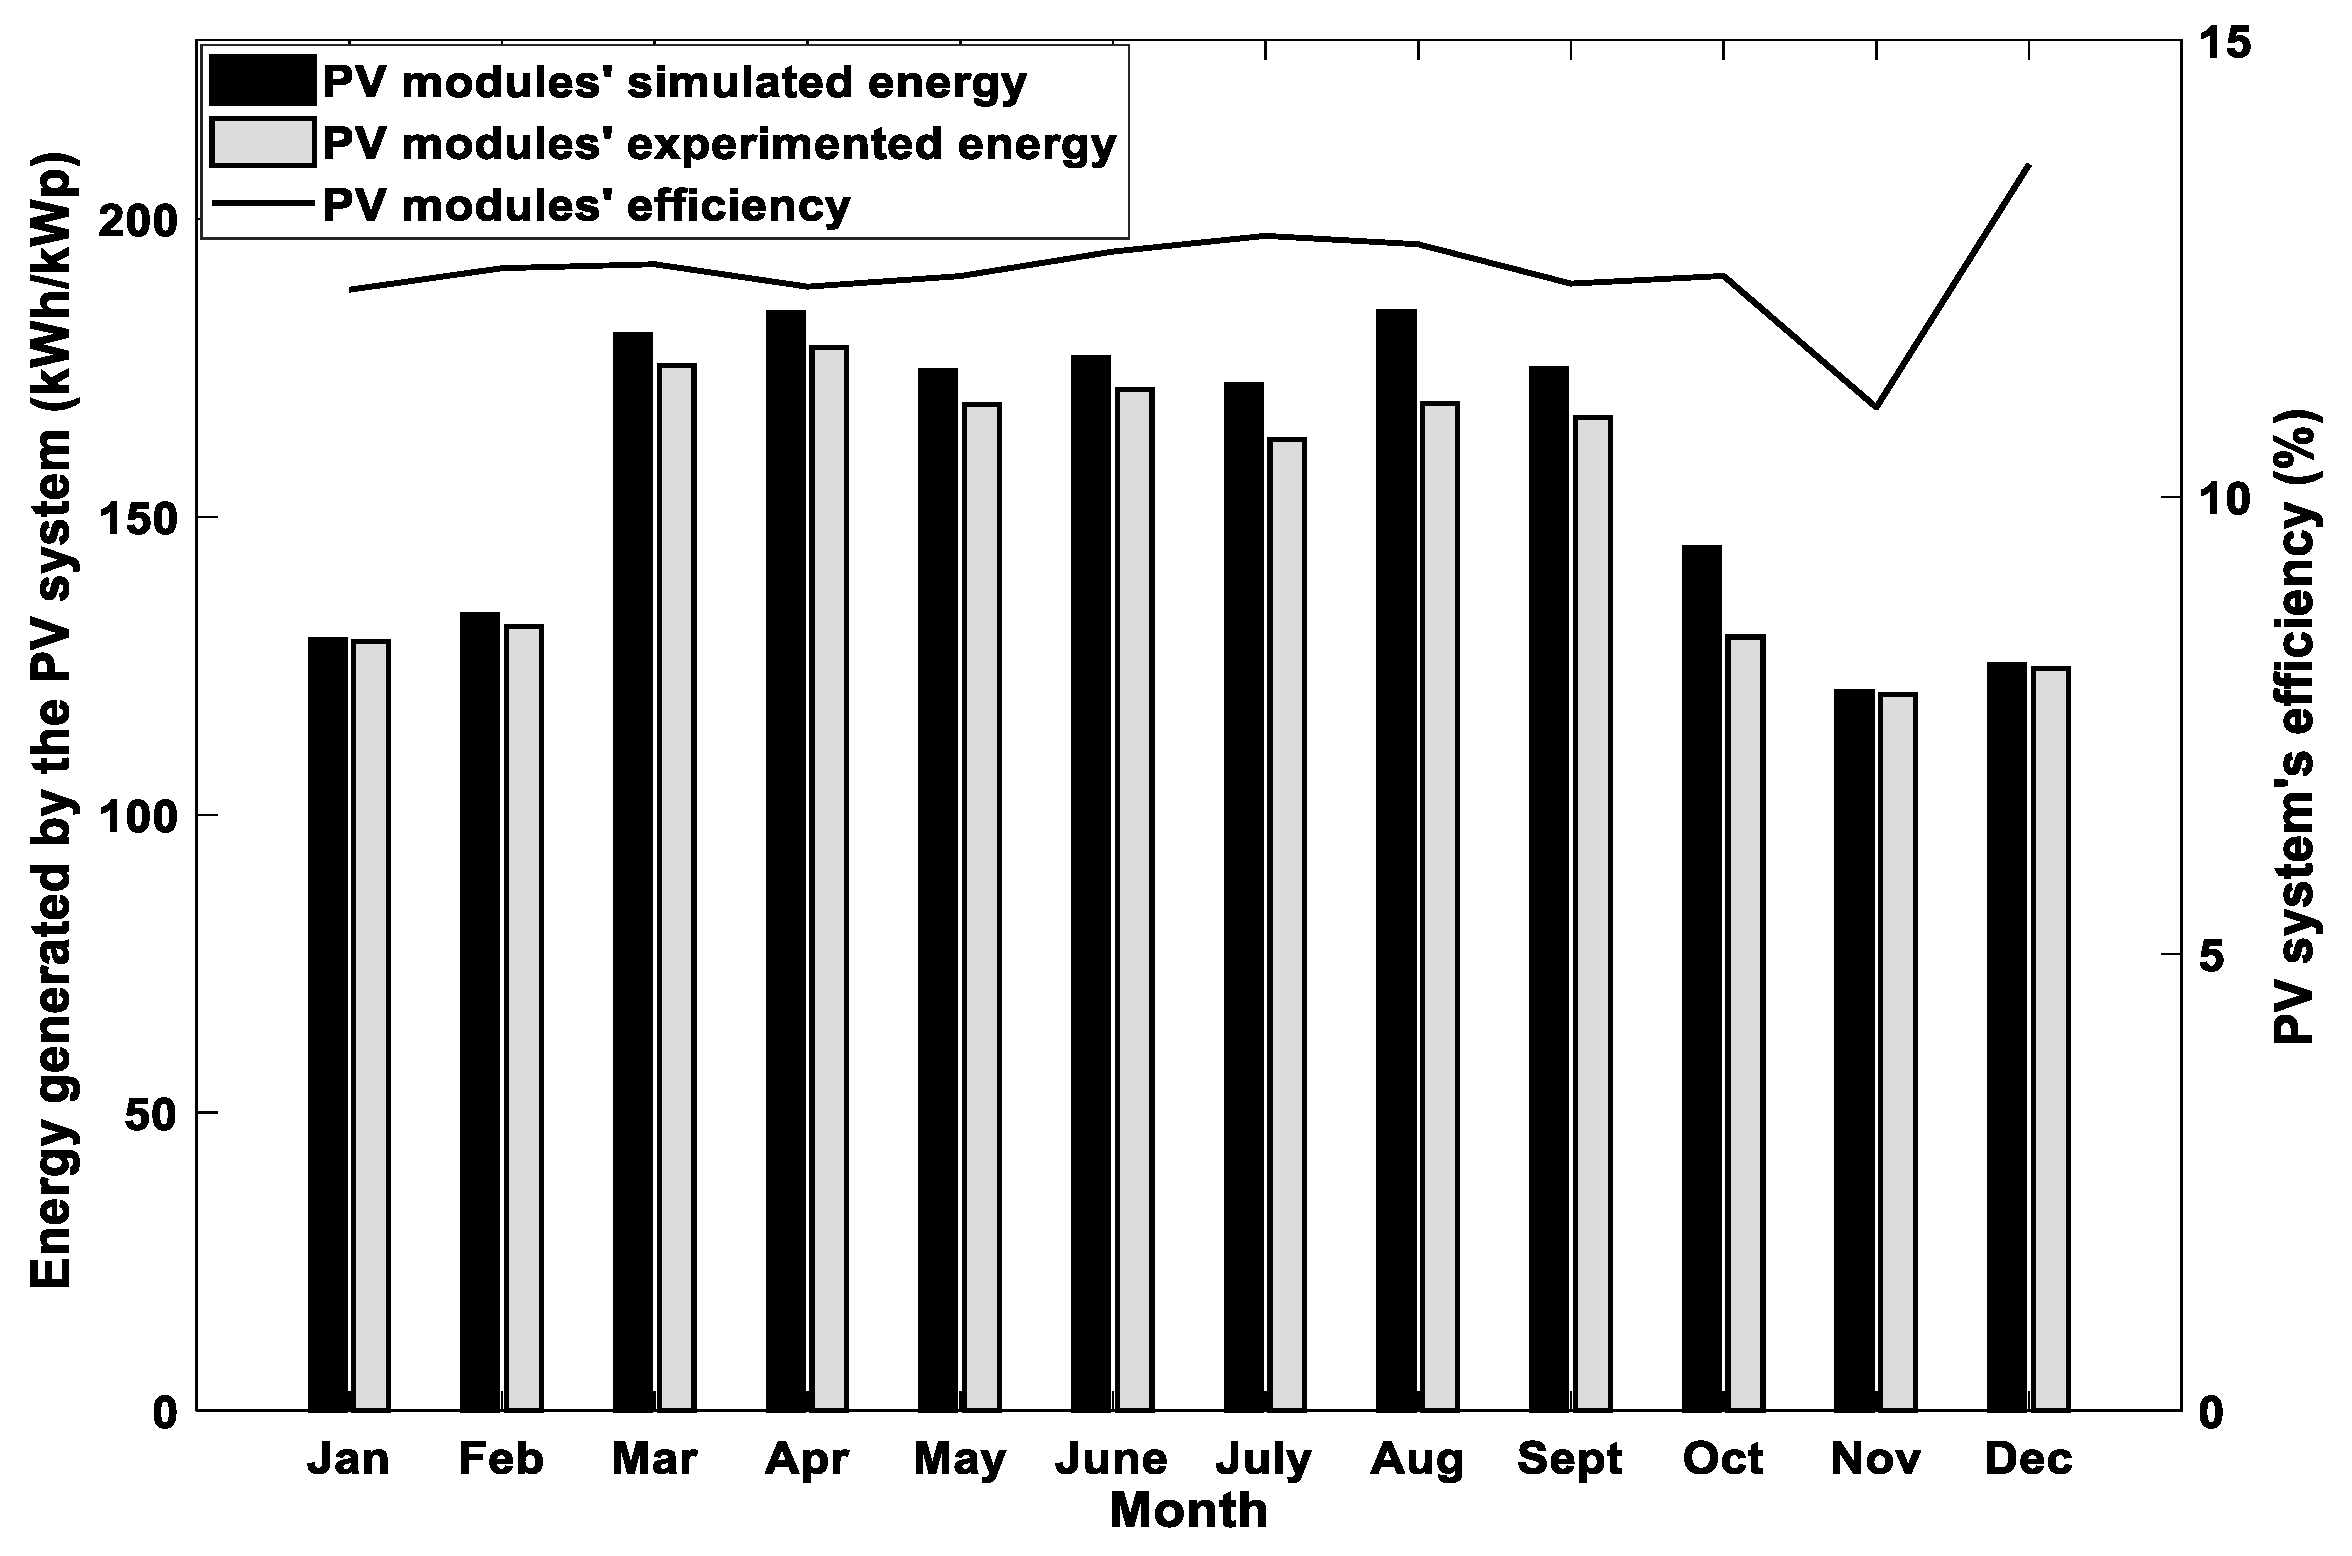
4.2. Results of Long-Term Simulations of the Hybrid System

The proposed hybrid system was simulated during one year in order to evaluate its behavior and assess its performance when supplying the building with both valuable electricity and thermal energy. Concerning the PV system, its evaluation was based on the computation of some important performance indicators, namely, the total produced energy ( E A C ), the system’s efficiency ( η s y s t e m ), and the performance ratio ( P R ). Thus, the PV model was simulated under MATLAB and experimented under the same conditions, which were the ambient temperature and the solar irradiation presented in Figure 9. In fact, we have also presented the experimental results of the PV system since we already had related data. Therefore, the simulation and experimental results of the monthly energy generated by the PV system during one year were computed using Equation (13) and compared in order to assess the performance of the PV system. In addition, the system’s efficiency was calculated using Equation (14) for the purpose of assessing its performance [59].
E A C , m = i = 1 i = N E A C , d
η s y s t e m , m = E A C , d G t , d × S P V 100
where E A C , m and E A C , d are the total monthly and daily energy produced by the PV system (kWh/kWp), respectively, N being the number of days of a month, G t , d stands for the monthly average daily solar irradiation received by the surface of the PV modules (kWh/m²), and S P V represents the PV system’s surface that is equal to 13.41 m².
Figure 10 depicts the simulated and experimental monthly energy generated by 1 kWp of the PV system (kWh/kWp) as well as the PV system’s efficiency (%) over the whole period. We can obviously observe that the produced energy by the PV system varies between a minimum value of about 120 kWh/kWp, which corresponds to the month of November (winter period), and a maximum value of around 180 kWh/kWp, which corresponds to the month of April (spring period). Moreover, the annual produced energy by 1 kWp of the PV system is almost 1828 kWh/kWp per year, with an annual in-plane solar irradiation of about 2353 kWh/m². On another note, the annual error between the simulation and the experimental monthly produced energy was around 3.9%. Thus, we conclude that the PV system’s model gives a good approximation of the real-world scenarios with a slight error. Besides, we noticed that the average system’s efficiency decreased from 15% (the manufacturer’s efficiency) to 12.5% (the experimental efficiency), which was principally provoked by the weather conditions.
This decrease in the PV system’s efficiency could also be noticed in other performance indicators, especially the performance ratio ( P R ), which is the ratio between the actual and the theoretically produced energy. It is an indicator that gives detailed information concerning the overall losses in the PV system, and it depends on several parameters (e.g., the quality of the cables, the efficiency of the converters). It is calculated using Equation (15):
P R = E A C     G S T C G m     P P V ,   S T C
where E A C   is the energy produced by the PV system (kWh),   G S T C stands for the solar radiation on the PV modules at STC (standard test conditions, which are 1000 W/m² solar irradiation and 25 °C temperature), G m   represents the in-plane solar irradiation (kWh/m²), and P P V ,   S T C being the rated power of the installed PV system at STC. We found that the performance ratio was approximately equal to 79%. Accordingly, its high value discloses the good behavior and performance of the PV system during the whole year.
Then, the produced energy by the PV system could be either injected into the traditional electricity grid or used directly by an electrolyzer in order to produce hydrogen. For instance, the injected electricity into the electric grid could be used to produce hydrogen when needed in any other location. This electricity could be also used locally or stored in the form of hydrogen to be used when needed. The particularity of the first case is that the two processes (i.e., electricity production using PV panels and hydrogen generation by means of electrolyzer) could be carried out in different locations, which are connected through the traditional electricity grid. In this manner, electricity would be transported instead of hydrogen, which has various benefits (e.g., security, less losses, less expensive). However, the only drawback of this process is that we would have more losses (e.g., the Moroccan electric power transmission and distribution losses are almost 15% [69]). Therefore, we will study the second case in this article, and thus all the produced energy by the PV system was directly converted into hydrogen. Hence, based on the electricity produced by the PV panels (Figure 10); the electrolyzer’s efficiency, which was around 63% [70]; and the heating value of hydrogen [71], the volume of produced hydrogen was determined. The volume of produced hydrogen in each month of the year is presented in Figure 11. Besides, the annual volume of hydrogen produced by 1 kWp of the PV system was almost 393 Nm3 if the hydrogen was compressed under 10 bar. Finally, it is worth noting that the experimental results are unfortunately not presented here since the electrolyzer was not operating well, and we kept only the simulated results.
This produced and stored hydrogen will be used by the above-mentioned fuel cell in order to provide the building with both valuable electrical and thermal energy. Therefore, we have computed the monthly produced electricity by the fuel cell, which is depicted in Figure 12, using the fuel cell’s electrical efficiency as well as the hydrogen’s heating value. As a result, an electrical energy as well as an equivalent amount of thermal energy of about 589 kWh/year could be generated. The produced electricity could be used in order to provide the building’s appliances with the needed electricity, while the produced thermal energy could be used for either heating the building during the winter time using an air to air exchanger or cooling it during the summer period using a refrigeration process.
Accordingly, the electrical efficiency of the whole system was about 32%. However, its overall efficiency reached almost 64.5% when taking into account both produced electricity and thermal energy. These results show the effectiveness of the studied system when providing the building with both valuable electrical and thermal energy.

5. Conclusions and Perspectives

The aim of this work was towards efficient integration of a hybrid system into buildings together with its performance assessment. Therefore, we have focused on the modeling, simulations, experimentations, and performance assessment of the proposed hybrid system. The latter is comprised of a photovoltaic system, hydrogen electrolyzer, and PEM fuel cell operating as a CHP system to provide the building with both electricity and thermal energy. Several simulations and experiments were carried out first in order to show the accuracy of the developed models and assess the system’s performance. Reported results showed the accuracy of the developed models in analyzing the system’s performance. The validated models were afterwards used for long-run simulations (one year), and results were reported to show the effectiveness of the hybrid system. Accordingly, the system’s electrical efficiency was almost 32%. However, its overall efficiency reached 64.5% when taking into account both produced electricity and thermal energy. These results show the effectiveness of the studied hybrid system when providing the building with both valuable electricity and thermal energy. It is noteworthy that the proposed system and computation methodology could be scaled up according to the system’s size, and could be simulated and experimented under different conditions of any location. Our ongoing work puts more emphasis on the performance assessment of the proposed system when including the use of the thermal energy (i.e., the efficiency of the air to air exchanger (heating) and the refrigeration process (cooling)).

Author Contributions

Conceptualization, S.B., M.K., and M.B.; data curation, S.B. and M.K.; formal analysis, S.B., M.K., M.B., and M.S.; funding acquisition, M.K. and M.B.; investigation, S.B., M.K., and M.S.; methodology, S.B., M.K., and M.B.; project administration, M.K., M.B., and K.Z.-d.; resources, M.K., M.B., and K.Z.-d.; software, S.B.; supervision, M.K., M.B., R.O., and K.Z.-d.; validation, S.B., M.K., M.B., and M.S.; visualization, S.B., M.K., and M.B.; writing—original draft, S.B.; writing—review and editing, S.B., M.K., and M.B. All authors have read and agreed to the published version of the manuscript.

Funding

This research is funded by USAID under the PEER program, grant number 5-398. It is also partially funded by IRESEN, grant number InnoPV.13.PROPRE.MA.

Acknowledgments

This work is funded by the MIGRID project (grant 5-398, 2017-2019), which is funded by USAID under the PEER program. In addition, this work is a part of the “PROPRE.MA” project, which has been sponsored by IRESEN (Morocco) since February 2014. In the name of all the rest of the consortium members, the authors would like to thank the IRESEN Board and Scientific Committee for financing this project through the INNO’PV Program as well as its general manager, Badr IKKEN, and the rest of the staff for their daily efforts. The authors are grateful to all the other members of the PROPRE.MA consortium. Finally, we have to mention that this article is an extended version of our paper “Boulmrharj, S.; Khaidar, M.; Siniti, M.; Bakhouya, M.; & Zine-dine, K. Towards performance assessment of fuel cell integration into buildings. ICEER 20149, Energy Reports 2020, 6, 288–293,” which was presented at ICEER 2019 and published in Energy Reports.

Conflicts of Interest

The authors declare no conflict of interest.

References

  1. Feron, S. Sustainability of Off-Grid Photovoltaic Systems for Rural Electrification in Developing Countries: A Review. Sustainability 2016, 8, 1326. [Google Scholar] [CrossRef] [Green Version]
  2. Jaramillo-Nieves, L.; Del Río, P. Contribution of Renewable Energy Sources to the Sustainable Development of Islands: An Overview of the Literature and a Research Agenda. Sustainability 2010, 2, 783–811. [Google Scholar] [CrossRef] [Green Version]
  3. Schirone, L.; Pellitteri, F. Energy Policies and Sustainable Management of Energy Sources. Sustainability 2017, 9, 2321. [Google Scholar] [CrossRef] [Green Version]
  4. Boulmrharj, S.; NaitMalek, Y.; Elmouatamid, A.; Bakhouya, M.; Ouladsine, R.; Zine-Dine, K.; Khaidar, M.; Siniti, M. Battery Characterization and Dimensioning Approaches for Micro-Grid Systems. Energies 2019, 12, 1305. [Google Scholar] [CrossRef] [Green Version]
  5. El Ibrahimi, M.; Khay, I.; El Maakoul, A.; Moussa, M.O.; Barkaoui, A.; Bakhouya, M. Anaerobic co-digestion in a liquid recirculation pilot-scale reactor: Thermal and hydraulic study. Energy Rep. 2020, 6, 496–502. [Google Scholar] [CrossRef]
  6. Fossil Fuel Energy Consumption (% of Total). Available online: https://data.worldbank.org/indicator/eg.use.comm.fo.zs?end=2015&start=1960 (accessed on 15 February 2020).
  7. Othieno, H.; Awange, J. Energy Resources in Africa, Distribution, Opportunities and Challenges; Springer: New York, NY, USA, 2016. [Google Scholar]
  8. Sahbani, S.; Mahmoudi, H.; Hasnaoui, A.; Kchikach, M. Development Prospect of Smart Grid in Morocco. Procedia Comput. Sci. 2016, 83, 1313–1320. [Google Scholar] [CrossRef] [Green Version]
  9. Aqachmar, Z.; Allouhi, A.; Jamil, A.; Gagouch, B.; Kousksou, T. Parabolic trough solar thermal power plant Noor I in Morocco. Energy 2019, 178, 572–584. [Google Scholar] [CrossRef]
  10. Samus, T.; Lang, B.; Rohn, H. Assessing the natural resource use and the resource efficiency potential of the Desertec concept. Sol. Energy 2013, 87, 176–183. [Google Scholar] [CrossRef] [Green Version]
  11. Bajracharya, Q. Dynamic Modeling, Monitoring and Control of Energy Storage System. Master’s Thesis, Karlstad University, Karlstad, Sweden, 2013. [Google Scholar]
  12. Amrouche, S.O.; Rekioua, D.; Rekioua, T.; Bacha, S. Overview of energy storage in renewable energy systems. Int. J. Hydrog. Energy 2016, 41, 20914–20927. [Google Scholar] [CrossRef]
  13. Onovwiona, H.I.; Ugursal, V.I. Residential cogeneration systems: Review of the current technology. Renew. Sustain. Energy Rev. 2006, 10, 389–431. [Google Scholar] [CrossRef]
  14. Züttel, A. Hydrogen storage methods. Naturwissenschaften 2004, 91, 157–172. [Google Scholar] [CrossRef]
  15. Hirscher, M.; Yartys, V.A.; Baricco, M.; von Colbe, J.B.; Blanchard, D.; Bowman, R.C., Jr.; Broom, D.P.; Buckley, C.E.; Chang, F.; Chen, P.; et al. Materials for hydrogen-based energy storage–past, recent progress and future outlook. J. Alloy. Compd. 2020, 827, 153548. [Google Scholar] [CrossRef]
  16. Yartys, V.A.; Lototskyy, M.V.; Akiba, E.; Albert, R.; Antonov, V.E.; Ares, J.R.; Baricco, M.; Bourgeois, N.; Buckley, C.E.; von Colbe, J.B.; et al. Magnesium based materials for hydrogen based energy storage: Past, present and future. Int. J. Hydrog. Energy 2019, 44, 7809–7859. [Google Scholar] [CrossRef]
  17. Abe, J.O.; Ajenifuja, E.; Popoola, O.M. Hydrogen energy, economy and storage: Review and recommendation. Int. J. Hydrog. Energy 2019, 44, 15072–15086. [Google Scholar] [CrossRef]
  18. Moradi, R.; Groth, K.M. Hydrogen storage and delivery: Review of the state of the art technologies and risk and reliability analysis. Int. J. Hydrog. Energy 2019, 44, 12254–12269. [Google Scholar] [CrossRef]
  19. Von Colbe, J.B.; Ares, J.R.; Barale, J.; Baricco, M.; Buckley, C.; Capurso, G.; Gallandat, N.; Grant, D.M.; Guzik, M.N.; Jacob, I.; et al. Application of hydrides in hydrogen storage and compression: Achievements, outlook and perspectives. Int. J. Hydrog. Energy 2019, 44, 7780–7808. [Google Scholar] [CrossRef]
  20. Andersson, J.; Grönkvist, S. Large-scale storage of hydrogen. Int. J. Hydrog. Energy 2019, 44, 11901–11919. [Google Scholar] [CrossRef]
  21. Ball, M.; Wietschel, M. The Hydrogen Economy: Opportunities and Challenges; Cambridge University Press: Cambridge, UK, 2009. [Google Scholar]
  22. Boulmrharj, S.; Khaidar, M.; Siniti, M.; Bakhouya, M.; Zine-dine, K. Towards performance assessment of fuel cell integration into buildings. Energy Rep. 2020, 6, 288–293. [Google Scholar] [CrossRef]
  23. Dutta, S. A review on production, storage of hydrogen and its utilization as an energy resource. J. Ind. Eng. Chem. 2014, 20, 1148–1156. [Google Scholar] [CrossRef]
  24. Mohammadi, A.; Mehrpooya, M. A comprehensive review on coupling different types of electrolyzer to renewable energy sources. Energy 2018, 158, 632–655. [Google Scholar] [CrossRef]
  25. Stojić, D.L.; Grozdić, T.D.; Umićević, B.; Maksić, A.D. A comparison of alkaline and proton exchange membrane electrolyzers. Russ. J. Phys. Chem. A Focus Chem. 2008, 82, 1958–1960. [Google Scholar] [CrossRef]
  26. Carmo, M.; Fritz, D.L.; Mergel, J.; Stolten, D. A comprehensive review on PEM water electrolysis. Int. J. Hydrog. Energy 2013, 38, 4901–4934. [Google Scholar] [CrossRef]
  27. Kumar, S.S.; Himabindu, V. Hydrogen production by PEM water electrolysis–A review. Mater. Sci. Energy Technol. 2019, 2, 442–454. [Google Scholar] [CrossRef]
  28. Rashid, M.M.; Al Mesfer, M.K.; Naseem, H.; Danish, M. Hydrogen production by water electrolysis: A review of alkaline water electrolysis, PEM water electrolysis and high temperature water electrolysis. Int. J. Eng. Adv. Technol 2015, 4, 2249–8958. [Google Scholar]
  29. Peighambardoust, S.J.; Rowshanzamir, S.; Amjadi, M. Review of the proton exchange membranes for fuel cell applications. Int. J. Hydrog. Energy 2010, 35, 9349–9384. [Google Scholar] [CrossRef]
  30. Alanne, K.; Saari, A. Sustainable small-scale CHP technologies for buildings: The basis for multi-perspective decision-making. Renew. Sustain. Energy Rev. 2004, 8, 401–431. [Google Scholar] [CrossRef]
  31. Dodds, P.E.; Staffell, I.; Hawkes, A.D.; Li, F.; Grünewald, P.; McDowall, W.; Ekins, P. Hydrogen and fuel cell technologies for heating: A review. Int. J. Hydrog. Energy 2015, 40, 2065–2083. [Google Scholar] [CrossRef] [Green Version]
  32. Hamelin, J.; Agbossou, K.; Laperriere, A.; Laurencelle, F.; Bose, T.K. Dynamic behavior of a PEM fuel cell stack for stationary applications. Int. J. Hydrog. Energy 2001, 26, 625–629. [Google Scholar] [CrossRef]
  33. Sinha, S.; Chandel, S.S. Review of software tools for hybrid renewable energy systems. Renew. Sustain. Energy Rev. 2014, 32, 192–205. [Google Scholar] [CrossRef]
  34. Singh, G.K. Solar power generation by PV (photovoltaic) technology: A review. Energy 2013, 53, 1–13. [Google Scholar] [CrossRef]
  35. Gow, J.A.; Manning, C.D. Development of a photovoltaic array model for use in power-electronics simulation studies. IEE Proc. Electr. Power Appl. 1999, 146, 193–200. [Google Scholar] [CrossRef]
  36. Elibrahimi, M.; Elmouatamid, A.; Bakhouya, M.; Feddi, K.; Ouladsine, R. Performance Evaluation of Fixed and Sun Tracking Photovoltaic Systems. In Proceedings of the 2018 6th International Renewable and Sustainable Energy Conference (IRSEC), Rabat, Morocco, 5–8 December 2018; pp. 1–6. [Google Scholar] [CrossRef]
  37. Chin, V.J.; Salam, Z.; Ishaque, K. Cell modelling and model parameters estimation techniques for photovoltaic simulator application: A review. Appl. Energy 2015, 154, 500–519. [Google Scholar] [CrossRef]
  38. Jordehi, A.R. Parameter estimation of solar photovoltaic (PV) cells: A review. Renew. Sustain. Energy Rev. 2016, 61, 354–371. [Google Scholar] [CrossRef]
  39. Boulmrharj, S.; Rabeh, R.; Felix, V.; Ouladsine, R.; Bakhouya, M.; Zine-Dine, K.; Khaidar, M.; Siniti, M.; Abid, M.R. Modeling and dimensioning of grid-connected photovoltaic systems. In Proceedings of the 2017 International Renewable and Sustainable Energy Conference (IRSEC), Tangier, Morocco, 4–7 December 2017; pp. 1–6. [Google Scholar] [CrossRef]
  40. Rahim, A.A.; Tijani, A.S.; Kamarudin, S.K.; Hanapi, S. An overview of polymer electrolyte membrane electrolyzer for hydrogen production: Modeling and mass transport. J. Power Sources 2016, 309, 56–65. [Google Scholar] [CrossRef]
  41. Han, B.; Steen, S.M., III; Mo, J.; Zhang, F.Y. Electrochemical performance modeling of a proton exchange membrane electrolyzer cell for hydrogen energy. Int. J. Hydrog. Energy 2015, 40, 7006–7016. [Google Scholar] [CrossRef] [Green Version]
  42. Ni, M.; Leung, M.K.; Leung, D.Y. Mathematical modeling of the coupled transport and electrochemical reactions in solid oxide steam electrolyzer for hydrogen production. Electrochim. Acta 2007, 52, 6707–6718. [Google Scholar] [CrossRef]
  43. Ni, M. Computational fluid dynamics modeling of a solid oxide electrolyzer cell for hydrogen production. Int. J. Hydrog. Energy 2009, 34, 7795–7806. [Google Scholar] [CrossRef]
  44. Zhou, T.; Francois, B. Modeling and control design of hydrogen production process for an active hydrogen/wind hybrid power system. Int. J. Hydrog. Energy 2009, 34, 21–30. [Google Scholar] [CrossRef]
  45. Sarrias-Mena, R.; Fernández-Ramírez, L.M.; García-Vázquez, C.A.; Jurado, F. Electrolyzer models for hydrogen production from wind energy systems. Int. J. Hydrog. Energy 2015, 40, 2927–2938. [Google Scholar] [CrossRef]
  46. Ulleberg, Ø. Modeling of advanced alkaline electrolyzers: A system simulation approach. Int. J. Hydrog. Energy 2003, 28, 21–33. [Google Scholar] [CrossRef]
  47. Dursun, E.; Acarkan, B.; Kilic, O. Modeling of hydrogen production with a stand-alone renewable hybrid power system. Int. J. Hydrog. Energy 2012, 37, 3098–3107. [Google Scholar] [CrossRef]
  48. Deshmukh, S.S.; Boehm, R.F. Review of modeling details related to renewably powered hydrogen systems. Renew. Sustain. Energy Rev. 2008, 12, 2301–2330. [Google Scholar] [CrossRef]
  49. Gandia, L.M.; Arzamedi, G.; Diéguez, P.M. Renewable Hydrogen Technologies: Production, Purification, Storage, Applications and Safety. Newnes; Elsevier: Amsterdam, The Netherlands, 2013. [Google Scholar]
  50. Trifkovic, M.; Sheikhzadeh, M.; Nigim, K.; Daoutidis, P. Modeling and control of a renewable hybrid energy system with hydrogen storage. IEEE Trans. Control Syst. Technol. 2013, 22, 169–179. [Google Scholar] [CrossRef]
  51. Lajnef, T.; Abid, S.; Ammous, A. Modeling, control, and simulation of a solar hydrogen/fuel cell hybrid energy system for grid-connected applications. Adv. Power Electron. 2013, 2013, 352765. [Google Scholar] [CrossRef] [Green Version]
  52. Cheddie, D.; Munroe, N. Review and comparison of approaches to proton exchange membrane fuel cell modeling. J. Power Sources 2005, 147, 72–84. [Google Scholar] [CrossRef]
  53. Amphlett, J.C.; Baumert, R.M.; Mann, R.F.; Peppley, B.A.; Roberge, P.R.; Harris, T.J. Performance modeling of the Ballard Mark IV solid polymer electrolyte fuel cell I. Mechanistic model development. J. Electrochem. Soc. 1995, 142, 1–8. [Google Scholar] [CrossRef]
  54. Amphlett, J.C.; Baumert, R.M.; Mann, R.F.; Peppley, B.A.; Roberge, P.R.; Rodrigues, A. Parametric modelling of the performance of a 5-kW proton-exchange membrane fuel cell stack. J. Power Sources 1994, 49, 349–356. [Google Scholar] [CrossRef]
  55. Amphlett, J.C.; Baumert, R.M.; Mann, R.F.; Peppley, B.A.; Roberge, P.R.; Harris, T.J. Performance modeling of the Ballard Mark IV solid polymer electrolyte fuel cell II. Empirical model development. J. Electrochem. Soc. 1995, 142, 9–15. [Google Scholar] [CrossRef]
  56. Kim, J.; Lee, S.M.; Srinivasan, S.; Chamberlin, C.E. Modeling of proton exchange membrane fuel cell performance with an empirical equation. J. Electrochem. Soc. 1995, 142, 2670–2674. [Google Scholar] [CrossRef]
  57. Souleman, N.M.; Tremblay, O.; Dessaint, L.A. A generic fuel cell model for the simulation of fuel cell power systems. In Proceedings of the 2009 IEEE Power & Energy Society General Meeting, Calgary, AB, Canada, 26–30 July 2009. [Google Scholar]
  58. Bennouna, A.; Aarich, N.; Erraissi, N.; Akhsassi, M.; Asselman, A.; Barhdadi, A.; Boukhattem, L.; Cherkaoui, A.; Darmane, Y.; Doudou, A.; et al. Energy performance of 3 silicon-based PV module technologies in 20 sites of Morocco. Energy Sustain. Dev. 2019, 53, 30–56. [Google Scholar] [CrossRef]
  59. Lotfi, H.; Bennouna, A.; Izbaim, D.; Neffa, M. Performance Analysis of Amorphous Photovoltaic Module Technology in Laâyoune –Morocco. J. Electr. Electron. Eng. 2018, 13, 35–42. [Google Scholar] [CrossRef]
  60. Aarich, N.; Erraissi, N.; Akhsassi, M.; Bennouna, A.; Asselman, A.; Barhdadi, A.; Boukhattem, L.; Cherkaoui, A.; Darmane, Y.; Doudou, A.; et al. Photovoltaic DC yield maps for all Morocco validated with ground measurements. Energy Sustain. Dev. 2018, 47, 158–169. [Google Scholar] [CrossRef]
  61. Bakhouya, M.; NaitMalek, Y.; Elmouatamid, A.; Lachhab, F.; Berouine, A.; Boulmrharj, S.; Ouladsine, R.; Felix, V.; Zine-dine, K.; Khaidar, M.; et al. Towards a Data-Driven Platform using IoT and Big Data Technologies for Energy Efficient Buildings. In Proceedings of the 2017 3rd International Conference of Cloud Computing Technologies and Applications (CloudTech), Rabat, Morocco, 24–26 October 2017. [Google Scholar] [CrossRef]
  62. Boulmrharj, S.; NaitMalek, Y.; Elmouatamid, A.; Bakhouya, M.; Ouladsine, R.; Zine-dine, K.; Khaidar, M.; Abid, R. Approach for Dimensioning Stand-alone Photovoltaic Systems. Energy Procedia 2018, 153, 56–61. [Google Scholar] [CrossRef]
  63. Boulmrharj, S.; El Ibrahimi, M.; Louardi, A.; Aarich, N. Modeling and Performance Analysis of a Grid-connected Polycrystalline Silicon Photovoltaic System under the Maritime Climate of El Jadida in Morocco. Accept. Int. J. Renew. Energy Res. 2020, in press. [Google Scholar]
  64. Erraissi, N.; Raoufi, M.; Aarich, N.; Akhsassi, M.; Bennouna, A. Implementation of a low-cost data acquisition system for “PROPRE.MA” project. Measurement 2008, 117, 21–40. [Google Scholar] [CrossRef]
  65. Larminie, J.; Dicks, A. Fuel Cell Systems Explained, 2nd ed.; John Wiley & Sons, Inc.: Chichester, UK, 2003. [Google Scholar]
  66. Ham, S.W.; Jo, S.Y.; Dong, H.W.; Jeong, J.W. A simplified PEM fuel cell model for building cogeneration applications. Energy Build. 2015, 107, 213–225. [Google Scholar] [CrossRef]
  67. Durbin, D.J.; Malardier-Jugroot, C. Review of hydrogen storage techniques for on board vehicle applications. Int. J. Hydrog. Energy 2013, 38, 14595–14617. [Google Scholar] [CrossRef]
  68. Hong, Y.Y.; Chang, W.C.; Chang, Y.R.; Lee, Y.D.; Ouyang, D.C. Optimal sizing of renewable energy generations in a community microgrid using Markov model. Energy 2017, 135, 68–74. [Google Scholar] [CrossRef]
  69. Jacobson, M.Z. Reducing T&D Losses Allows Faster Retirement of Fossil Plants. In 100% Clean, Renewable Energy and Storage for Everything; Cambridge University Press: Cambridge, UK, 2019; Available online: https://web.stanford.edu/group/efmh/jacobson/Articles/I/TransmisDistrib.pdf (accessed on 21 May 2020).
  70. Gahleitner, G. Hydrogen from renewable electricity: An international review of power-to-gas pilot plants for stationary applications. Int. J. Hydrog. Energy 2013, 38, 2039–2061. [Google Scholar] [CrossRef]
  71. Schiro, F.; Stoppato, A.; Benato, A. Potentialities of hydrogen enriched natural gas for residential heating decarbonization and impact analysis on premixed boilers. E3S Web Conf. 2019, 116, 00072. [Google Scholar] [CrossRef]
Figure 1. The block diagram of the proposed hybrid system.
Sustainability 12 04832 g001
Figure 2. The deployed fuel cell system as well as the box for capturing the released heat by the fuel cell.
Sustainability 12 04832 g002
Figure 3. The flowchart diagram of the system’s model.
Sustainability 12 04832 g003
Figure 4. The PV cell’s single-diode equivalent circuit.
Sustainability 12 04832 g004
Figure 5. The fuel cell’s equivalent circuit.
Sustainability 12 04832 g005
Figure 6. (a) The in-plane solar irradiation (W/m²) and the ambient temperature (°C). (b) The simulated and experimental PV system’s PV production.
Sustainability 12 04832 g006
Figure 7. (a) The temperature of the stack. (b) Simulation and experimental results.
Sustainability 12 04832 g007
Figure 8. The variation of the temperature of the air trapped into the box.
Sustainability 12 04832 g008
Figure 9. (a) Average daily ambient temperature (°C). (b) Average daily solar irradiation (kWh/m²/day) of each month of the year.
Sustainability 12 04832 g009
Figure 10. The simulated and experimental monthly energy generated by 1 kWp of the PV system (kWh/kWp) as well as the PV system’s efficiency (%) over the whole period.
Sustainability 12 04832 g010
Figure 11. The simulated volume of hydrogen (Nm3) produced by 1 kWp of the PV system during the whole period.
Sustainability 12 04832 g011
Figure 12. The simulated monthly produced electricity by the fuel cell (kWh) during the whole period.
Sustainability 12 04832 g012
Table 1. PV module’s characteristics.
PV Module’s CharacteristicsValues
Solar cell number60 cells
Maximum Power Point at STC (Pmpp)255 W
Maximum Power Point Voltage (Vmpp)30.5 V
Maximum Power Point Current (Impp)8.27 A
Open Circuit Voltage (Voc)37.6 V
Short Circuit Current (Isc)8.81 A
Dimensions1676 × 1001 × 31 mm3
Weight18 kg
Table 2. Electrolyzer characteristics.
Electrolyzer CharacteristicsValues
Max hydrogen flow rate100 nl/h
Max outlet pressure10 bar
Purity of hydrogen99.999% @ 30 bar
Operative power consumption800 W
Max power consumption900 W
Operating temperature45 °C
Water tank volume2.5 l
Max water consumption0.1 l/h
Dimensions325 × 560 × 500 mm3
Weight50 kg
Table 3. Fuel cell’s characteristics.
Fuel Cell’s CharacteristicsValues
Rated output1200 W @ 5…25 °C
Output voltage20…36 VDC
Rated current65 ADC max
FuelHydrogen gas
Hydrogen consumption at 1200 W15 nl/min
OxidantAtmospheric oxygen
Oxidant volume flow rateMax 335 m3/h
Dimensions220 × 400 × 550 mm3
Weight22 kg

