Article

Pilot-Scale Study on the Specific Resistance of Beech Wood Dust in a Pulse-Jet Filter

Department of Furniture Design, Faculty of Wood Technology, Poznan University of Life Sciences, Wojska Polskiego 38/42, 60-627 Poznań, Poland
*
Author to whom correspondence should be addressed.
Sustainability 2020, 12(12), 4816; https://doi.org/10.3390/su12124816
Submission received: 18 May 2020 / Revised: 5 June 2020 / Accepted: 6 June 2020 / Published: 12 June 2020
(This article belongs to the Special Issue Rethinking Filter: Responsibility and Sustainability)

Abstract

:
The specific beech wood dust resistance coefficient values were experimentally determined in the condition of pulse-jet filtration using a pilot-scale baghouse. The experiments were carried out for two variants of the filter medium. One of them had a PTFE (Polytetrafluoroethylene) membrane on the working surface. Three values of filtration velocity and seven levels of dust concentration at the filter inlet were used to determine the variability of the specific resistance coefficient of beech wood dust accumulated on the filter medium. The values of the specific beech wood dust resistance coefficient depend on filter medium finishing and filtration parameters: filtration velocity and dust concentration at the filter inlet. The high concentration of dust at the filter inlet and low filtration velocity should be used, especially in filters with surface finished media, for the reduction in pressure drop, which would affect in a significant reduction of energy consumption.

1. Introduction

Extraction systems equipped with filtration dust collectors are the basic technical measures to reduce dust in woodworking plants. Inside these devices, to separate dust, dust-laden air flows through the filter element in the form of a filter bag, creating a cake of dust on the working surface of the bag. The formation of this cake causes an increase in the resistance to air flow through the filter. This resistance is influenced by many factors depending on the course of the air filtration process, such as filtration parameters (filtration velocity and dust concentration in the air), type of filter medium, dust properties and cleaning parameters of the filter bags. The resistance to air flow during filtration relates to the energy consumption of the filter. Low resistance during filtration results in lower fan energy consumption.
The resistance to air flow occurring during filtration is described as the variable named pressure drop Δp. The total pressure drop of the filter Δpc can be divided into two main components. The first describes the resistance to air flow through the clean filter medium (pressure drop across the clean medium Δp0) while the second is the pressure drop across the dust cake deposited on the surface of the filter medium. It can be calculated from Equation (1) as the sum of pressure drop across the clean filter medium Δp0 and the pressure drop across the dust cake accumulated on the medium surface Δpp [1,2,3,4,5,6,7,8]:
pc = ∆p0 + ∆pp
The pressure drop through the filter medium depends on its air permeability, filtration velocity and air viscosity, while the pressure drop through the dust cake depends on the dust load and filtration velocity, and the constant depends on the properties of the accumulated dust, i.e., the specific dust cake resistance coefficient. The pressure drop through the clean filter medium is calculated as follows:
p0 = K0·wf
where:
K0—clean fabric resistance coefficient, Pa·s·m−1,
wf—filtration velocity, m·s−1.
On the other hand, the pressure drop through the dust cake accumulated on the filtration surface depends on the filtration velocity wf (m·s−1), filter area dust load s (kg·m−2) and the specific dust cake resistance coefficient K2 (s−1) as in Equation (3):
pp = wf·s·K2,
The components of the Equation (3) determining the pressure drop in the dust cake, in particular the coefficient K2, can be determined only in an experimental way because they are the filtration parameters or depend on dust, air and filtration media properties [9,10]. Particle size is a very important property of dust affecting the cake resistance. The specific resistance of dust cakes in HEPA filters is proportional to the inverse square of the mass median particle’s diameter. It results from the fact that the smaller particles would form a denser cake on the surface of the filter medium, which causes a greater resistance to the air flow [11].
For this reason, a number of research works have been done [2,8,12], which resulted in determining the dust resistance coefficient for various types of dusts commonly separated in industry. There were mainly mineral dusts such as limestone dust, fly ash or coal dust. This problem, in relation to wood dust, has not been comprehensively resolved for a long time until Rogoziński [6] stated that the properties of wood dust in the filtration process are significantly different from mineral dusts and other organic dusts, but there are also differences between wood dusts of different origin. Due to the fact that the dust resistance depends not only on dust properties but also on the conditions of the cake formation during the filtration process, it was decided to carry out a study to determine the specific dust resistance coefficient for beech wood dust deposited on the surface of the filter medium with two variants of surface finish in variable parameters’ filtration process. Thanks to this, it will be possible to determine the conditions when the pressure drop was reduced, which can result in a significant reduction in energy consumption in the woodworking industry.

2. Materials and Methods

2.1. Wood Dust

The wood dust used in the study was obtained from the furniture production plant. It was created in the process of sanding of beech elements of bent furniture. This dust had a bulk density of 178 kg·m−3, determined according to the Polish standard PN-Z-04002-02:1974 “Determination of apparent densities and static porosities of dusts shell” and an average mass particle diameter of 105.3 µm, determined using the laser particle sizer Analysette 22 MicroTec Plus supported by the MaScontrol software (Fritsch, Germany) according to the standard ISO 9276-2. Particle size distribution of dust (Figure 1) was determined by sieve analysis using the sieving machine AS 200 Digit (Retsch, Germany) according to the standard ISO 2591-1:1998.

2.2. Filter Medium

The filter medium used in the experiment was a polyester (PES) needle felted fabric. The same material was used with two variants of surface finish. The most important feature distinguishing both parts of the fabric was an additional PFTE (Polytetrafluoroethylene) membrane on the working surface of one of them. The basic technical and functional properties of the filter medium are presented in Table 1.
There were 21 test bags made of each type of filtration media used in the study. The filter bags had a diameter of 150 mm and a length of 1485 mm, which resulted in a filter face surface of 0.7 m2.

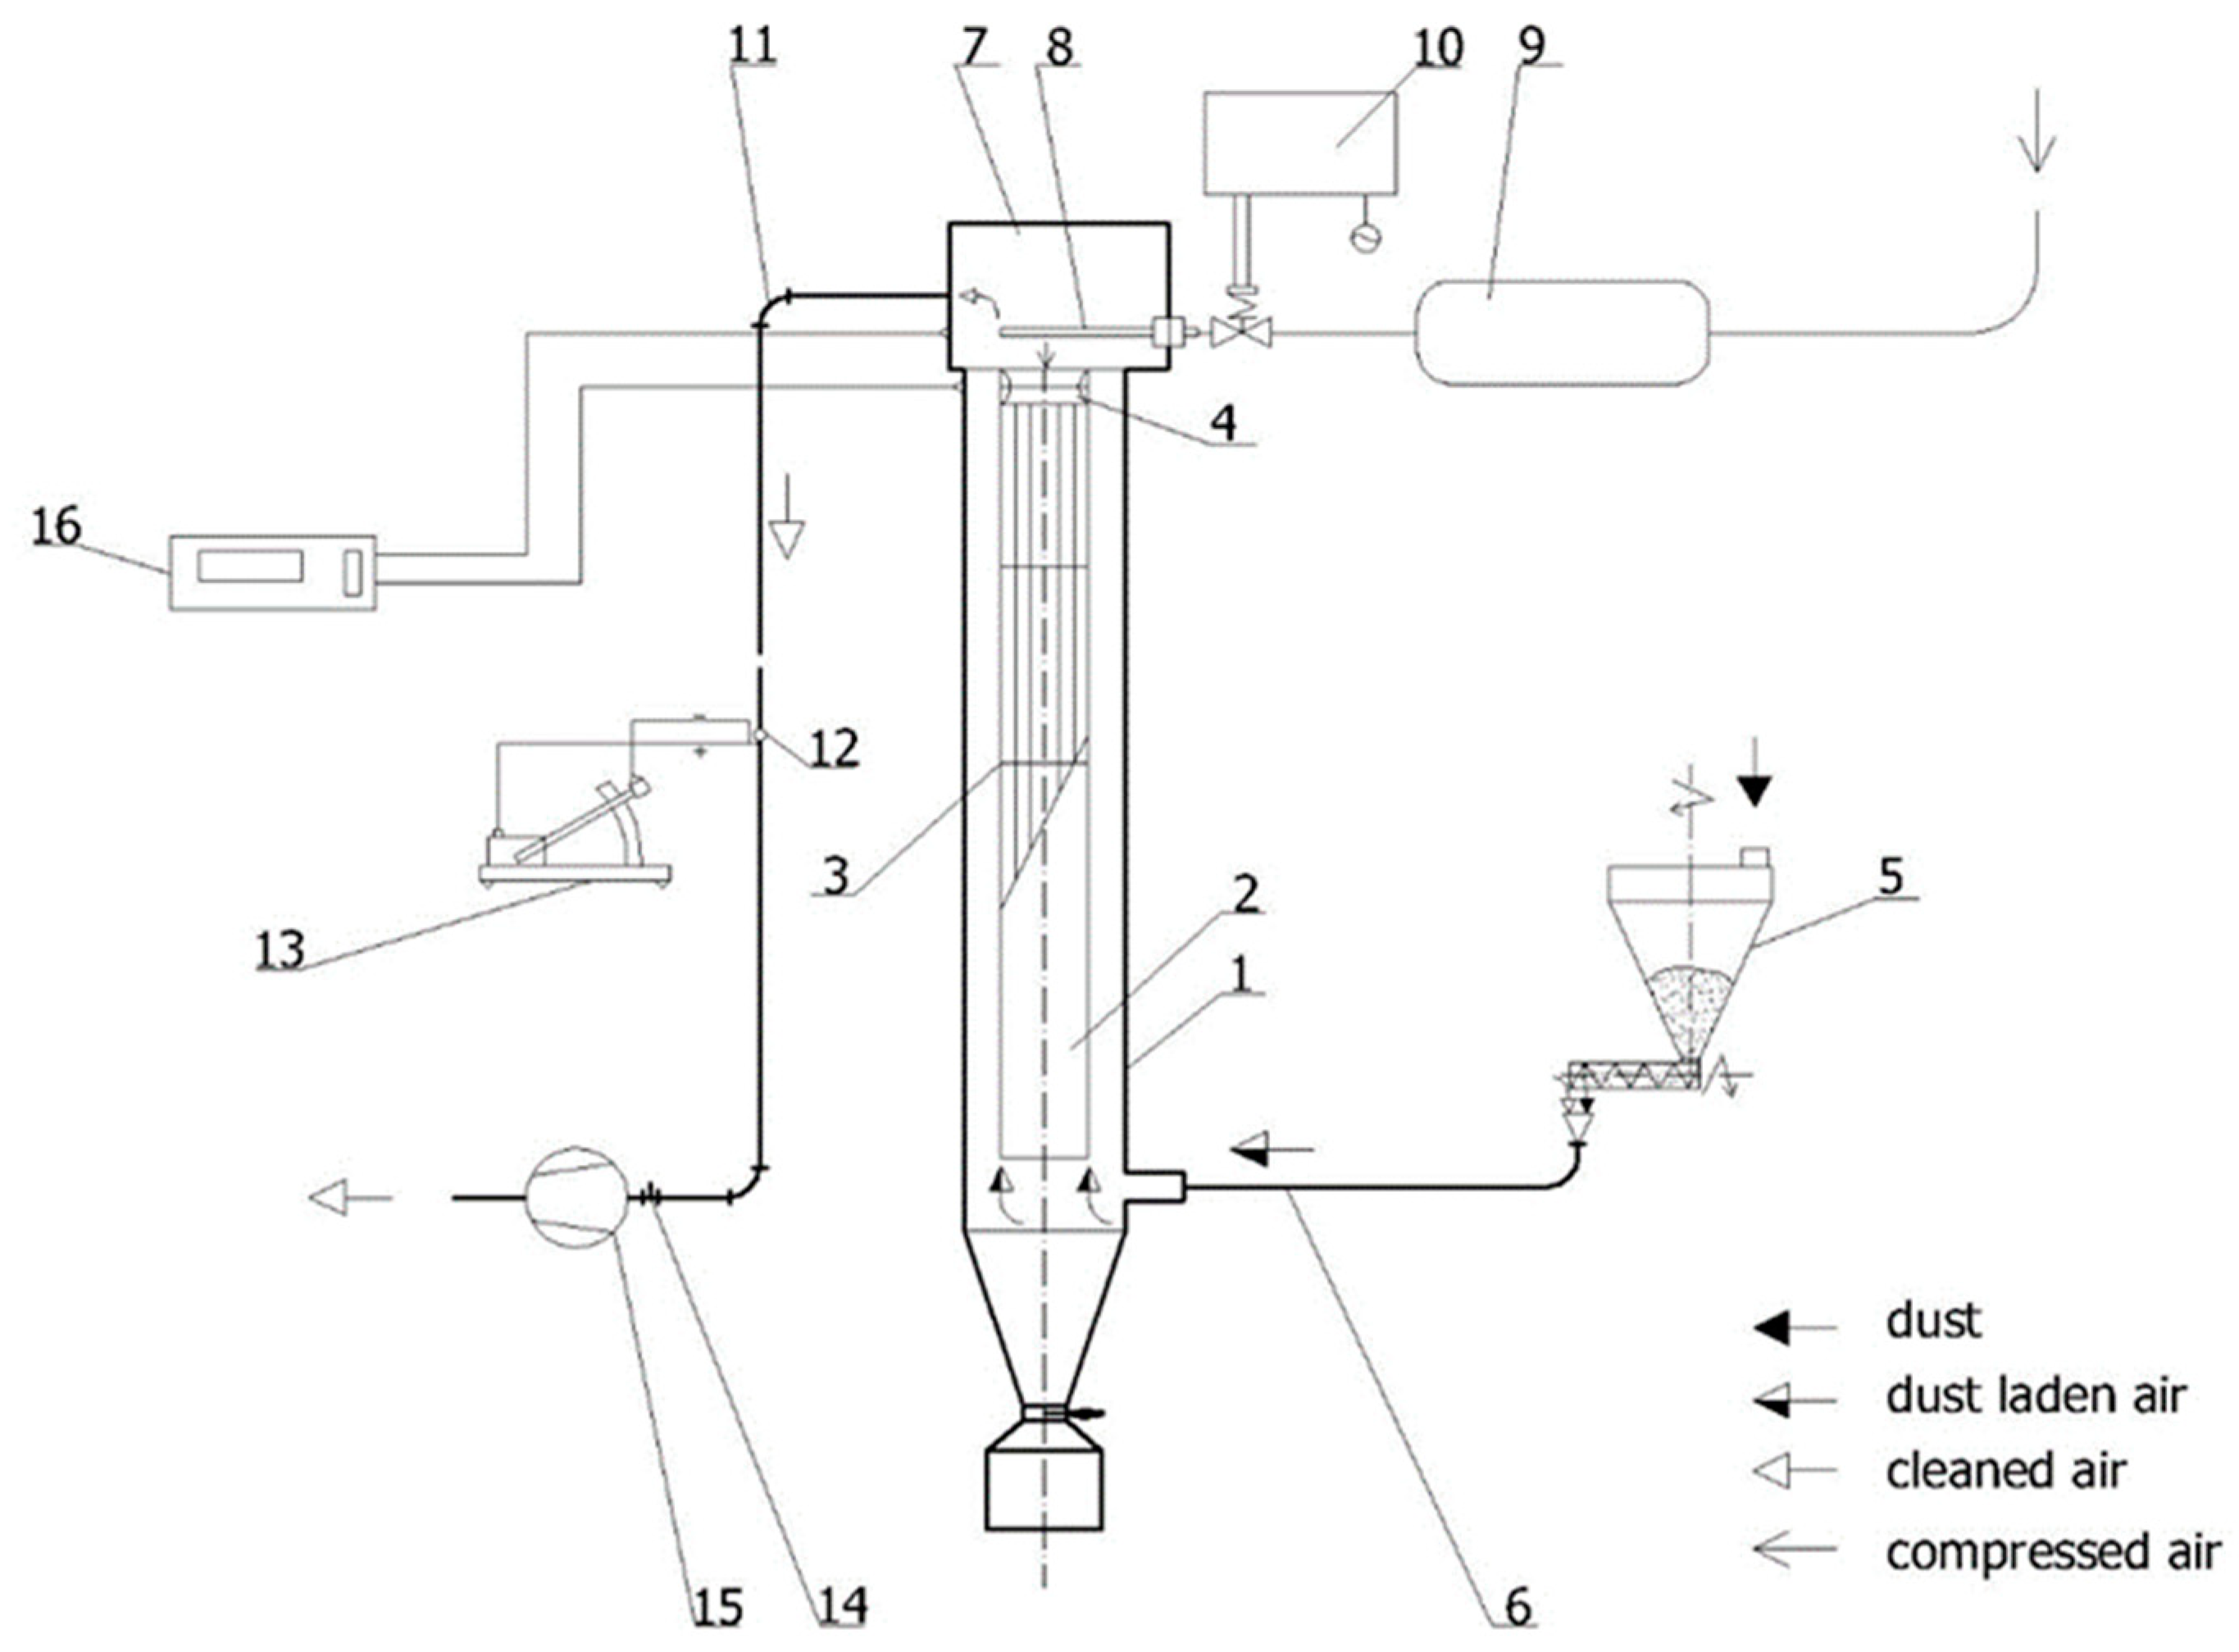
2.3. Test Rig and the Course of the Experiment

Experimental filtration processes were carried out using a pilot-scale test rig. The test rig was already used and described in detail in previous studies by Rogoziński [6] and Dolny et al. [13]. The design of the test rig allows observation of the filtration process for a long time and its mode of operation allows obtaining a large range of filtration parameters’ variability. The set-up of functional cooperation of the components of the test rig is shown in Figure 2. Pressure drop measurements were carried out during filtration processes using a CMR-10 type digital manometer (ZAM Kęty, Kęty Poland). In each filtration cycle, the measurement of the total pressure drop was carried out immediately before the cleaning impulse. Cleaning impulses were activated at 300 s intervals while the flow of dust-laden air through the bag was maintained. Fifty pulses were made in each process at the constant filtration parameters. Therefore, the maximum values of pressure drop were read. In order to obtain the expected variability of the dust resistance coefficient, it was decided to carry out a total number of 42 experimental processes, taking into account the values of filtration parameters contained in Table 2 and two filtration materials with different surface properties. The mass concentration of dust was determined by setting the output of the dust feeder in relation to the volumetric flow rate in the filtration chamber. The main fan flow rate was set according to the assumed filtration velocity.
Before each experimental process, the values of Δp0 were measured by reading the pressure drop changes as the airflow rate (face velocity) increased and decreased. In this purpose, the air flow rate through the clean bag was changed by setting the regulation valve of the main fan. The pressure drop across the clean medium was read out after each change of the flow rate. This procedure was carried out three times in the flow rate range corresponding to the range of filtration velocity of about 0.02–0.085 m·s−1.

2.4. Calculation of the K2 Value

As a result of the conducted experiments, K0 values were obtained. They were used to calculate the Δp0 values according to Equation (1) at all filtration velocity levels included in the study. The Δpp values needed to calculate the K2 coefficient were obtained as the difference between the Δpc measured during the experiments and the calculated Δp0. Then, the calculation of the dust resistance coefficient K2 was carried out according to the Equation (3) where area dust load s was calculated according to the following formula:
s = wfc·t
where:
c—dust concentration at filter inlet,
t—filtration cycle time (time between cleaning pulses).

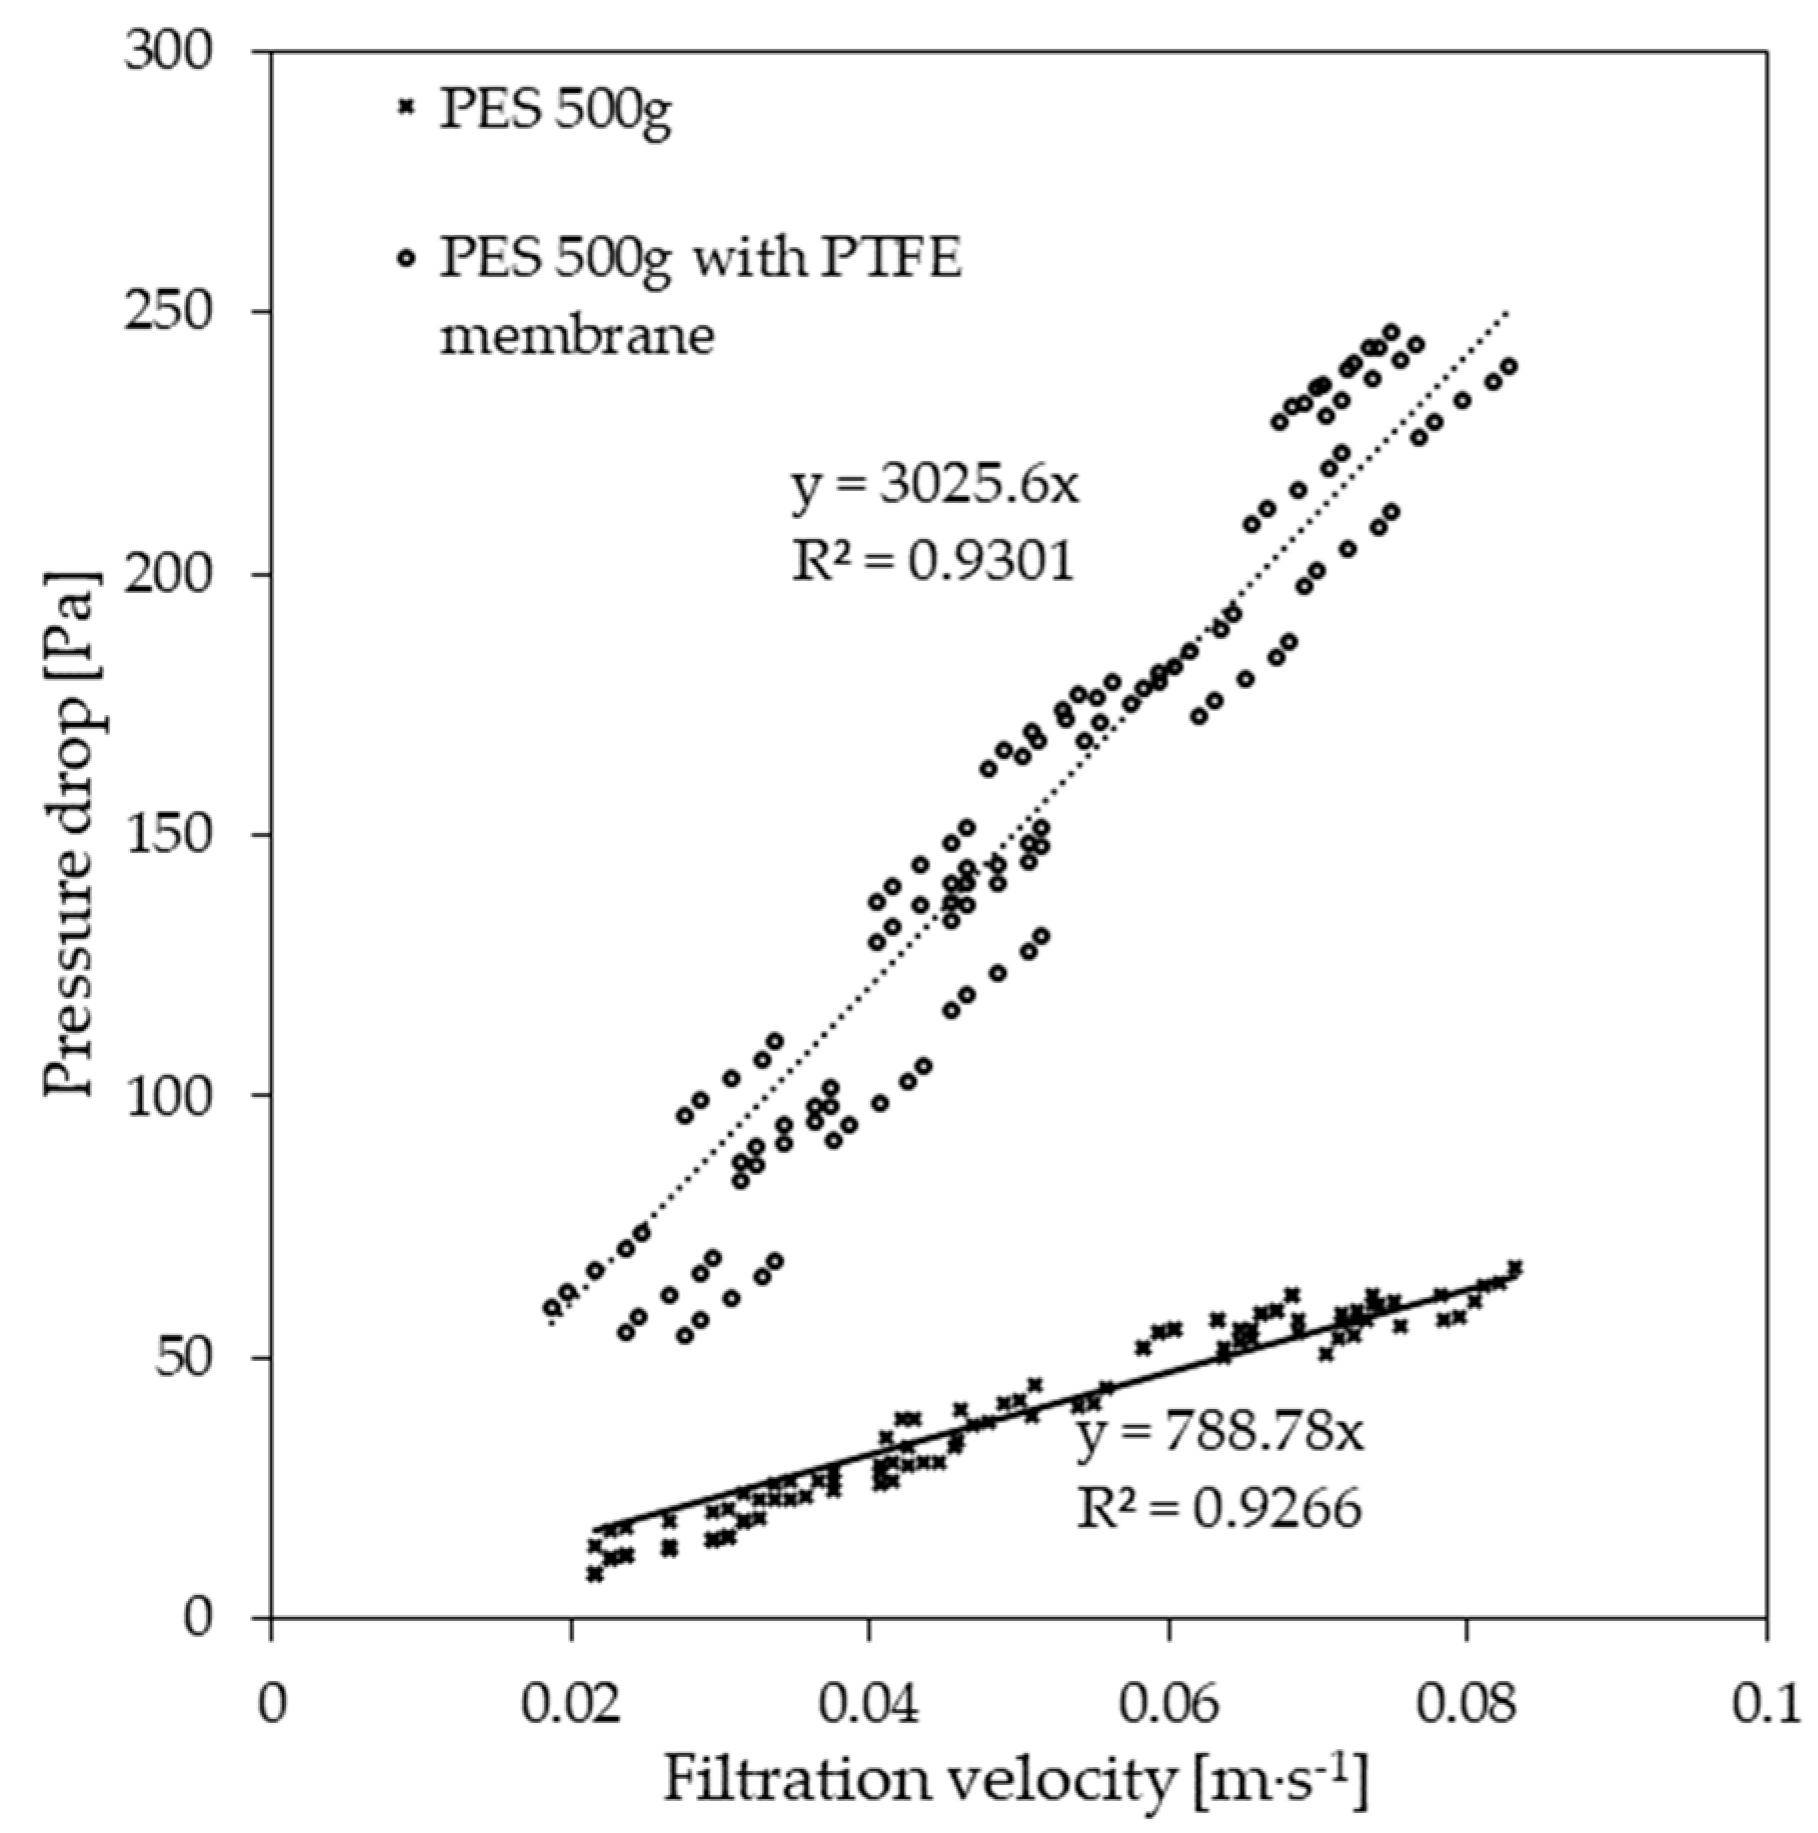
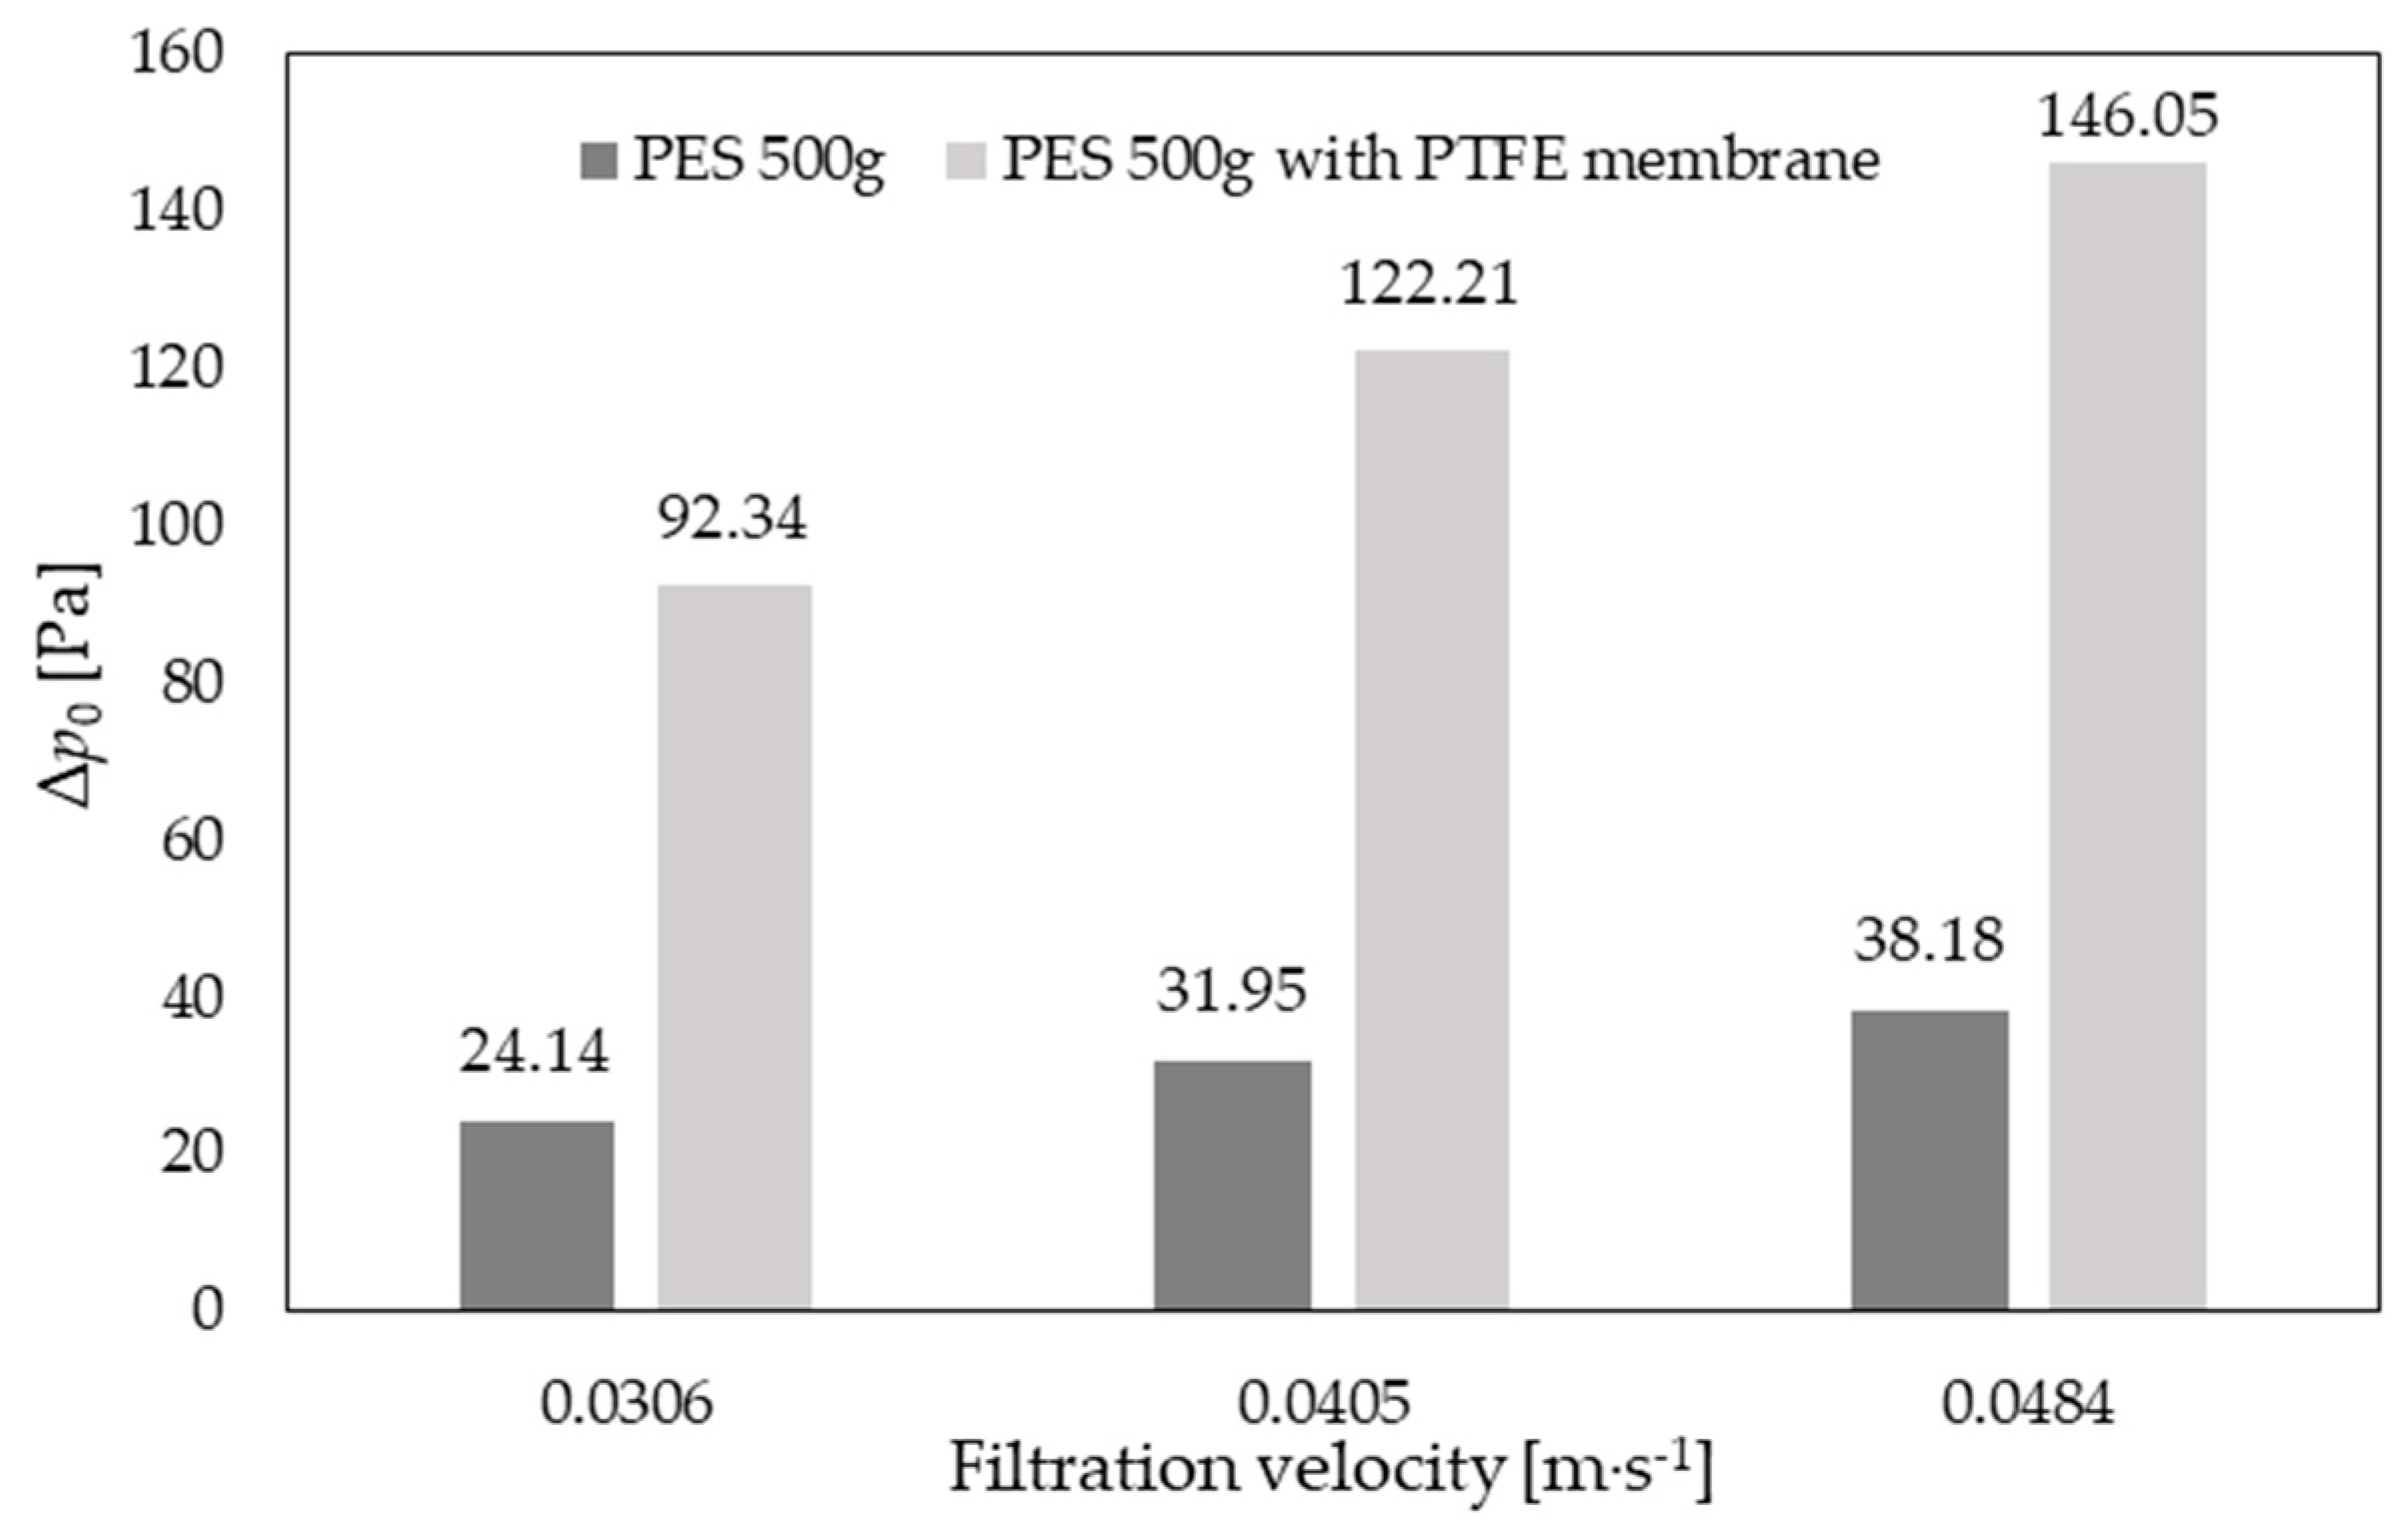
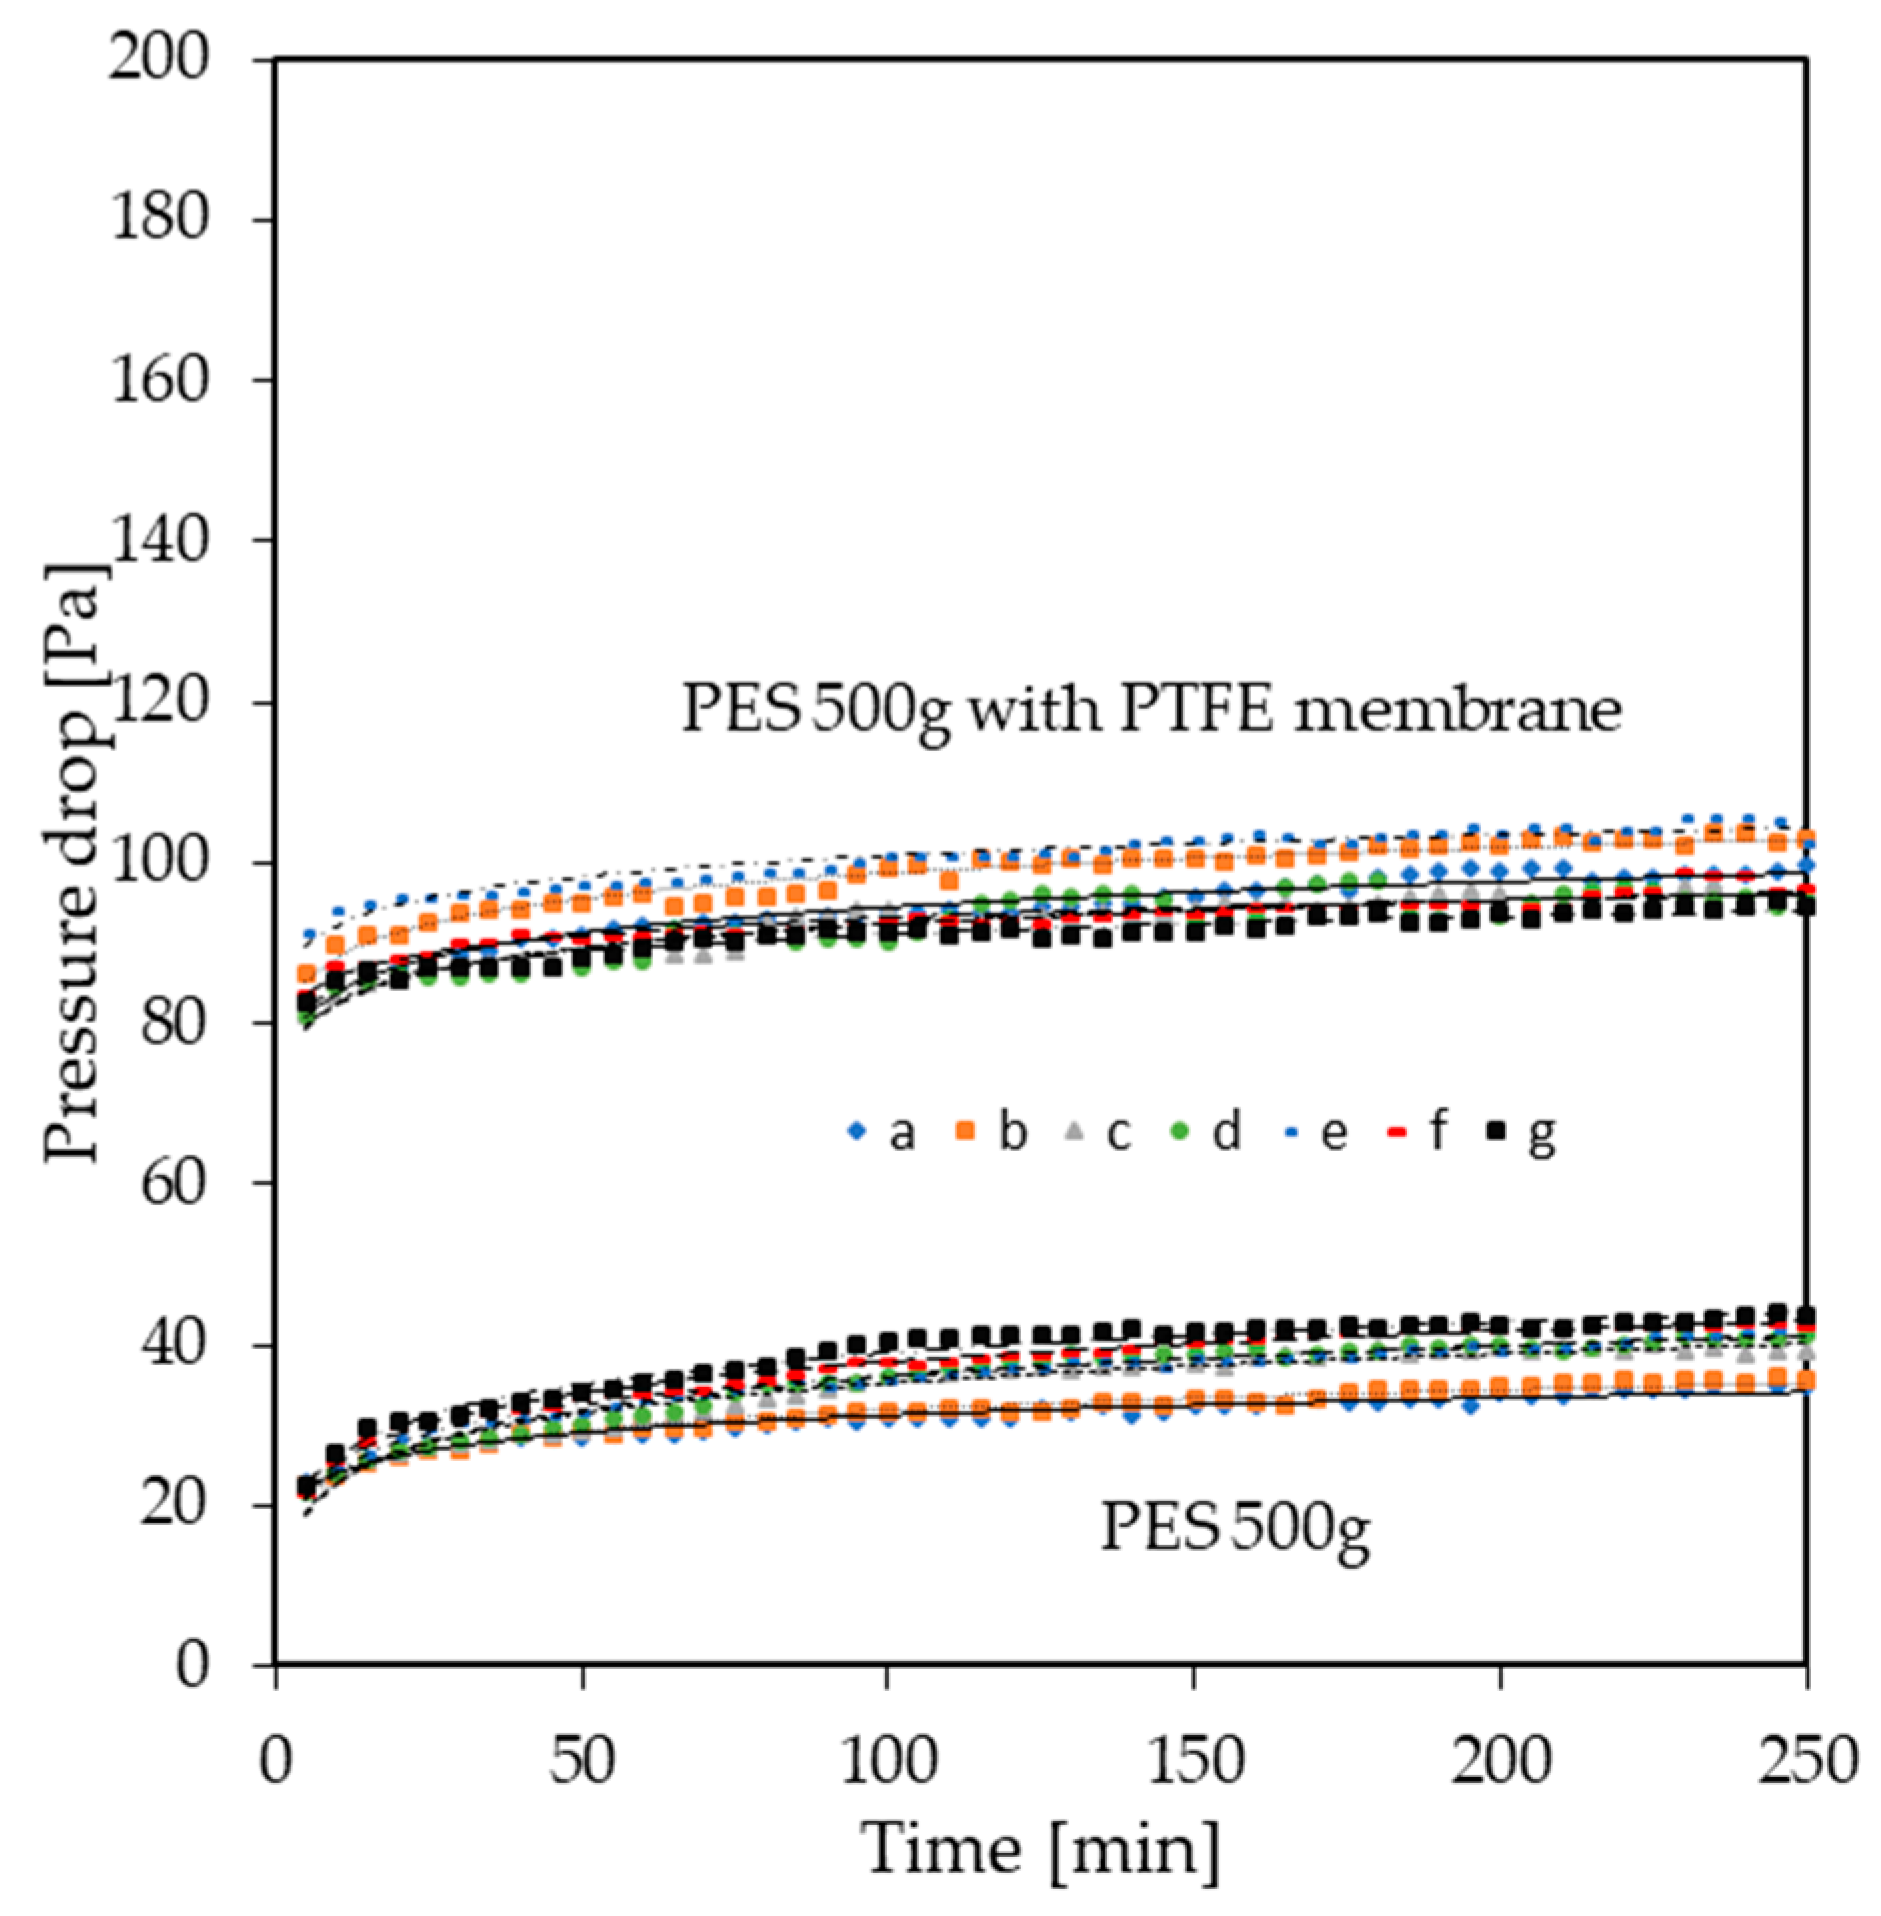
3. Results and Discussion

Figure 3 presents the results of measurements of the pressure drop across clean filter bags. According to Equation (1), the clean fabric resistance coefficient K0 is equal to the proportionality coefficient of the regression equation for the tested media: 788.78 for PES 500 g and 3025.6 for PES with PTFE membrane. The experiment reflects well the assumption of the linear proportionality of the resistance of the clean filter medium to the filtration velocity. The regression coefficients of both equations are very high (0.93).
Based on experimentally obtained equations of the pressure drop across clean filter media, Δp0 values characterizing the tested non-wovens were calculated. The Δp0 values correspond to three levels of filtration velocity taken into account in the experiments. The values are shown in Figure 4. They will be used further when calculating the dust coefficient.
Figure 5, Figure 6 and Figure 7 summarize the courses of the increase in total pressure drop Δpc during filtration processes using the PES 500 g standard non-woven fabric carried out at all assumed parameter values (filtration velocity, dust load) included in the study plan, and results of Δpc obtained from measurements carried out during processes in which the non-woven fabric with a PTFE membrane was used. Regression curves were drawn based on experimental data from the pressure drop measurements. The equations of these curves formed the basis for the calculation of the total pressure drop Δpc value after filtration time T of 250 min of experimental filtration.
The values of the pressure drop across the dust layer were calculated using the transformed Equation (1) taking into account the values of Δp0 (from Figure 4) and Δpc. In this way, Δpp for all variants of filtration velocity and dust concentration at the dust collector inlet were obtained. The results of these calculations are shown in Table 3.
Obtaining the empirical values of the K2 coefficient is not difficult after calculating the pressure drop through dust cake Δpp. These values were calculated by using the Equation (3) with known values of filtration cycle time t and concentration of dust at the inlet to the filter c.
The results obtained through these calculations were analyzed in two ways. The dependence of their variability on the dust concentration at the filter inlet and the filtration velocity were determined. Figure 6 and Figure 7 show the influence of dust concentration at the filter inlet on the specific dust resistance coefficient K2 for both tested filter non-wovens, taking into account three values of the filtration velocity assumed. Additionally, Figure 8 and Figure 9 present the influence of the filtration velocity on the specific dust resistance coefficient K2 for all inlet dust concentration levels used in the study.
An increase in dust concentration at the filter inlet caused a decrease in the specific dust resistance coefficient K2 in all filtration processes carried out with the use of both tested non-wovens. The decrease in the K2 coefficient along the increase in dust concentration at the filter inlet was observed for each filtration velocity. This reduction resulting from the influence of dust concentration at the inlet is more intense for the non-woven fabric with the PTFE membrane. In the extreme case relating to the filtration velocity of 0.0405 m·s−1, the K2 coefficient decreases in the whole range of the dust concentration used by about 6500 s−1 for the fabric with the PTFE membrane and 5400 s−1 for standard fabric PES 500 g. The differences in the K2 coefficient values for individual filtration velocity are because, generally, the higher the filtration velocity, the lower the porosity of the dust cake deposited on the surface of the filter medium. The reduction in the porosity is caused by greater compression forces resulting from higher filtration velocity [14,15,16]. The behavior of the wood dust cake is additionally affected by large dimensions and irregular shape of the particles, which is also the cause of greater compression and large increases in the resistance to airflow [17,18,19].
Comparison of the K2 value for both non-woven fabrics used in the tests showed that at filtration velocity of 0.0405 m·s−1 and 0.0484 m·s−1, the K2 coefficient had higher values for the non-woven fabric with PTFE membrane than for the standard non-woven fabric without PTFE. The additional coating of the surface of the non-woven fabric in the form of a PTFE membrane is the reason for its lower air permeability. This causes more difficult penetration of dust particles into the fabric and the formation of a more compact structure of dust cake, and thus, greater cohesion inside the cake. The low permeability of a filter medium results in a more compacted dust cake [20,21,22,23,24]. However, for the filtration velocity of 0.0306 m·s−1, K2 is generally slightly lower for the non-woven fabric with the PTFE membrane. This probably indicates the decisive role of the compression force coming from the filtration velocity. The more force at higher filtration velocities, the coefficient K2 increases more rapidly for the PTFE membrane.
The change in the filtration velocity from 0.0306 to 0.0405 m·s−1 results in an increase in the specific dust resistance coefficient values for all tested dust concentrations c for both filter fabrics. Further increasing the filtration velocity in the experimental processes to the level of 0.0484 m·s−1 generally causes a decrease in the specific dust resistance coefficient. The decrease depends, to some extent, on the inlet concentration of dust. The higher the dust concentration at the filter inlet, the smaller the influence of the filtration velocity on the value of K2. A thicker layer of dust accumulated on the surface of the filter bag resulting from an increase in the concentration of dust at the filter inlet does not significantly increase the air flow resistance, because this layer, although thicker, is not the same as strongly compressed throughout its thickness. This causes a decrease in the specific dust resistance coefficient with increasing dust concentration at the filter inlet [25]. The influence of the dust concentration at the filter inlet on the K2 value also depends on the type of filter material used in the study. In the case of non-woven fabric with PTFE membrane, the changes in specific resistance dust coefficient values are much larger than for the standard non-woven fabric without the PTFE membrane.
The values of the K2 coefficient for beech wood dust obtained in the tests are in the range from about 1000 s−1 to almost 11,000 s−1. This range is radically different than the values of this coefficient for other types of dust described in the literature. Cheng and Tsai [2] reported the increase of the K2 coefficient for fly ash from about 100,000 to almost 300,000 s−1, SAE fine dust from 200,000 to about 550,000 s−1 and for limestone from almost 400,000 to over 800,000 s−1 in the range of the filtration velocity variation from 0.01 to 0.09 m·s−1. These drastic differences between mineral dust and wood dust are because the beech dust particles have completely different properties. Wood dust has a much lower density and a much larger particle size. The way the research is conducted may also be relevant. These authors conducted experiments using small flat samples of filter media, but not bags or other industrial-sized filter elements.
Ellenbecker and Leith [26] reported experimental K2 values for fly ash. The specific dust resistance coefficient increases from 10,800 to 61 × 400 s−1 in the range of the filtration velocity from 0.05 to 0.15 m·s−1. These are the results obtained in the experiment using a filter bag. Despite the similar method, the values and nature of variation of the K2 coefficient of wood dust are different than fly ash.
In the pilot-scale test on the coefficient K2 of limestone using filter bags made of different non-wovens, [8] have found that the values of this coefficient are different for different filter media under the same filtration conditions. In the filtration velocity range from 0.02 to 0.055 m·s−1, the coefficient values ranged from 7.5 × 10⁹ to 10.5 × 10⁹ s−1. In addition to the dust properties, the experimental conditions were also different. The filter unit was equipped with six bags and the maximum pressure reached 2400 Pa. The impact of filtration speed was generally manifested by a linear increase in the value of the K2 coefficient. However, outlier points were found indicating the possibility of a decrease in the K2 coefficient at the highest levels of filtration velocity. Such a relationship has been regularly found for wood dust.

4. Conclusions

The values of the specific dust resistance coefficient K2 are higher for the non-woven filter fabric with the PTFE membrane. They range from 1000 to almost 10,000 s−1 while for the standard fabric without the PTFE membrane, the coefficient values range from about 2000 to over 8000 s−1.
The increase in wood dust concentration at the filter inlet while maintaining a constant filtration velocity causes a decrease in the value of the K2 coefficient for both tested filter media. It was observed at all levels of filtration velocity applied in the study.
For all values of dust concentration at the filter inlet used in the study, the dust resistance coefficient K2 increases with the filtration velocity increasing from 0.0306 to 0.0405 m·s−1. A further increase in the filtration velocity to 0.0484 m·s−1 causes a decrease in the value of the K2 coefficient for most of the dust concentration at the filter inlet applied. These relationships were observed for both filter media used in the tests.
The high concentration of dust at the filter inlet and low filtration velocity should be used, especially in filters with surface finished media, for the reduction in pressure drop, which would affect in a significant reduction of energy consumption.

Author Contributions

Conceptualization, Z.P. and T.R.; Data curation, Z.P.; Formal analysis, T.R.; Funding acquisition, T.R.; Investigation, Z.P. and T.R.; Methodology, Z.P. and T.R.; Project administration, T.R.; Resources, Z.P. and T.R.; Software, Z.P.; Supervision, T.R.; Validation, T.R.; Visualization, Z.P.; Writing—original draft, Z.P. and T.R.; Writing—review and editing, T.R. All authors have read and agreed to the published version of the manuscript.

Funding

This work was supported by the Polish Ministry of Science and Higher Education from the core funding for statutory R&D activities as research task no. 506.427.02.00. This work was supported by the Polish Ministry of Science and Higher Education program ‘Regional Initiative of Excellence’ in years 2019–2022, Project No. 005/RID/2018/19.

Conflicts of Interest

The authors declare no conflict of interest.

References

  1. Chen, Y.-S.; Hsiau, S.-S.; Lee, H.-Y.; Chyou, Y.-P. Filtration of dust particulates using a new filter system with louvers and sublouvers. Fuel 2012, 99, 118–128. [Google Scholar] [CrossRef]
  2. Cheng, Y.-H.; Tsai, C.-J. Factors Influencing Pressure Drop through a Dust Cake during Filtration. Aerosol Sci. Tech. 1998, 29, 315–328. [Google Scholar] [CrossRef]
  3. Koehler, J.L.; David, L. Model calibration for pressure drop in a pulse-jet cleaned fabric filter. Atmos. Environ. 1983, 17, 1909–1913. [Google Scholar] [CrossRef]
  4. Leith, D.; Ellenbecker, M.J. Theory for pressure drop in a pulse-jet cleaned fabric filter. Atmos. Environ. 1980, 14, 845–852. [Google Scholar] [CrossRef]
  5. Li, J.; Li, S.; Zhou, F. Effect of moisture content in coal dust on filtration and cleaning performance of filters. Physicochem. Probl. Mi. 2016, 52, 365–379. [Google Scholar] [CrossRef]
  6. Rogoziński, T. Pilot-scale study on the influence of wood dust type on pressure drop during filtration in a pulse-jet baghouse. Process. Saf. Environ. 2018, 119, 58–64. [Google Scholar] [CrossRef]
  7. Saleem, M.; Krammer, G.; Khan, R.U.; Tahir, M.S. Influence of operating parameters on cake formation in pilot scale pulse-jet bag filter. Powder Technol. 2012, 224, 28–35. [Google Scholar] [CrossRef] [Green Version]
  8. Saleem, M.; Krammer, G.; Tahir, M.S. The effect of operating conditions on resistance parameters of filter media and limestone dust cake for uniformly loaded needle felts in a pilot scale test facility at ambient conditions. Powder Technol. 2012, 228, 100–107. [Google Scholar] [CrossRef] [Green Version]
  9. Mukhopadhyay, A. Pulse-jet filtration: An effective way to control industrial pollution Part I: Theory, selection and design of pulse-jet filter. Text. Prog. 2009, 41, 195–315. [Google Scholar] [CrossRef]
  10. Saleem, M.; Krammer, G. Effect of filtration velocity and dust concentration on cake formation and filter operation in a pilot scale jet pulsed bag filter. J. Hazard. Mater. 2007, 144, 677–681. [Google Scholar] [CrossRef]
  11. Novick, V.J.; Monson, P.R.; Ellison, P.E. The effect of solid particle mass loading on the pressure drop of HEPA filters. J. Aerosol Sci. 1992, 23, 657–665. [Google Scholar] [CrossRef]
  12. Choi, J.-H.; Ha, S.-J.; Bak, Y.-C.; Park, Y.-O. Particle size effect on the filtration drag of fly ash from a coal power plant. Korean J. Chem. Eng. 2002, 19, 1085–1090. [Google Scholar] [CrossRef]
  13. Dolny, S.; Rogozinski, T.; Dobak, S. Methodology of pilot-scale studies on pulse-jet filtration of air polluted with wood dust. Wood Res. 2019, 64, 325–334. [Google Scholar]
  14. Chen, Y.-S.; Hsiau, S.-S. Influence of filtration superficial velocity on cake compression and cake formation. Chem. Eng. Process. Process Intensif. 2009, 48, 988–996. [Google Scholar] [CrossRef]
  15. Ito, L.X.; Aguiar, M.L. A study of the porosity of gas filtration cakes. Braz. J. Chem. Eng. 2009, 26, 307–315. [Google Scholar] [CrossRef]
  16. Koch, M.; Krammer, G. The Permeability Distribution (PD) Method for Filter Media Characterization. Aerosol Sci. Technol. 2008, 42, 433–444. [Google Scholar] [CrossRef]
  17. Choi, J.-H.; Ha, S.-J.; Park, Y.-O. The effect of particle shape on the pressure drop across the dust cake. Korean J. Chem. Eng. 2002, 19, 711–717. [Google Scholar] [CrossRef]
  18. Jeon, K.-J.; Jung, Y.-W. A simulation study on the compression behavior of dust cakes. Powder Technol. 2004, 141, 1–11. [Google Scholar] [CrossRef]
  19. Mračková, E.; Krišťák, Ľ.; Kučerka, M.; Gaff, M.; Gajtanska, M. Creation of wood dust during wood processing: Size analysis, dust separation, and occupational health. BioResources 2016, 11, 209–222. [Google Scholar] [CrossRef]
  20. Cirqueira, S.S.R.; Tanabe, E.H.; Aguiar, M.L. Evaluation of operating conditions during the pulse jet cleaning filtration using different surface treated fibrous filters. Process Saf. Environ. 2017, 105, 69–78. [Google Scholar] [CrossRef]
  21. Kanaoka, C.; Amornkitbamrung, M. Effect of filter permeability on the release of captured dust from a rigid ceramic filter surface. Powder Technol. 2001, 118, 113–120. [Google Scholar] [CrossRef]
  22. Lupion, M.; Rodriguez-Galan, M.; Alonso-Fariñas, B.; Gutierrez Ortiz, F.J. Investigation into the parameters of influence on dust cake porosity in hot gas filtration. Powder Technol. 2014, 264, 592–598. [Google Scholar] [CrossRef]
  23. Saleem, M.; Khan, R.U.; Tahir, M.S.; Krammer, G. Experimental study of cake formation on heat treated and membrane coated needle felts in a pilot scale pulse jet bag filter using optical in-situ cake height measurement. Powder Technol. 2011, 214, 388–399. [Google Scholar] [CrossRef] [Green Version]
  24. Tanabe, E.; Barros, P.; Rodrigues, K.; Aguiar, M. Experimental investigation of deposition and removal of particles during gas filtration with various fabric filters. Sep. Purif. Technol. 2011, 80, 187–195. [Google Scholar] [CrossRef]
  25. Saleem, M.; Krammer, G. Optical in-situ measurement of filter cake height during bag filter plant operation. Powder Technol. 2007, 173, 93–106. [Google Scholar] [CrossRef]
  26. Ellenbecker, M.J.; Leith, D. The effect of dust retention on pressure drop in a high velocity pulse-jet fabric filter. Powder Technol. 1980, 25, 147–154. [Google Scholar] [CrossRef]
Figure 1. Particle size distribution of dust.
Sustainability 12 04816 g001
Figure 2. Test rig set-up; 1—filtration chamber, 2—filter bag, 3—supporting cage, 4—Venturi tube, 5—dust feeder, 6—dust inlet tube, 7—clean air chamber, 8—tube with cleaning nozzle, 9—compressed air tank, 10—cleaning control device, 11—outlet tube, 12—Prandtl tube, 13—differential manometer for air velocity control, 14—regulation valve, 15—main fan, 16—differential manometer for pressure drop measurements.
Sustainability 12 04816 g002
Figure 3. Pressure drop across clean filter media.
Sustainability 12 04816 g003
Figure 4. Pressure drop through the clean filter media.
Sustainability 12 04816 g004
Figure 5. Total pressure drop during filtration, filtration velocity 0.0306 m∙s−1; dust concentration at the filter inlet: a—10 g∙m−3, b—15 g∙m−3, c—20 g∙m−3, d—25 g∙m−3, e—30 g∙m−3, f—35 g∙m−3, g—40 g∙m−3.
Sustainability 12 04816 g005
Figure 6. Total pressure drop during filtration, filtration velocity 0.0405 m∙s−1; dust concentration at the filter inlet: a—10 g∙m−3, b—15 g∙m−3, c—20 g∙m−3, d—25 g∙m−3, e—30 g∙m−3, f—35 g∙m−3, g—40 g∙m−3.
Sustainability 12 04816 g006
Figure 7. Total pressure drop during filtration, filtration velocity 0.0484 m∙s−1; dust concentration at the filter inlet: a—10 g∙m−3, b—15 g∙m−3, c—20 g∙m−3, d—25 g∙m−3, e—30 g∙m−3, f—35 g∙m−3, g—40 g∙m−3.
Sustainability 12 04816 g007
Figure 8. Influence of filtration velocity and dust concentration at the filter inlet on the specific wood dust resistance coefficient (PES 500 g).
Sustainability 12 04816 g008
Figure 9. Influence of filtration velocity and dust concentration at the filter inlet on the specific wood dust resistance coefficient (PES 500 g with PTFE membrane).
Sustainability 12 04816 g009
Table 1. Filter media.
Medium TypePES 500 gPES with PTFE Membrane
area density500 g·m−2500 g·m−2
fiber materialPESPES
fabric finishheat setting, singeing, calenderingheat setting, PTFE membrane
air permeability200 dm3·dm−2·min−130 dm3·dm−2·min−1
thickness2.1 mm2.2 mm
the highestlongitudinal145 daN110 daN
tensiontransverse155 daN110 daN
retracility at 140 °C<1%<1%
maximumcontinuous140 °C140 °C
temperatureintermittent150 °C150 °C
Table 2. Experimental filtration parameters.
ParameterValue
Filtration velocity0.0306; 0.0405; 0.0484; m·s−1
Dust concentration at filter inlet10; 15; 20; 25; 30; 35; 40; g·m−3
Cleaning pulse pressure 5 MPa
Duration of filtration cycle300 s
Table 3. Total pressure drop and pressure drop through the dust cake.
S
[g·m−3]
wf 0.0306 m·s−1wf 0.0405 m·s−1wf 0.484 m·s−1
PES 500 gPES 500 g with PTFE MembranePES 500 gPES 500 g with PTFE MembranePES 500 gPES 500 g with PTFE Membrane
ΔpcΔppΔpcΔppΔpcΔppΔpcΔppΔpcΔppΔpcΔpp
1034.310.12105.312.7355.523.54150.127.5760.622.47172.626.12
1535.411.28103.010.4257.125.20162.539.9261.823.62180.434.00
2040.616.45106.413.8061.429.48165.743.2163.225.06180.133.67
2541.517.34105.813.2461.029.04164.742.1964.326.09182.736.23
3041.717.61104.311.7663.531.57164.441.8864.025.87184.438.01
3543.519.39104.111.5063.831.88163.040.4264.426.18189.743.30
4044.720.60103.010.4165.233.24160.638.0769.531.36195.448.99

