Vulnerability Assessment and Adaptation Strategies for the Impact of Climate Change on Agricultural Land in Southern Taiwan


Abstract
:1. Introduction
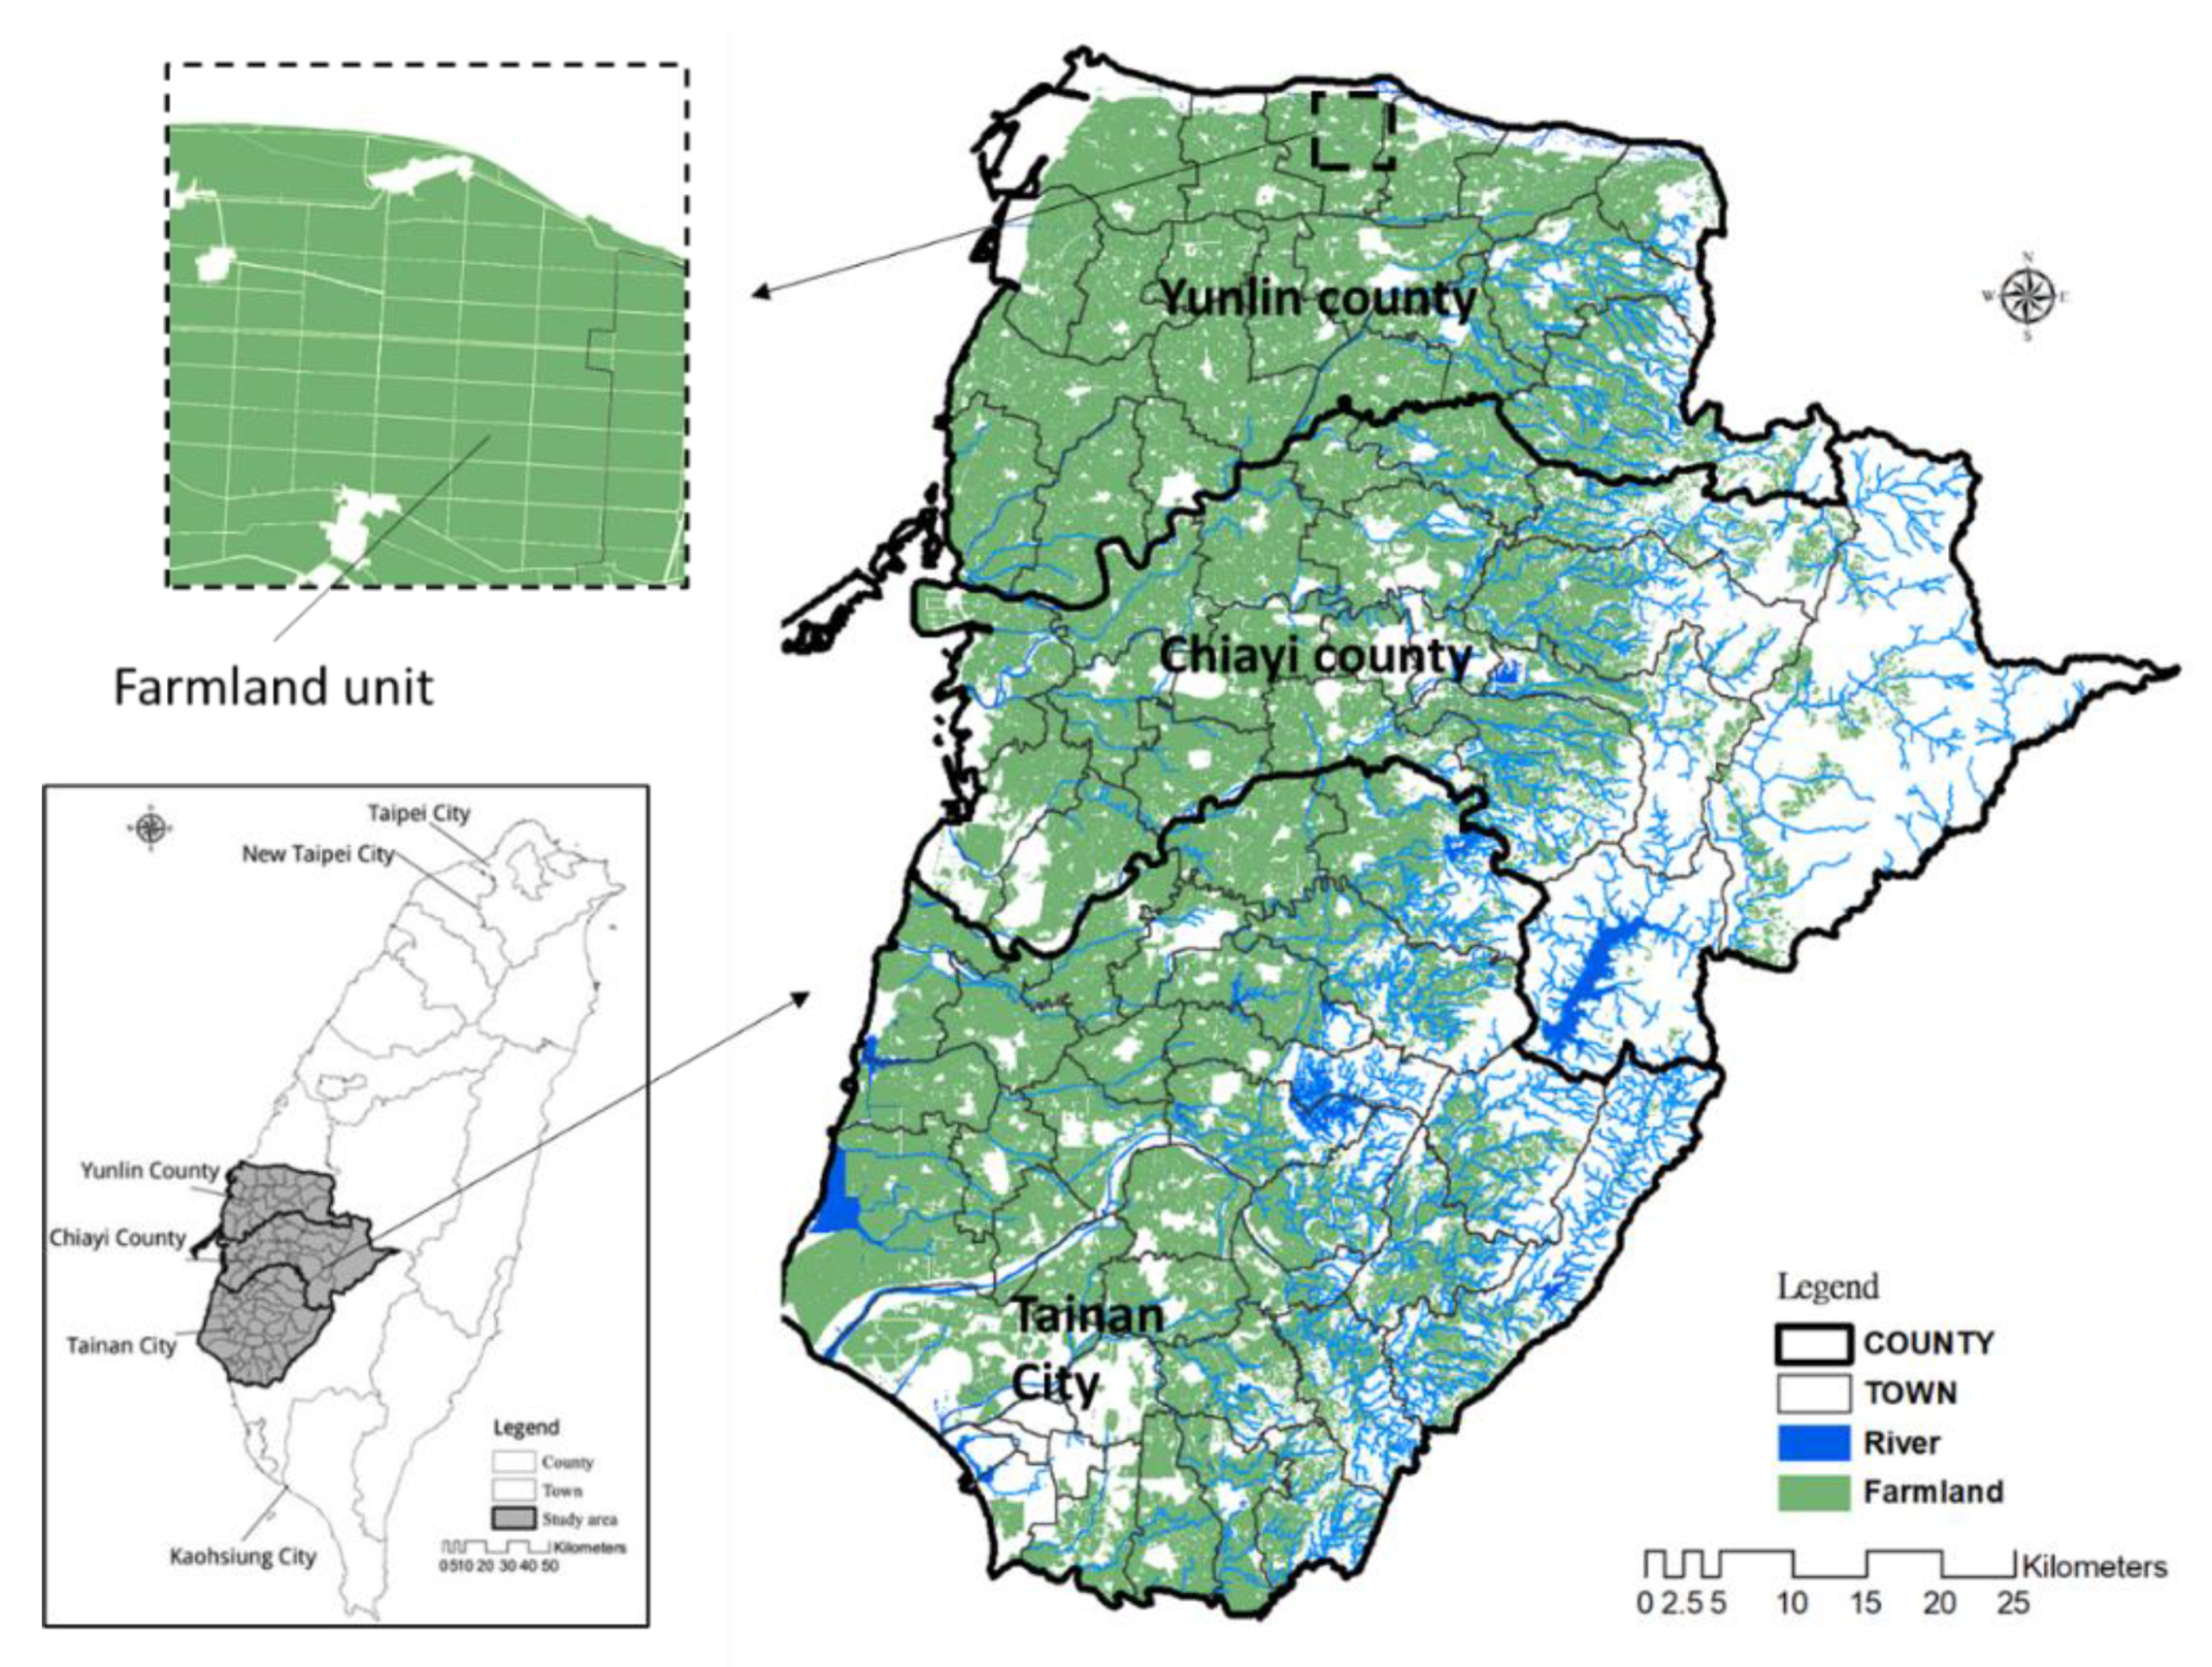
2. Case Study Area: Southern Taiwan
3. Methodology and Materials
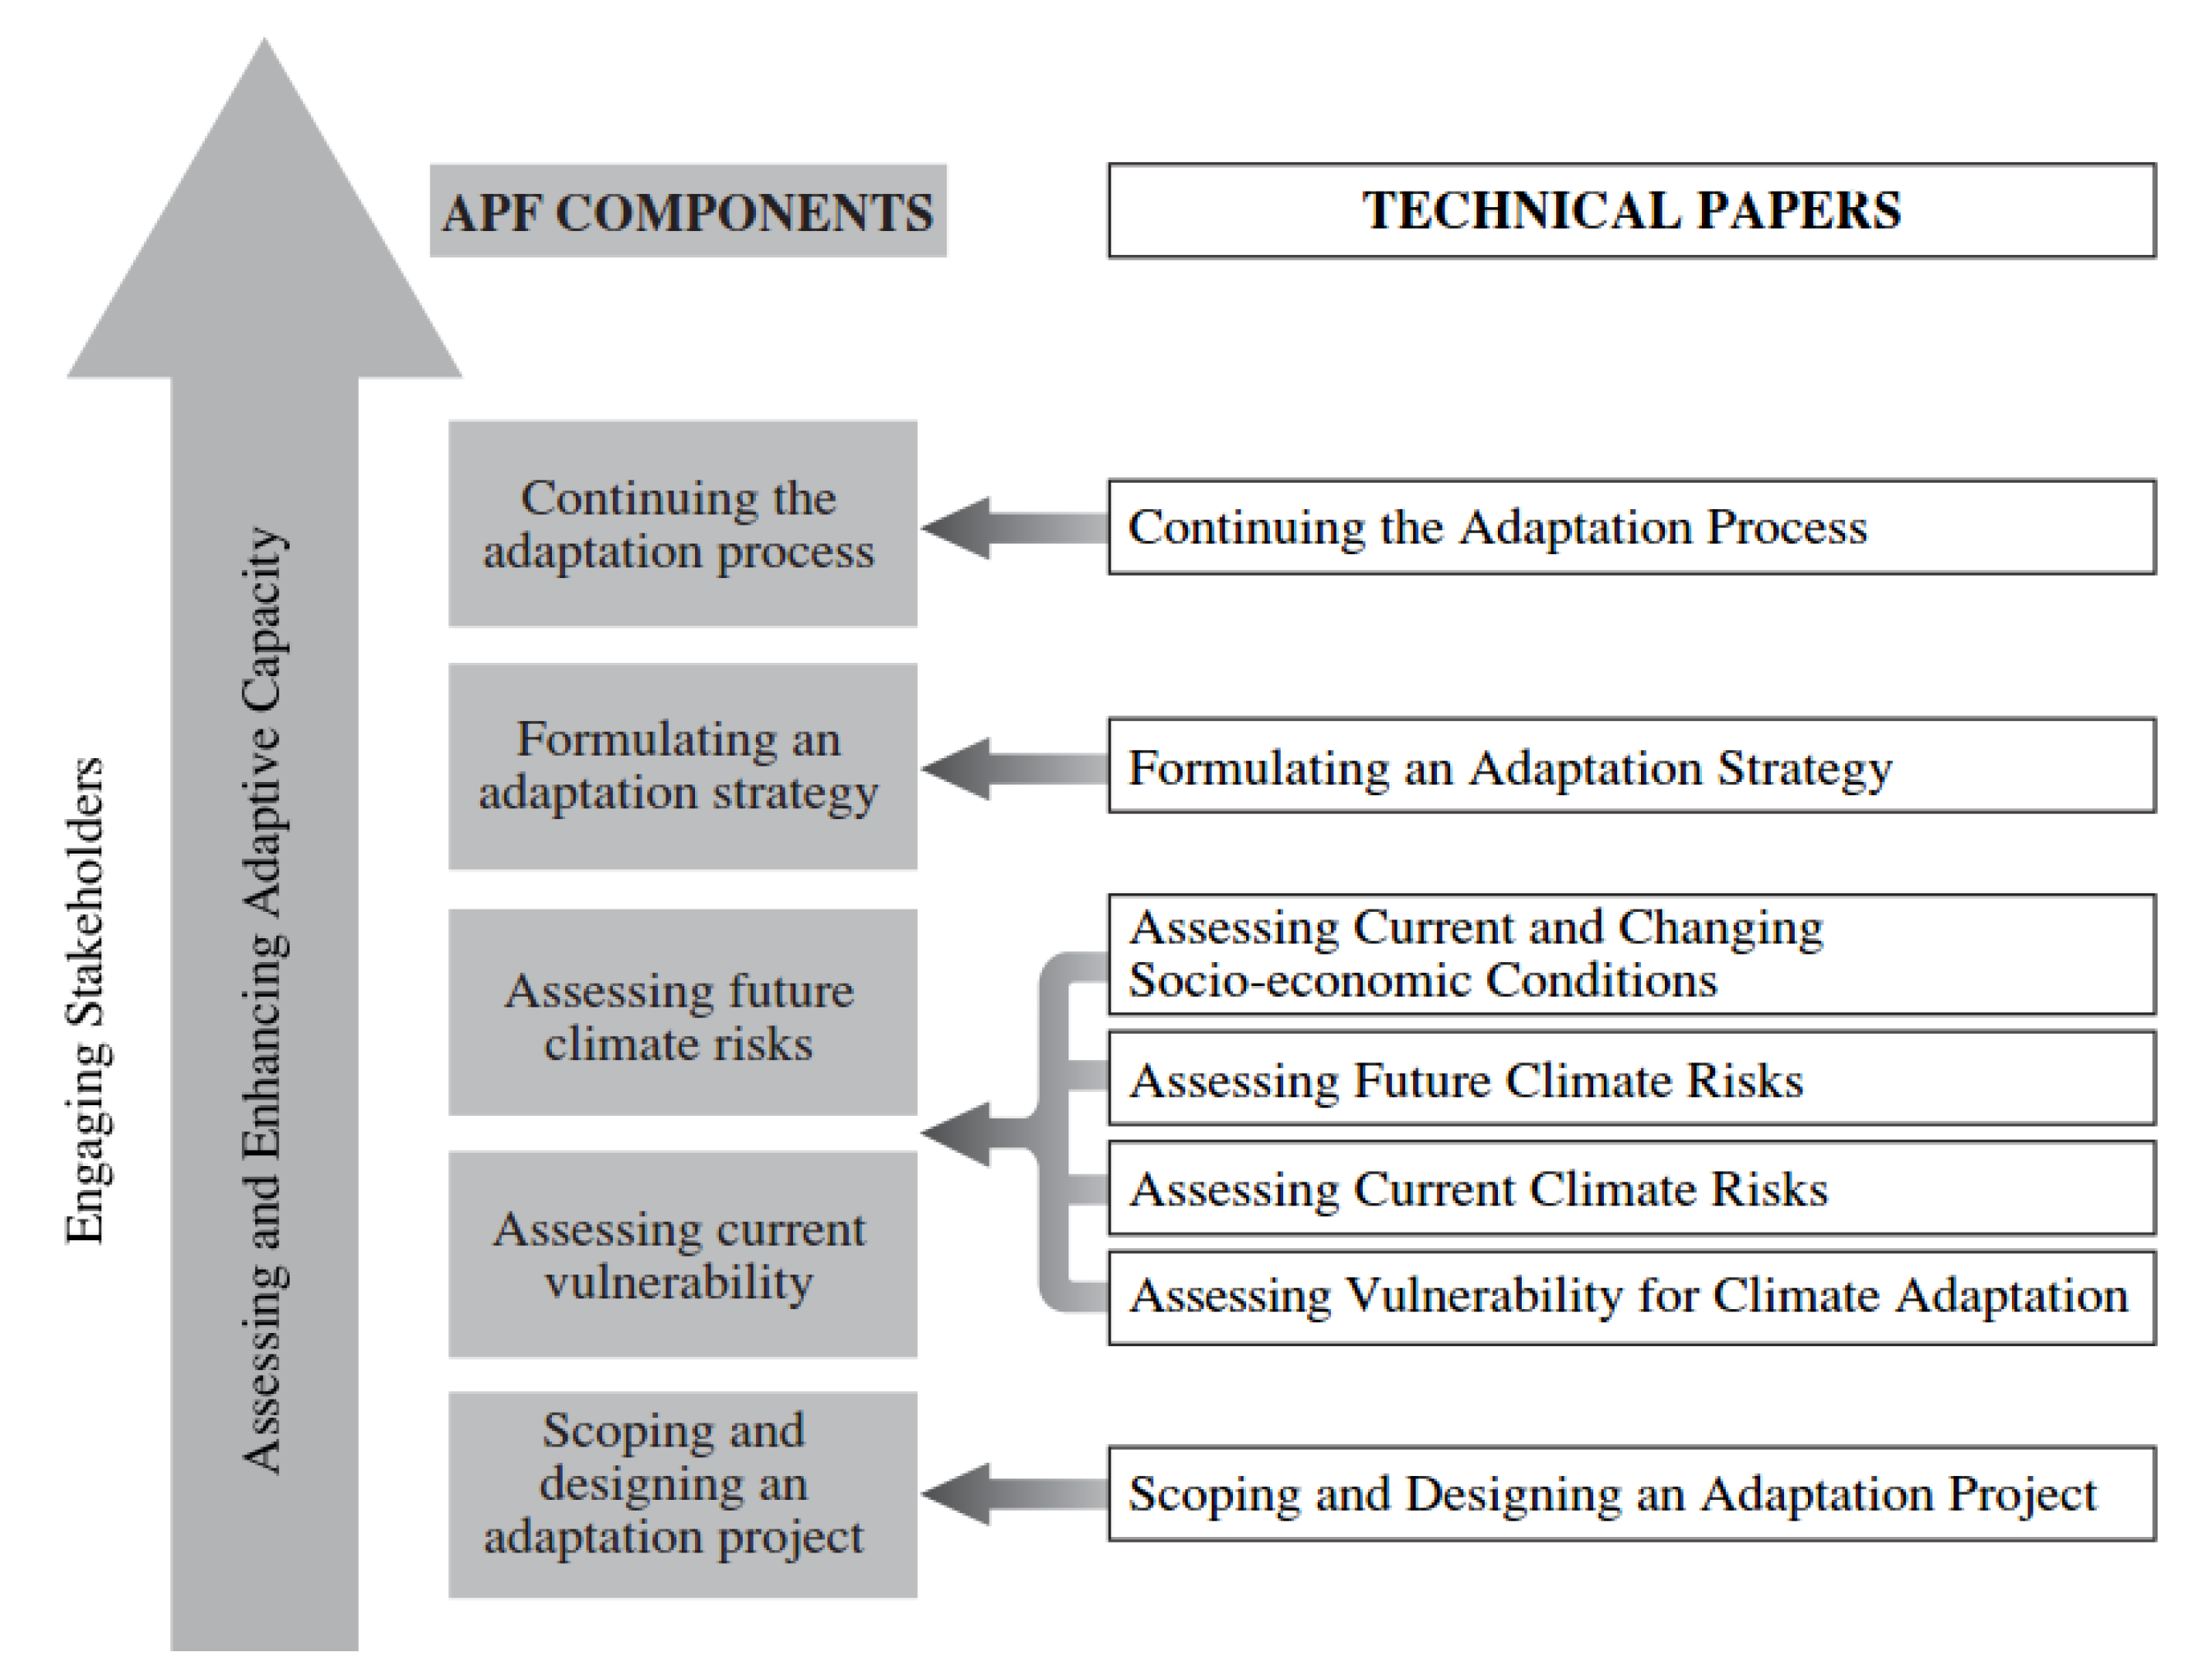
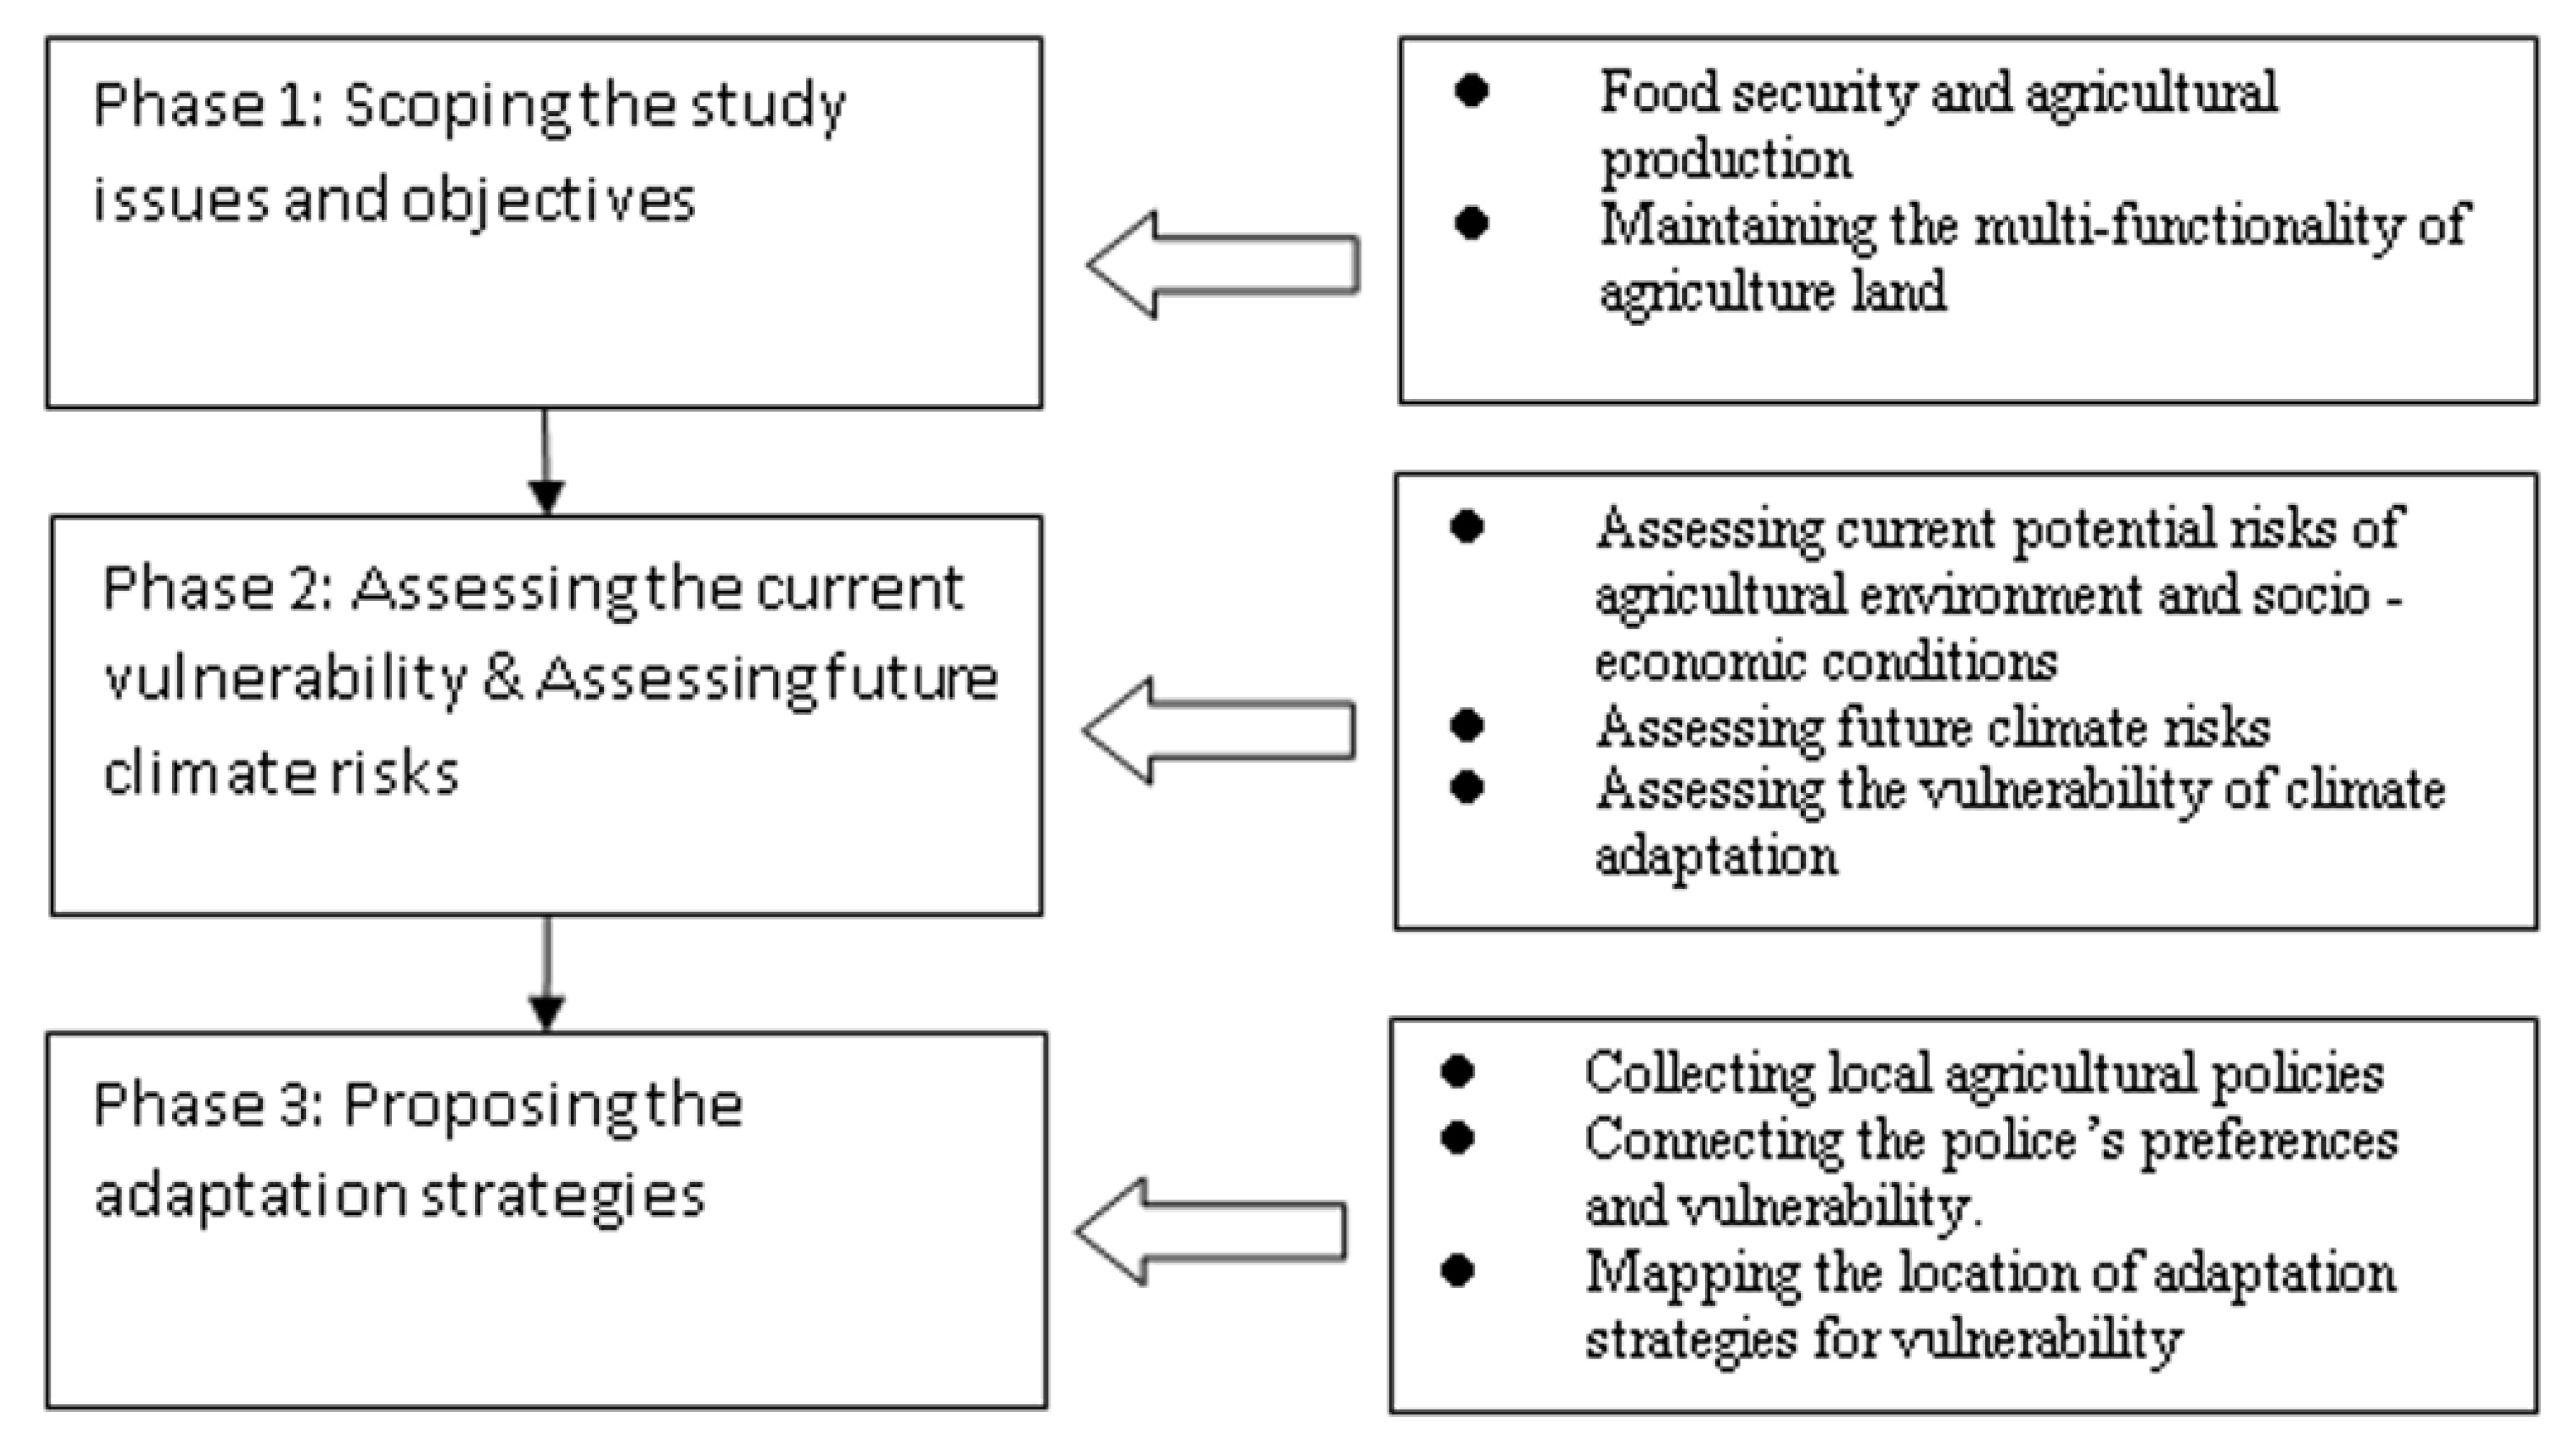
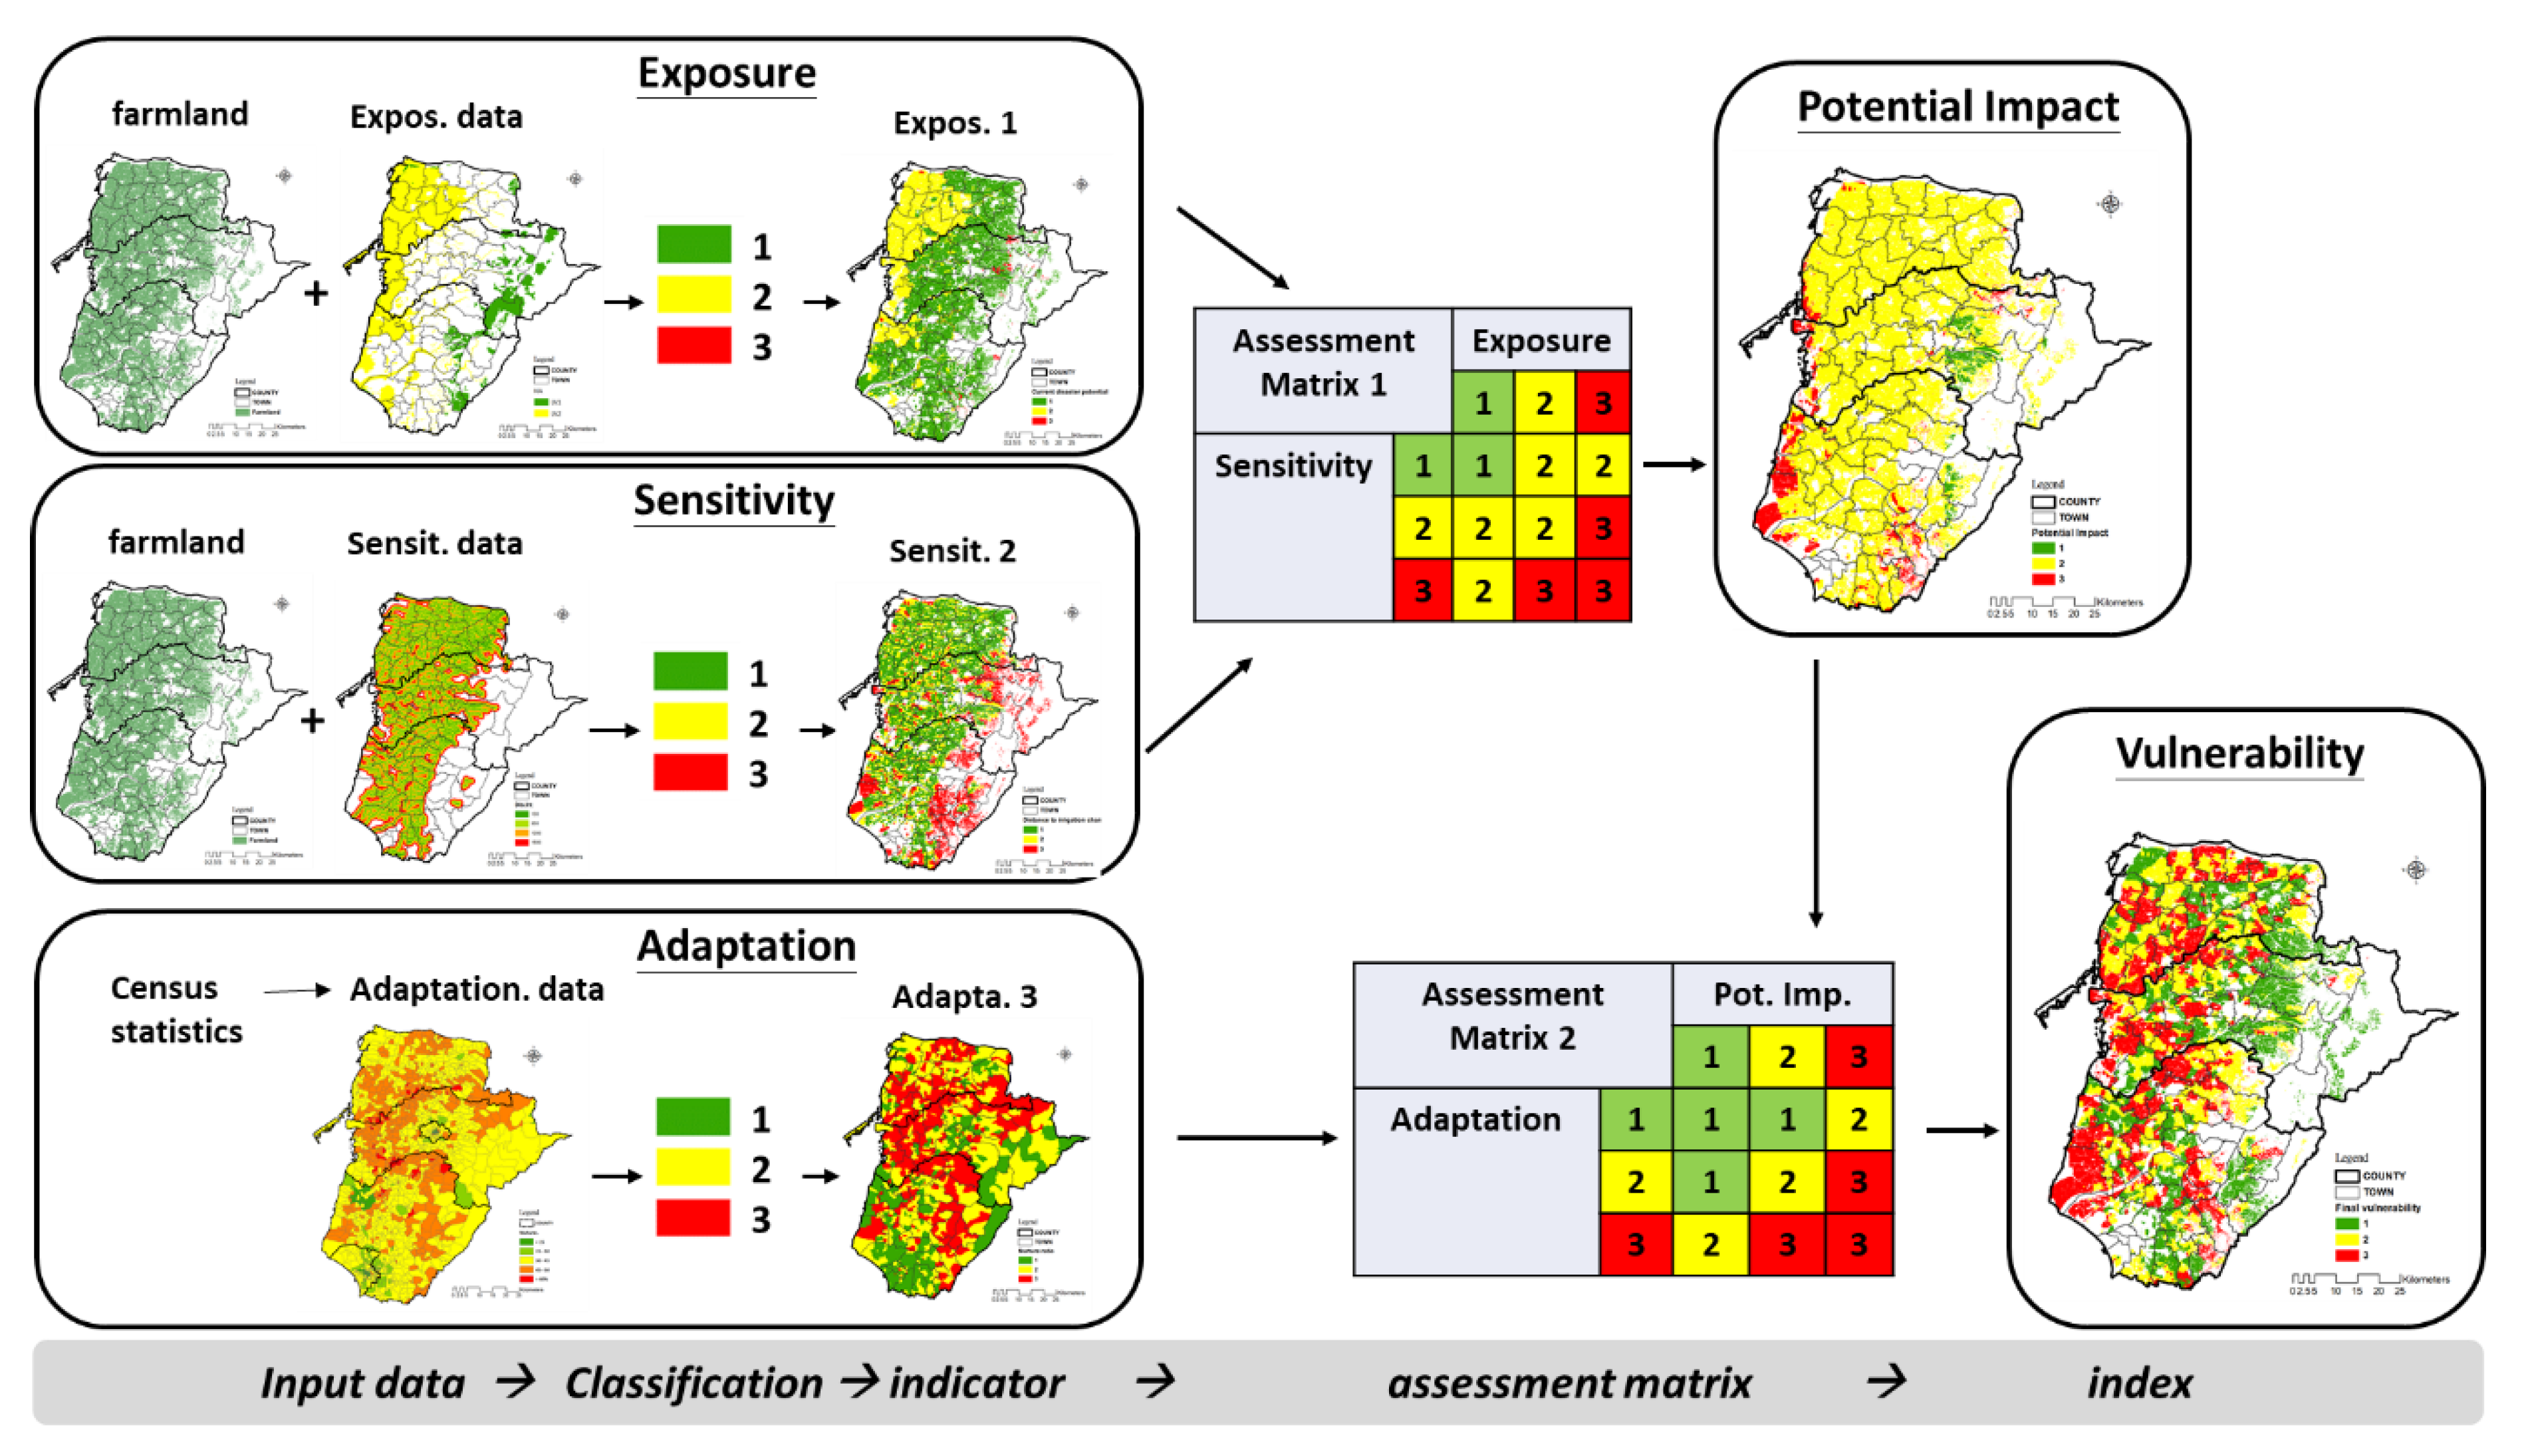
3.1. Analysis Framework
3.2. Vulnerability Indicator System for Agricultural Land
3.2.1. Exposure Criteria
3.2.2. Sensitivity Criteria
3.2.3. Adaptation Criteria
3.3. Data Source
4. Results: Vulnerability Assessment and Adaptation Strategies
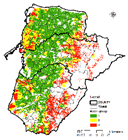
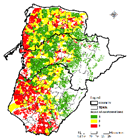
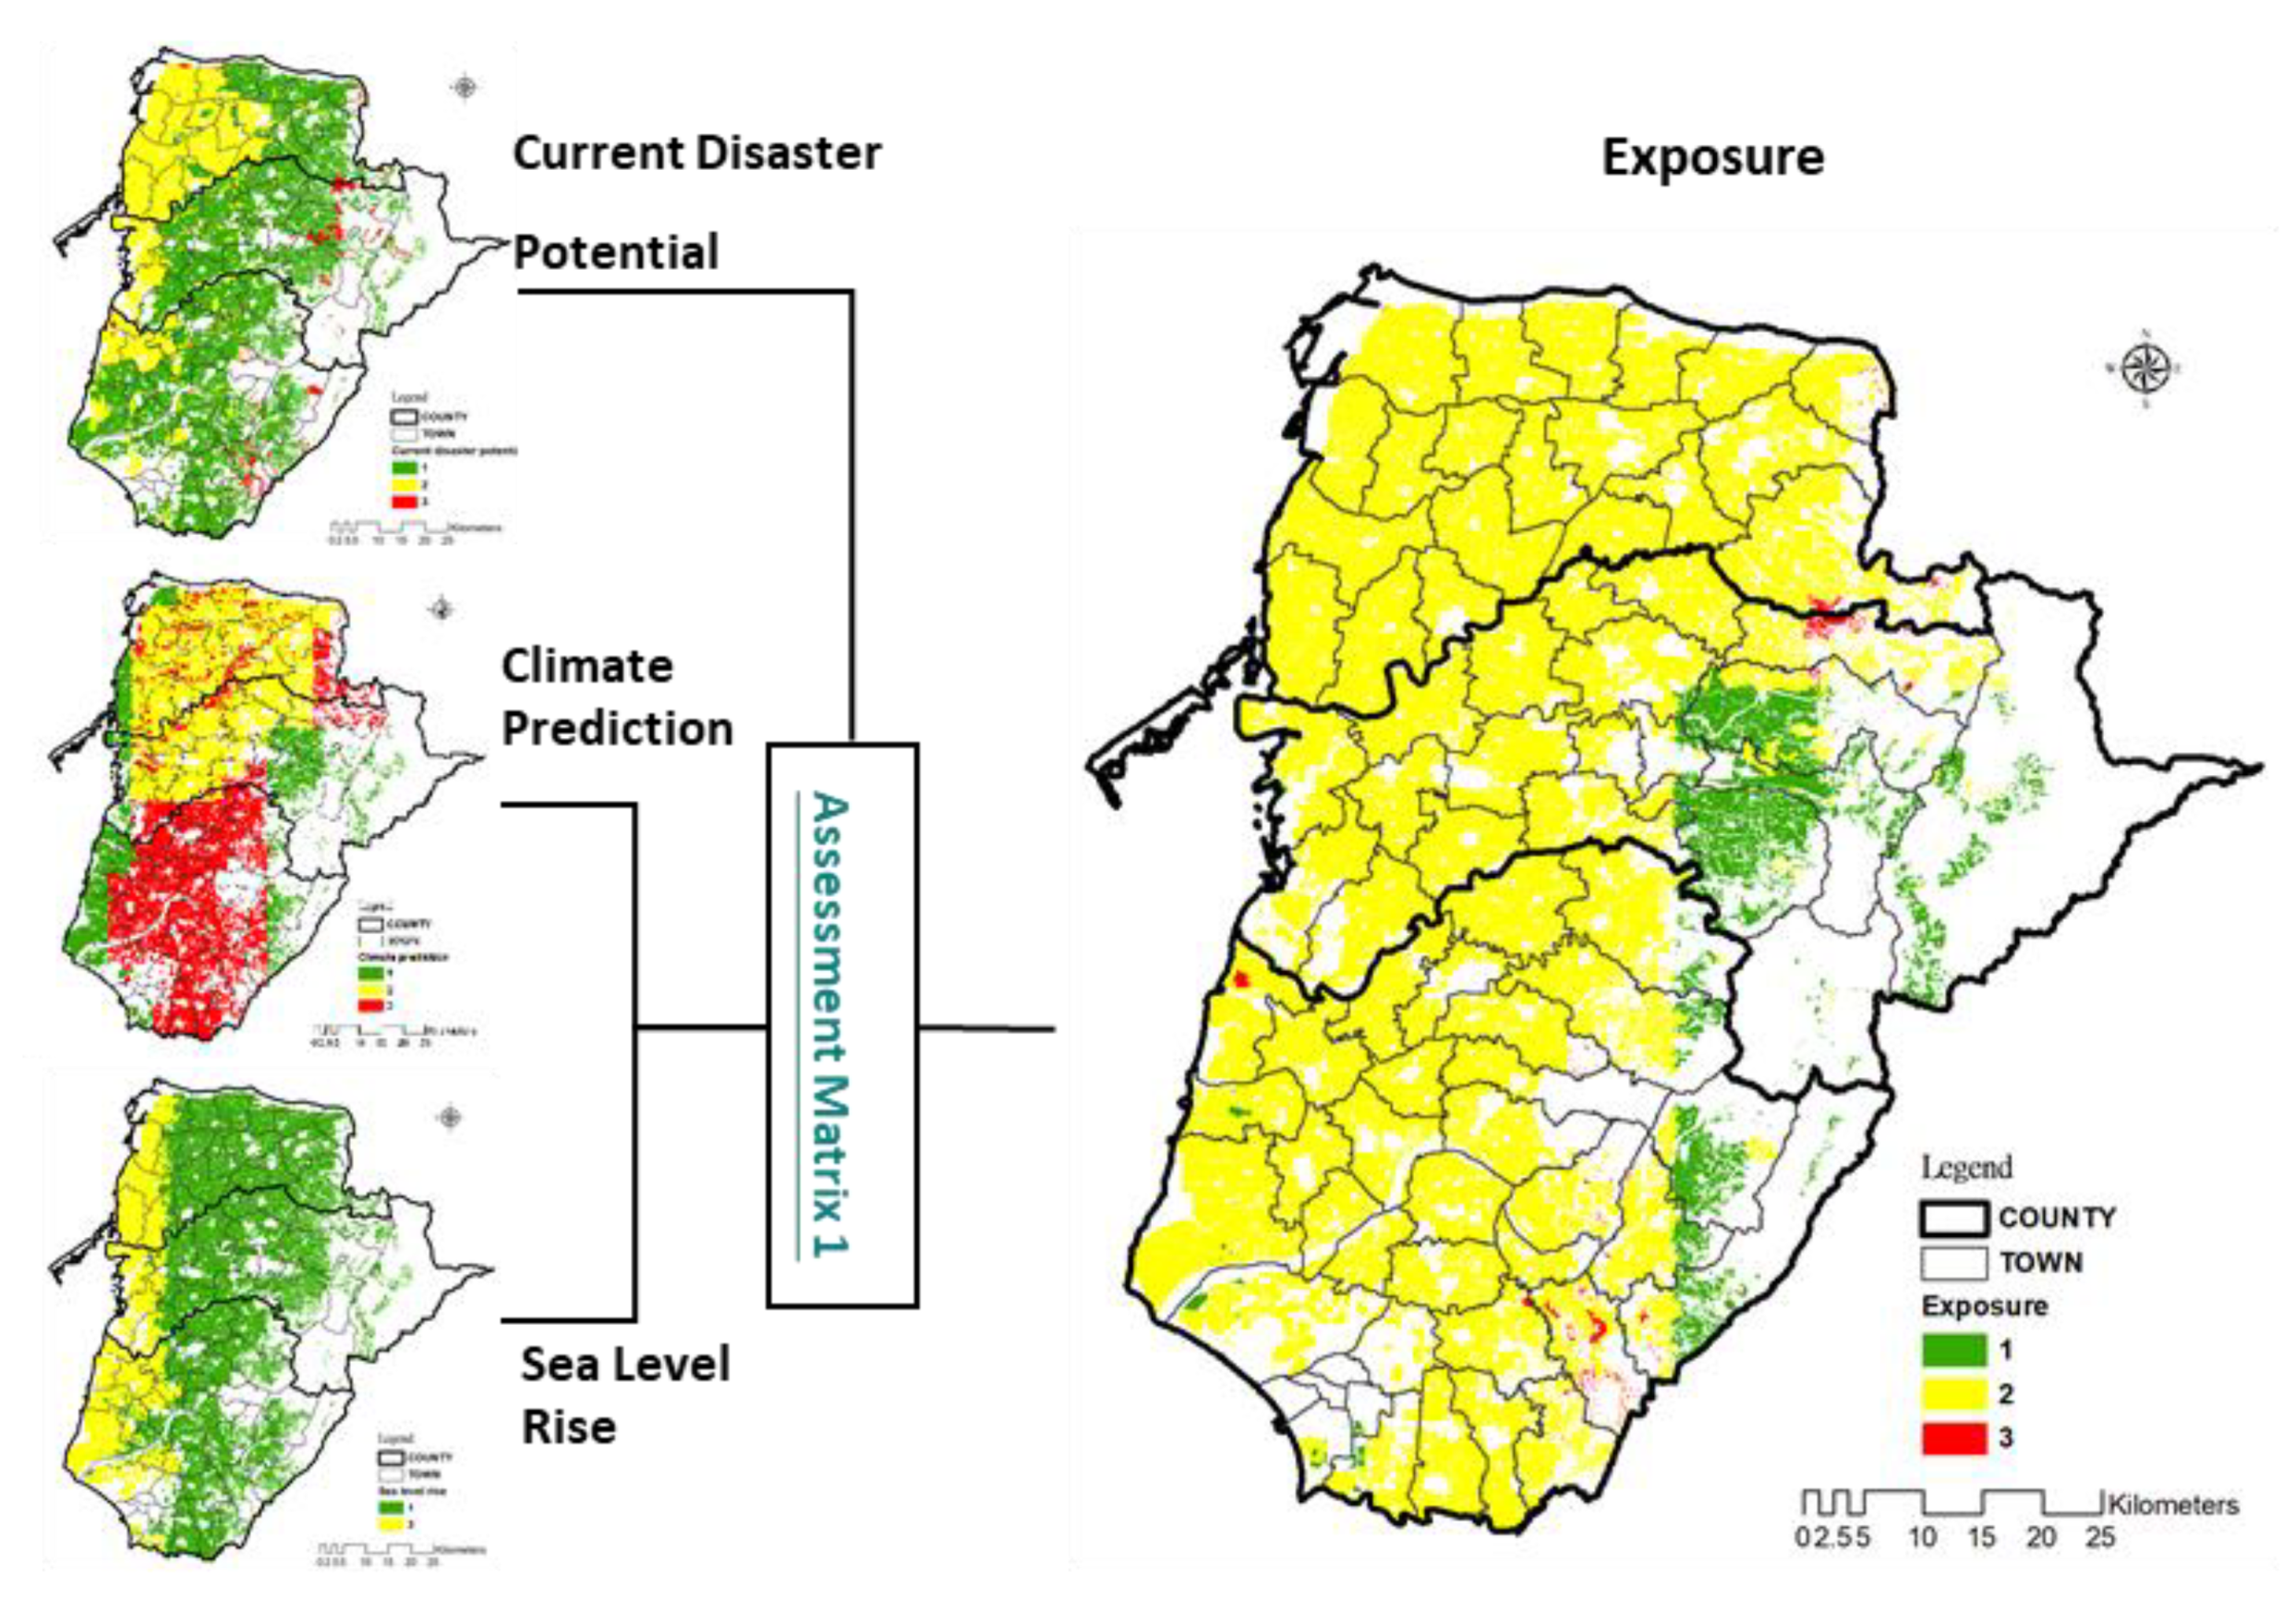
4.1. Exposure
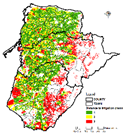
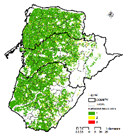
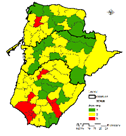
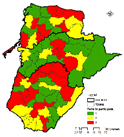
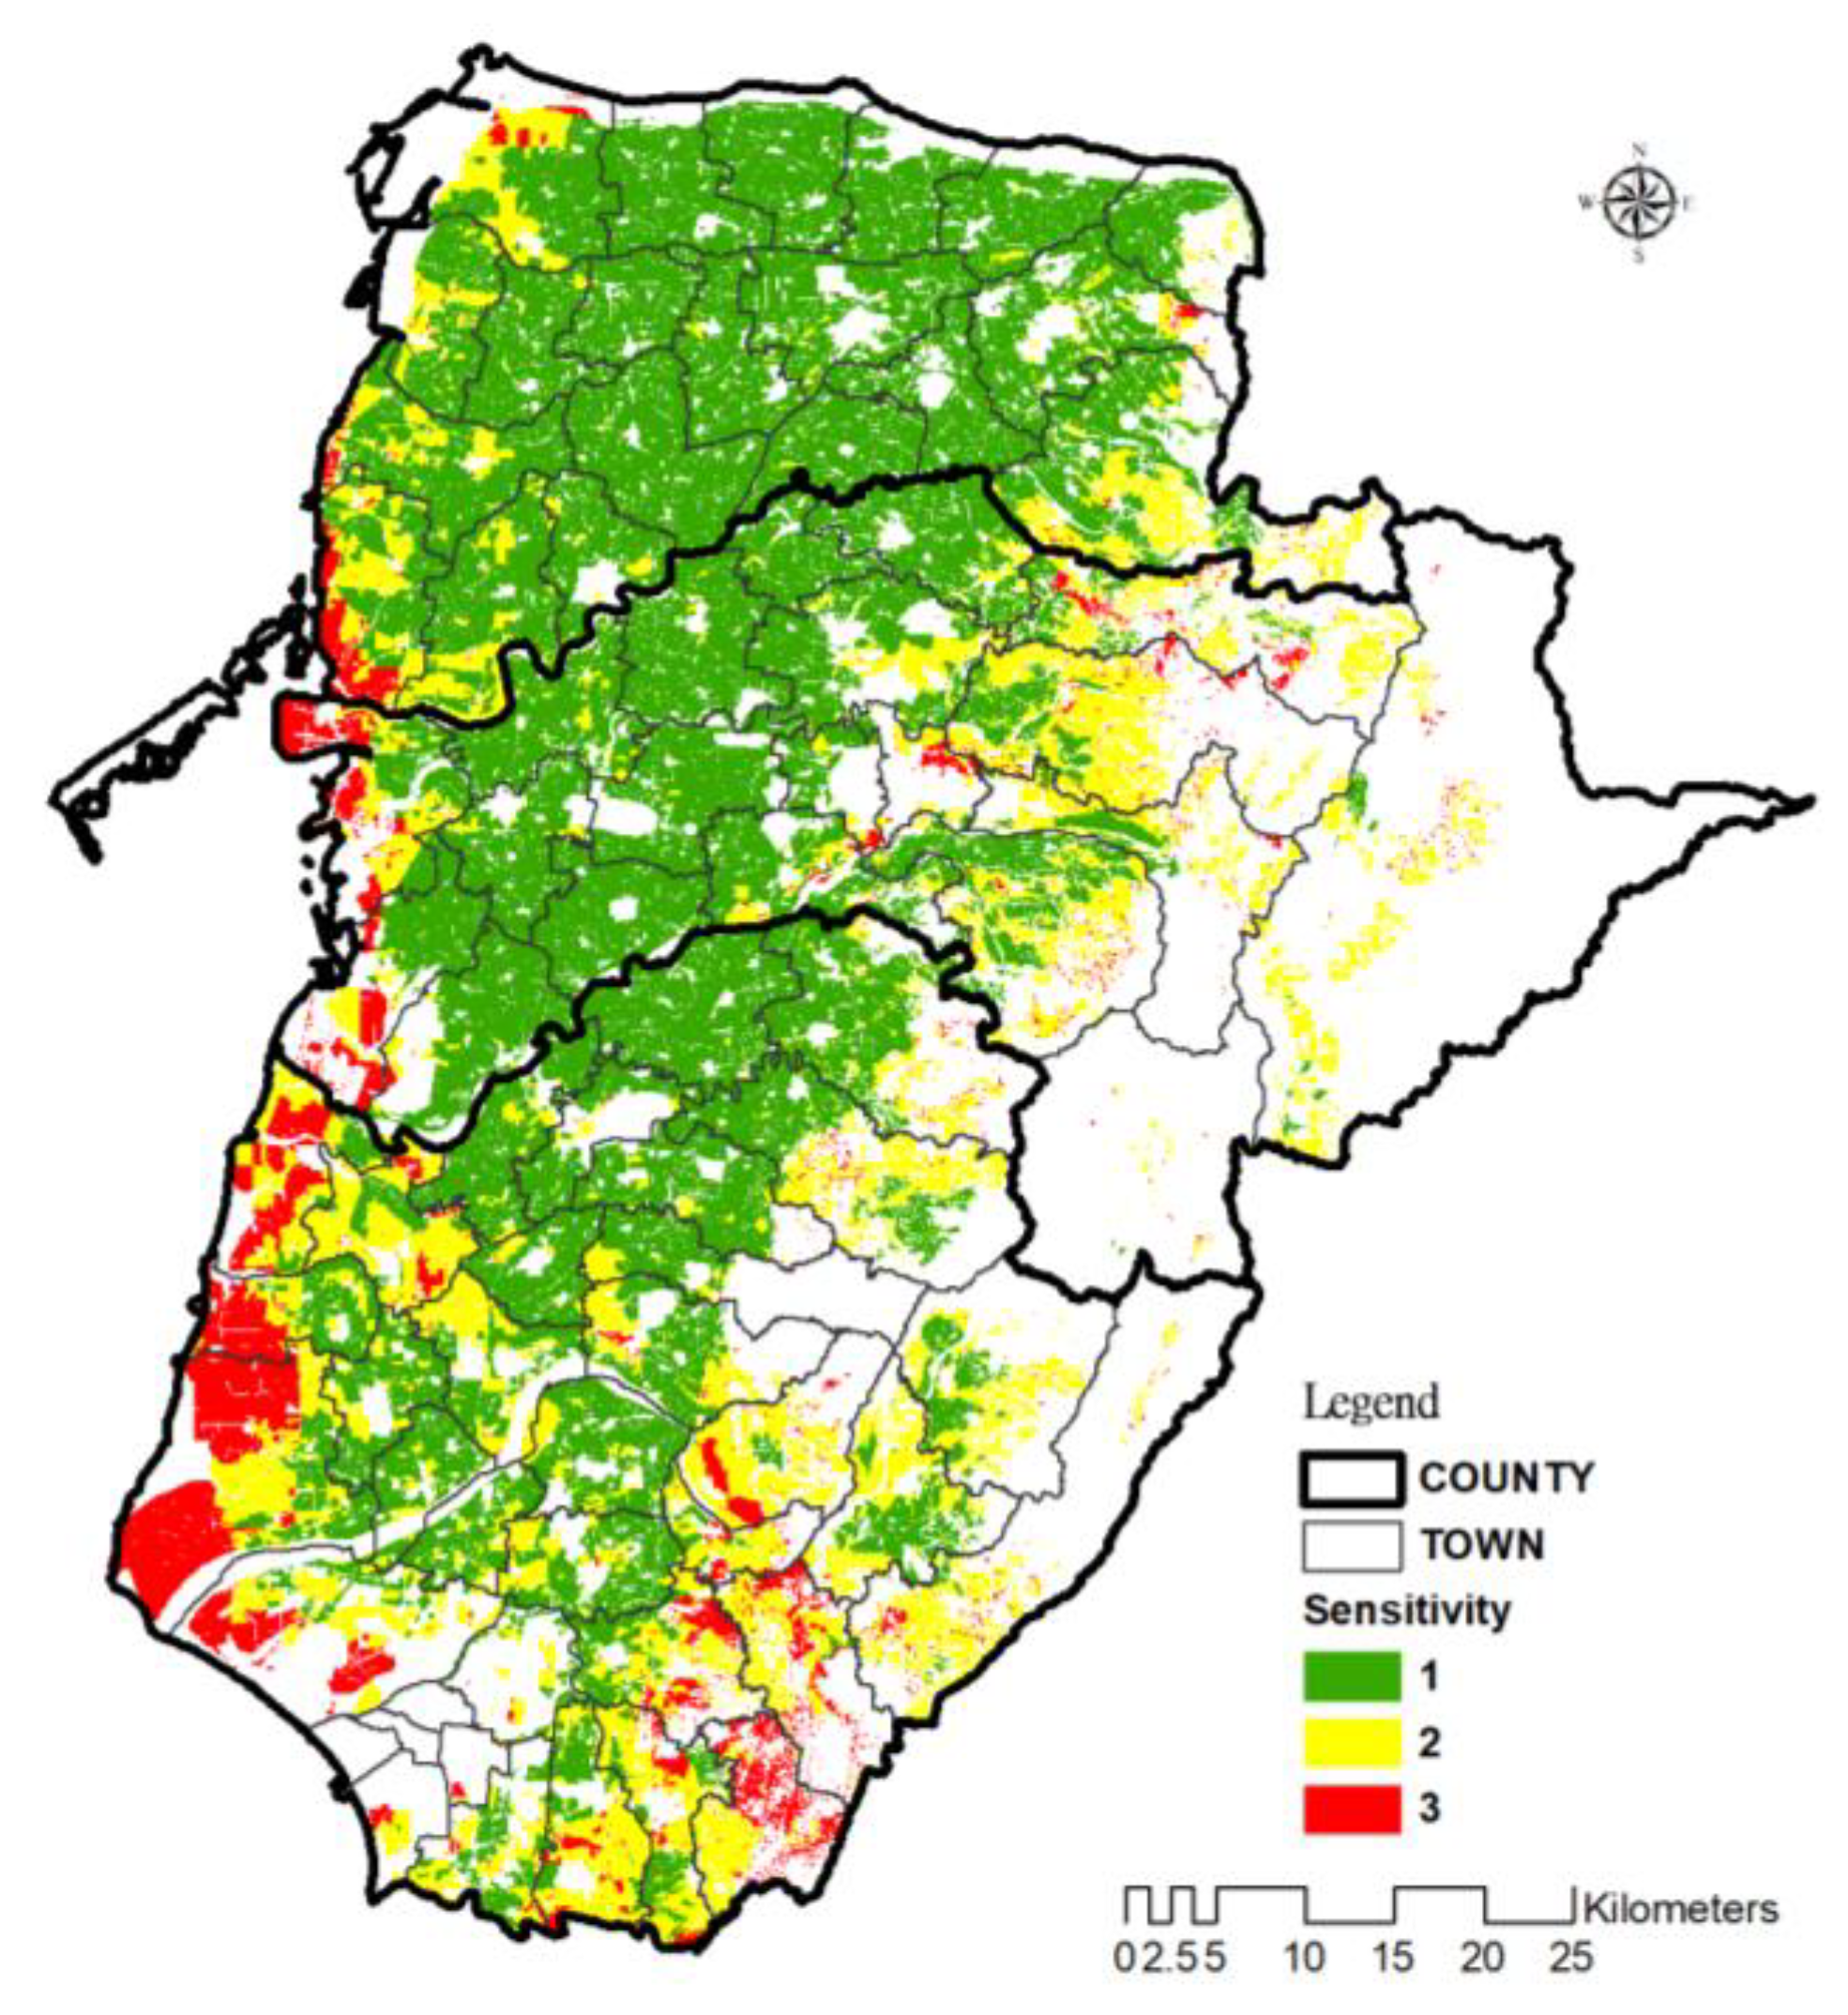
4.2. Sensitivity
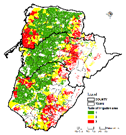
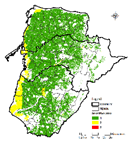
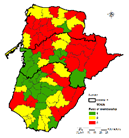
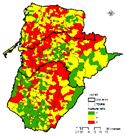
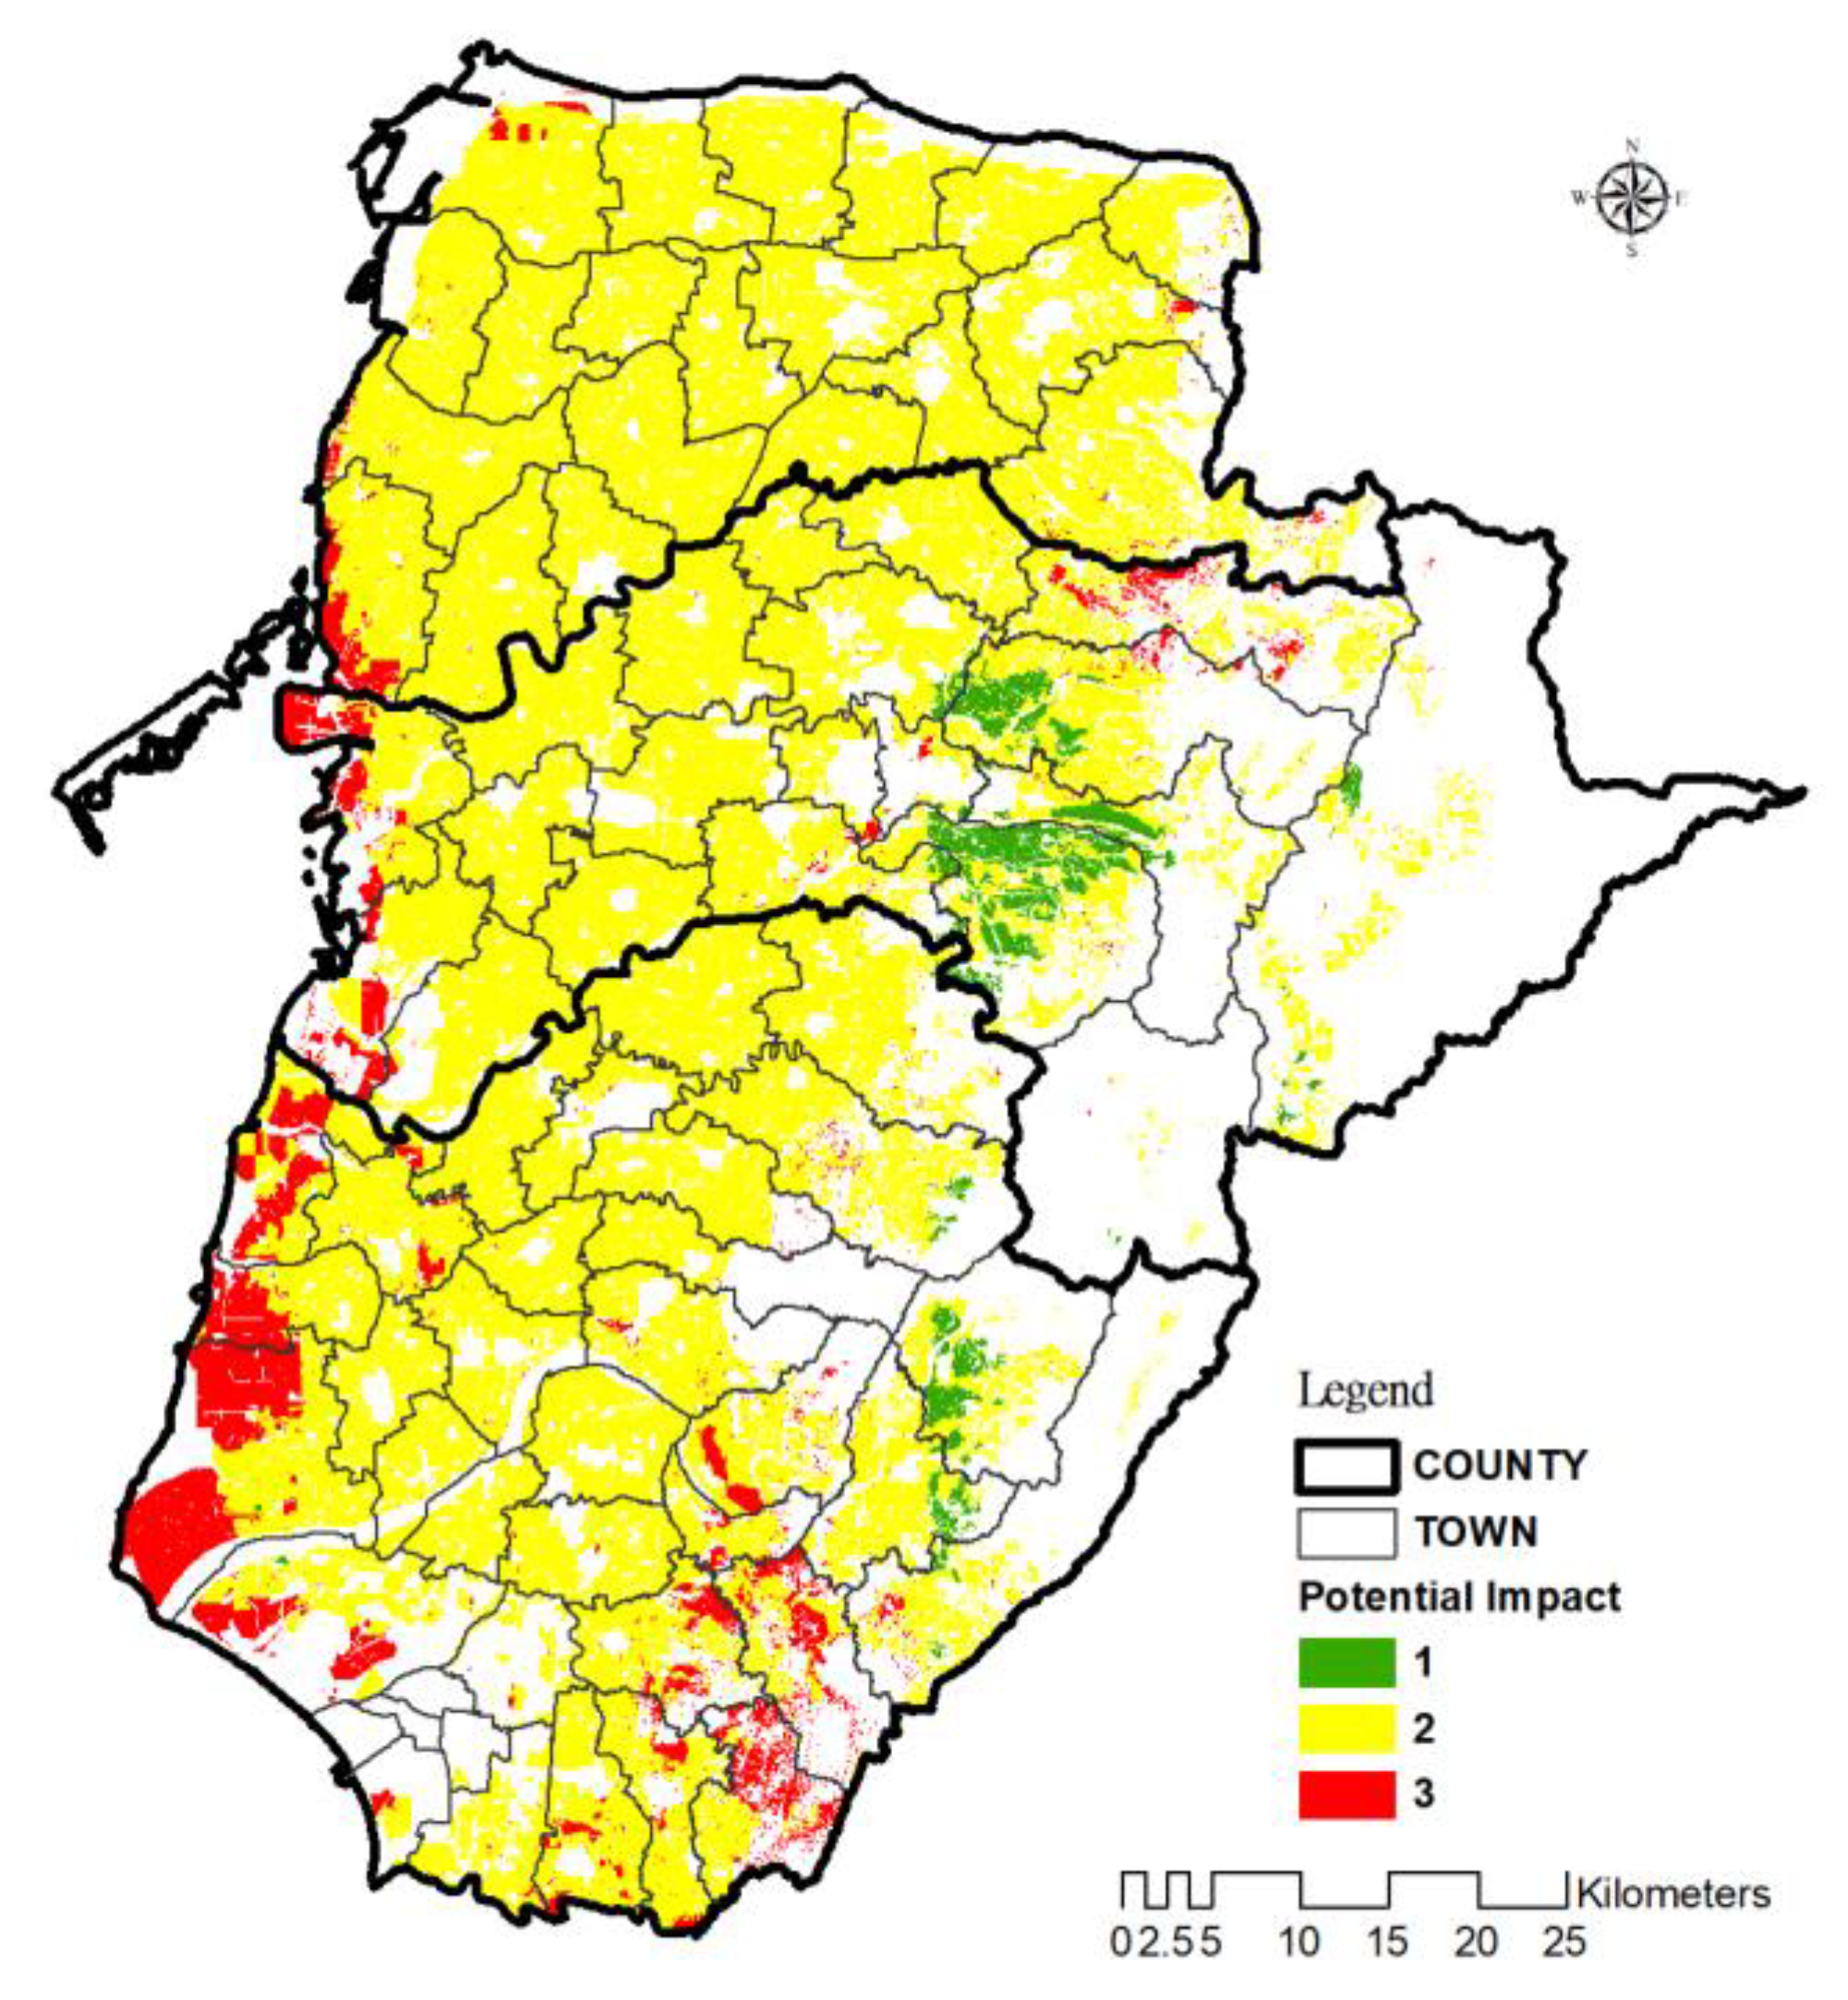
4.3. Potential Impact
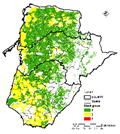
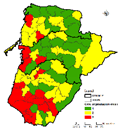
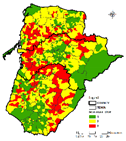
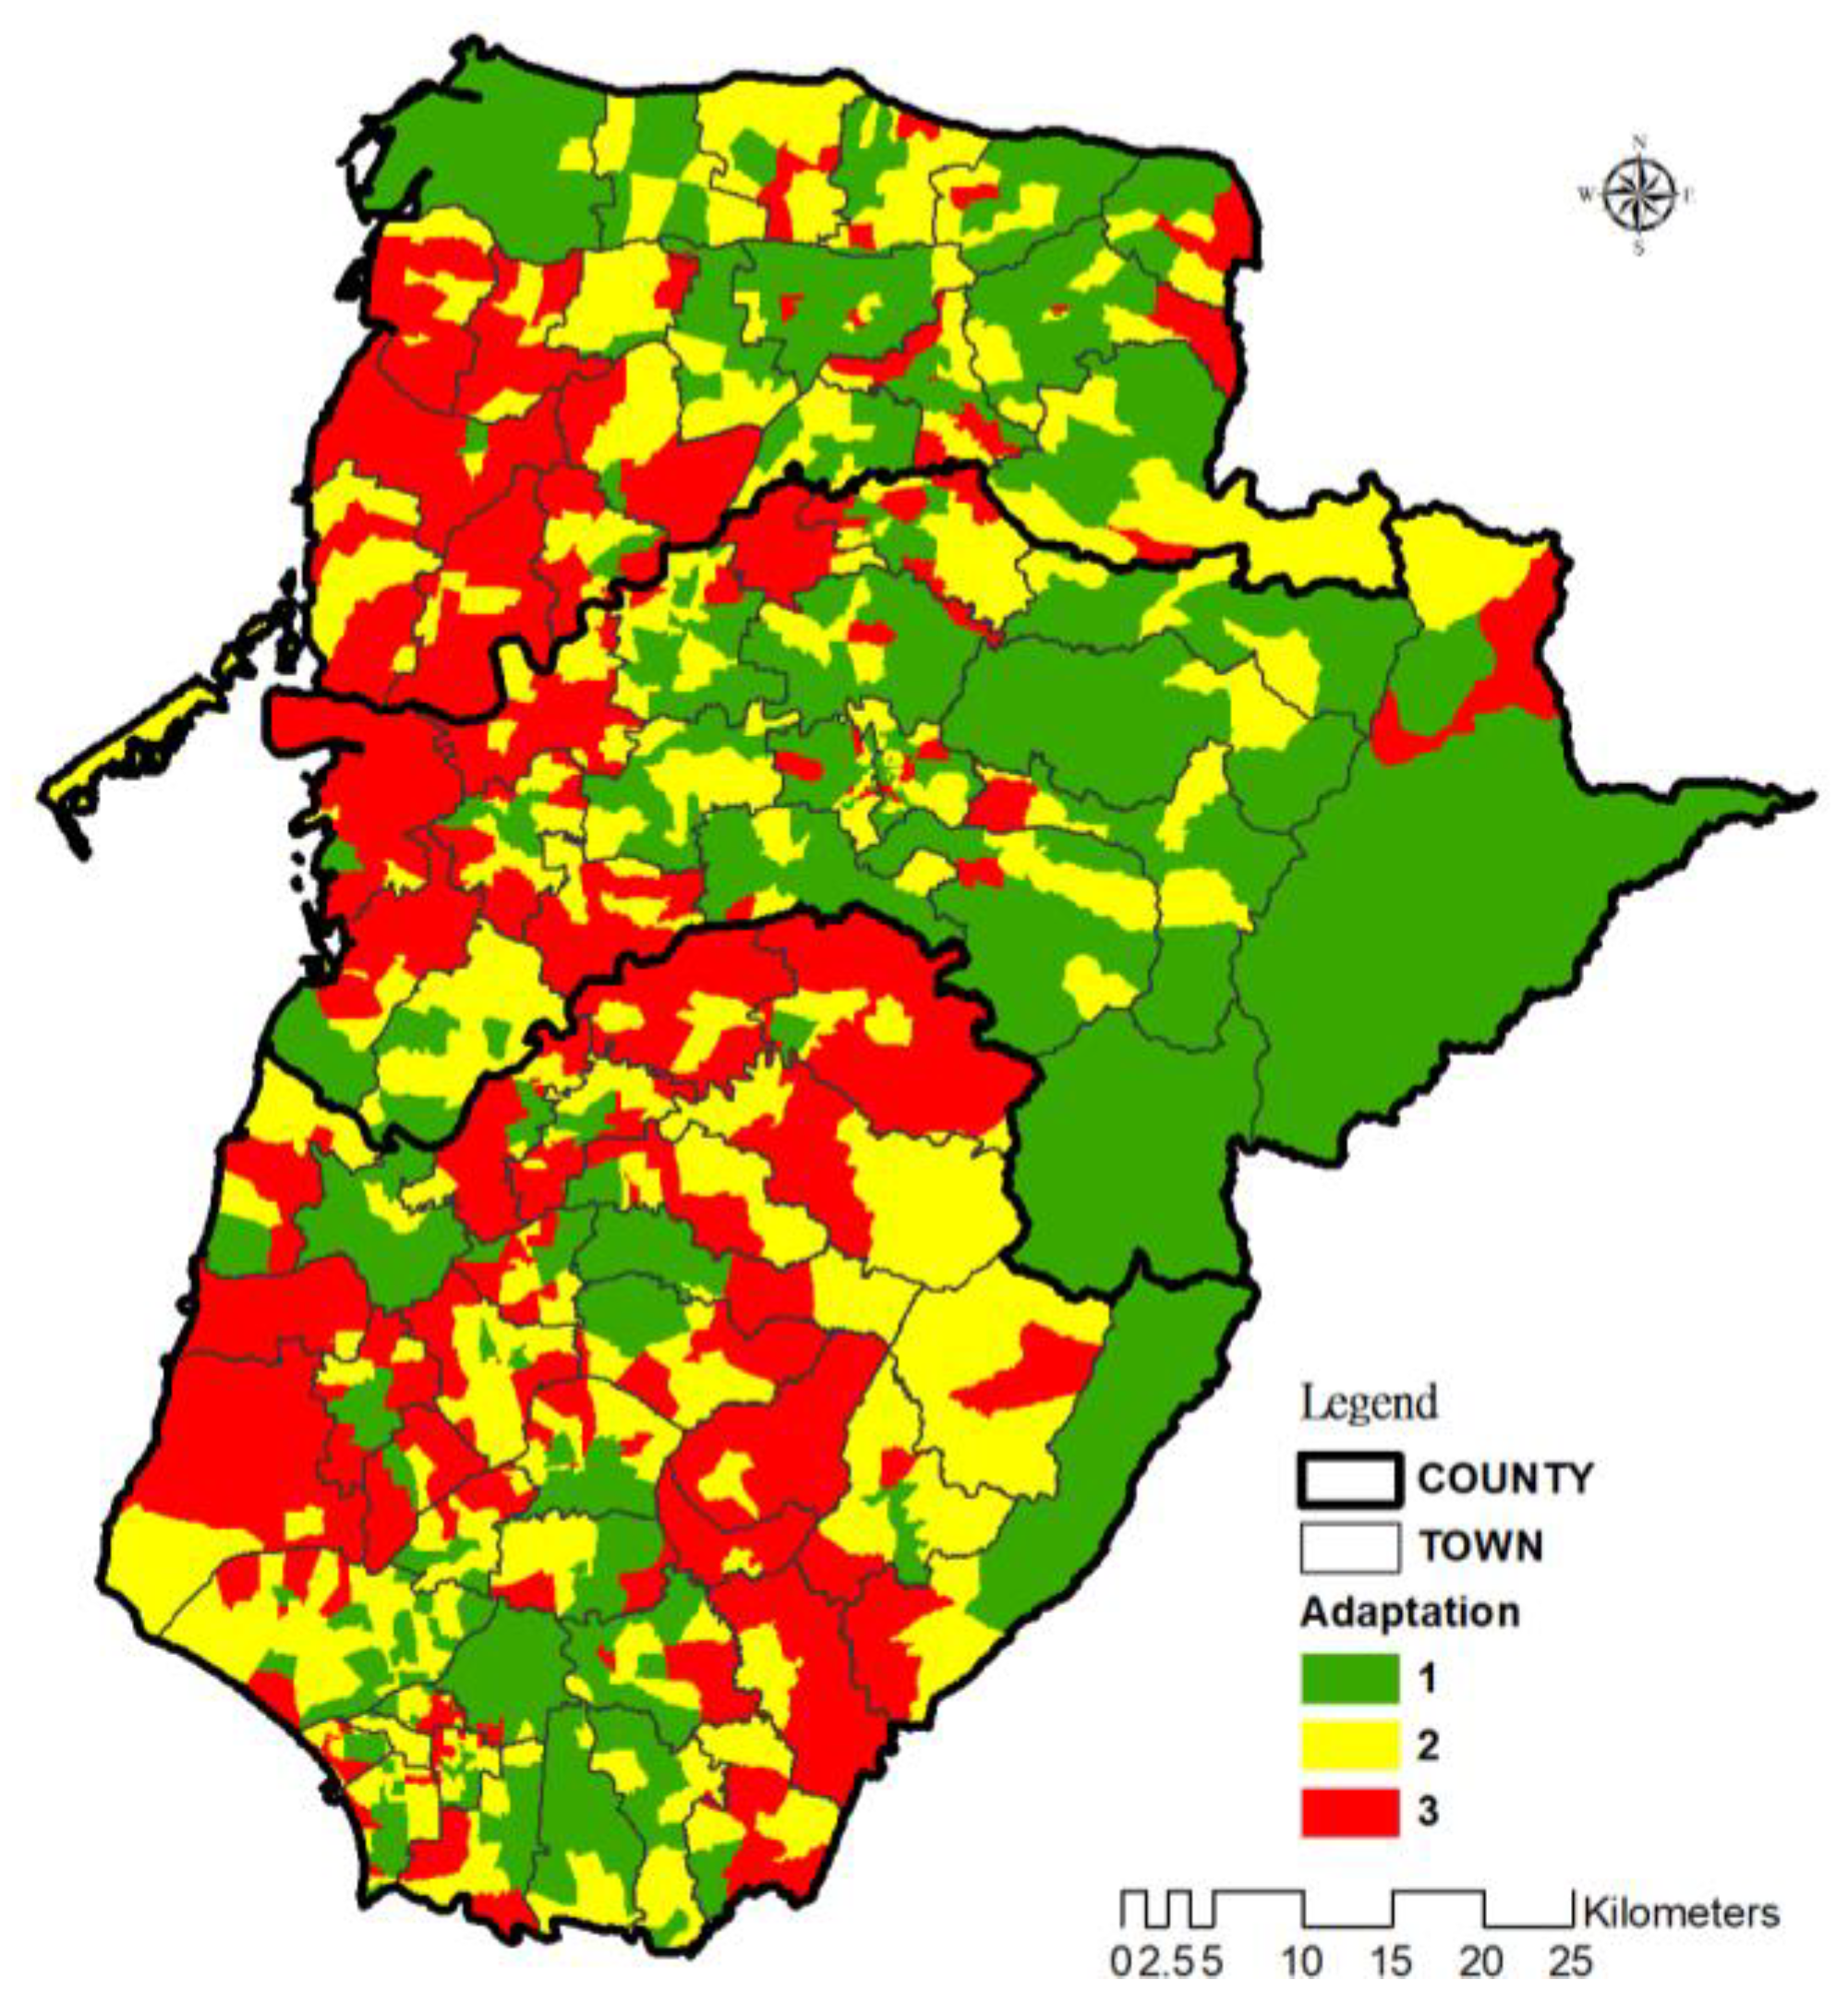
4.4. Adaptation
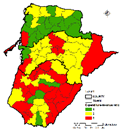
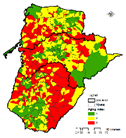
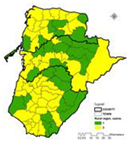
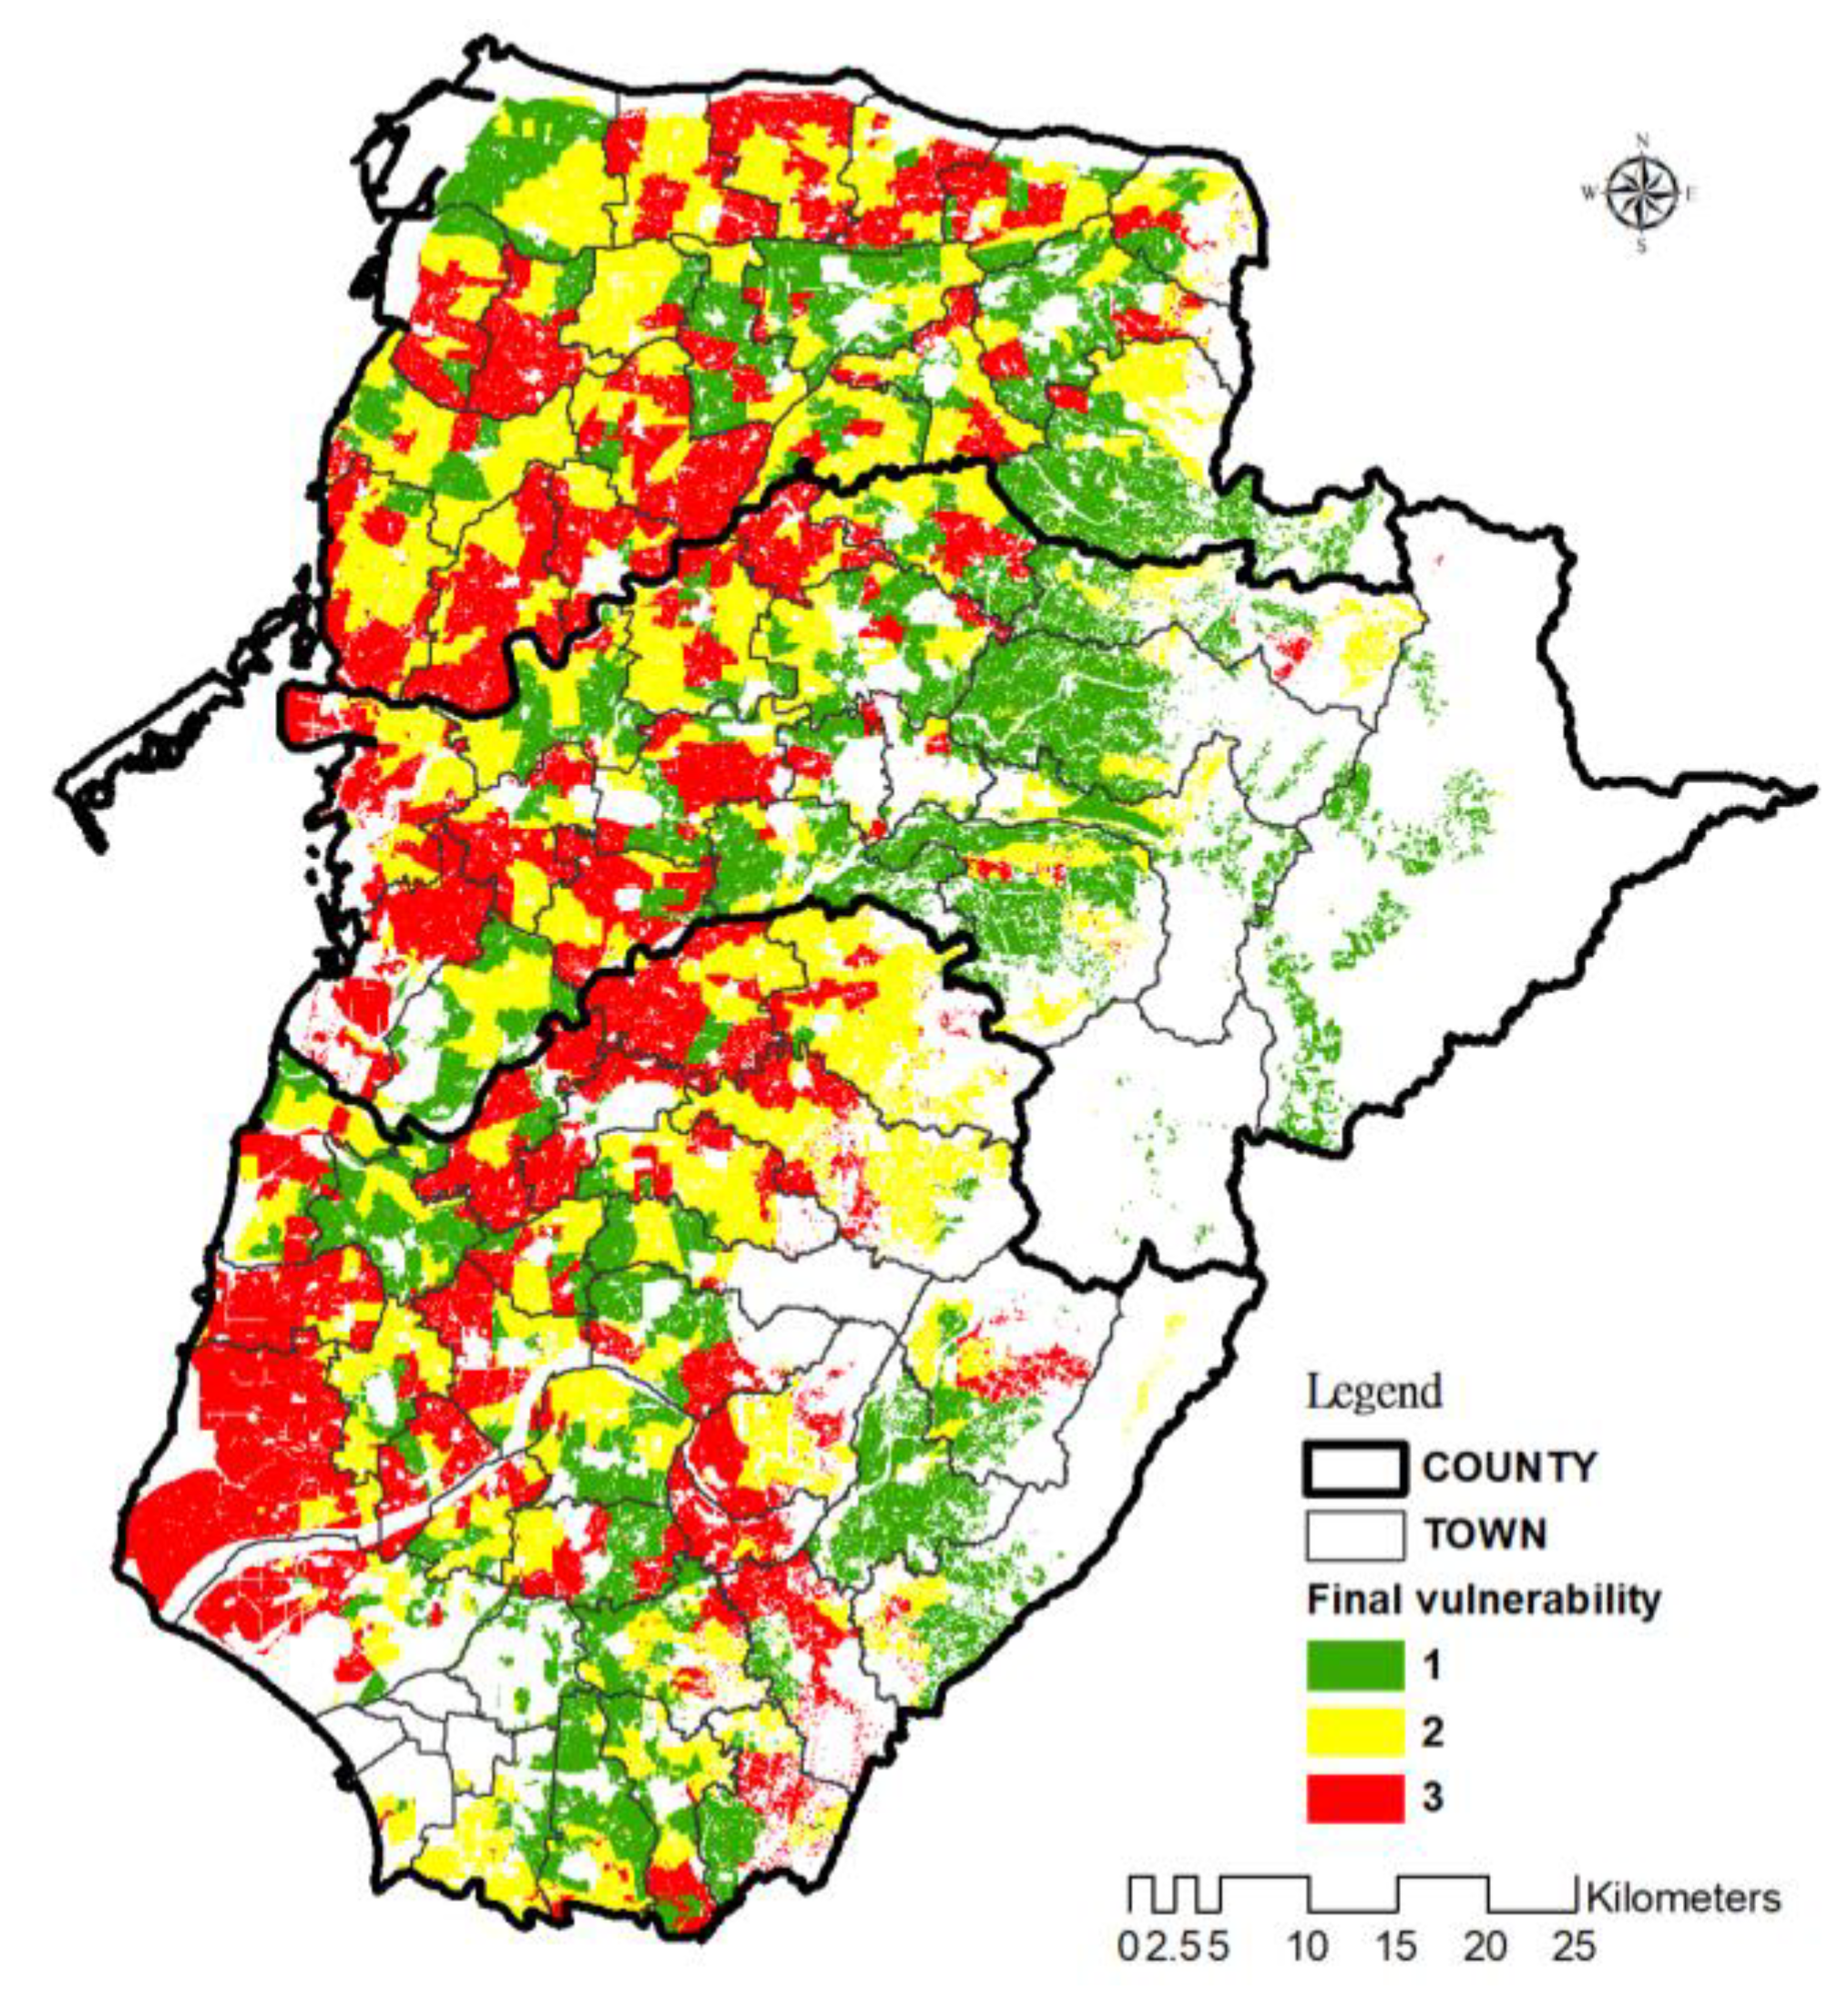
4.5. Analysis of Vulnerability Assessment for Farmland
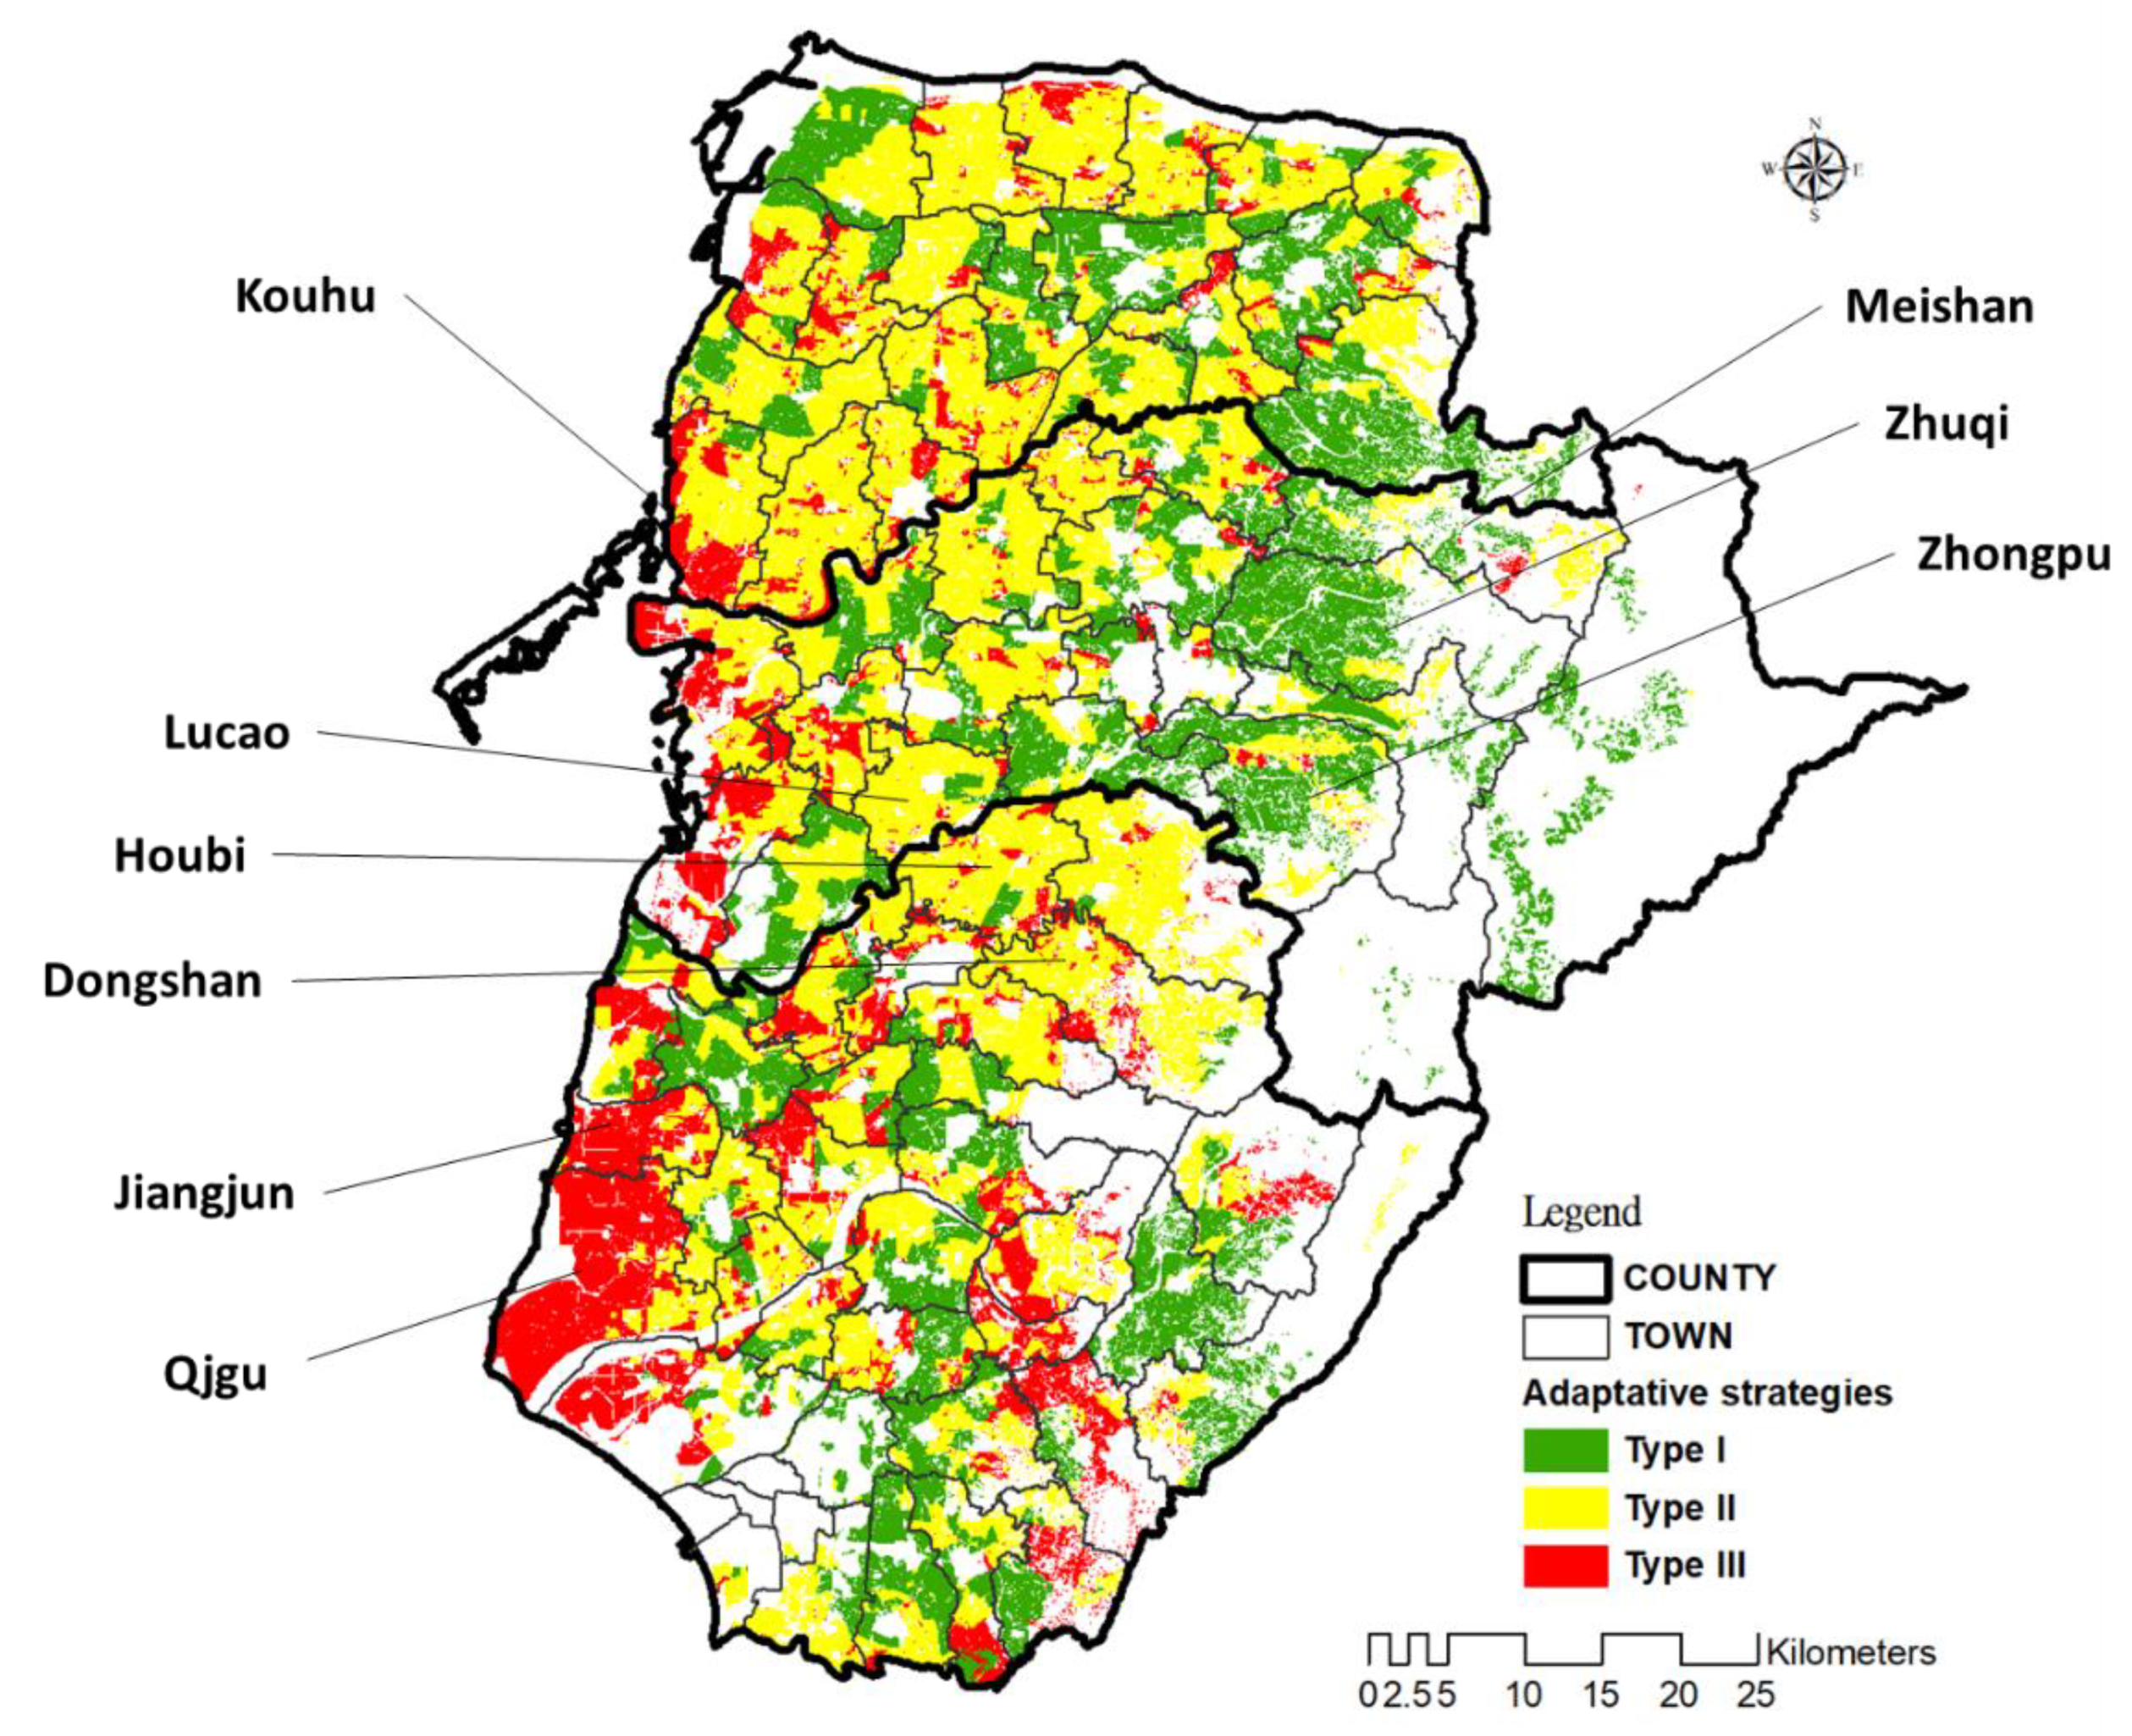
4.6. Adaptive Strategies in Response to Climate Change
4.6.1. Type I: Enhancement of Agricultural Production
4.6.2. Type II: Maintenance of Agricultural Production
4.6.3. Type III: Conservation of Agricultural Environment
5. Discussion and Conclusions
Author Contributions
Funding
Acknowledgments
Conflicts of Interest
Appendix A
| Criteria Groups | Criteria Items | ||||
| Exposure Aspest | 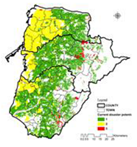 | 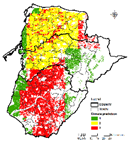 | 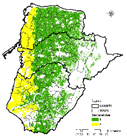 | ||
| Disaster potential | Climate prediction | Sea level rise | |||
| Sensitivity aspect | 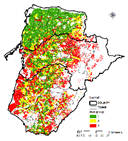 |  | |||
| Soil group | Farmland product. ability | ||||
 |  |  | |||
| Water group | Dist. to irr. channels | Ratio of irrigation area | |||
 |  |  | |||
| Blocks group | Farmland block area | Scale of Cultivated Land | |||
 |  | ||||
| Sensitive area | Ecological conservation area | ||||
| Adaptation aspect | 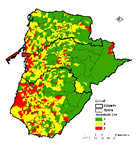 | 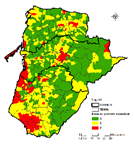 | 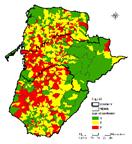 | 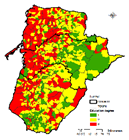 | 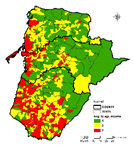 |
| Household char. | Ratio of pea. HH. | Age of cultivator | Education degree | Avg. of agri. income | |
 |  |  |  |  | |
| Agriculture org. | Ratio of membership | Counts of production - sale unit | Ratio of participating in practice course | Expenditure-revenue ratio | |
 |  |  |  | ||
| Socio-economic characteristic | Nurture ratio | Aging index | Rural regeneration community | ||
References
- Olesen, J.E.; Bindi, M. Consequences of climate change for European agricultural productivity, land use and policy. Eur. J. Agron. 2002, 16, 239–262. [Google Scholar] [CrossRef]
- Klein, R.J.; Huq, S.; Denton, F.; Downing, T.E.; Richels, R.G.; Robinson, J.B.; Toth, F.L. Inter-relationships between adaptation and mitigation. In Climate Change 2007: Impacts, Adaptation and Vulnerability; Parry, M.L., Canziani, O.F., Palutikof, J.P., van der Linden, P.J., Hanson, C.E., Eds.; Contribution of the Working Group II to the Fourth Assessment Report of the Intergovernmental Panel on Climate Change; Cambridge University Press: Cambridge, UK, 2007; pp. 745–777. [Google Scholar]
- Lim, B.; Spanger-Siegfried, E.; Burton, I.; Malone, E.; Huq, S. Adaptation Policy Frameworks for Climate Change: Developing Strategies, Policies and Measures; United Nations Development Programme: New York, NY, USA, 2004. [Google Scholar]
- Füssel, H.M. Adaptation planning for climate change: Concepts, assessment approaches, and key lessons. Sustain. Sci. 2007, 2, 265–275. [Google Scholar] [CrossRef]
- Laux, P.; Jackel, G.; Tingem, R.M.; Kunstmann, H. Impact of climate change on agricultural productivity under rainfed conditions in Cameroon-A method to improved attainable crop yields by planting date adaptations. Agric. For. Meteorol. 2010, 150, 1258–1271. [Google Scholar] [CrossRef]
- Lee, C.J.; Chan, S.L. A Study on the Vulnerability Assessment and Adaptation Strategy of Agriculture Land under the Impact Climate Change; Council of Agriculture Research Project: Taipei, Taiwan, 2012. (In Chinese)
- Aschonitis, V.G.; Mastrocicco, M.; Colombani, N.; Salemi, E.; Kazakis, N.; Voudouris, K.; Castaldelli, G. Assessment of the intrinsic vulnerability of agricultural land to water and nitrogen losses via deterministic approach and regression analysis. Water Air Soil Poll. 2012, 223, 1605–1614. [Google Scholar] [CrossRef]
- Berry, P.M.; Rounsevell, M.D.A.; Harrison, P.A.; Audsley, E. Assessing the vulnerability of agricultural land use and species to climate change and the role of policy in facilitating adaptation. Environ. Sci. Policy 2006, 9, 189–204. [Google Scholar] [CrossRef]
- Cui, Y.; Jiang, S.; Jin, J.; Ning, S.; Feng, P. Quantitative assessment of soybean drought loss sensitivity at different growth stages based on S-shaped damage curve. Agr. Water Manag. 2019, 213, 821–832. [Google Scholar] [CrossRef]
- Gbetibouo, G.A.; Ringler, C. Mapping South African Farming Sector Vulnerability to Climate Change and Variability: A Subnational Assessment; International Food Policy Research Institute (IFPRI) and Center for Environmental Economics and Policy in Africa (CEEPA): Washington, DC, USA, 2009. [Google Scholar]
- Hewitt, J.; Brierley, T.; Chen, K.; Hill, H. Assessment of Climate Change Impacts on Agricultural Land-Use Suitability; Spring Seeded Small Grains on the Prairie, Agriculture and Agri-Food Canada and Environment Canada. 2008. Available online: http://www4.agr.gc.ca/resources/prod/doc/pfra/pdf/assess_clim_chang_prairies_e.pdf (accessed on 15 April 2014).
- Ronco, P.; Zennaro, F.; Torresan, S.; Critto, A.; Santini, M.; Trabucco, A.; Zollo, A.L.; Galluccio, G.; Marcomini, A. A risk assessment framework for irrigated agriculture under climate change. Adv. Water Resour. 2017, 110, 562–578. [Google Scholar] [CrossRef]
- Wang, J.H.; Fong, J.L.; Chen, M.F. Constructing the indicator of Multi-function utilization for agriculture land. J. Taiwan Land Res. 2011, 15, 31–71. (In Chinese) [Google Scholar]
- IPCC (Intergovernmental Panel on Climate Change). IPCC Fourth Assessment Report: Climate Change; IPCC (Intergovernmental Panel on Climate Change): Geneva, Switzerland, 2007.
- UNEP. Assessing Human Vulnerability Due to Environmental Change: Concepts, Issues, Methods and Case Studies; UNEP/DEWA/ RS.03-5; United Nations Environmental Programme: Nairobi, Kenya, 2001. [Google Scholar]
- Chen, J.H.; Kuang, T.C.; Su, G.S. The Impact Assessment and Adaptive Strategy of Sea Level Rise in the Country under Climate Change; Environmental Protection Administration Executive Yuan Research Project: Taipei, Taiwan, 2001. (In Chinese)
- Rannow, S.; Loibl, W.; Greiving, S.; Gruehn, D.; Meyer, B.C. Potential impacts of climate change in Germany—identifying regional priorities for adaptation activities in spatial planning. Landscape Urban Plan. 2010, 98, 160–171. [Google Scholar] [CrossRef]

| Function | Impact Type | Description |
|---|---|---|
| Agricultural Production | Change in climatic conditions to grow crops | Climate change leads to changes in temperature and rainfall and directly affects crops. |
| Increased demand for irrigation | Climate change alters rainfall patterns; erratic rainfall increases irrigation demand. | |
| Floods | Climate change causes extreme rainfall and increases flood frequency and strength, even external impacts as soil erosion, movement of nutrients and pesticides, salinization, water withdrawal, and groundwater contamination. | |
| Heatwaves and cold snaps | Changes in temperature and amplitude and frequency of heat waves or cold snaps result in yield loss. | |
| Socioeconomic Factors | Changes in farming institutions | Agricultural land-use patterns are necessary for reallocating response to climate change impact. |
| Implementation of agricultural facilities | Implementation of agricultural facilities increases the adaptation ability for climate change and the allocative efficiency of agricultural resources. | |
| Evolution of agroprocessing industry | To adapt to changes in climatic conditions, the agroprocessing industry attempts to reposition its functions through restructuring. | |
| Impact of agricultural culture | The sustainability of agricultural culture and the related agricultural industries requires adaptation polices to deal with the challenges of low competitiveness resulting from climate change. | |
| Environmental Ecology | Impact on biodiversity | Changes in climate patterns affect the original conditions of natural environments and affect biodiversity. |
| Location | Crop | Area | Location | Crop | Area | Location | Crop | Area |
|---|---|---|---|---|---|---|---|---|
| Yunlin | Rice | 29,888 | Chiayi | Rice | 18,080 | Tainan | Rice | 15,355 |
| Sweet potato | 3209 | Corn | 4844 | Corn | 5414 | |||
| Potato | 1671 | Bamboo | 1914 | Sugarcane | 1286 |
| Aspect | Group * | Item * | References |
|---|---|---|---|
| Expos-ure (E) | Disaster potential (DP) | Disaster potential distribution | Geographic Information Platform for National Spatial Planning of CPAMI |
| Climate prediction (CP) | Rice impact analysis | Taiwan Climate Change Projection and Information Platform of NCDR | |
| Rising sea levels (RSL) | Risk of rising sea levels | Chen et al. (2001); EPA | |
| Sensiti-vity (S) | Soil (SO) | Farmland production ability (FPA) | Taiwan Agricultural Land Information Service (TALIS) of Council of Agriculture (COA) |
| Water (WA) | Distance to irrigation channels (DIC) | TALIS Agriculture, Forestry, Fishery, and Animal Husbandry Census | |
| Ratio of irrigation areas (RIA) | |||
| Blocks (BL) | Farmland block areas (FBA) | ||
| Scales of cultivated land (SCL) | |||
| Sensitive areas (SA) | Ecological conservation areas (ECA) | Geographic Information Platform for National Land Planning in CPAMI | |
| Adapt-ation (A) | Farmer household characteristics (FHH) | Number of villager households/village area (NHH) | Agriculture, Forestry, Fishery, and Animal Husbandry Census |
| Age of person who commands cultivation (APC) | |||
| Educational degree (ED) | |||
| Average agricultural income of villager household (AAI) | |||
| Agricultural organization (AO) | Membership/number of people involved in agriculture (MPIA) | Annual statistics of farmers’ association | |
| Counts of production to sale unit (CPS) | |||
| Number of people participating in practice courses/number of people involved in agriculture (NPP) | |||
| Expenditure-to-revenue ratio of farmers’ association (ERA) | |||
| Rural regeneration community (RRC) | |||
| Socio-economic characteristics (SE) | Nurture ratio (NR) | Social Economic Database of the National Geographic Information System | |
| Aging index (AI) |
| Vulnerability Levels for Exposure | Low | Medium | High |
|---|---|---|---|
| Yunlin | 21 | 97,430 | 313 |
| Percentage of the total area | (0.01%) | (31.53%) | (0.10%) |
| Chiayi | 18,097 | 65,584 | 615 |
| Percentage of total area | (5.86%) | (21.23%) | (0.20%) |
| Tainan | 6991 | 119,066 | 861 |
| Percentage of the total area | (2.26%) | (38.54%) | (0.28%) |
| Southern Taiwan | 25,109 | 282,081 | 1789 |
| Percentage of the total area | (8.13%) | (91.29%) | (0.58%) |
| Vulnerability Levels for Sensitivity | Low | Medium | High |
|---|---|---|---|
| Yunlin | 81,853 | 13,589 | 2322 |
| Percentage of total area | (26.49%) | (4.40%) | (0.75%) |
| Chiayi | 57,398 | 21,871 | 5027 |
| Percentage of total area | (18.58%) | (7.08%) | (1.63%) |
| Tainan | 62,101 | 46,946 | 17,871 |
| Percentage of total area | (20.10%) | (15.19%) | (5.78%) |
| Southern Taiwan | 201,353 | 82,407 | 25,221 |
| Percentage of total area | (65.17%) | (26.67%) | (8.16%) |
| Exposure | ||||
|---|---|---|---|---|
| 1 | 2 | 3 | ||
| Sensitivity | 1 | 1 | 2 | 2 |
| 2 | 2 | 2 | 3 | |
| 3 | 2 | 3 | 3 | |
| Vulnerability Levels for the Potential Impact | Low | Medium | High |
|---|---|---|---|
| Yunlin | 0 | 95,302 | 2462 |
| Percentage of the total area | (0.00%) | (30.84%) | (0.80%) |
| Chiayi | 6289 | 73,465 | 4542 |
| Percentage of the total area | (2.04%) | (23.78%) | (1.47%) |
| Tainan | 1928 | 107,276 | 17,714 |
| Percentage of total area | (0.62%) | (34.72%) | (5.73%) |
| Southern Taiwan | 8217 | 276,044 | 24,719 |
| Percentage of the total area | (2.66%) | (89.34%) | (8.00%) |
| Vulnerability Levels for Adaptation | Low | Medium | High |
|---|---|---|---|
| Yunlin | 27,221 | 38,230 | 32,312 |
| Percentage of the total area | (8.81%) | (12.37%) | (10.46%) |
| Chiayi | 36,198 | 27,192 | 20,906 |
| Percentage of the total area | (11.72%) | (8.80%) | (6.77%) |
| Tainan | 36,788 | 43,180 | 46,950 |
| Percentage of total area | (11.91%) | (13.98%) | (15.20%) |
| Southern Taiwan | 100,208 | 108,603 | 100,169 |
| Percentage of the total area | (32.43%) | (35.15%) | (32.42%) |
| Potential Impact | ||||
|---|---|---|---|---|
| 1 | 2 | 3 | ||
| Adaptation | 1 | 1 | 1 | 2 |
| 2 | 1 | 2 | 3 | |
| 3 | 2 | 3 | 3 | |
| Levels of Vulnerability | Low | Medium | High |
|---|---|---|---|
| Yunlin | 26,666 | 37,612 | 33,485 |
| Percentage of the total area | (8.63%) | (12.17%) | (10.84%) |
| Chiayi | 36,534 | 25,460 | 22,302 |
| Percentage of the total area | (11.82%) | (8.24%) | (7.22%) |
| Tainan | 33,679 | 42,412 | 50,827 |
| Percentage of the total area | (10.90%) | (13.73%) | (16.45%) |
| Southern Taiwan | 96,880 | 105,485 | 106,615 |
| Percentage of total area | (31.35%) | (34.14%) | (34.51%) |
| Type | Description | Long-Term Adaptive Policies | Short-Term Adaptive Actions |
|---|---|---|---|
| Type I: Enhancement of agricultural production | Areas mainly have low levels of vulnerability. Objectives: to maintain current production conditions and to strengthen production ability and efficiency. |
|
|
| Type II: Maintenance of agricultural production | Areas mainly have medium and high levels of vulnerability and more favorable production conditions, but also face the impact of climate change. Objective: To maintain the fundamental production function by considering food security. |
|
|
| Type III: Conservation of agricultural environment | Areas mainly have medium and high levels of vulnerability and are mainly located in the coastal zones in the western areas and the hills in the southeastern areas. The production condition is relatively poor and easily affected by the climatic impact. Objective: mainly, to conserve the agricultural environment and its multifunctionality. |
|
|
| Suggested Adaptive Strategy Types | Type I | Type II | Type III |
|---|---|---|---|
| Yunlin | 26,666 | 59,493 | 11,604 |
| Percentage of the total area | (8.63%) | (19.25%) | (3.76%) |
| Chiayi | 36,534 | 38,645 | 9117 |
| Percentage of the total area | (11.82%) | (12.51%) | (2.95%) |
| Tainan | 33,679 | 57,975 | 35,264 |
| Percentage of the total area | (10.90%) | (18.76%) | (11.41%) |
| Southern Taiwan | 96,880 | 156,114 | 55,986 |
| Percentage of the total area | (31.35%) | (50.53%) | (18.12%) |
© 2020 by the authors. Licensee MDPI, Basel, Switzerland. This article is an open access article distributed under the terms and conditions of the Creative Commons Attribution (CC BY) license (http://creativecommons.org/licenses/by/4.0/).
Share and Cite
Huang, K.-C.; Lee, C.-J.; Chan, S.-L.; Tai, C.-H. Vulnerability Assessment and Adaptation Strategies for the Impact of Climate Change on Agricultural Land in Southern Taiwan. Sustainability 2020, 12, 4637. https://doi.org/10.3390/su12114637
Huang K-C, Lee C-J, Chan S-L, Tai C-H. Vulnerability Assessment and Adaptation Strategies for the Impact of Climate Change on Agricultural Land in Southern Taiwan. Sustainability. 2020; 12(11):4637. https://doi.org/10.3390/su12114637
Chicago/Turabian StyleHuang, Kuo-Ching, Chen-Jai Lee, Shih-Liang Chan, and Cheng-Hsin Tai. 2020. "Vulnerability Assessment and Adaptation Strategies for the Impact of Climate Change on Agricultural Land in Southern Taiwan" Sustainability 12, no. 11: 4637. https://doi.org/10.3390/su12114637
APA StyleHuang, K.-C., Lee, C.-J., Chan, S.-L., & Tai, C.-H. (2020). Vulnerability Assessment and Adaptation Strategies for the Impact of Climate Change on Agricultural Land in Southern Taiwan. Sustainability, 12(11), 4637. https://doi.org/10.3390/su12114637