1. Introduction
More than 200 experts from different countries and organizations and different professional backgrounds participated in the discussion of the joint report "Chinese Cities: Towards Efficient, Inclusive and Sustainable Urbanization" issued by the World Bank and the Development Research Center of the State Council of China in 2014 [
1]. The report points out that China’s growing cities, especially the developing megacities along the eastern and southern coasts, have provided about 260 million immigrants with employment opportunities, livelihoods, and new homes. It is expected that this migration process will continue to accelerate. China’s remarkable growth has lifted about 500 million people out of poverty and successfully avoided the common urbanization ills in many developing countries. In the past two decades, the number of urban residents worldwide has increased from 1.5 billion to 3.6 billion, and 80% of global economic activities concentrated on the development of cities [
2]. Urbanization has thus become the main driving force for poverty reduction and the achievement of the UN Millennium Development Goal. Countries with high levels of urbanization, such as China and some East Asian and South American countries, have played important roles in reducing absolute poverty. To reduce poverty and improve the living standards of the poor, using the economic and social benefits of urbanization to study different urbanization models and regional differences is of great significance to improve the quality of urbanization and achieve sustainable global development. For example, healthy cities continue to create and improve the physical and social environment and expand community resources so that people can support each other, jointly perform all the functions of life, and maximize their potential [
3]. The reform and opening-up policy advocated in 1978 has accelerated China’s urbanization process and changed the level of urbanization, which is important for the country’s economic development and poverty reduction goals.
However, considering the complexity of China’s urbanization quality evaluation and the dynamics and variability of China’s urbanization process, the current urbanization index system constructed by previous studies lacks the universality and comparability of the evaluation results. Therefore, this study constructs an urbanization sustainable quality evaluation index suitable to measure various urban models to expand the findings of previous studies. This study selects cities and towns in China’s eastern, central, and western regions as the research objects, analyzes different urbanization models and regional urbanization differences, and explores the possibility of evaluating sustainable urbanization quality by finding sustainable development paths.
2. Literature Review
Urbanization has promoted rapid social and economic development, but it has also caused many problems, such as population concentration, traffic jams, housing shortages, resource shortages, biodiversity reduction, "heat island" effects, noise, and air and water pollution [
4,
5,
6]. People are increasingly aware of the importance of a sustainable urban environment. The realization of sustainable urban development specifically means a balance between the development of urban areas and environmental protection, focusing on the fairness of income, employment, housing, basic services, social infrastructure, and transportation in urban areas. Because cities are complex ecosystems affected by social, economic, environmental, and cultural factors, conflicts and interactions between these factors exist. Therefore, to achieve the sustainable and inclusive urban development, the first step in achieving this goal is to conceive an inclusive development framework for a sustainable urbanization index that describes, evaluates, and guides the development of these cities to achieve sustainable development. Therefore, with the goal of sustainability, the use of urban regulatory indicators is increasingly popular [
7].
Humanity needs urbanization for sustainable development, and the level of urbanization must be defined from the meaning of sustainable development. From the perspective of qualitative phenomena, the level of sustainable urbanization should be considered from the speed and quality of the urbanization process. The process of speed and quality needs to be integrated to assess the level of urbanization. Besides, to describe the phenomenon from a quantitative point of view, the speed and quality of the urbanization process must be expressed by relevant indicators that can be calculated numerically. Conceptually, the speed and quality of the urbanization process can include the performance of urban scale expansion and population growth, the improvement of urban quality, the improvement of infrastructure capabilities, and the coordination of urban and rural relations [
8]. It is necessary to describe different levels of sustainable development of urbanization from an integrated perspective of economic, environmental, and social aspects [
9,
10,
11,
12,
13,
14,
15]. Therefore, the research on the indicators of sustainable development of urbanization (including inclusive development) was classified, and most scholars agreed on including economic development, basic public service quality, ecological environment development, urban–rural heterogeneity, and population urbanization as indicators. For example, Jingjing [
8] evaluated the sustainable development level of urbanization from nine aspects: city scale and infrastructure, economic growth and economic structure, public welfare and living, environmental quality and environmental improvement, and urban–rural integration. Hezria [
16] built a sustainable index system from health, education, social welfare, environmental conditions, and the economy.
From the perspective of economic development, Georges [
17] established an economic indicator system from the aspects of household income and expenses, employment, businesses, and sub-total. Lu [
18] and Siciliano [
19] proposed a labor productivity indicator. Wu [
20], Zhao [
8], Wang [
21], and Zhao [
22] proposed economic growth and economic structure indicators, and Hiremath [
23] and Shen [
24] proposed energy use and energy intensity indicators. Zhang [
25] and Jin [
26] proposed a net income indicator.
From the perspective of ecological environment development, urban areas are a heterotrophic system and must rely on the surrounding landscape to provide life support services [
27]. Traditionally, "the urban environment" refers to the condition of the city itself. The main problems are those related to air and water quality and their impact on human morbidity and mortality. However, along with the development of urbanization, its definition has also been changed; for example, Wang [
21] considered that the key factors to analyze the interactive forced relationship between urbanization and the ecological environment are, for example, the green space rate, industrial emissions, per capita water availability, per capita green space rate, and per capita total water volume. The Lebanese Environment and Development Observatory (LEDO) presented 110 indicators at the end of the workshop organized by the Ministry of Environment, covering demographics, living standards, and consumption, production patterns, agriculture, industry, energy, services, transportation, air, waterland, soil, biodiversity, activity participants, policies, and strategies [
28]. Wu [
20], Siciliano [
19], Zhao [
8], Li [
29], and Hiremath [
23] proposed environmental improvement, industrial pollution, environmental management, and environmental level indicators. Wu [
30], Shen [
24], Zhang [
25], and Jin [
26] proposed eco-environment endowment, water environment, and environmental dimension indicators. Jaeger [
31], El Araby [
32], and Wang [
21] proposed consumption of natural resources, air pollution, global climate change, and eco-environment response indicators.
From the perspective of basic public service quality, Wu [
20] proposed public welfare and living standard indicators. Zhao [
8] proposed spatial aspects, social aspects, and social urbanization indicators. Li [
29] proposed a life-support service indicator. Hiremath [
23] proposed accessibility and traffic indicators. Wang [
21] proposed opportunities and equity indicators, and Zhang [
25] proposed a health indicator.
From the perspective of urban–rural heterogeneity, Zhao [
8] and Jin [
26] proposed urban–rural integration level indicator. Hiremath [
23] presented mixed land use and land area indicators. Zhao [
22] proposed a mixed land use indicator. Wu [
20] proposed an urban land use structure indicator. Zhang [
25] and Shi [
33] proposed an intensive agriculture indicator. Lin [
34] proposed an agricultural system indicator, and Siciliano [
19] proposed an urbanization policy indicator.
In contrast with the above research, this article studies the advantages of all the above systems, and establishes a measurement system suitable for multiple urbanization models. From the perspectives of sustainable urbanization, ecological urbanization, and inclusive development of urbanization, it is found that most urbanization research indicators can be divided into economic development, economic development, basic public service quality, ecological environment development, urban–rural heterogeneity, and population urbanization. Indicators and dimensions selected for the present study of urbanization are shown in
Table 1.
In contrast with previous research papers, the urbanization model is divided into compact city models and cities with characteristics of high density, high-rise buildings, and intensive utilization of multiple types of land. The compact city is a special urban form with inherent social, material, and institutional constraints [
35]. The main aspects of the sustainable development of mining cities include the sustainability of mineral resources, mining waste management, and the urbanization process of mining cities. Many researchers have studied the sustainable development of mining cities. For example, Yu proposed the concept of sustainable development of mineral resources (DSDMR) and established a conceptual model [
36]. Coastal cities, in the process of China’s urbanization, China’s coastal cities, especially the eastern coastal regions, have developed faster than inland cities [
37]. Over the past 30 years, Beijing, Shanghai, Guangzhou, and Shenzhen have experienced dramatic urbanization. Zhang conducted an energy-based comparative analysis of three typical megacities in China [
38]. From the perspective of sustainable and inclusive development, combined with the characteristics of local town development, this paper divides towns into tourist-type urbanization, commercial-type urbanization, real-estate-type urbanization, agricultural-type urbanization, science-education-type urbanization, and transportation-type urbanization. The six urbanization models are more detailed and specific than the previous classification.
3. Materials and Methods
3.1. Research Process
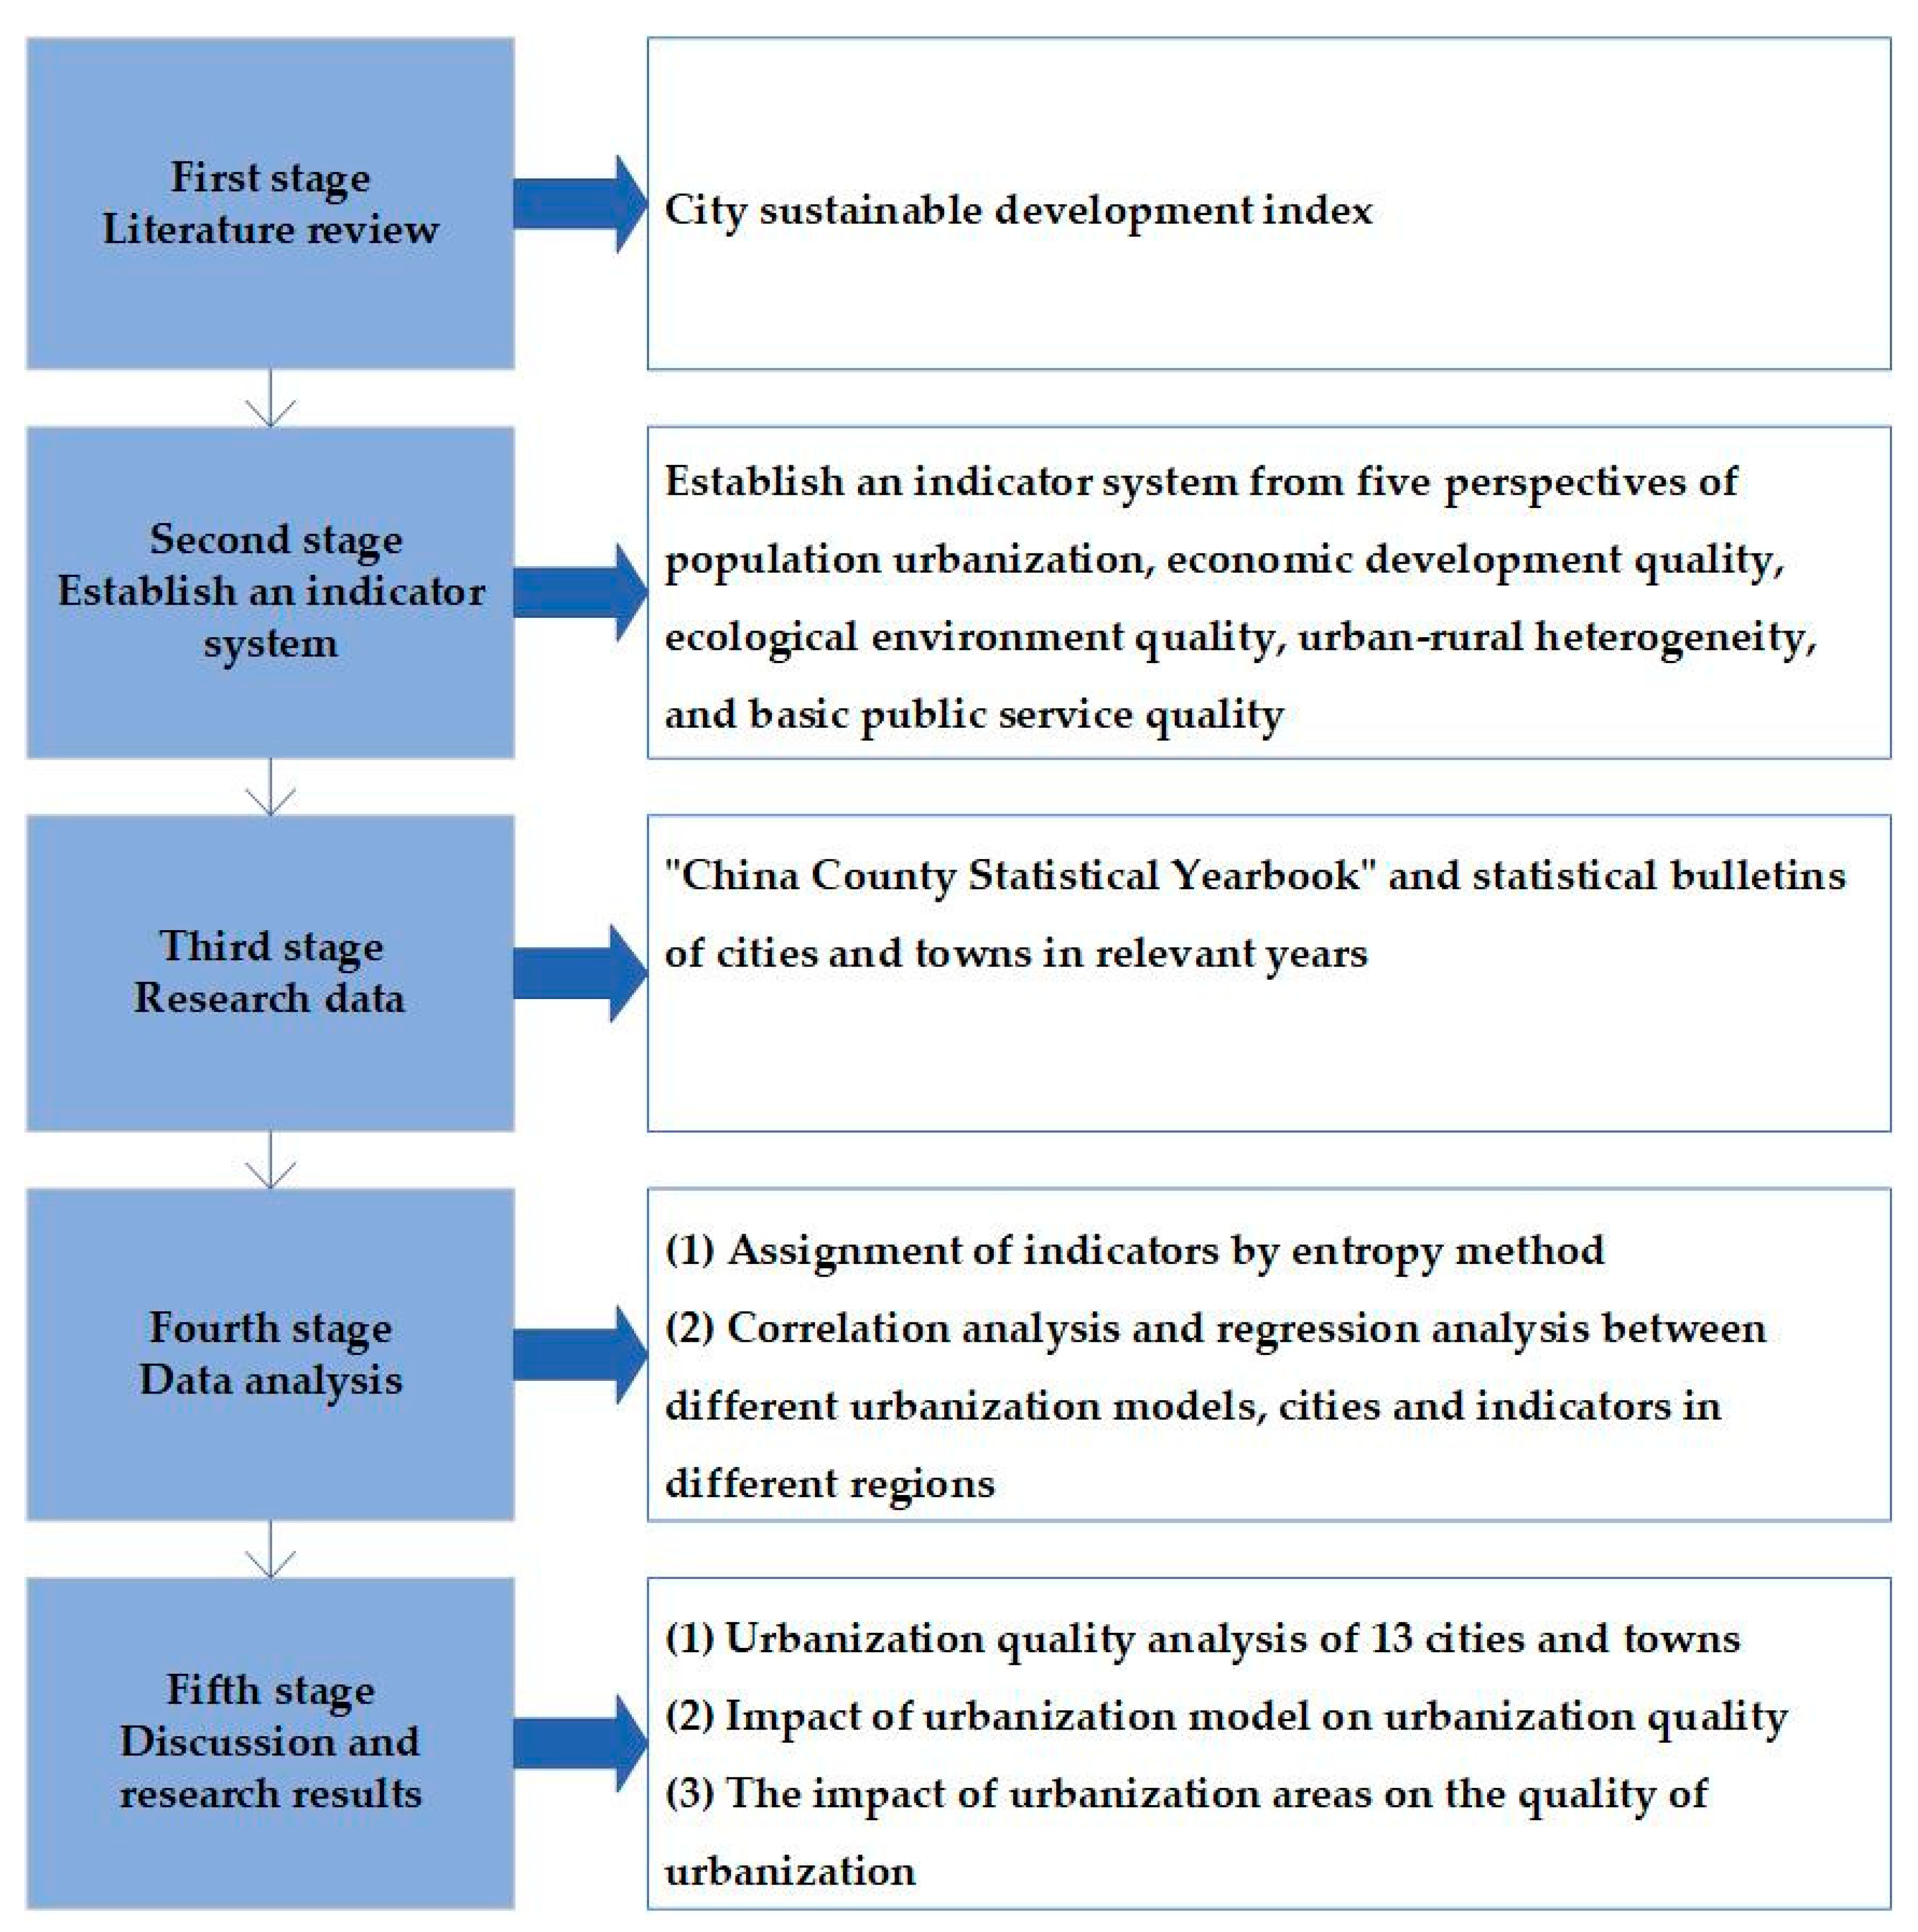
As shown in
Figure 1, the present study was carried out in the following five stages. The first stage was the problem statement stage, which consisted of identifying the problem and the significance of this study. In the second stage, a literature review was conducted by key words search, including “urbanization quality assessment”, "urban sustainable development", "ecological city", and "rural urbanization" through the database Web of Science. By retrieving data from the 2018
China County Statistical Yearbook in the third stage, the present study further proceeded to the fourth stage through an entropy method to determine the evaluation index system. In the fifth stage, the urbanization quality of 13 selected cities/towns was then analyzed.
3.2. Establishment of Index System
Based on the relevant theories and methods of urbanization and relevant data obtained from China County Statistical Yearbook and the statistical bulletins of cities and towns, data were divided into three-level indicators, and the three-level indicators were further classified to 15 factors. After that, the 15 factors were then used to measure five comprehensive evaluation aspects. Quality of urbanization is evaluated in terms of population urbanization, economic development quality, ecological environment quality, urban–rural heterogeneity, and basic public service quality.
3.3. Data Collection
To analyze the differences in urbanization quality between different urbanization models and between different regions, this study selected 13 towns in Zhuzhou, Chengdu, Beijing, and the surrounding areas from the eastern, western, and central regions of China for empirical research. All data were from the
China County Statistical Yearbook and the statistical bulletins of cities and towns in 2018. By evaluating the quality of urbanization, different attributes of urbanization can be explored. To ensure the objectivity and rationality of the attributes of the selected cities and towns, the urbanization mode of the selected cities and towns were pre-judged based on the urban construction planning of the local government (
Table 2).
3.4. Entropy Method to Determine the Evaluation Index System
Previous findings showed that the subjectivity and one-sidedness of human evaluation can be avoided when determining the weight of the multipath urbanization quality evaluation index. Hence, the present study mainly adopts an objective evaluation method with a high weighted results-entropy method [
39]. The entropy method determines the weight according to the degree of dispersion of the index. In other words, the smaller the information entropy of the index, the more substantial the information provided. On the contrary, the greater the information entropy, the smaller the amount of information provided.
3.5. Standardization of Indicators
To eliminate the difference of magnitude, dimension, and positive and negative orientation of each index, data should be standardized first. The standardized formulas for the positive and negative indexes are as follows.
When the larger index value represents the better development quality (i.e., economic development) of new urbanization, the positive index calculation formula was used for standardization:
Positive indicator formula:
By contrast, when the smaller index value represents (i.e., pollution) the better quality of the new-type urbanization, the negative indicator calculation formula was used for standardization:
Negative indicator formula:
Specifically, the first step is to calculate the proportion of the j-th index value of the i-th town
The second step is to calculate the index information entropy.
The third step is to calculate the information entropy redundancy.
The fourth step is to calculate the indicator weight.
The fifth step is to calculate the urbanization quality of the i-th town.
“*n” refers to the number of indicators, and “m” refers to the number of towns; “P” is the index information entropy, “X” indicates whether P is a positive indicator or negative indicator, “D” denotes the information entropy redundancy, “W” refers to the indicator weight, and “F” is the urbanization quality of the town.
The entropy method was used to score the index system by the following three steps. In the first step, the entropy method was used to perform steps (1) to (7) for each three-level index to be weighted and score each three-level index; in the second step, the first step was repeated to weight the secondary-level indicators, and then each secondary-level index was scored. In the third step, the above process was repeated to weight and calculate the index weights.
3.6. Data Analysis
Software SPSS was used to perform cluster analysis on different cities and towns and distinguish cities with higher, middle, and lower levels of their urbanization quality. Correlations between urbanization models and urbanization quality were also analyzed.
4. Results
Based on the relevant theories and methods of multi-channel urbanization, the present study first selected 13, 18, and 5 indicators from the three aspects—economics, social life, and environment to construct a multi-channel urbanization indicator system (
Table 3). Then, a multi-channel urbanization index system was used to evaluate the quality of urbanization. By calculating the average and standard deviation of each impact indicator, the overall perception of residents’ perception of urbanization quality was analyzed through multivariate analysis of variance, and the differences between different urbanization models were identified.
4.1. Evaluation of Urbanization Quality
In general, the traditional urbanization method is based on urbanization rate data. In other words, it is based on the population urbanization or land utilization rates. At present, the problems caused by one-sided urbanization under the guidance of the evaluation system are increasingly prominent, such as population urbanization or uncoordinated urbanization of urban areas. Thus, building a multi-channel urbanization index system is particularly important to evaluate the quality of urbanization. However, no unified multichannel urbanization evaluation index system is available currently. On the basis of a comprehensive analysis of existing research results and literature review, the index system is constructed according to the principles of scientificity, representativeness, systematicness, operability, and hierarchy, and the weight is determined via entropy method. The established multichannel urbanization quality evaluation index system is shown in
Table 3.
Using 13 cities and towns as independent variables and 51 index scores as dependent variables, multivariate analysis of variance was conducted by software SPSS, and the analysis results are shown in
Table 3. As shown in
Table 3, sig. values marked with "*" or "**" indicate that the indicator has a significant difference.
4.2. Urbanization Quality
According to the above data, the urbanization pattern of each case town is judged and analyzed from five dimensions (
Table 4).
SPSS was used to perform cluster analysis in 13 towns. Findings showed that Shidu town, Panggezhung town, Shahe town, and Dongxiaokou town are towns with a high degree of urbanization. Jiubujian town, Baitutan town, and Xianyu town are towns with a medium degree of urbanization. Huangtuling town, Wanchun town, Jiezi town, Gu’an town, Huayuan town, and Anren town are towns with a low degree of urbanization. Using 13 towns as independent variables and scores of various indexes as dependent variables, the following results are obtained through multivariate analysis of variance (
Table 5). Findings showed that significant differences are found in the economic development, basic public service quality, ecological environment development, urban–rural heterogeneity, and population urbanization in the process of urban development in different cities and towns.
4.3. Towns with Higher Urbanization Quality
Among Shidu town, Panggezhung town, Shahe town, and Dongxiaokou town, Shidu town has the highest urbanization quality (comprehensive score 0.158311, ranking 1), and the economic development quality index score is equal to 0.022572, ranking 1st; the score of ecological environment quality is equal to 0.046988, ranking 1st; the population urbanization quality score is equal to 0.002402, ranking 1st; and basic public service quality score is equal to 0.082065, ranking 1st; The quality score of urban–rural coordination is equal to 0.004284, ranking 1st. Findings show that Shidu town’s urbanization infrastructure, public service quality, and ecological environment protection are the best compared with those of its counterparts.
Among the towns with higher urbanization quality, the lowest is Dongxiaokou town (comprehensive score 0.090393, ranking 4th); economic development level, Dongxiaokou town (comprehensive score 0.4693, ranking 1st); economic development quality index score is equal to 0.012888, and ecological environment quality score 0.026829; the population urbanization quality score is equal to 0.001371; basic public service quality score is 0.046858; the quality score of urban–rural coordination is equal to 0.002446. Results show that Dongxiaokou town has a good quality of basic public services and ecological environment protection in the aspect of urbanization.
From the above results, it can be seen that cities and towns with high urbanization quality are all distributed around Beijing, the capital city of China. The development of Beijing drives the development of the surrounding areas. Compared with Zhuzhou and Chengdu, Beijing is the capital of China and the center of politics, culture, science and technology, information, and foreign exchanges. The macro-decision-making and control departments of the national economy are all in Beijing. At the same time, its air and railway passenger and cargo traffic rank the first in the country. These advantages are incomparable to all other cities. Therefore, the development of the surrounding areas of Beijing also has advantages over other places.
4.4. Towns with Medium Urbanization Quality
Among towns with medium urbanization quality like Jiubujian town, Baitutan town, and Xianyu town, Jiubujiang town has the highest urbanization quality (with a comprehensive score of 0.067514, ranking 5th), with economic development quality index score of 0.009626, ecological environment quality index score of 0.020039, population urbanization quality index score of 0.001024, basic public service quality index score of 0.034998, and urban and rural overall planning quality index score of 0.034998. The five indicators are all at a medium level. Although Jiubujiang town is a town developing tourism, and the quality of basic public services has been improved in the past, insufficient attention has been paid to the urban environment and the overall development of urban and rural areas. Hence, to further develop tourism, the local government still needs to invest in its urban environment.
It can be seen that most towns with medium urbanization quality are located in the surrounding areas of Zhuzhou City in the central part of China. Although Zhuzhou City has fewer resources than the capital city of Beijing, it has comparative advantages over other parts of the country. First of all, Zhuzhou City has developed transportation, including high-speed rail, planes, ships, and other means of transportation. The transportation from Zhuzhou City to other parts of China is fast and smooth. Although Zhuzhou City is not along the sea or the border, the aforementioned unique conditions enable Zhuzhou City to integrate into China’s developed economic circles such as the Yangtze River Delta and Pearl River Delta. The development of Zhuzhou city has also driven the development of the surrounding areas, which have developed into commercial and tourist towns depending on the advantages of commerce and transportation.
4.5. Towns with Lower Urbanization Quality
Among Huangtuling town, Wanchun town, Jiezi town, Gu’an town, Huayuan town, and Anren town, Huangtuling town (comprehensive score 0.053877, ranking 8th) has the lowest economic development quality index score (0.007882) and ecological environment quality score (0.015991). The quality score of population urbanization is equal to 0.000817, basic public service quality score is equal to 0.027929, and the quality score of urban–rural coordination is equal to 0.001458. Results showed that Huangtuling town, which is mainly engaged in commerce and trade, performs well in the quality of basic public services. However, Huangtuling town’s population urbanization process is relatively slow compared with that of other towns.
Wanchun town’s urbanization comprehensive quality score is equal to 0.048536, ranking 9th. It has a population urbanization quality score of 0.000736, economic development quality score of 0.006920, ecological environment quality score of 0.014406, urban and rural overall planning quality score of 0.001313, and basic public service quality index score of 0.025160. Wanchun town is an urbanization development model dominated by the real estate industry. With the development of local urbanization, the quality of urban–rural integration is poor, the income gap between urban and rural residents is still large, the education, medical care, employment, social security, and other benefits of residents have not been greatly improved, and the government has paid low attention to the construction of basic public service facilities.
The comprehensive quality score of Gu’an town is equal to 0.044684, ranking 11th. In the process of urbanization, Gu’an town has poor overall quality, weak promotion effect on economic development, great damage to the ecological environment, a serious shortage of green coverage in built-up areas, and relatively low government investment in basic public service construction. With a small population, the process of urbanization of the population is slow. Hence, the overall quality of urban and rural development of Gu’an town is also at a low level.
The lowest comprehensive quality score of urbanization is Anren town, with only 0.041119, ranking 13th. Anren town is an urbanization model featuring the development of tourism in ancient towns. It mainly relies on tourist resources such as the ancient town of Anren and museum towns in the town to attract tourists to visit. The quality of Anren town’s ecological environment is good, with a score of 0.012205, whereas its quality of population urbanization is poor, with a score of 0.000624. The quality of Anren town’s overall urban and rural planning and the quality of basic public services are also poor. A large gap exists in terms of medical security between villagers and urban residents. The improvement of quality is slow, and the quality of life of residents has not been greatly improved. Anren town relies on tourism income for some economic growth, but the effect is not obvious. The economic development quality score is 0.005863, ranked 13th, which is the lowest among all the cities and towns. The development of tourism in Anren town has not brought large growth to the local town economy. The government still needs to devote more efforts to attract more tourism consumption.
From the above analysis, it can be seen that the towns with low quality of urbanization development are mostly located in the western region of China. The economic development, basic public service quality, ecological environment development, urban–rural heterogeneity, and population urbanization in these towns are worse than those around Beijing and Zhuzhou. The western region of China is affected by terrain and other factors. It is difficult to construct infrastructures such as transportation. Weak infrastructure and inconvenient external transportation greatly affected the economic development. Therefore, the quality of local urbanization development is lower than that of other parts of the country.
4.6. Quality Differences in Different Model Towns
After calculating the scores of the five indicators of the urbanization quality of the i-th town through the calculation formula in "Materials and Methods", the average value of five indicators of the urbanization quality of the five towns in the tourist-type urbanization model is added to obtain five index values of the urbanization quality of the tourist-type urbanization model. As a result, five index values of the urbanization quality obtained are shown in the following
Table 6.
As shown in
Table 7, science and education urbanization has the highest comprehensive score, totaling 0.140726, ranked 1st, followed by agricultural urbanization, with a comprehensive score of 0.097649, ranked 2nd; tourism urbanization has a comprehensive score of 0.074321, ranked 3rd; the comprehensive atmosphere is 0.067271, ranked 4th; the comprehensive score of business-oriented urbanization is 0.056573, ranked 5th; the lowest score is traffic-based urbanization, only 0.044684. Using the urbanization model as the independent variable and the various index scores as the dependent variable, the following results were obtained by SPSS software’s multiple variance analysis as indicated in
Table 6. Results showed that significant differences are found between the ecological environment and urbanization development model (
p = 0.01) and between basic public service quality and urbanization development model (
p = 0.009). No significant differences are found between population urbanization and urbanization model (
p = 0.389), economic development and urbanization model (
p = 0.634), and urban–rural heterogeneity and urbanization model (
p = 0.464).
4.7. Differences in the Quality of Urbanization in Different Regions
After calculating the five indicators of the urbanization quality of the i-th town through the calculation in "Materials and Methods", the average values of the five indicators of the urbanization quality of the five cities and towns in Beijing/Zhuzhou/Chengdu are added to obtain the average value, respectively, to obtain the index score of the region. As a result, the obtained values of urbanization quality are shown in
Table 8.
Using the regions as the independent variables and the various index scores as the dependent variable, results were obtained through a multivariate analysis of variance by SPSS.
Table 9 shows that no significant differences exist in the aspects of population urbanization (
p = 0.748), economic development (
p = 0.476), ecological environment (
p = 0.633), and basic public service quality (
p = 0.949) in different regions during the process of urban development, whereas significant differences exist in the aspect of urban–rural heterogeneity in different regions (
p = 0.049).
4.8. Correlation Analysis of the Third-level Indicators and Urban Areas and Models
SPSS was used to analyze the correlation between 51 third-level indicators and 3 regions. The results are shown in
Table 10. The correlations between the two indicators are significant in regions. They are production of industrial solid waste (10,000 tons) and proportion of rural non-agricultural employees (%). Due to the differences among the eastern, central and western regions of China, the economic and environmental factors are also significantly different in different regions. Correlation analysis of 51 third-level indicators and urbanization model was also conducted, and results showed that 10 indicators have significant correlations with urbanization model. As shown in
Table 10, Urban unemployment rate (%) is highly correlated with the urbanization model. Different town models have different characteristics. Tourism urbanization has relatively high environmental requirements, while real estate urbanization has relatively low environmental requirements. The consumption of commercial urbanization is closely related to the lives of residents. Due to the different characteristics of the urbanization model, indicators have different and significant correlations with the urbanization model.
5. Discussion
Differently from other scholars who evaluated the urbanization level from a macro perspective [
29], the present study investigated the urbanization index system from the following five aspects: population urbanization, economic development, ecological environment, urban–rural heterogeneity, and basic public service quality. Compared to Zhou De’s study showing that the quality of urbanization is strongly influenced by system structure, function, and their interrelationships [
40], this study analyzes the differences between the urbanization model and urbanized regions. Other studies evaluated China’s urbanization status and concluded that China’s urbanization is continuing to grow, and the main characteristics of China’s urbanization are reflected in the aspects of economic growth and the rapid evolution of the geographical pattern [
41]. In addition to the investigation of five indicators that can represent the urbanization level of cities/towns, the present study also reveals that eastern, central, and western regions of China have large differences in the level of urbanization development. Overall, the urbanization rate is the highest in the east. The rate is average in the central part and lowest in the west. The integration of urban and rural economic development, residents’ life, infrastructure, social security, and public services have also shown a situation of high and low levels. The level of urbanization development in China and the administrative level of the region in which it is located show significant correlation characteristics. The higher the administrative level and the greater the autonomy, the higher the health of urbanization. In terms of economic development indicators and urbanization development indicators, the level of urbanization development in the eastern region is better than that in the central and western regions. The degree of correlation between the urbanization model and urbanization quality is not obvious. Therefore, based on economic development, basic public service quality, ecological environment development, urban–rural heterogeneity, and population urbanization, urbanization quality is high in the east and low in the west.
From the perspective of urban and rural economic development, the regional geographical features are the important reasons for China’s economic strength in the east and weakness in the west. China’s economic flow is from the mainland to the coast, which has achieved fruitful results. The focus of China’s economic development has always been on the coast and along the Yangtze River. After the reform and opening up in 1979, China has formed three major regions: Beijing–Tianjin–Hebei urban agglomeration, with Beijing as the core center, Shanghai as the core center, and Hong Kong and Guangzhou as core centers. Therefore, the geographical environment has a great influence on the regional economy. In addition, from the perspective of the natural environment, the natural environment in the central and western regions is hindering the rapid development of the central and western regions. For example, from the perspective of natural fertility, in addition to the relatively high natural fertility of the land in Jilin and Heilongjiang in the northeast and Hanzhong plain in Shaanxi, the low natural fertility of the land in the Loess Plateau, Qinghai-Tibet Plateau, and Yunnan–Guizhou Plateau in the central and western regions has led to the backwardness of agricultural production.
From the analysis of historical reasons, the eastern region in China has superior natural conditions for agricultural development, developed waterway transportation, and dense population. Before liberation, the eastern coastal region was a relatively developed area for industry and commerce in China. After the establishment of New China, the state has generally implemented the development of heavy industry in the central and western regions, while the degree of association between heavy industry and other industries is relatively low. After the reform and opening-up policy, the country has decided to develop a policy that leans towards the east. The eastern region has seized favorable opportunities to develop rapidly on the road to economic development.
From the perspective of market subjects, the market subjects in the eastern region are relatively active. Many dynamic enterprises and self-employed individuals made use of policies to vigorously develop commodity industry in the shortage economy era in the early 1980s, accumulating initial material capital and manpower management and laying a foundation for future township enterprises and private enterprises. At that time, township enterprises in the central and western regions were still in the initial stage of development and extensive scale expansion.
Secondly, economic system changes, central policy guidance, local reform efforts, regional strategic decisions, and other factors are combined. "Lagging Reform" and "Lagging System" are the primary bottlenecks restricting the economic development in the western region. In the process of continuous promotion of the market economy system, the eastern part of the country has advanced system reform, a higher spirit of innovation and updated concepts and can take advantage of the favorable policy environment provided by the central government. However, due to the lagging reform in the western part of the country, when the central government issued its policies, all kinds of software and hardware conditions could not keep up with it and could not be implemented. A western part could only follow in the footsteps of the developed regions.
Finally, from the perspective of residents, the western inland region is deeply influenced by the geographical culture, blood relationship, and patriarchal clan system. The "loess culture" against this background has become the dominant ideology in western society. The "loess culture" has formed the self-sufficient concept of small farmers and the inertia of being content with the status quo. Besides, the economy that has been operating under the planned economy system for a long time has bound people’s ideology, resulting in weak market economy consciousness and outdated and conservative ideology in the western region. These backward and outdated concepts have seriously imprisoned people’s thoughts, limited their horizons, bound their hands and feet, and become obstacles to the economic development of the western region. The eastern region emancipated its mind earlier and can quickly accept the new ideas and concepts of the modern market economy. The public has a strong awareness of commodities, markets, competition, and openness. It can adapt to changes in the domestic and international environment and follow the world’s advanced trends. It can grasp the national policies in time and make full use of the policies given by the central government.
To sum up, this study discusses the reasons for the low quality of urbanization from the perspectives of China’s economic development, historical reasons, market subjects, and residents’ concepts. There are not only economic factors, historical reasons, but also social and natural reasons. Taking advantage of natural advantages, external economic environment, and preferential policies, the eastern region has a higher ability to attract foreign investment than the central and western regions, making it economically developed and with a high per capita income, which in turn is better than the central and western regions in terms of township economic development, residents’ living, infrastructure, social security, and public service integration.
6. Strategies for Improving the Quality of Sustainable Urbanization
Based on the aforementioned findings, development suggestions are listed in the following three aspects: prominent location advantages, coordinated development in all aspects, and an in-depth understanding of the distinctive design development model.
6.1. Prominent Location Advantages
Compared with developed countries, China’s urbanization still has great dividends. As farmers speed up into cities, rural farmland can better realize digital management and promote economies of scale. Commercialization of agricultural products, adjustment of agricultural structure, and revitalization of rural idle resources can also be promoted. Surrounding areas of big cities should further highlight their location advantages and characteristics, define their functional positioning, coordinate their development plans, continuously strengthen their industrial support and comprehensive evaluate carrying capacity, and accelerate new steps in promoting urbanization. Given the importance of the role of the head engine of regional center cities, guiding and encouraging the continuous accumulation of high-end resources and structural optimization can assist to achieve greater urbanization among the advantageous regional cities.
6.2. Coordinated Development in All Aspects
Five dimensions of population urbanization quality, quality of economic development, urban and rural development quality, ecological environment quality, and basic public service quality all affect the overall level of urbanization quality, which are interlinked and mutually reinforcing. Therefore, cities and towns should coordinate to solve the problems in the aforementioned five aspects in their urbanization development to achieve an all-round improvement of the quality level of urbanization. Tourism practitioners and government should particularly pay more attention to the aforementioned aspects and adopt corresponding development strategies to achieve the goal of comprehensive and focused development.
6.3. In-depth Understanding of the Distinctive Design Development Model
Although the urbanization model is not directly related to the urbanization quality, each town has its own characteristics. Depending on its own resource advantages, by combining with the influence of policy conditions, location conditions, human factors, and historical development industries on the development quality of local urbanization can be considered to realize and enhance the urbanization of a city or town. Due to policy reasons, urbanization of China is very different from the east to the west. The degree of urbanization in the eastern part is high, whereas the degree of urbanization in the middle and western parts is low. To further improve the quality of urbanization, a thorough understanding of the development characteristics of each city/town, resource conditions, and advantages and disadvantages of urbanization development must be made. We also recommend determining the overall development direction and key promotion strategies and modes by taking the actual situation and regional environmental changes.
7. Conclusions
Findings of the present study show that the quality of urbanization development is affected by various factors based on the actual survey results of urban quality in China. In the process of urbanization planning and construction, various factors must be comprehensively considered; not only the economic development of the cities and population urbanization rates but also environmental quality, basic public service quality, and integrated urban and rural development also need to be taken into consideration, and a healthy and sustainable development path must be taken. Regarding quantitative evaluation of indicators, differences in urbanization quality between different models are not obvious, but the differences between regions are. In summary, the quality of urbanization development in the eastern region is better than those in the central and western regions. The differences in the quality of urbanization between regions are mainly reflected in population urbanization, quality of economic development, ecological environment quality, urban–rural quality, and basic public service quality. Indicators that affect the quality difference of urbanization mainly include proportion of output value of high-tech products (%), COD emissions (10,000 tons), ammonia nitride emissions (1,010,000 tons), industrial exhaust emissions (10,000 tons), smoke (powder) dust emissions (thousands of tons), comprehensive utilization rate of solid waste (%), per capita income ratio of urban and rural residents, and participation rate of new rural cooperative medical system (%).


