Article

Allocation of Environmental Impacts in Circular and Cascade Use of Resources—Incentive-Driven Allocation as a Prerequisite for Cascade Persistence

Department of Business Chemistry, Ulm University, 89081 Ulm, Germany
*
Author to whom correspondence should be addressed.
Sustainability 2020, 12(11), 4366; https://doi.org/10.3390/su12114366
Submission received: 29 April 2020 / Revised: 21 May 2020 / Accepted: 22 May 2020 / Published: 26 May 2020
(This article belongs to the Section Resources and Sustainable Utilization)

Abstract

:
In cascade use, a resource is used consecutively in different application areas demanding less and less quality. As this practically allows using the same resource several times, cascading contributes to resource efficiency and a circular economy and, therefore, has gained interest recently. To assess the advantages of cascading and to distribute the environmental impacts arising from resource extraction/processing, potentially needed treatment and upcycling within the cascade chain and end-of-life proesses represent a difficult task within life cycle assessment and highlight the needs for a widely applicable and acceptable framework of how to allocate the impacts. To get insight into how the allocation is handled in cascades, a systematic literature review was carried out. Starting from this status quo, common allocation approaches were extracted, harmonized, and evaluated for which a generic set of criteria was deduced from the literature. Most importantly, participants must be willing to set up a cascade, which requires that for each participant, there are individual benefits, e.g., getting less environmental burdens allocated than if not joining. A game-theoretic approach based on the concept of the core and the Shapley value was presented, and the approaches were benchmarked against this in a case-study setting. Several of the approaches laid outside the core, i.e., they did not give an incentive to the participants to join the cascade in the case study. Their application for cascade use is, therefore, debatable. The core was identified as an approach for identifying suitable allocation procedures for a problem at hand, and the Shapley value identified as a slightly more complex but fair allocation procedure.

1. Introduction

To reduce the overuse of natural resources [1,2], three main paths can be distinguished: efficiency (using less resources for the same output), consistency (using renewable resources instead of exhaustible ones), and sufficiency (reducing demand by a more frugal lifestyle). The path towards consistency has led to increasing demand for renewable raw materials and direct and indirect pressures on biomass and land resources. Using raw material, such as wood, several times, for the same usage allows to reduce this pressure and contributes to resource efficiency. However, this is hampered by decreasing material quality, which impedes resource use in a fully circular way. This is referred to as closed-loop recycling (CLR), in contrast to open-loop recycling (OLR), and does neither include a change in inherent properties of the material nor a transfer to a product system outside the one under study. In a cascade (the term goes back to Ted Sirkin and Maarten ten Houten [3]), however, different types of uses with different quality requirements are combined to a series ordered by their requirements on input material quality. The type of use with the highest quality requirements represents the first step in the cascade, followed by a second step with the second highest quality requirements and so on. The output material quality must be over all steps higher than the input material quality required by the succeeding step. The difference between output quality and required input quality should be minimal such that no quality is “wasted”. Therefore, a cascade can be considered as a system consisting of several uses, each requiring a lower material quality than the previous one. Their order is fixed, but leapfrogging one or several uses is possible, even though this would negatively affect resource efficiency as a material is less intensively used than it could be.
Though convincing as a concept, a major issue in cascading is a willingness to take part in a cascade. Typically, for each use, there is a different actor deciding independently about whether to become a part of the cascade or not. Furthermore, it is not guaranteed that all actors overlook the entire cascade. If their visible horizon is limited to the use one step upward and possibly the use one step downward, they might be unaware of the fact that they are part of a cascade. Therefore, it is important to inform about cascade use and to give incentives or penalties in order to assure extensive cascading use [4].
Current allocation approaches developed in life cycle assessment (LCA) for open-loop recycling, which are needed to assign the environmental impacts arising over the life cycle of the material over the different steps or processes of the cascade, may pose a barrier for the formation of a cascade. For example, it is evident that a participant getting allocated more environmental impacts in a cascade situation than in case of using primary material has limited interest in joining the cascade. This is not different in open-loop recycling (OLR). Besides, the need to take care that the output has a sufficient quality to be used as input for the subsequent step is known from OLR. What is particular in cascades is that there is a series of several uses with decreasing quality requirements. This series makes it necessary to think from the whole cascade as the cascade is less efficient or even obsolete if one chain link in the cascade fails. If the cascade is known, it is possible to distribute the environmental impacts over the entire cascade and not just between two processes serving as further motivation to be a part of a cascade. In fact, when applying OLR allocation methods to cascades, the theoretical span reaches from assigning all environmental impacts from resource production to the first use process in the cascade that consumes the virgin resource, to dividing the total environmental impacts by the number of steps in the cascade and allocating this share over the steps, and, finally, allocating all to the last step as this one makes a raw material become waste material.
So far, there is widespread literature on allocation procedures in general and a large number of empirical studies on cascades, which use different allocation procedures when performing a life cycle assessment (LCA) of the cascade. To our best knowledge, there is, however, a lack of 1) a review of the different allocation procedures used in raw materials cascades, 2) an analysis of the appropriateness of different OLR allocation procedures for cascades, and 3) guidance for selecting an OLR allocation method for a cascade, which ensures that the participants have an incentive to become part of the cascade.
The remainder of the paper is structured as follows. First, an introduction and definition to cascade use and allocation are presented, setting the ground for an extensive literature review covering allocation in cascades and allocation procedures used therein. Allocation procedures are evaluated towards the use in cascades, and the need is shown to further examine the criteria of incentives, leading to a definition of the incentives in place and a presentation of methods to react to them. A case study presents a possible application of cascade allocation framed by an analysis of incentivized behavior.

2. Background

Though cascade use is sometimes defined as a “sequential use of bio-based raw materials for energetic and material applications” [5], numerous examples of cascade use of non-bio-based materials exist, such as mineral aggregates [6] or rechargeable batteries [7]. Another view on cascade use is to define it as an approach for more appropriately assessing open-loop recycling by always including the production of virgin material and final waste management [8].
For the study presented, we prefer to define cascading use of a material resource as the reuse of one unit of material for several subsequent uses, which, in general, encompasses a downward trend of material quality. The raw material entering the cascade can be a primary or a co-product. A recycling process at the end of the cascade is possible, as well as intermediate processing steps to adapt (or even (slightly) increase) the quality of output to the quality needed for becoming input for the subsequent step. A necessary characteristic of the cascade is the decreasing material quality over the cascade, which determines also the order of the use processes unless there would be material upgrading (“upcycling”) between the use steps. The term recycling, in contrast, is the use of the material of a (waste) product as input to the production of the same product (closed-loop recycling) or another product (open-loop recycling, OLR). The term recycling is largely (waste) material-oriented and typically looks at two steps only: one from which the (waste) material is leaving and the other into which the recycled material enters. The cascades differ from recycling by the fact that several (more than two) different use processes follow each other in a fixed order, having a decreasing demand for material quality. The perspective is from the beginning of the use processes involved in the cascade as well as the material. If there are several use processes, different cascades are possible, involving all or just some of the use processes.
Allocation describes the assignment of environmental impacts deriving from one or several processes to more than one product [9]. This may occur in multi-output processes where more than one marketable product is produced and where a direct assignment of the flows to each product is not possible. Another case, which is especially important in cascading use is recycling [10], where environmental loads of the initial production of the primary product, as well as recycling and waste management processes, have to be allocated to all following secondary products in order to fulfill basic requirements for a fair result. Allocation is one of the most intensively discussed aspects in LCA methodology, and thus a variety of procedures have been developed [10,11,12].
The key ISO standards for LCA [9,13] provide a general description of how to proceed with multi-output or recycling situations. Several procedures are presented, and a clear order is recommended. The allocation order first mentions the avoidance of allocation by system expansion or separation into distinguishable processes (cf. Figure 1). Secondly, in cases where avoidance of al-location is not possible, an allocation by physical measures is preferred, which may be mass or calorific value. This is followed by thirdly any relationship, which can be seen as adequate for the situation, such as the economic value of the goods examined [9,13]. Within this framework, practitioners can choose from different methodologies and have the possibility to align allocation to the individual scope of the problem at hand. In practice, however, it also hampers objectivity of the study since the choice of an allocation method may considerably affect the results, and the choice is rarely justified.
Avoidance of allocation by means of partitioning the system into distinguishable processes is not possible in an open-loop recycling situation like in cascades. Further, direct system expansion is the enlargement of the material life cycle system in a way that all upstream and downstream processes are included [14]. This requires an adjustment of the system boundary and thus an adaptation of the functional unit to all products now enclosed and thus requires the whole material cycle to be modeled. An extensive description of system expansion in cascades and an example thereof for a wood cascade can be found in Höglmeier (2015) [15]. A simplified method of system expansion is the so-called substitution method [16], which regards all exported or imported material as potentially replaceable and assigns credits for either delivering secondary material to a downstream process (end-of-life recycling (EOLR) credit) or taking secondary material from an upstream process (credit for the use of recovered material). These methods are widely used in LCA studies but include some major short-comings, such as internal inconsistencies, high complexity if many processes are involved, and the often arbitrary choice of an adequate equivalency process, which is base for the credits given [16].
Particularly for cascades, the allocation is far less applied in the literature. One example of an in-depth analysis of allocation specifically applied to cascade use is the article by Kim et al. (1997) [2], who developed a new methodology consisting of a modular procedure to solve specific questions on how to handle life cycle emissions. There is, however, a rich literature on allocation methods for open-loop recycling, e.g., Gaudreault (2012) [12] for an in-depth method overview. Due to the similarity of the technical course of action in cascade use and open-loop recycling, these procedures are well suited for carrying out analyses on cascade use.
The suitability of an allocation procedure depends on the system analyzed. In general, three main views on and levels of a system can be distinguished: process level, product system level, and material life cycle system level [8] (Figure 2). The process level includes a single recycling process, which is regarded as a function, providing waste management for upstream processes and secondary material provision for downstream processes. The product system level is focused on the function of the product under study and includes additional functions, such as secondary material provision or waste management. Boundaries are flexible and may be set according to the scope of the study [8]. The material life cycle system-level represents the most holistic view of the system, including the possible provision of one or several products along the cascade. All procedures mentioned in this publication aim at presenting an approach for determining environmental burdens on the product system level, including possible effects on the entire material cycle [17]. Therefore, allocation associates products with processes not clearly linked to them [12].
The main interest when analyzing cascades is the fate of the primary material entering the cascade. Typically, the primary material has the highest quality and purity, which is subsequently lost and degraded in the following cascade steps. In order to trace material degradation along the whole material cycle, additional inputs of primary material in others but the first life cycle or waste management emissions apart from the final life cycle are neglected. This leads to a simplified life cycle model (right side of Figure 3). The x-axis represents the life cycle duration, and the y-axis represents the quality of the primary material along the cascade. From left to right, there is a quality decrease along the material life cycle or cascade. All calculations in this paper are based on this simplified model but are not limited to three life cycle steps (denoted by the indices 1 to 3). Each step may be performed by a different participant.
General evaluation criteria for allocation procedures are described by Ekvall and Tillman (1997), who regard the acceptance of the procedure, as well as applicability, as key criteria. ISO 14044 [9] calls for the use of uniform calculation methods for the upstream and downstream sides. For cascade use, Kim et al. (1997) consider the incorporation of quality changes of the material as important [2]. Data demand is another issue, restricting the use of procedures in many cases. Existing studies on cascade use, such as Höglmeier (2015), consider the whole life cycle as known, which allows for the application of basically all allocation procedures [15]. In practice, processes in the (distant) future are fraught with higher uncertainty, limiting the use of certain procedures, such as the value corrected substitution method (VCS), cf. Table 1.
Azapagic and Clift (1999) carry out a comparison of different allocation procedures on a co-production case study [18]. The procedures compared comprise consequential LCA, as well as system expansion and mass-based procedures. They conclude that a detailed comparison of different options is crucial in order to meet the criteria on the results defined in the goal and scope definition. Chen et al. (2010) provide a brief comparison of allocation by economic factors and by mass, as well as not performing an allocation in the area of mineral waste recycling is included [19]. Cherubini et al. (2011) [20] consider co-production in biorefinery applications by comparing allocation by mass, energy, exergy, and economic value supplemented by a hybrid procedure, while Dubreuil et al. (2010) [21] provide guidance for metal recycling applications considering the basic end of life options (open and closed-loop recycling, pool, alloy), and van der Harst et al. (2016) [22] carry out a comparison of six recycling approaches for aluminum. In the field of renewable materials, Werner and Richter (2000) provide an evaluation of allocation in general and in the case of wood recycling, which almost completely meets the criteria of cascade use [23]. While the basic procedures of allocation are mostly covered in these comparisons, quality degradation is hardly included. However, the factors, such as exergy evaluation and economic measures, can be seen as a way of including quality. Ardente and Cellura (2011) conclude that in order to correctly apply allocation, a case by case evaluation is necessary, which is a generally agreed notion upon the publications mentioned [24].

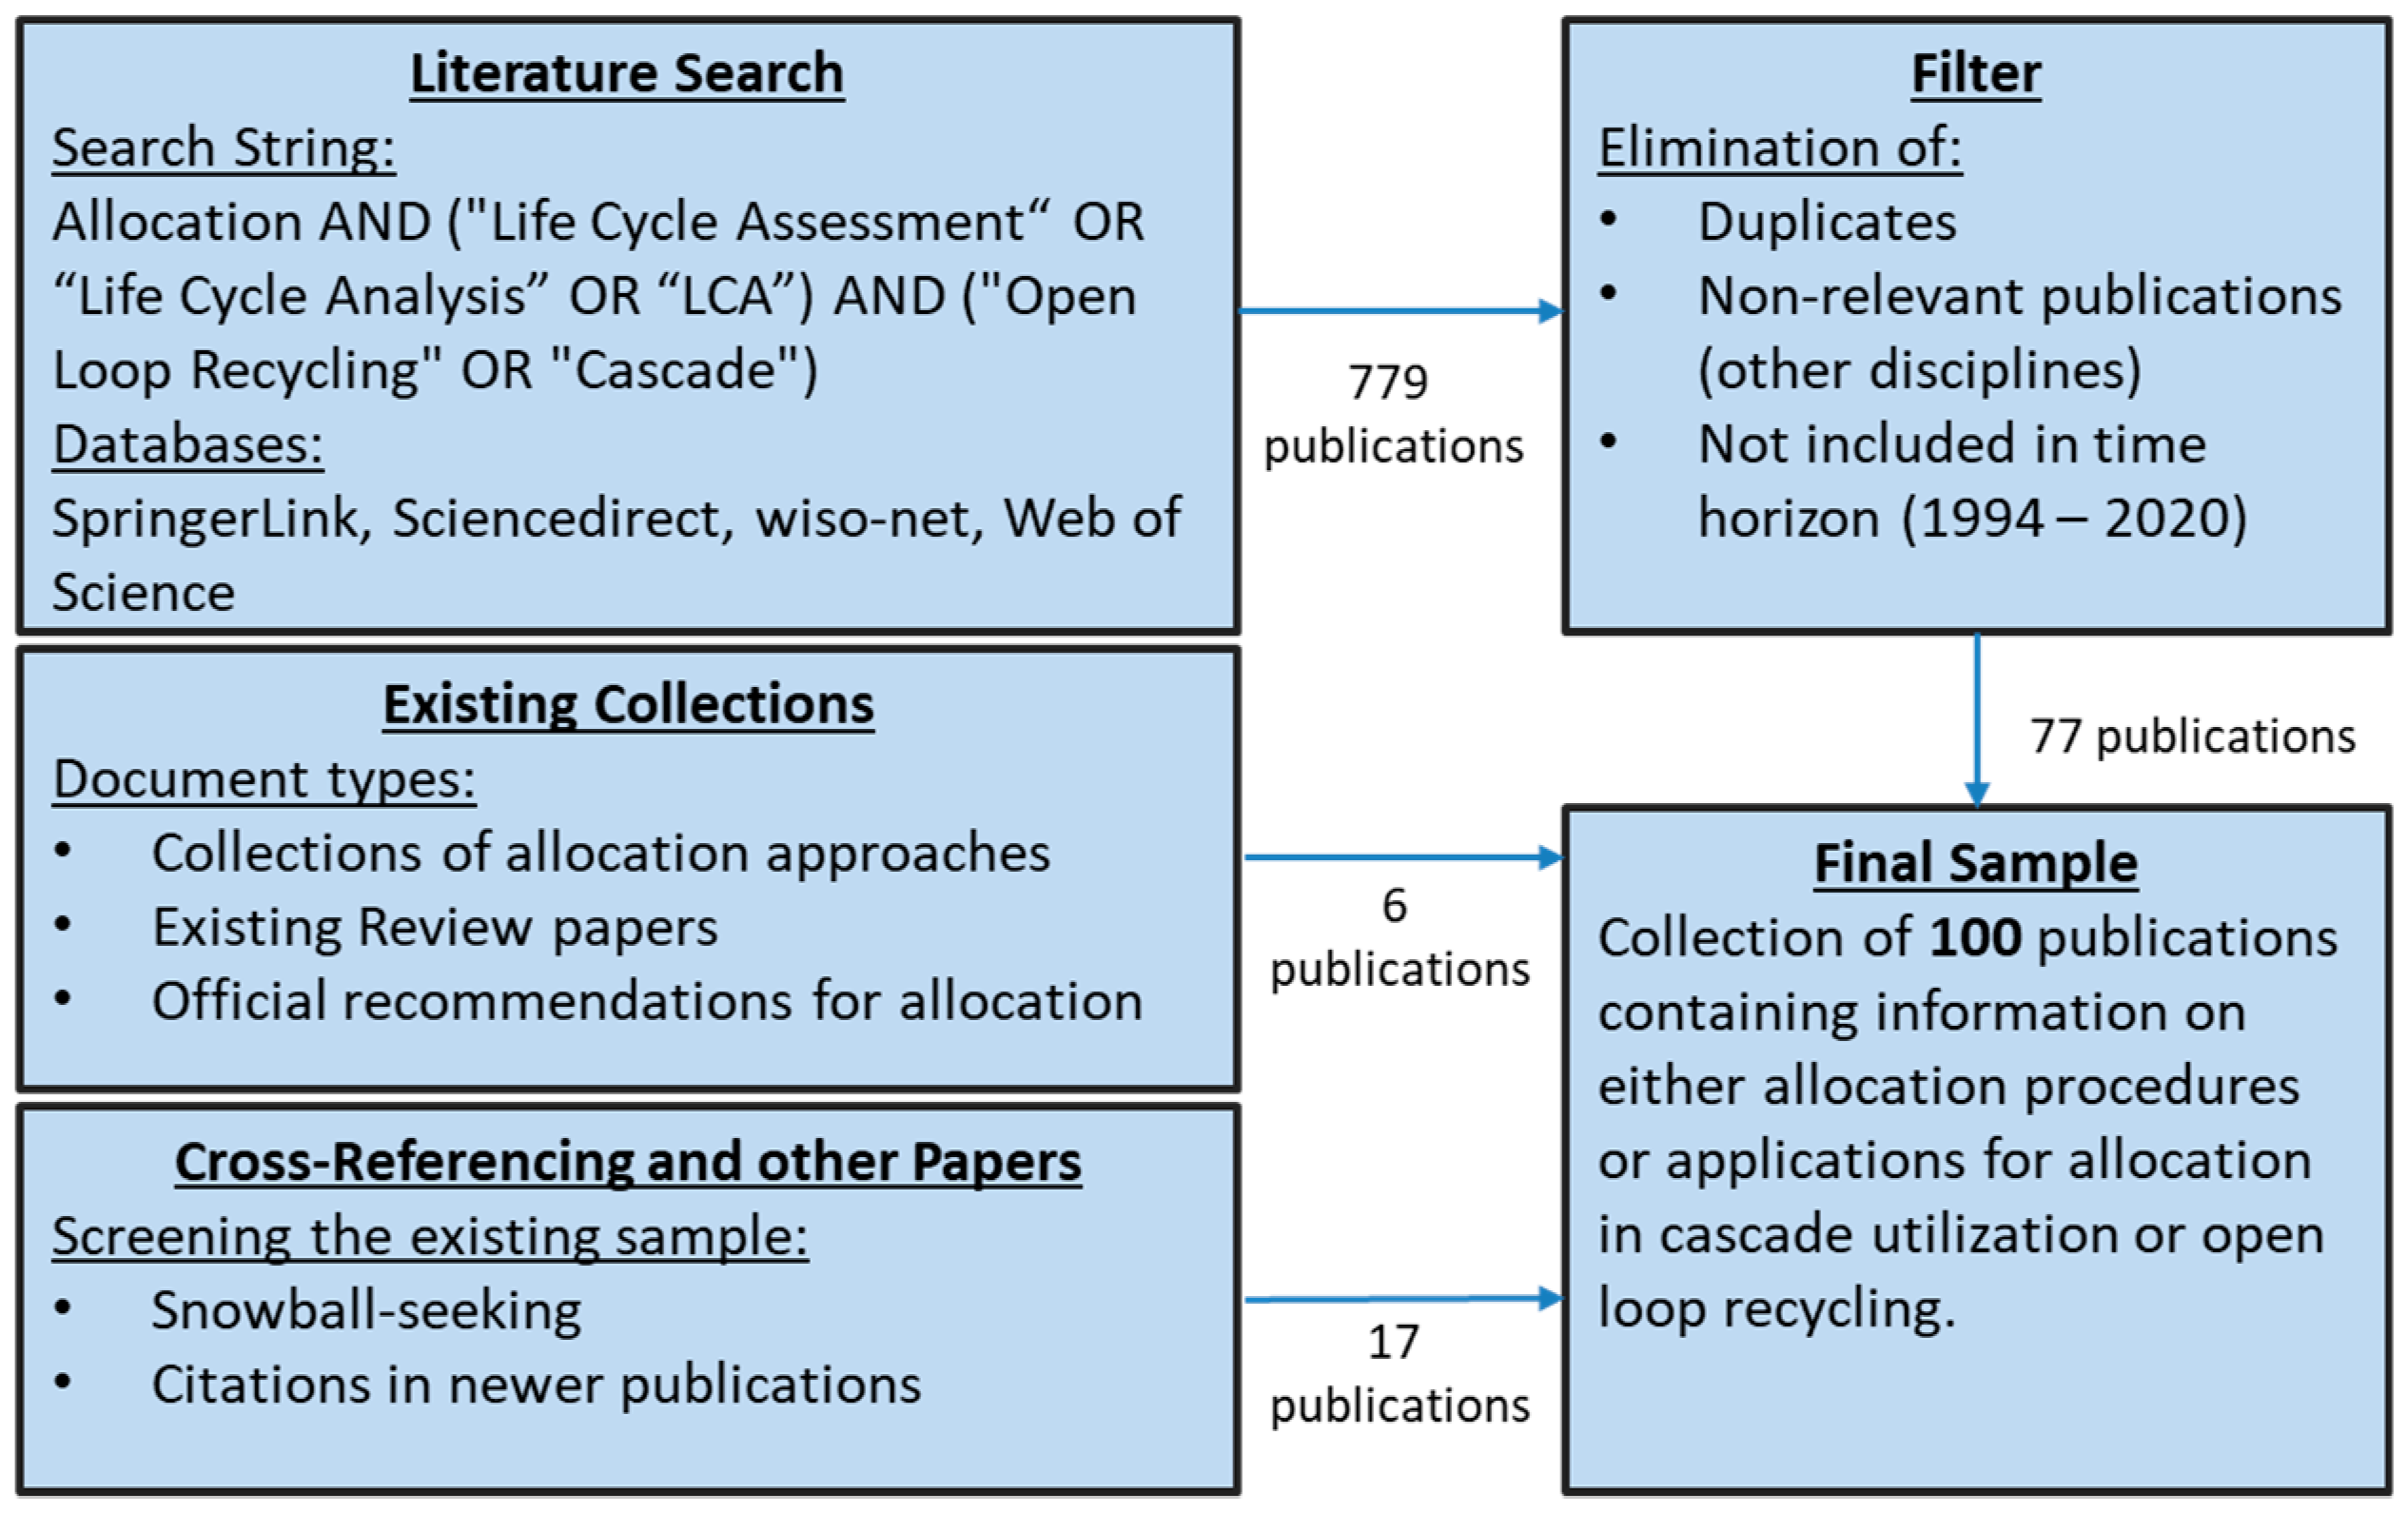
3. Systematic Literature Review

To analyze which allocation methods are used in cascades of raw materials, an extensive literature review was conducted, including systematic content analysis, as described in Brandenburg et al. (2014) [25], with the following steps: 1) Material collection, 2) Descriptive analysis, 3) Category selection, 4) Material evaluation, and 5) Material collection. The detailed procedure is sketched in Figure 4. Since the concept of cascade utilization was first described by Sirkin and ten Houten (1994) [3], publications from 1994 until April 2020 were searched. Publication types considered include peer-reviewed journal articles and reports published by research institutions in the English language listed in major scientific databases (Springer Link, Sciencedirect, wiso-net, and Web of Science), as proposed by Seuring and Gold (2012) [26]. Both collections of common allocation procedures, as well as publications on a single approach for a particular setting, were considered. Excluded from the analysis were publications on allocation procedures solely for multi-output-processes, neglecting cascade use as well as approaches, which completely avoid allocation in cascade use.
First, overview publications [8,12,27,28,29] were analyzed to identify the main approaches. Ekvall and Tilman describe eight different procedures [8], Gaudreault seven [12], and Johnson et al. four [28]. Only Kim et al. [2] explicitly deal with allocation in cascading situations. From the overview publications, eight basic allocation procedures were identified. Second, an extensive literature search in common databases and meta-search engines, as mentioned above, was carried out using the search string “Allocation AND (“Life Cycle Assessment“ OR “Life Cycle Analysis” OR “LCA”) AND
“Open Loop Recycling” OR “Cascade”)”. Literature not relevant to the study was excluded from the sample, resulting in a sample size of 77 publications. Third, via cross-referencing, the other 17 publications were added, resulting in a total of 100 publications for the analysis. To get a general understanding of how the allocations procedures are applied and to what extent, bibliographic measures were applied, which required a prior standardization of the sample with respect to wording and allocation methods. The sample was also analyzed with respect to the criteria used for selecting or excluding certain allocation procedures.
A total of eight clearly distinguishable allocation methods applicable to attributional LCA were identified (Table 1). These could be further categorized into four types of approaches (Figure 5) based on the general idea behind the procedure: i) cut-off procedures, ii) procedures with an arbitrary allocation of impacts to life cycle phases, iii) quality-based procedures, and iv) hybrid procedures assigning to each type of emission a separate, specifically justified calculation scheme taken from the above-mentioned main motivations.
The cut-off approach was represented by the recycled content procedure, which is used synonymously [8] and includes 100:0 approaches as these can be considered as a form of a cut-off approach [30]. Extraction and disposal load procedures, as well as 50:50 allocation procedure, were assigned to the second group due to their randomly chosen base, which is a compromise between simplicity and fairness. As soon as quality (three procedures), price, or other countable units were considered, this was seen as a quantifiable base. Hybrid methods, such as the example of Kim et al. (1997) [2], which is composed of 50:50 and partly extraction load and other procedures from the abovementioned, were excluded from the study due to their high degree of possible variations. The sometimes mentioned 100:100 approach was also excluded from the analysis due to its obvious pitfall of not keeping overall mass preservation regarding the overall cascade [30].
With the exception of six publications in 2000 and 2001 each, the publication rate was rather low in the period 1994 to 2006 and increased from 2007 onwards (Figure 6). The year 2017 marked a peak with 20 publications.
Categorization of the sample with respect to i) type of allocation approach, ii) application case, and iii) type of the model is shown in Table 2. The diversity of application cases was large. Around 20 percent of the sample covered cascade use (Figure 7), with a focus on biomass exploitation and general guidance for allocation, followed by case studies for biomass use. Mineral materials, metals, and plastics were widespread in OLR publications, but not in cascading as cascading is rare for these materials.
In about 50 percent of the sample, a quantitative base was used for allocation, followed by system expansion (Figure 7). Quantitative base comprised procedures, such as economic, physical, or figures, referencing to a quantifiable degradation of the material. Since market prices are frequently available and known, the preferred way of allocating burdens is by considering the decline in price over the material life cycle and cascade. These may perform well in practice but have drawbacks in terms of transparency and fairness of allocation results [113]. More recent approaches are those considering market development, as well as hybrid procedures. These typically include several methods, providing a tailored approach for specific problems. The analysis showed that there was no broad agreement on which procedure was preferable in general or for a specific situation.

4. Evaluation of the Allocation Procedures

The criteria allocation procedures have to meet were collected from the literature. In total, 13 criteria could be identified that were classified into four groups: alignment with institutional guidelines and standards, appropriateness to goal and scope of the study, methodological issues, and performance achieved.
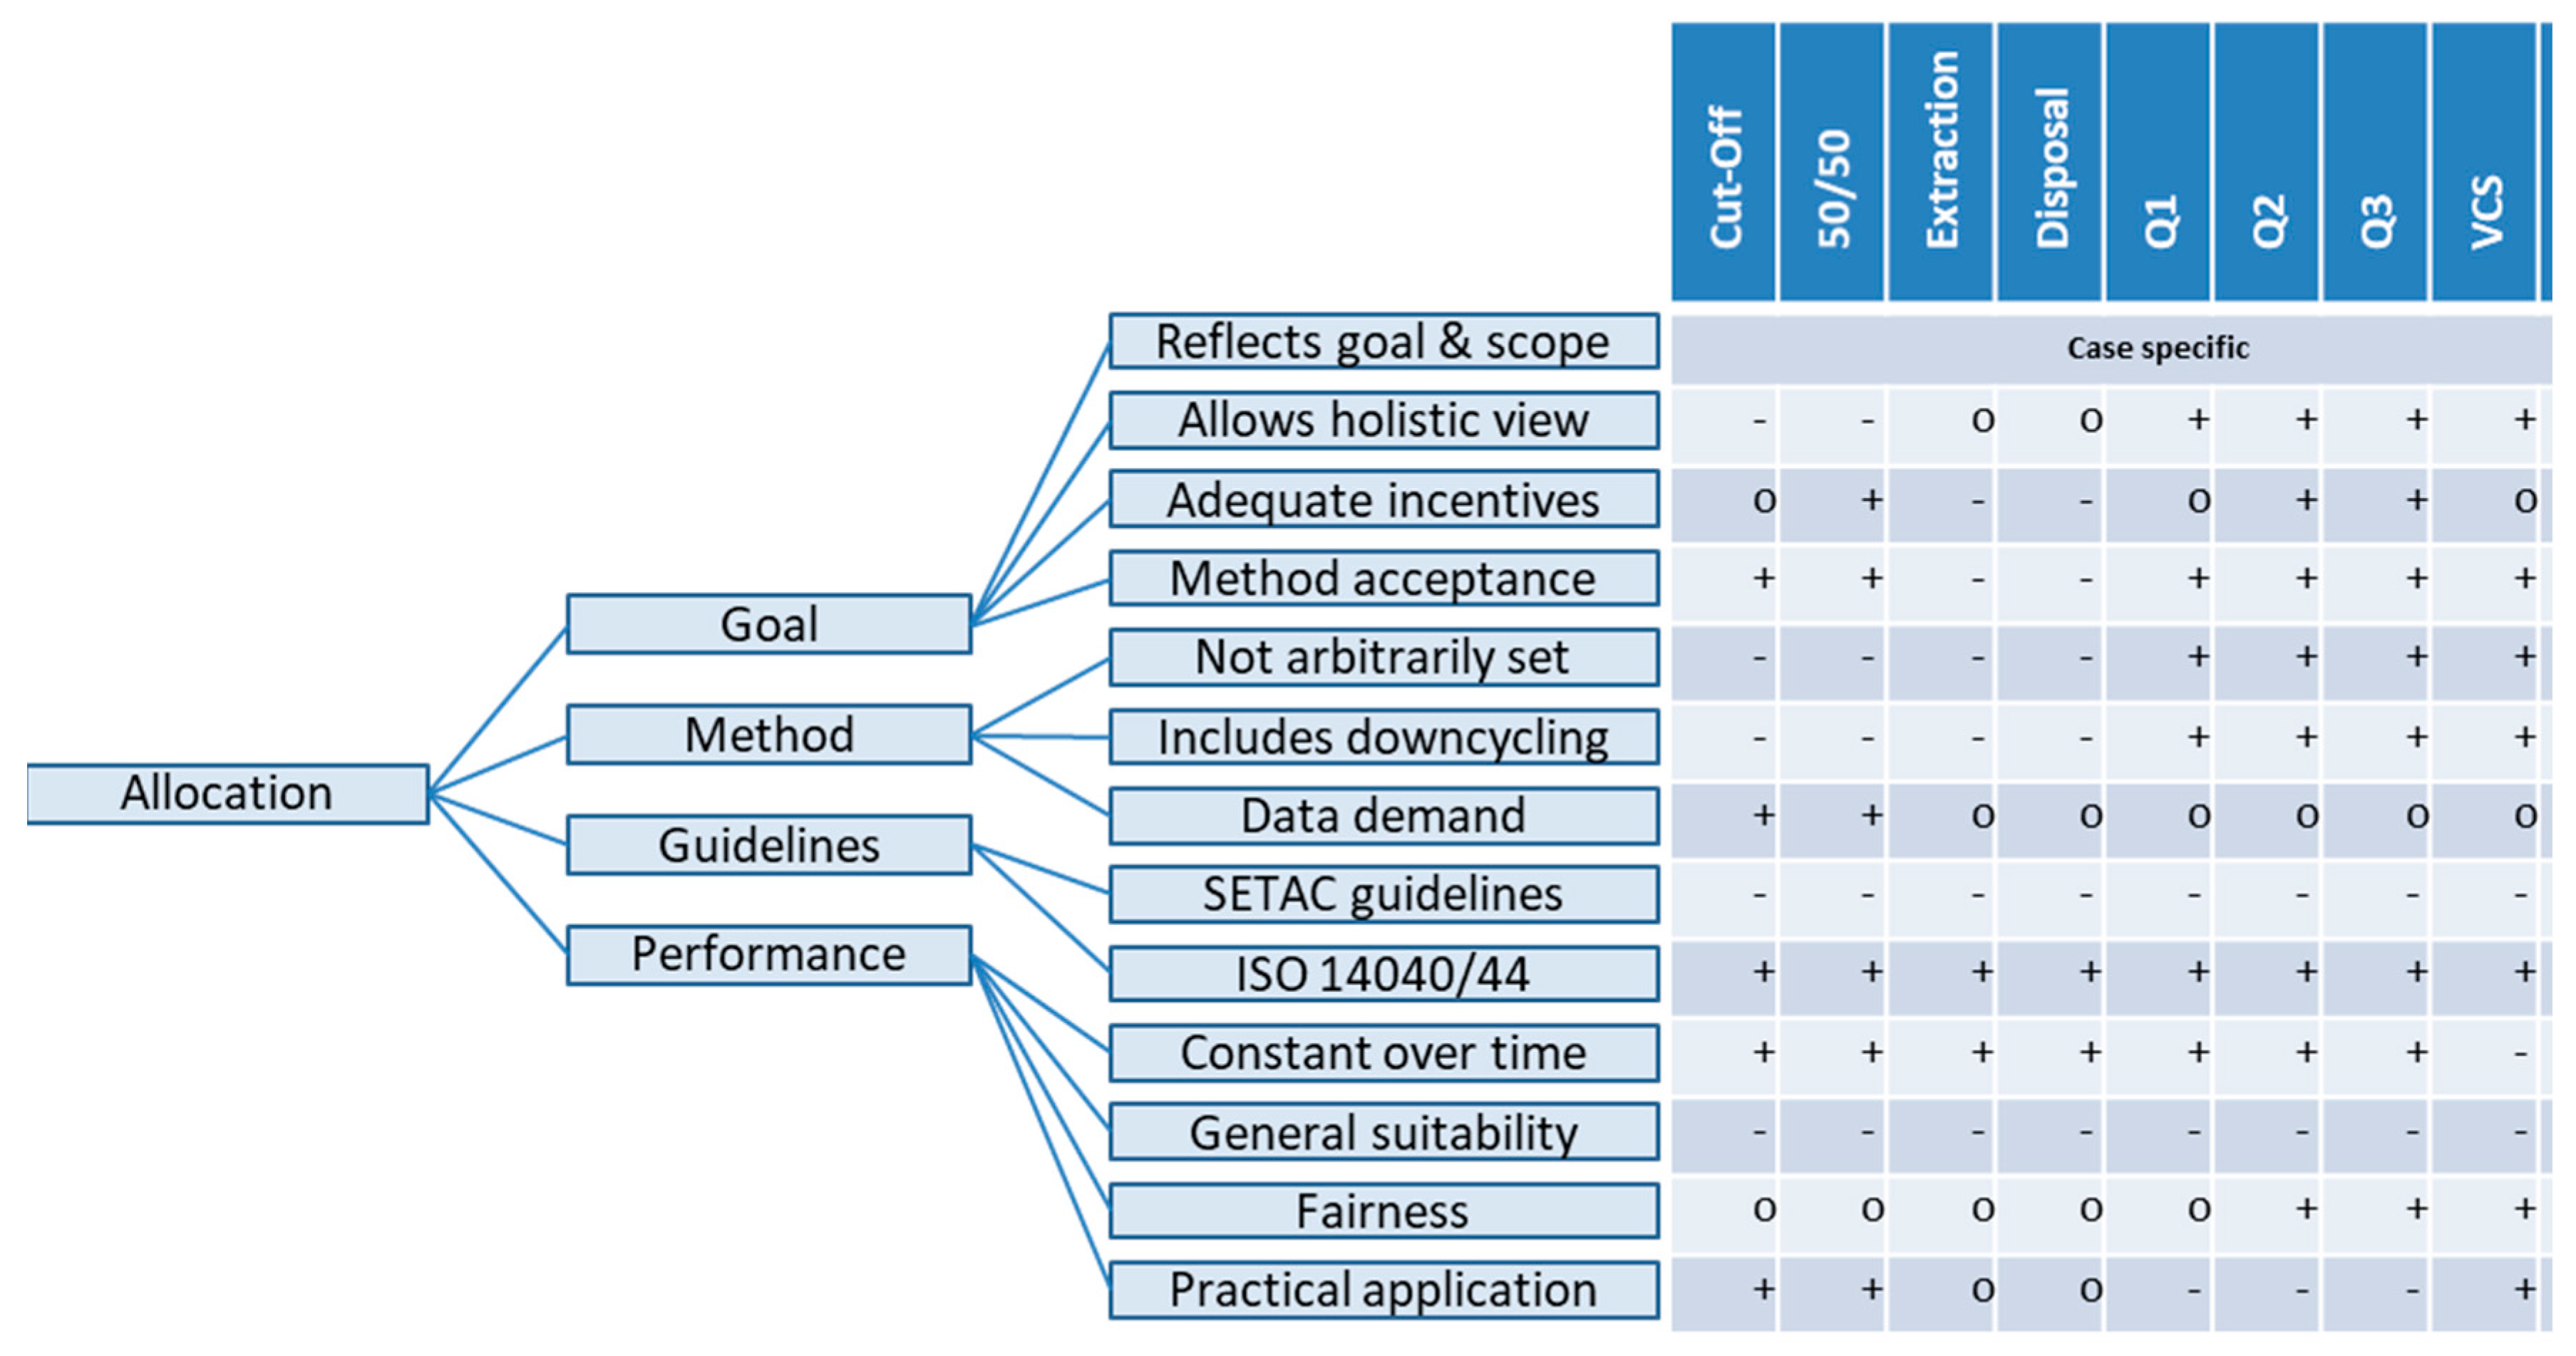
  • Institutional guidelines or standards: Besides ISO 14040 and 14040 [9,13], which should form the base of any LCA study, there is a series of more detailed guidelines, such as theSociety of Environmental Toxicology and Chemistry (SETAC) recommendations for allocation in LCA [17], which recommend alignment of goal and scope and procedure applied, re-evaluation of the order of allocation preference as presented in ISO 14044, and an application of industry-specific allocation procedures.
  • Goal and scope of the study: The appropriateness with respect to the LCA study’s goal and scope is an indispensable criterion. A holistic view is taken by considering the whole cascade, including upstream and downstream processes from the process in focus. Incentives influence cascade participants in their decision on whether to enter a cascade or not. Although there is no direct effect on environmental burden distribution, incentives can be seen as a prerequisite for cascade use in general and have to be taken into account when choosing allocation procedures. The overall acceptance of the chosen procedure is crucial in order to justify the decision. This includes transparency of the procedure, as well as consensus from all actors involved [113].
  • Methodological principles: Basing procedures on a well-founded approach, reflecting the underlying relationships, is advantageous. An intuitively preferable way is the inclusion of inherent quality change, mostly representing downcycling [2].
  • Overall performance: A key requirement for the high performance of an allocation procedure is time invariance. This means that factors defining allocation are not changing over (shorter) time. Besides, double-counting must be avoided. General suitability to all possible situations and fairness with respect to all actors involved can be seen as further performance factors. The practical application should not be hindered by any factors necessary for the allocation procedure. Another factor is data demand [2,8,24].
The identified allocation procedures were briefly described and evaluated against the criteria presented above.
The premise of the cut-off-procedure is that recycling is triggered by the demand for secondary materials. Therefore, recycling efforts of subsequent cycles are not assigned to upstream processes. The cut-off is the most intuitive procedure with little calculation effort [8]. Another advantage is easy communication of the underlying ideas, as well as applicability by practitioners without deeper knowledge about upstream and downstream processes, and thus also its low data demand. On the downside, there is the missing incorporation of quality degradation. Furthermore, since recycling is an environmental burden for the subsequent life cycle only, the interest for the current life cycle to ensure recyclability (and thus foster cascade use) is lower [114].
Fifty-fifty procedure: It aims at sharing responsibility for a defined set of processes equally between all products and is thus one of the simpler procedures but performs well in terms of both general acceptance and applicability. However, incentives at the upstream or downstream side might get lost if a split by half is not seen as adequate. Quality change is not included, and data demand is rather modest [27].
Extraction and disposal load procedures: In extraction load procedure, the initial producer is held responsible for all impacts caused by both material extraction and material fate in the future, i.e., in particular, the final waste management efforts after the material leaves the last life cycle of the cascade. Incentives are clearly against striving for good recyclability after utilization as no credit is given to waste management on the product system level [8] but exist for avoiding the use of primary material. In the disposal load procedure, the last cycle is held responsible. Incentives are created for establishing high recycling rates after usage in the life cycle and keeping options for further material use by maintaining a certain quality due to the fact that waste management is credited to the final usage [12]. These procedures may perform well in specific cases (e.g., pursuing the goal of providing a unilateral incentive) but, in general, present rather unpopular choices due to their asymmetric character. Overall acceptance is supposed to be rather low, and applicability is limited due to high data demand resulting from the requirement that all primary and waste management flows of the whole material cycle must be known. Quality degradation is not included, and incentives are obviously distributed unequally.
Quality degradation procedures: Using quality measures as a base for allocation in cascades seems straightforward. Each product system is held responsible for the loss in material quality it induced. Several procedures can be distinguished from the literature [8,12] such that questions arise which quality indicator to choose. Quality-oriented procedures intuitively represent a fair base similar to the polluter pays principle. Applicability is subject to the availability of indicators for quality, and thus practically rather limited. The second quality degradation procedure in Table 1 dominates the first in terms of fairness and incentives due to the inclusion of both primary material impacts and recycling process impacts in all life cycles. The third procedure uses a slightly different key number of relative quality left in the current cycle instead of quality change from one cycle to the next but includes both recycling and primary material as well [27].
Value-corrected substitution (VCS): In this type of procedure, instead of material quality, the economic value is used as a base for the allocation. The most well-known is value-corrected substitution (VCS) [28], further refined as VCS2.0 [65]. The basic requirement is the availability of market prices not only for primary but for all secondary materials occurring in the material life cycle. The effects of material price changes on allocation results by the value-corrected substitution (VCS) procedure have to be considered, which is depicted in Figure 8. Price data for wood materials were taken from online databases [115,116,117] and served as a base for allocation by VCS. A change in the hierarchy of the prices of the four commodities becomes visible. In some periods, prices of the goods switch positions, which directly affects the focus of allocation.
To conclude, while quantity-based procedures perform well against the methodological criteria, the general performance of these procedures is rather low due to high data demand and practical application constraints (Figure 8). Appropriateness with respect to goal and scope cannot be assessed without detailed knowledge of the LCA study and the problem that should be addressed. SETAC Guidelines [17] recommend a more case-specific choice and design of procedures, which can partly be seen as fulfilled by hybrid procedures, such as the one presented by Kim et al. (1997) [2]. As Figure 9 shows, none of the methods is compelling with respect to all criteria.

5. Incentives as an Additional Key Criterion for Allocation Procedures in Cascades

In an ideal cascade, multiple actors are involved in utilizing a resource as intensively as possible. This requires information exchange such that a party involved requiring a certain material quality can identify those who provide an output quality, which is least above the required input material quality. Mutual trust is indispensable since relying on output as raw material results in various dependencies such as a trust for a steady and sufficient supply in the required quality. Finally, all parties involved must see an advantageous situation in the cascade for themselves compared to other alternatives. All allocation procedures described above see the existence of a cascade as a prerequisite, but without an individual advantage, a participant might never enter a cascade. Advantages may be financial (lower costs) but also reduced environmental burdens allocated to a participant or both. The following discussion focuses on incentives by a reduced environmental burden allocated to a participant compared to the alternative scenario of not being part of the cascade. In case of a result that causes one cascade participant to consider not joining or leaving the cascade while, at the same time, representing an essential role for overall persistence of the cascade, a compensation (financial or reduced environmental burden allocated) could be a possible intervention. This results in a typical cooperative game-theoretic problem. Regardless of whether economic or environmental criteria are weighted higher, a cascade failure can be caused by the following six aspects, which are depicted in Figure 10.
Aspect 1.
An incentive in place for preferring a primary material over the secondary material supplied by the upstream part of a cascade This may be the case for primary material being offered at a lower price, in better quality, or in a logistically more advantageous way than secondary material.
Aspect 2.
An incentive for leaving out a cascade step. This is the case if, for example, an upstream cascade participant sees the advantage of selling his material to a non-neighboring participant further downstream. An example from practice is energetic utilization being economically more advantageous (e.g., caused by a framework/regulation), favoring waste to energy utilization.
Aspect 3.
The incentive for the waste management participant to prefer or also accept an input material of higher quality and thus giving the incentive to deliver so.
Aspect 4.
Material leaving a cascade step may be preferred to be fed to waste management instead of to a further recycling step. This may be the case due to low revenues from giving material to downstream cascade participants in combination with the low cost of disposal of waste.
Aspect 5.
Incentives to not enter a cascade by transaction costs, lock-in effects, or the insecurities linked to relying on others delivering or buying material to achieve their own company goals. These insecurities may include supply, demand, or quality fluctuations or inflexibility in supply and demand.
Aspect 6.
Lack of incentives to keep material quality high along the process chain inside a participant’s production, which causes the material to be less useful for all downstream processes, which is not reflected in market prices.
These incentives impeding the cascade may even be amplified by applying the standard allocation procedures, as shown in the following.

5.1. A Cooperative Game Theory Based Concept for an Optimal Constellation

Game theory is a concept of analyzing situations in which two or more participants take decisions, influencing each other’s welfare [118]. The participants of a game are supposed to have rational interests, i.e., they thrive to maximize one’s own payoff. Cooperative game theory analyzes situations where a certain number of participants have a common or at least a non-conflicting goal and the possibility to enter coalitions. Games are further differentiated into non-transferable ones (participants receive a pre-assigned share of the overall utility) and transferable ones (overall utility is divided between the participants) [118]. Transferable cooperative game-theoretical approaches are widely used for cost allocation in management science [119,120]. Prerequisites to be met are that i) each participant has to benefit from entering the coalition, and ii) the order of participants entering is exchangeable [121,122]. Cascade use can be interpreted as a cooperative game where the cycles and, thus, participants represent the players. Cooperation gains are the reduced environmental impacts, which are distributed among the cycles.

5.2. The Shapley Value for Fair Allocation in the Cascades

A solution principle in cooperative game theory is the so-called Shapley value. It is a point-solution concept, indicating that its result is a single solution. It fulfills the four axioms of Pareto efficiency (value of coalition is distributed amongst players), the null player (a player with a marginal contribution of zero gets credited zero), symmetry (players with similar contribution receive similar payouts), and additivity (partial games have the same aggregated payout as the overall game) [119,123,124]. The Shapley value is widely applied in some cases, also for distributing environmental benefits from a cooperation between the participants (e.g. Hiete et al. (2012) [125] and was also suggested for allocation situations [53]. Benefits are distributed according to the marginal contributions of the participants in each possible way of entering the cooperation [118]. There is a couple of alternative point-solution concepts available, such as Banzhaf–Coleman Index, Deegan–Packel Index, or Public-Good-Index, which have some improvements, especially regarding the Shapley value based on simple permutations (Banzhaf–Coleman uses coalitional options instead). However, for allocation, Shapley value better fulfills the criteria of transparency and simplicity, which qualifies it for an application in line with the other allocation procedures depicted before. Additionally, from the game-theoretic view, it shows a result similar to the Nash equilibrium for simple coalitional games, confirming the methodology [118]. A major downside of the Shapley value is that complexity increases exponentially with the number of players, which limits the number of players to approximately 25 [126].
Following Zucca (2010), we assume N = (1,2,3, ..., n) as a set of players, where every subset S ⊆ N is called coalition, and N is the grand coalition [122]. The costs, or in case of a cascade environmental burdens a player would have individually, i.e., without a coalition, are c(i). The stand-alone cost c(i) differs from the share xi it has/gets allocated in coalition S. c(S) are the total costs of coalition S and c(N) of the grand coalition.
In a successful coalition, individual and group rationality has to be ensured, i.e., no player has a cost allocated to it higher than its own opportunity cost (Equation (1)), i.e., the cost it had when not participating, and a coalition is only formed if overall costs do not increase (Equation (2)).
x i c ( i )
i S x i c ( S )
Further, the difference between the total costs of the grand coalition C(N) and the costs that would accrue if a group or coalition S leaves the grand coalition c ( N \ S ) are termed marginal costs c ( N ) c ( N \ S ) of that group S. As a precondition for the formation of a cascade, these marginal costs must be lower than the individual costs of that group S (Equation (3)) [122], i.e., a participant or group of participants will enter the coalition only if this is regarded beneficial by the coalition (the participant carries at least the marginal cost of its entry and thus avoids being subsidized by the rest of the existing coalition):
i S x i c ( N ) c ( N \ S )           S   N  
In a cascade only, coalitions with a downward quality product flow are allowed, reducing the number of admissible coalitions. In Figure 11, possible paths (or partial parts) are shown for a cascade situation. The table on the right in Figure 11 shows the permutations of how participants could enter the coalition.
The Shapley value is determined as follows: For each participant, the marginal costs of entering are determined for each possible permutation (cascade constellation). All marginal costs are summed up for each participant and finally divided by the number of permutations, resulting in a mean marginal cost of each participant. This is done for all participants, which represent the life cycles in the cascade example. It is interpreted as a contribution (value) to the cascade(s) and represents a possible solution to the allocation problem.

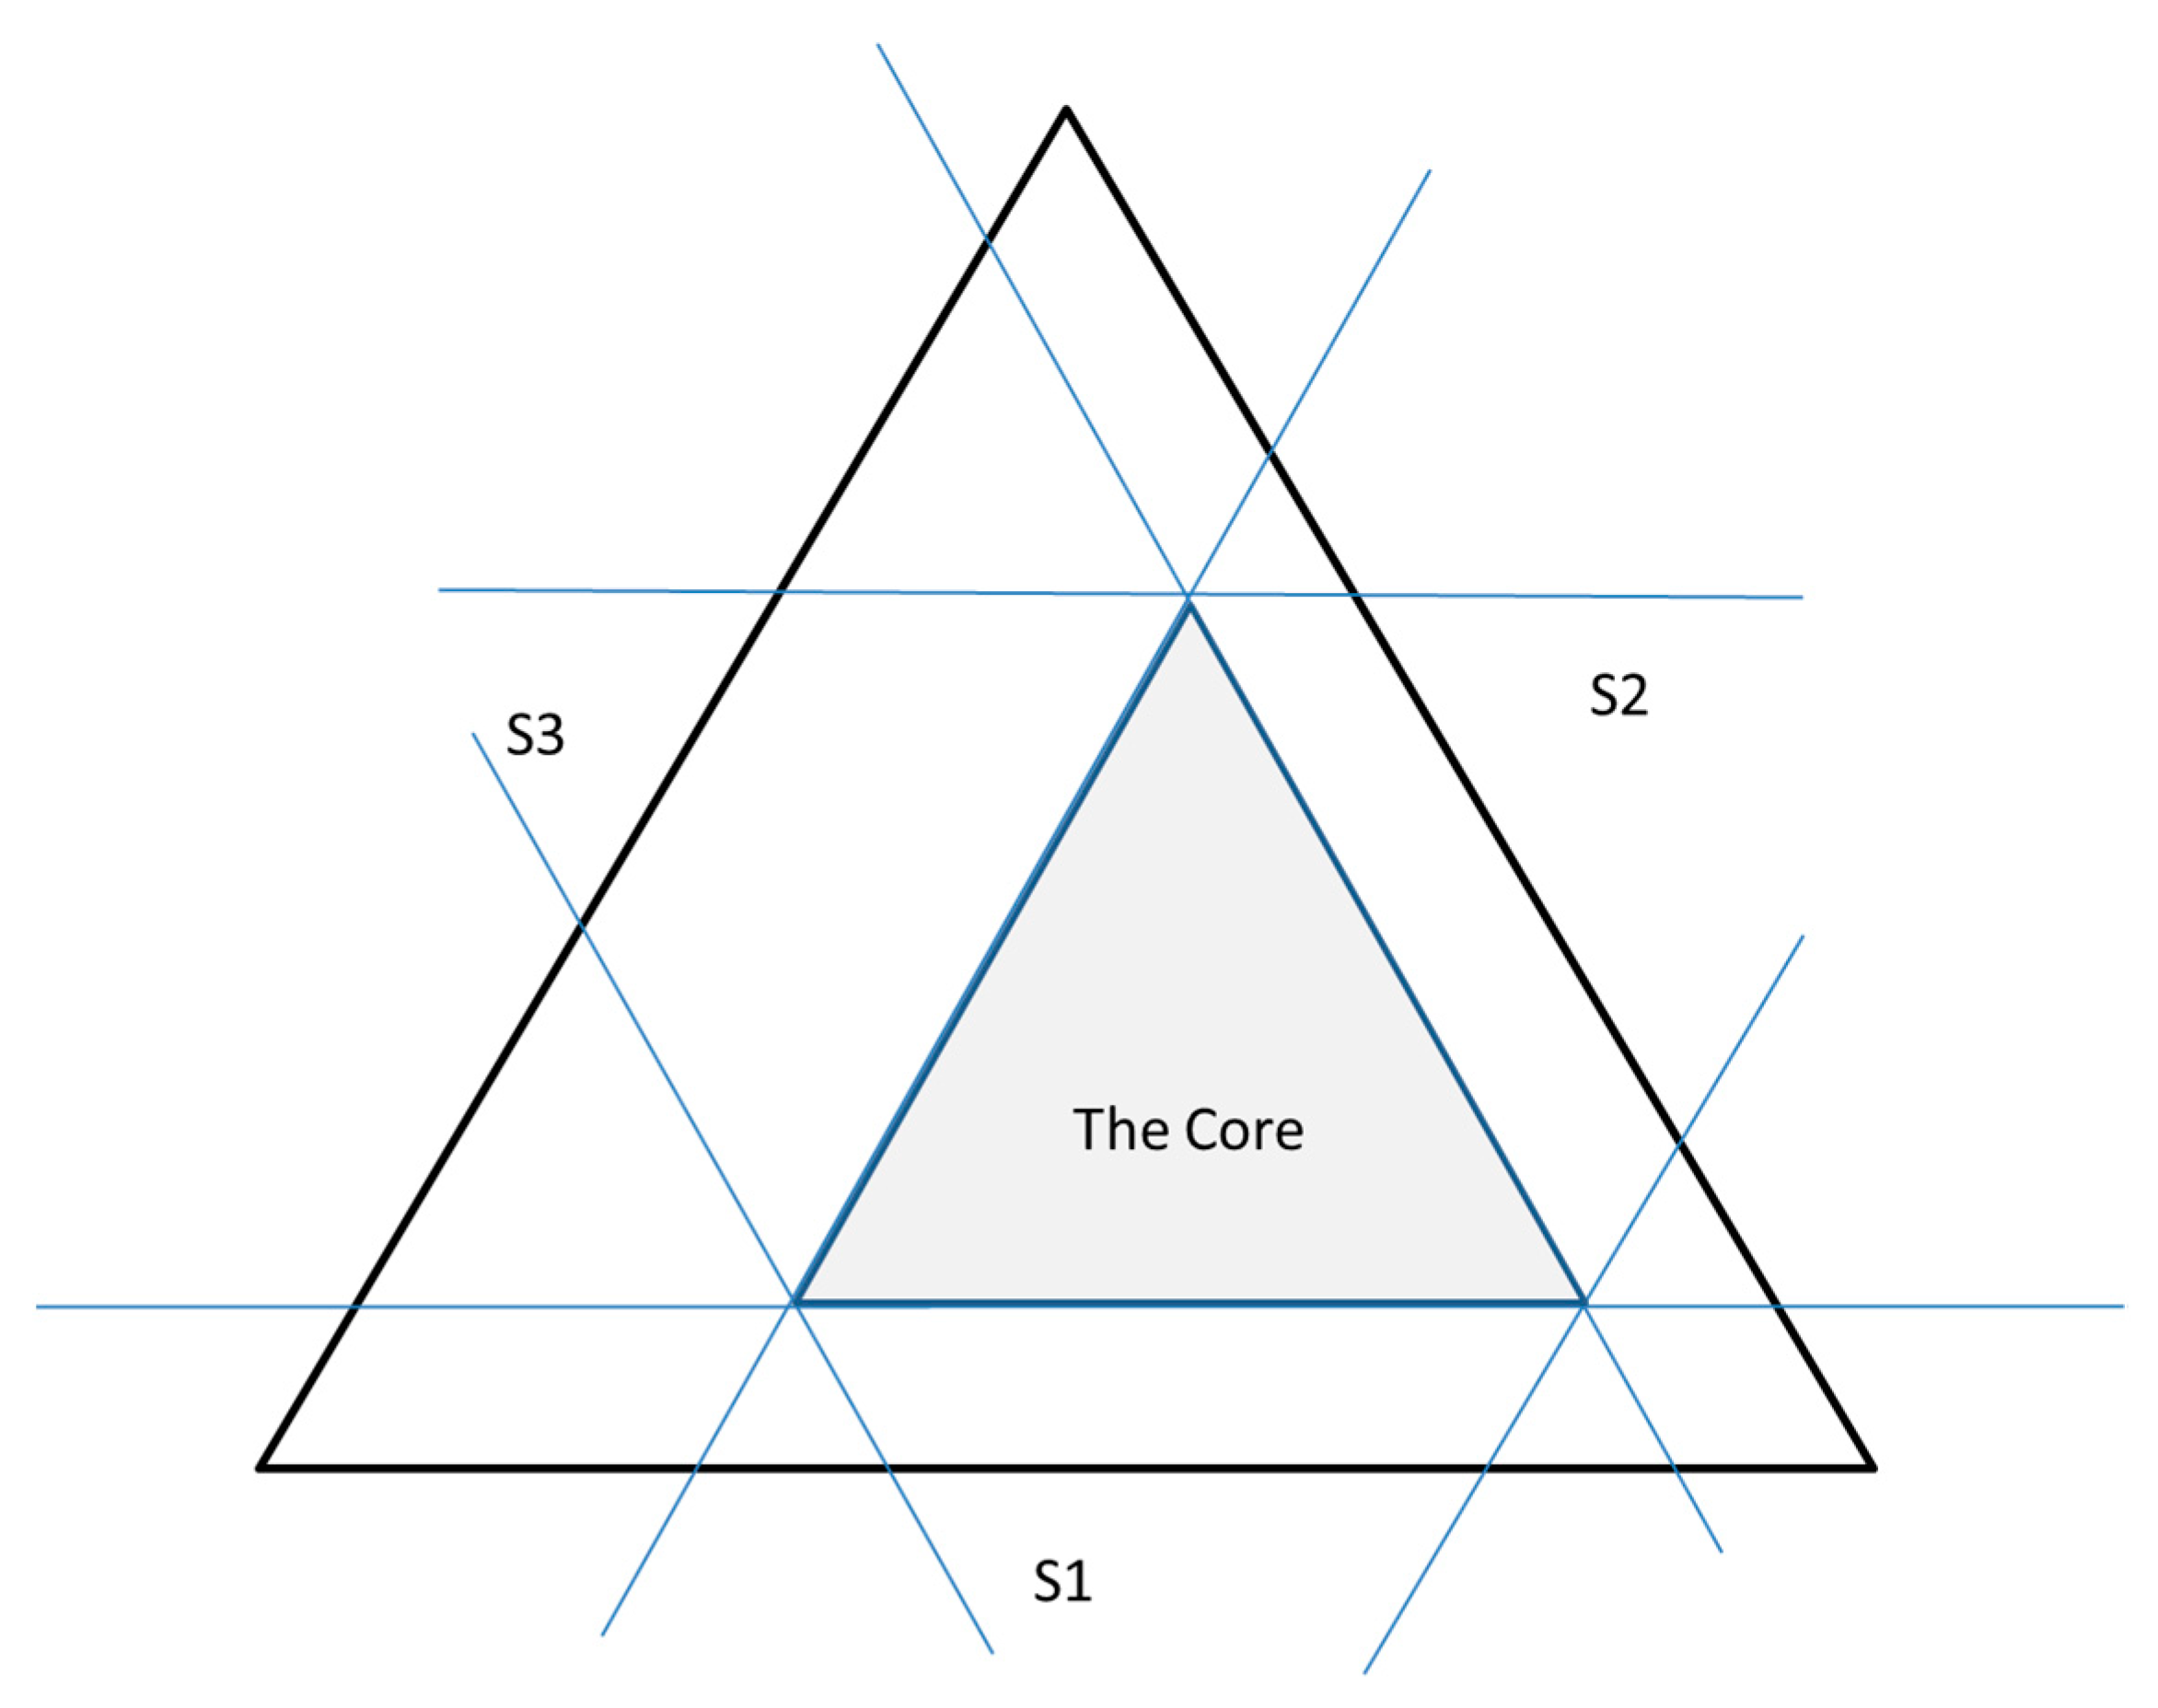
5.3. The Core as a Procedure Incorporating Incentives for a Cascade to Form

In order to determine whether a coalition will form, allowing to distribute a coalitional benefit, the so-called core is used. The core is a set-theoretic methodology to assess whether agents are willing to form a coalition considering the incentives in place due to marginal benefits first explored by Gillies (1953), as cited in Zucca (2010) [122,127]. Only distributions or allocations within the core—an n-1-dimensional space (n = number of participants)—represent a solution, giving incentive to all participants of the coalition or cascade, i.e., within the core, Equation (4) is fulfilled (Shapley and Shubik (1971)), as cited in Zucca (2010) [122,128]:
c ( S T ) + c ( S T ) c ( S ) + c ( T )   S ,    T N
The core is determined based on rationality and marginality requirements. The example in Figure 11 represents a cascade with three life cycles or participants. To fulfill the criteria of individual rationality, each player gets assigned a cost-share, which is lower or equal compared to its opportunity cost c(O) (costs it would have if not participating). For all three players, this is summed up as follows (Equation (5)–(7)):
c ( L C 1 ) c ( O L C 1 )
c ( L C 2 ) c ( O L C 2 )
c ( L C 3 ) c ( O L C 3 )
Marginality means that marginal costs a new player entering the coalition gets assigned are lower or equal compared to the marginal cost caused by the enlarged coalition. The existing coalition thus has to have at least a gain as high as the marginal costs of the new player entering the coalition in order to show interest in sustaining the new coalition. The participation thus leads to cost savings (Equation (8)–(10)):
c ( L C 1 ) c ( N ) c ( L C 2 + L C 3 )
c ( L C 2 ) c ( N ) c ( L C 1 + L C 3 )
c ( L C 3 ) c ( N ) c ( L C 1 + L C 2 )
The core spans the space of stable allocations over all coalitions. Allocation results inside the core are considered stable, i.e., no participant is able to reduce his costs without making at least one other having higher costs [122]. A graphical depiction of the core for three participants is shown in Figure 12 as a ternary diagram for a three-player game situation (players S1, S2, S3). The grey area depicts the core in which a persistent solution can be found. In line with the idea of providing an incentive for a cascade to form, a solution to an allocation problem should be within the core. The challenge, however, is to determine the optimal solution inside it. Here, Shapley’s value as a point-solution principle can be applied, which is demonstrated in a case study.

6. Holistic Evaluation Results from the Case Study of a Wood Cascade

As a case study, a wood cascade with three material use cycles was chosen (Figure 13). First, softwood is manufactured into a pallet, which is used multiple times over a longer period in order to ensure secure packaging in the trading sector. Then, particleboard is produced from the worn pallets. Finally, corrugated cardboard is produced from recycled medium-density fiberboard (MDF). Energetic use is seen as end-of-life (EOL)-procedure and not included in the sample as quality measures have to be transferred to energetic values, which increases complexity. All possible cases for single processes are covered by including an initial delivering activity, a process framed by upward and downward processes, and the last material use process.
The primary material used for the pallet production is spruce saw wood. It is assumed that the length of wood planks has to be at least 1200 mm due to the measures of standardized EUR2/3 pallets of 1200 x 800 mm [129]. In the cascade, the length of wood (particles) is a key factor, determining possible use options. Therefore, the length of wood particles is taken as a quality indicator (with a linear scale). Quality at this first level of the cascade is measured by the minimum size of wood particles required on the input side, which is 1200 mm. Prices for spruce wood range from 62 € to 86 € per solid cubic meter, with a mean of 75 € per fixed meter. Assuming a density of 470 kg/m³, the mass-based price is 0.16 €/kg [130].
Particleboard is produced from secondary material, leaving the pallet recycling process, where wood from pallets is shredded into the chipboard. Particle size here is assumed to be at least 10 mm, which constitutes the quality requirement. The market price for chipboard in January 2015 was 25 €/lose cubic meter, which, assuming a bulk density of 0.22 and a wood density of 470 kg/m³, results in a price of 0.125 €/kg [115].
Worn particleboard is downcycled into MDF. A minimum particle size of 1 mm is assumed to be required, and the price of the raw material sawdust is 0.08 €/kg [115]. The resulting values defining quality and price development over the cascade steps are listed in Table 3.
Environmental burdens within the cascade are fictitious and represented by a single value per process (Table 3). Multiple pallet use is seen as one product-lifetime.
The strong impact the choice of an allocation procedure has on the distribution of environmental burdens can be inferred from Figure 14. Results differ by a factor of up to 4 (quality-based procedures compared to disposal load for the third life cycle).
Arbitrary and cut-off procedures assign loads to all participants and thus perform (at least at first sight) well from the perspective of incentives in the case study. Goal and scope are considered by including a holistic view, and key motivations are reached by assigning a share to all involved. Quality degradation is expressed as fiber length for the procedures Q1 to Q3 and as market prices for the VCS procedure. This illustrates problems arising with the adequate quantification of downgrading. Whereas fiber length losses are more than 90 percent, the price decline is significantly less dramatic. Prices are defined by more than just inherent material properties. Possibly fluctuating market prices due to market regulation (fiscal incentives not tangible to resource use) and economies of scale (extension of production not tangible to resource use per unit) for the products from the different life cycles lead to partly inconsistent results as price development is taken as the base for allocation. Even higher prices for materials of, from a technical perspective, lower quality are possible, e.g., in the polyethylene terephthalate (PET) flake market compared to the primary PET market [131].
The core, Shapley values, and the resulting allocation values are determined for the case study. Table 4 shows the environmental burdens of all (partial) coalitions, and Table 5 the marginal environmental burdens of all (partial) coalitions, where the left column depicts the order of entering the cascade, resulting in six permutations.
The core is determined, as shown in Table 6, by applying both rationality and marginality criteria and forms an area depicted in Figure 15.
As expected (and necessary), the Shapley value-based allocation lies within the core (Figure 15), whereas most other allocation procedures do not. This means that in the case study analyzed, these allocation procedures do not incentivize participation in the cascade. Note that this result only depicts the values shown in Table 3 as allocation inputs and thus does not present a generic result for the allocation procedures. However, it is shown that there may be a discrepancy between standardized allocation procedures and incentives in place.

7. Discussion

Cascade use is a concept of sequential reuse of a given material in a downward-facing quality course. The specific criteria of distinction in contrast to open-loop recycling (OLR) are the necessity of holistic planning of the material fate over more than two different uses (and mostly also participants). This allows the application of well-known methodologies from OLR but requires a thorough evaluation of the applicability of the different methodological procedures, especially for the allocation problem. In practice, most cascade use studies target biogenic materials and tend to apply system expansion procedure or allocation based on quantifiable parameters.
A literature review on allocation in material cascades and OLR, the latter since cascades can be considered as technically similar to OLR, was conducted. The eight basic allocation procedures identified include rather arbitrary, as well as quality and market-based procedures. Since ISO 14040/44 provides no concrete guidance on allocation procedure selection if an allocation cannot be avoided, LCA practitioners may choose a procedure, which fits best to the problem at hand but which makes the process also non-transparent and may lead to incomparable results.
To assess the suitability of allocation procedures for cascades, 13 general criteria in four categories were determined. The evaluation showed that each of the eight allocation procedures showed weaknesses with respect to one or several of these criteria.
As the existence and the resource efficiency gains of a cascade depend on the interests of the participants, incentives to become or remain a participant of the cascade were more deeply analyzed. These incentives are a key criterion of which allocation procedures for cascades should meet, even more, since, from a purely economic point of view, it is often more likely to have different actors deciding to operate on their own instead of taking part in a cascade.
In order to react to such constellations, a link is made to game-theoretic approaches. These offer ways of dealing with situations where a coalition can gain more than individuals by, at the same time, dividing gains into fair shares amongst the participants in order to set the motive for collaboration. Two well-known game-theoretic concepts—Shapley value and the core—were further applied to analyze allocation in terms of incentives. The Shapley value is suitable as a direct solution procedure applicable to the allocation problems in cascades described. The core describes a solution space for allocation procedures, which represent fair and commonly accepted solutions, and thus serves as an indicator for choosing an allocation procedure, providing incentives for cascade participation to all participants. Taking a real wood cascade as an example (though with partly fictitious data), it was demonstrated that some of the allocation procedures identified in the literature review laid outside the core, which means that at least one of the participants in the example would get more environmental burden allocated to him than in case of not participating. Such negative incentives should be avoided. The core thus represents an approach for identifying suitable allocation procedures for a problem at hand and the Shapley value as a slightly more complex but fair allocation procedure.
The analysis has a few limitations, some arising from the case study nature of the example, which is difficult to generalize. In the prototype cascade, stretching from wood pallets down to secondary wood products energetic use was left aside due to the switch in physical units from material to energetic quality, which would have led to an increase in complexity. Data was partly fictitious, and the cascade consisted of three cycles only. Recycling processes and the partial reuse of resources were excluded. Both Shapley value and the core were based on environmental impact values, in this case study. This might not be the relevant decision criterion in common cascade constellations but was used here to use a uniform database for the allocation procedures. Furthermore, only qualities were taken into account, whereas in real cascades, quantities must be aligned, too.
To be applicable, Shapley value and the core require detailed knowledge of the cascade, including quality or price data, which is often difficult to get and partly time-variant, inducing further difficulties. As has been shown, sometimes, a quality criterion must be selected from several options.
To further assess the suitability of allocation procedures, a more generic analysis must be carried out. The validity of the concept must be proven. Further work in facilitating and operationalizing the methodology, as well as making it more widespread amongst practitioners, is to be targeted. Further enhancement of the methodologies for more complex cases is subject to future research.

Author Contributions

Conceptualization, M.R.; methodology, M.R.; validation, M.H.; writing—original draft preparation, M.R.; writing—review and editing, M.H.; visualization, M.R.; and supervision, M.H. All authors have read and agreed to the published version of the manuscript.

Funding

This research received no external funding.

Conflicts of Interest

The authors declare no conflict of interest.

References

  1. Suh, S.; Weidema, B.; Schmidt, J.H.; Heijungs, R. Generalized Make and Use Framework for Allocation in Life Cycle Assessment. J. Ind. Ecol. 2010, 14, 335–353. [Google Scholar] [CrossRef]
  2. Kim, S.; Hwang, T.; Lee, K.M. Allocation for Cascade Recycling System LCA Methodology Allocation for Cascade Recycling System. Int. J. Life Cycle Assess. 1997, 2, 217–222. [Google Scholar]
  3. Sirkin, T.; ten Houten, M. The cascade chain: A theory and tool for achieving resource sustainability with applications for product design. Resour. Conserv. Recycl. 1994, 10, 213–276. [Google Scholar] [CrossRef]
  4. Vis, M.; Mantau, U.; Allen, B.; Essel, R.; Reichenbach. CASCADES: Study on the Optimised Cascading Use of Wood; Institute for European Environmental Policy Publications Office: Luxembourg, 2016; ISBN 978-92-79-57725-3. [Google Scholar]
  5. Kosmol, J.; Kanthak, J. UBA Glossar zum Ressourcenschutz; Umweltbundesamt: Dessau-Roßlau, Germany, 2012. [Google Scholar]
  6. Mettke, A. Ökologische Prozessbetrachtungen—RC-Beton; TU: Cottbus, Germany, 2010. [Google Scholar]
  7. Ahmadi, L.; Young, S.B.; Fowler, M.; Fraser, R.A.; Achachlouei, M.A. A cascaded life cycle: Reuse of electric vehicle lithium-ion battery packs in energy storage systems. Int. J. Life Cycle Assess. 2017, 22, 111–124. [Google Scholar] [CrossRef]
  8. Ekvall, T.; Tillman, A.-M. Open-loop recycling: Criteria for allocation procedures. Int. J. Life Cycle Assess. 1997, 2, 155–162. [Google Scholar] [CrossRef] [Green Version]
  9. DIN EN ISO 14044—2018: Environmental Management—Life Cycle Assessment—Requirements and Guidelines; Deutsches Institut für Normung e.V. (DIN). Available online: https://www.beuth.de/de/norm/din-en-iso-14044/279938986 (accessed on 26 May 2020).
  10. Zamagni, A.; Guinée, J.; Ekvall, T.; Bersani, R. Critical Review of the Current Research Needs and Limitations Related To ISO Practice; The Italian National Agency on new Technologies, Energy and the Environment: Rome, Italy, 2008. [Google Scholar]
  11. European Commission; Joint Research Centre. ILCD Handbook: General Guide for Life Cycle Assessment: Detailed Guidance; Publications Office of the European Union: Luxembourg, 2010; ISBN 978-92-79-19092-6. [Google Scholar]
  12. Gaudreault, C. Methods for Allocation in Life Cycle Assessment and Carbon Footprint Studies of Paper Products; NCASI Nactioan Council for Air and Stream Improvement: Montreal, QC, Canada, 2012. [Google Scholar]
  13. ISO 14040—2006: Environmental Management—Life Cycle Assessment—Principles and Framework. International Standards Organization. Available online: https://www.iso.org/standard/37456.html (accessed on 26 May 2020).
  14. ISO ISO/TR 14049:2012-06 Umweltmanagement—Ökobilanz—Beispiele zur Anwendung von ISO 14044 zur Festlegung des Ziels und des Untersuchungsrahmens sowie zur Sachbilanz. International Standards Organization. Available online: https://www.beuth.de/de/technische-regel/iso-tr-14049/154234934 (accessed on 26 May 2020).
  15. Höglmeier, K.; Steubing, B.; Weber-Blaschke, G.; Richter, K. LCA-based optimization of wood utilization under special consideration of a cascading use of wood. J. Environ. Manag. 2015, 152, 158–170. [Google Scholar] [CrossRef] [PubMed]
  16. Guinée, J.B.; Heijungs, R.; Huppes, G. Economic allocation: Examples and derived decision tree. Int. J. Life Cycle Assess. 2004, 9, 23–33. [Google Scholar] [CrossRef] [Green Version]
  17. Lundie, S.; Ciroth, A.; Huppes, G. Inventory Methods in LCA: Towards Consistency and Improvement; UNEP-SETAC Life cycle Inventory (LCI) Programme: Nairobi, Kenya, 2007. [Google Scholar]
  18. Azapagic, A.; Clift, R. Allocation of environmental burdens in multiple-function systems. J. Clean. Prod. 1999, 7, 101–119. [Google Scholar] [CrossRef]
  19. Chen, C.; Habert, G.; Bouzidi, Y.; Jullien, A.; Ventura, A. LCA allocation procedure used as an incitative method for waste recycling: An application to mineral additions in concrete. Resour. Conserv. Recycl. 2010, 54, 1231–1240. [Google Scholar] [CrossRef] [Green Version]
  20. Cherubini, F.; Strømman, A.H.; Ulgiati, S. Influence of allocation methods on the environmental performance of biorefinery products—A case study. Resour. Conserv. Recycl. 2011, 55, 1070–1077. [Google Scholar] [CrossRef]
  21. Dubreuil, A.; Young, S.B.; Atherton, J.; Gloria, T.P. Metals recycling maps and allocation procedures in life cycle assessment. Int. J. Life Cycle Assess. 2010, 15, 621–634. [Google Scholar] [CrossRef]
  22. Van der Harst, E.; Potting, J.; Kroeze, C. Comparison of different methods to include recycling in LCAs of aluminium cans and disposable polystyrene cups. Waste Manag. 2016, 48, 565–583. [Google Scholar] [CrossRef]
  23. Werner, F. Recycling of Used Wood—Inclusion of End of Life Options in LCA; Eidgenössische Materialprüfungs- und Forschungsanstalt (EMPA) Report: Duebendorf, Switzerland, 2000. [Google Scholar]
  24. Ardente, F.; Cellura, M. Economic Allocation in Life Cycle Assessment: The State of the Art and Discussion of Examples. J. Ind. Ecol. 2011, 16, 387–398. [Google Scholar] [CrossRef]
  25. Brandenburg, M.; Govindan, K.; Sarkis, J.; Seuring, S. Quantitative models for sustainable supply chain management: Developments and directions. Eur. J. Oper. Res. 2014, 233, 299–312. [Google Scholar] [CrossRef]
  26. Seuring, S.; Gold, S. Conducting content-analysis based literature reviews in supply chain management. Supply Chain Manag. Int. J. 2012, 17, 544–555. [Google Scholar] [CrossRef]
  27. Nicholson, A.L.; Olivetti, E.A.; Gregory, J.R.; Field, F.R.; Kirchain, R.E. End-of-life LCA allocation methods: Open loop recycling impacts on robustness of material selection decisions. In Proceedings of the 2009 IEEE International Symposium on Sustainable Systems and Technology, ISSST ’09 in Cooperation with 2009 IEEE International Symposium on Technology and Society, Tempe, AZ, USA, 18–20 May 2009; pp. 1–6. [Google Scholar] [CrossRef]
  28. Johnson, J.X.; McMillan, C.A.; Keoleian, G.A. Evaluation of Life Cycle Assessment Recycling Allocation Methods. J. Ind. Ecol. 2013, 17, 700–711. [Google Scholar] [CrossRef]
  29. Schrijvers, D.L.; Loubet, P.; Sonnemann, G. Developing a systematic framework for consistent allocation in LCA. Int. J. Life Cycle Assess. 2016, 1–18. [Google Scholar] [CrossRef]
  30. Allacker, K.; Mathieux, F.; Pennington, D.; Pant, R. The search for an appropriate end-of-life formula for the purpose of the European Commission Environmental Footprint initiative. Int. J. Life Cycle Assess. 2017, 22, 1441–1458. [Google Scholar] [CrossRef]
  31. Rehberger, M.; Hiete, M. Allocation procedures for generic cascade use cases—An Evaluation using Monte Carlo Analysis. In Proceedings of the 69. BHT Freiberger Universitätsforum Tagungsband “Future Materials–Safe Resources Supply–Circular Economy”, Freiberg, Germany, 6–8 June 2019. [Google Scholar]
  32. Allacker, K.; Mathieux, F.; Manfredi, S.; Pelletier, N.; De Camillis, C.; Ardente, F.; Pant, R. Allocation solutions for secondary material production and end of life recovery: Proposals for product policy initiatives. Resour. Conserv. Recycl. 2014, 88, 1–12. [Google Scholar] [CrossRef]
  33. Andreola, F.; Barbieri, L.; Corradi, A.; Ferrari, A.M.; Lancellotti, I.; Neri, P. Recycling of EOL CRT glass into ceramic glaze formulations and its environmental impact by LCA approach. Int. J. Life Cycle Assess. 2007, 12, 448–454. [Google Scholar] [CrossRef]
  34. Avadí, A. Screening LCA of French organic amendments and fertilisers. Int. J. Life Cycle Assess. 2020, 25, 698–718. [Google Scholar] [CrossRef]
  35. Azapagic, A.; Clift, R. Allocation of environmental burdens in co-product systems: Product-related burdens (Part 1). Int. J. Life Cycle Assess. 1999, 4, 357–369. [Google Scholar]
  36. Bobba, S.; Mathieux, F.; Ardente, F.; Blengini, G.A.; Cusenza, M.A.; Podias, A.; Pfrang, A. Life Cycle Assessment of repurposed electric vehicle batteries: An adapted method based on modelling energy flows. J. Energy Storage 2018, 19, 213–225. [Google Scholar] [CrossRef]
  37. Boguski, T.K.; Hunt, R.G.; Franklin, W.E. General mathematical models for LCI recycling. Resour. Conserv. Recycl. 1994, 12, 147–163. [Google Scholar]
  38. Borg, M.; Paulsen, J.; Trinius, W. Proposal of a method for allocation in building-related environmental LCA based on economic parameters. Int. J. Life Cycle Assess. 2001, 6, 219. [Google Scholar]
  39. Botas, J.A.; Moreno, J.; Espada, J.J.; Serrano, D.P.; Dufour, J. Recycling of used lubricating oil: Evaluation of environmental and energy performance by LCA. Resour. Conserv. Recycl. 2017, 125, 315–323. [Google Scholar] [CrossRef]
  40. Broeren, M.L.M.; Kuling, L.; Worrell, E.; Shen, L. Environmental impact assessment of six starch plastics focusing on wastewater-derived starch and additives. Resour. Conserv. Recycl. 2017, 127, 246–255. [Google Scholar] [CrossRef]
  41. Civancik-Uslu, D.; Puig, R.; Ferrer, L.; Fullana-i-Palmer, P. Influence of end-of-life allocation, credits and other methodological issues in LCA of compounds: An in-company circular economy case study on packaging. J. Clean. Prod. 2019, 212, 925–940. [Google Scholar] [CrossRef]
  42. Cobo, S.; Dominguez-Ramos, A.; Irabien, A. From linear to circular integrated waste management systems: A review of methodological approaches. Resour. Conserv. Recycl. 2017. [Google Scholar] [CrossRef]
  43. Corrado, S.; Sala, S. Bio-Economy Contribution to Circular Economy. In Designing Sustainable Technologies, Products and Policies; Benetto, E., Gericke, K., Guiton, M., Eds.; Springer International Publishing: Cham, Switzerland, 2018; pp. 49–59. ISBN 978-3-319-66980-9. [Google Scholar]
  44. Ekvall, T. A market-based approach to allocation at open-loop recycling. Resour. Conserv. Recycl. 2000, 29, 91–109. [Google Scholar] [CrossRef]
  45. Ekvall, T.; Finnveden, G. Allocation in ISO 14041—A critical review. J. Clean. Prod. 2001, 9, 197–208. [Google Scholar] [CrossRef]
  46. Ekvall, T.; Weidema, B.P. System boundaries and input data in consequential life cycle inventory analysis. Int. J. Life Cycle Assess. 2004, 9, 161–171. [Google Scholar] [CrossRef]
  47. Escamilla-Alvarado, C.; Poggi-Varaldo, H.M.; Ponce-Noyola, M.T. Bioenergy and bioproducts from municipal organic waste as alternative to landfilling: A comparative life cycle assessment with prospective application to Mexico. Environ. Sci. Pollut. Res. 2017, 24, 25602–25617. [Google Scholar] [CrossRef] [PubMed]
  48. Fernández-Dacosta, C.; Stojcheva, V.; Ramirez, A. Closing carbon cycles: Evaluating the performance of multi-product CO 2 utilisation and storage configurations in a refinery. J. CO2 Util. 2018, 23, 128–142. [Google Scholar] [CrossRef]
  49. Ferreira, J.; Domnigos, I.; Antunes, P. Allocation of Environmental Loads in Recycling - A model based in qualitative value of recycled material. Environ. Conscious Manuf. 2001, 4193, 116–123. [Google Scholar]
  50. Finnveden, G.; Hauschild, M.Z.; Ekvall, T.; Guinée, J.; Heijungs, R.; Hellweg, S.; Koehler, A.; Pennington, D.; Suh, S. Recent developments in Life Cycle Assessment. J. Environ. Manag. 2009, 91, 1–21. [Google Scholar] [CrossRef]
  51. Forte, A.; Zucaro, A.; Faugno, S.; Basosi, R.; Fierro, A. Carbon footprint and fossil energy consumption of bio-ethanol fuel production from Arundo donax L. crops on marginal lands of Southern Italy. Energy 2018, 150, 222–235. [Google Scholar] [CrossRef]
  52. Frees, N. Crediting Aluminium Recycling in LCA by Demand or by Disposal. Int. J. Life Cycle Assess. 2008, 13, 212–218. [Google Scholar] [CrossRef]
  53. Frischknecht, R. Allocation in life cycle inventory analysis for joint production. Int. J. Life Cycle Assess. 2000, 5, 85–95. [Google Scholar] [CrossRef]
  54. Frischknecht, R. LCI modelling approaches applied on recycling of materials in view of environmental sustainability, risk perception and eco-efficiency. Int. J. Life Cycle Assess. 2010, 15, 666–671. [Google Scholar] [CrossRef] [Green Version]
  55. Garofalo, P.; D’Andrea, L.; Tomaiuolo, M.; Venezia, A.; Castrignanò, A. Environmental sustainability of agri-food supply chains in Italy: The case of the whole-peeled tomato production under life cycle assessment methodology. J. Food Eng. 2017, 200, 1–12. [Google Scholar] [CrossRef]
  56. Heijungs, R.; Frischknecht, R. A special view on the nature of the allocation problem. Int. J. Life Cycle Assess. 1998, 3, 321–332. [Google Scholar] [CrossRef]
  57. Helmdach, D.; Yaseneva, P.; Heer, P.K.; Schweidtmann, A.M.; Lapkin, A.A. A Multiobjective Optimization Including Results of Life Cycle Assessment in Developing Biorenewables-Based Processes. ChemSusChem 2017, 10, 3632–3643. [Google Scholar] [CrossRef] [PubMed]
  58. Hermansson, F.; Janssen, M.; Svanström, M. Prospective study of lignin-based and recycled carbon fibers in composites through meta-analysis of life cycle assessments. J. Clean. Prod. 2019, 223, 946–956. [Google Scholar] [CrossRef]
  59. Hohenthal, C.; Leon, J.; Dobon, A.; Kujanpää, M.; Meinl, G.; Ringman, J.; Hortal, M.; Forsström, U. The ISO 14067 approach to open-loop recycling of paper products: Making it operational. J. Clean. Prod. 2019, 224, 264–274. [Google Scholar] [CrossRef]
  60. Iacovidou, E.; Velis, C.A.; Purnell, P.; Zwirner, O.; Brown, A.; Hahladakis, J.; Millward-Hopkins, J.; Williams, P.T. Metrics for optimising the multi-dimensional value of resources recovered from waste in a circular economy: A critical review. J. Clean. Prod. 2017, 166, 910–938. [Google Scholar] [CrossRef]
  61. Ilagan, E.R.; Tan, R.R. Simultaneous allocation and data reconciliation procedure in life cycle inventory analysis using fuzzy mathematical programming. Asia Pac. J. Chem. Eng. 2011, 6, 794–800. [Google Scholar] [CrossRef]
  62. Jungmeier, G.; Werner, F.; Jarnehammar, A.; Hohenthal, C.; Richter, K. LCA Case Studies Allocation in LCA of Wood-based Products. Int. J. 2002, 7, 369–375. [Google Scholar]
  63. Kim, S.; Overcash, M. LCA Methodology Allocation Procedure in Multi-Output Process: An Illustration of ISO 14041. Int. J. Life Cycle Assess. 2000, 5, 221–228. [Google Scholar]
  64. Klöpffer, W. Allocation rule for open-loop recycling in life cycle assessment. Int. J. Life Cycle Assess. 1996, 1, 27–31. [Google Scholar] [CrossRef]
  65. Koffler, C.; Florin, J. Tackling the Downcycling Issue—A Revised Approach to Value-Corrected Substitution in Life Cycle Assessment of Aluminum (VCS 2.0). Sustainability 2013, 5, 4546–4560. [Google Scholar] [CrossRef] [Green Version]
  66. Koffler, C.; Finkbeiner, M. Are we still keeping it “real”? Proposing a revised paradigm for recycling credits in attributional life cycle assessment. Int. J. Life Cycle Assess. 2018, 23, 181–190. [Google Scholar] [CrossRef]
  67. Li, Z.; Du, H.; Xiao, Y.; Guo, J. Carbon footprints of two large hydro-projects in China: Life-cycle assessment according to ISO/TS 14067. Renew. Energy 2017, 114, 534–546. [Google Scholar] [CrossRef]
  68. Lindfors, L.G. Nordic Guidelines on Life-cycle Assessment; Nordic Council of Ministers: London, UK, 1995; ISBN 92-9120-692-X. [Google Scholar]
  69. Marinković, S.; Dragaš, J.; Ignjatović, I.; Tošić, N. Environmental assessment of green concretes for structural use. J. Clean. Prod. 2017, 154, 633–649. [Google Scholar] [CrossRef]
  70. Martin, M.; Svensson, N.; Eklund, M. Who gets the benefits? An approach for assessing the environmental performance of industrial symbiosis. J. Clean. Prod. 2015, 98, 263–271. [Google Scholar] [CrossRef] [Green Version]
  71. Marvuglia, A.; Cellura, M.; Heijungs, R. Toward a solution of allocation in life cycle inventories: The use of least-squares techniques. Int. J. Life Cycle Assess. 2010, 15, 1020–1040. [Google Scholar] [CrossRef] [Green Version]
  72. Matsuno, Y.; Daigo, I.; Adachi, Y. LCA Methodology Application of Markov Chain Model to Calculate the Average Number of Times of Use of a Material in Society. Int. J. 2007, 12, 34–39. [Google Scholar]
  73. McLaren, J.; Parkinson, S.; Jackson, T. Modelling material cascades - Frameworks for the environmental assessment of recycling systems. Resour. Conserv. Recycl. 2000, 31, 83–104. [Google Scholar] [CrossRef]
  74. Medeiros, D.L.; Tavares, A.O.; Rapôso, Á.; Kiperstok, A. Life cycle assessment in the furniture industry: The case study of an office cabinet. Int. J. Life Cycle Assess. 2017, 22, 1823–1836. [Google Scholar] [CrossRef]
  75. Mehr, J.; Vadenbo, C.; Steubing, B.; Hellweg, S. Environmentally optimal wood use in Switzerland—Investigating the relevance of material cascades. Resour. Conserv. Recycl. 2018, 131, 181–191. [Google Scholar] [CrossRef]
  76. Morão, A.; de Bie, F. Life Cycle Impact Assessment of Polylactic Acid (PLA) Produced from Sugarcane in Thailand. J. Polym. Environ. 2019, 27, 2523–2539. [Google Scholar] [CrossRef] [Green Version]
  77. Nakano, K.; Ando, K.; Takigawa, M.; Hattori, N. Life cycle assessment of wood-based boards produced in Japan and impact of formaldehyde emissions during the use stage. Int. J. Life Cycle Assess. 2018, 23, 957–969. [Google Scholar] [CrossRef]
  78. Nakatani, J. Life cycle inventory analysis of recycling: Mathematical and graphical frameworks. Sustainability 2014, 6, 6158–6169. [Google Scholar] [CrossRef] [Green Version]
  79. Oldfield, T.L.; White, E.; Holden, N.M. The implications of stakeholder perspective for LCA of wasted food and green waste. J. Clean. Prod. 2018, 170, 1554–1564. [Google Scholar] [CrossRef]
  80. Olofsson, J.; Börjesson, P. Residual biomass as resource – Life-cycle environmental impact of wastes in circular resource systems. J. Clean. Prod. 2018, 196, 997–1006. [Google Scholar] [CrossRef]
  81. Parajuli, R.; Knudsen, M.T.; Djomo, S.N.; Corona, A.; Birkved, M.; Dalgaard, T. Environmental life cycle assessment of producing willow, alfalfa and straw from spring barley as feedstocks for bioenergy or biorefinery systems. Sci. Total Environ. 2017, 586, 226–240. [Google Scholar] [CrossRef] [Green Version]
  82. Parajuli, R.; Dalgaard, T.; Birkved, M. Can farmers mitigate environmental impacts through combined production of food, fuel and feed? A consequential life cycle assessment of integrated mixed crop-livestock system with a green biorefinery. Sci. Total Environ. 2018, 619–620, 127–143. [Google Scholar] [CrossRef] [Green Version]
  83. Paras, M.K.; Pal, R. Application of Markov chain for LCA: A study on the clothes ‘reuse’ in Nordic countries. Int. J. Adv. Manuf. Technol. 2018, 94, 191–201. [Google Scholar] [CrossRef]
  84. Paraskevas, D.; Kellens, K.; Dewulf, W.; Duflou, J.R. 10. 1 Closed and Open Loop Recycling of Aluminium: A Life Cycle Assessment Perspective. In Proceedings of the 11th Global Conference on Sustainable Manufacturing - Innovative Solutions; Seilger, G., Ed.; Universitätsverlag der TU: Berlin, Germany, 2013; pp. 305–310. [Google Scholar]
  85. Pawelzik, P.; Carus, M.; Hotchkiss, J.; Narayan, R.; Selke, S.; Wellisch, M.; Weiss, M.; Wicke, B.; Patel, M.K.K. Critical aspects in the life cycle assessment (LCA) of bio-based materials—Reviewing methodologies and deriving recommendations. Resour. Conserv. Recycl. 2013, 73, 211–228. [Google Scholar] [CrossRef]
  86. Perez-Gallardo, J.R.; Azzaro-Pantel, C.; Astier, S. A Multi-objective Framework for Assessment of Recycling Strategies for Photovoltaic Modules based on Life Cycle Assessment. Waste Biomass Valorization 2018, 9, 147–159. [Google Scholar] [CrossRef]
  87. Rasmussen, F.; Birkved, M.; Birgisdóttir, H. Upcycling and Design for Disassembly—LCA of buildings employing circular design strategies. IOP Conf. Ser. Earth Environ. Sci. 2019, 225, 012040. [Google Scholar] [CrossRef]
  88. Reale, F.; Buttol, P.; Cortesi, S.; Mengarelli, M.; Masoni, P.; Scalbi, S.; Zamagni, A. Dealing with LCA modeling for the end of life of mechatronic products. Environ. Eng. Manag. J. 2015, 14, 1691–1704. [Google Scholar] [CrossRef]
  89. Rice, P.; O’Brien, D.; Shalloo, L.; Holden, N.M. Evaluation of allocation methods for calculation of carbon footprint of grass-based dairy production. J. Environ. Manag. 2017, 202, 311–319. [Google Scholar] [CrossRef] [PubMed]
  90. Richa, K.; Babbitt, C.W.; Nenadic, N.G.; Gaustad, G. Environmental trade-offs across cascading lithium-ion battery life cycles. Int. J. Life Cycle Assess. 2017, 22, 66–81. [Google Scholar] [CrossRef]
  91. Risse, M.; Weber-Blaschke, G.; Richter, K. Resource efficiency of multifunctional wood cascade chains using LCA and exergy analysis, exemplified by a case study for Germany. Resour. Conserv. Recycl. 2017, 126, 141–152. [Google Scholar] [CrossRef]
  92. Sandin, G.; Peters, G.M. Environmental impact of textile reuse and recycling—A review. J. Clean. Prod. 2018, 184, 353–365. [Google Scholar] [CrossRef]
  93. Seghetta, M.; Goglio, P. Life Cycle Assessment of Seaweed Cultivation Systems. In Biofuels from Algae; Spilling, K., Ed.; Methods in Molecular Biology; Springer: New York, NY, USA, 2018; Volume 1980, pp. 103–119. ISBN 978-1-4939-9415-1. [Google Scholar]
  94. Sfez, S.; De Meester, S.; Vlaeminck, S.E.; Dewulf, J. Improving the resource footprint evaluation of products recovered from wastewater: A discussion on appropriate allocation in the context of circular economy. Resour. Conserv. Recycl. 2019, 148, 132–144. [Google Scholar] [CrossRef]
  95. Shen, L.; Worrell, E.; Patel, M.K. Open-loop recycling: A LCA case study of PET bottle-to-fibre recycling. Resour. Conserv. Recycl. 2010, 55, 34–52. [Google Scholar] [CrossRef]
  96. Sommerhuber, P.F.; Wenker, J.L.; Rüter, S.; Krause, A. Life cycle assessment of wood-plastic composites: Analysing alternative materials and identifying an environmental sound end-of-life option. Resour. Conserv. Recycl. 2017, 117, 235–248. [Google Scholar] [CrossRef]
  97. Song, X.; Pettersen, J.B.; Pedersen, K.B.; Røberg, S. Comparative life cycle assessment of tailings management and energy scenarios for a copper ore mine: A case study in Northern Norway. J. Clean. Prod. 2017, 164, 892–904. [Google Scholar] [CrossRef] [Green Version]
  98. Suter, F.; Steubing, B.; Hellweg, S. Life Cycle Impacts and Benefits of Wood along the Value Chain: The Case of Switzerland: Life Cycle Impacts and Benefits of Wood. J. Ind. Ecol. 2017, 21, 874–886. [Google Scholar] [CrossRef] [Green Version]
  99. Timonen, K.; Sinkko, T.; Luostarinen, S.; Tampio, E.; Joensuu, K. LCA of anaerobic digestion: Emission allocation for energy and digestate. J. Clean. Prod. 2019, 235, 1567–1579. [Google Scholar] [CrossRef]
  100. Toniolo, S.; Mazzi, A.; Pieretto, C.; Scipioni, A. Allocation strategies in comparative life cycle assessment for recycling: Considerations from case studies. Resour. Conserv. Recycl. 2017, 117, 249–261. [Google Scholar] [CrossRef]
  101. Visintin, P.; Xie, T.; Bennett, B. A large-scale life-cycle assessment of recycled aggregate concrete: The influence of functional unit, emissions allocation and carbon dioxide uptake. J. Clean. Prod. 2020, 248, 119243. [Google Scholar] [CrossRef]
  102. Vladimirov, V.; Bica, I. Methodology and calculation model for recycling of composite construction products. E3s Web Conf. 2019, 85, 07016. [Google Scholar] [CrossRef]
  103. Vogtländer, J.; Brezet, H.; Hendriks, C. Allocation in Recycling Systems. Int. J. Life Cycle Assess. 2001, 6, 344–355. [Google Scholar] [CrossRef]
  104. Weidema, B. Avoiding Co-Product Allocation in Life-Cycle Assessment. J. Ind. Ecol. 2001, 4, 11–33. [Google Scholar] [CrossRef]
  105. Weidema, B. Market Information in Life Cycle Assessment; Environmental Project No. 863 2003; Danish Environmental Protection Agency: Copenhagen, Denmark, 2003. [Google Scholar]
  106. Werner, F. Recycling of used wood—Inclusion of end-of-life options in LCA. Life Cycle Assess. For. For. Prod. Achiev. COST Action E9 Work. Group 2001, 3, 1–24. [Google Scholar]
  107. Werner, F.; Althaus, H.-J.; Richter, K.; Scholz, R.W. Post-consumer waste wood in attributive product LCA. Int. J. Life Cycle Assess. 2007, 12, 160–172. [Google Scholar] [CrossRef]
  108. Williams, T.G.J.L.; Heidrich, O.; Sallis, P.J. A case study of the open-loop recycling of mixed plastic waste for use in a sports-field drainage system. Resour. Conserv. Recycl. 2010, 55, 118–128. [Google Scholar] [CrossRef]
  109. Xia, B.; Ding, T.; Xiao, J. Life cycle assessment of concrete structures with reuse and recycling strategies: A novel framework and case study. Waste Manag. 2020, 105, 268–278. [Google Scholar] [CrossRef]
  110. Yan, M.; Holden, N.M. Life cycle assessment of multi-product dairy processing using Irish butter and milk powders as an example. J. Clean. Prod. 2018, 198, 215–230. [Google Scholar] [CrossRef]
  111. Yang, J.; Gu, F.; Guo, J. Environmental feasibility of secondary use of electric vehicle lithium-ion batteries in communication base stations. Resour. Conserv. Recycl. 2020, 156, 104713. [Google Scholar] [CrossRef]
  112. Zhang, Y.; Luo, W.; Wang, J.; Wang, Y.; Xu, Y.; Xiao, J. A review of life cycle assessment of recycled aggregate concrete. Constr. Build. Mater. 2019, 209, 115–125. [Google Scholar] [CrossRef]
  113. Pauliuk, S.; Majeau-Bettez, G.; Mutel, C.L.; Steubing, B.; Stadler, K. Lifting Industrial Ecology Modeling to a New Level of Quality and Transparency: A Call for More Transparent Publications and a Collaborative Open Source Software Framework: Open Source Software for Industrial Ecology. J. Ind. Ecol. 2015, 19, 937–949. [Google Scholar] [CrossRef] [Green Version]
  114. Werner, F.; Scholz, R. Ambiguities in decision-oriented Life Cycle Inventories. Int. J. Life Cycle Assess. 2002, 6, 9. [Google Scholar] [CrossRef]
  115. Müller, Eva Ursula Price Information Website for wood materials until January 2015. Available online: https://factsandfigures.fnr.de/ (accessed on 26 May 2020).
  116. Rademacher, J. Wood Pricing Index Website of the HPE; Industry Association for Wooden Packaging, Pallets and Export Packaging: Düsseldorf, Germany, 2019. [Google Scholar]
  117. Lenz Kaminholz-Wissen Website for Wood material prices Waldbröl. 2019. Available online: http://www.kaminholz-wissen.de/ (accessed on 26 May 2020).
  118. Holler, M.; Illing, G. Einführung in die Spieltheorie; Springer: Berlin/Heidelberg, Germany, 2006. [Google Scholar]
  119. Tijs, S.H.; Driessen, T.S.H. Game Theory and Cost Allocation Problems. Manag. Sci. 1986, 32, 1015–1028. [Google Scholar] [CrossRef] [Green Version]
  120. Rogerson, W. Intertemporal Cost Allocation and Investment Decisions. J. Political Econ. 2008, 116, 931–950. [Google Scholar] [CrossRef] [Green Version]
  121. Young, H.P. Producer Incentives in Cost Allocation. Econometrica 1985, 53, 757. [Google Scholar] [CrossRef]
  122. Zucca, R. A Cooperative Game Theory Approach for Cost Allocation in Complex Water Resource Systems; Università degli Studi di Cagliari: Cagliari, Italy, 2010. [Google Scholar]
  123. Shapley, L.S. A Value for n-person Games. In Contributions to the Theory of Games, Volume II; Princeton University Press: Princeton, NJ, USA, 1953; pp. 307–317. ISBN 0-691-07935-8. [Google Scholar]
  124. Roth, A.E.; Verrecchia, R.E. The Shapley Value As Applied to Cost Allocation: A Reinterpretation. J. Account. Res. 1979, 17, 295. [Google Scholar] [CrossRef]
  125. Hiete, M.; Ludwig, J.; Schultmann, F. Intercompany Energy Integration: Adaptation of Thermal Pinch Analysis and Allocation of Savings. J. Ind. Ecol. 2012, 16, 689–698. [Google Scholar] [CrossRef]
  126. Van Campen, T.; Hamers, H.; Husslage, B.; Lindelauf, R. A new approximation method for the Shapley value applied to the WTC 9/11 terrorist attack. Soc. Netw. Anal. Min. 2018, 8. [Google Scholar] [CrossRef] [Green Version]
  127. Gillies, D.B. Some Theorems on n-Person Games. Ph.D. Thesis, Princeton University, Princeton, NJ, USA, 1953. [Google Scholar]
  128. Shapley, L.S.; Shubik, M. The assignment game I: The core. Int. J. Game Theory 1971, 1, 111–130. [Google Scholar] [CrossRef]
  129. DIN EN 13698-1:2004-01 Produktspezifikation für Paletten—Teil 1: Herstellung von 800 mm×1200 mm-Flachpaletten aus Holz. Deutsches Institut für Normung e.V. (DIN); Available online: https://www.beuth.de/de/norm/din-en-13698-1/60040228 (accessed on 26 May 2020).
  130. Wood Pricing Data for December 2016 from Forstbetriebsgemeinschaft Amberg-Schnaittenbach w.V (a German regional forestry association). Available online: https://fbg-amberg.de/. (accessed on 26 May 2020).
  131. Probst, T. Plasticker Marktbericht für Primär- und Sekundärkunststoffe—Market Report for Primary and Secondary Plastics; R. Verhoeven: Kaarst, Germany, 2018. [Google Scholar]
Figure 1. The general idea of allocation and system expansion for the co-products A and B. Abbreviation f.u. for functional unit [1].
Sustainability 12 04366 g001
Figure 2. Product system levels [8,12].
Sustainability 12 04366 g002
Figure 3. The original cascade setting (left) is simplified by eliminating intermediate primary material inputs and waste management outputs (cf. right) (PM refers to the primary material, W to waste, P to process, and U to Utilization).
Sustainability 12 04366 g003
Figure 4. Structure of the literature search and composition of the sample size.
Sustainability 12 04366 g004
Figure 5. A structured overview of common allocation procedures found in the literature.
Sustainability 12 04366 g005
Figure 6. Temporal distribution of the publications in the sample (n = 100). For 2020, publications until March were considered.
Sustainability 12 04366 g006
Figure 7. Frequency of the allocation procedure used and application type of allocation procedure.
Sustainability 12 04366 g007
Figure 8. Market prices of wood products throughout time, including wood chips for energetic use (upper graph), containing partly interpolated values [115,116,117]. The lower graph shows value-corrected substitution (VCS) allocation to the three life cycles of the cascade inputs described in the case study below. The assumed overall burden of 15 is distributed amongst the three life cycles (LC).
Sustainability 12 04366 g008
Figure 9. General criteria and evaluation of allocation procedures. Entry “+” for high performance, “o” for medium performance, and “−“ for low performance. Allocation procedures analyzed are cut-off, fifty-fifty procedure, EL for extraction Load, DL for disposal load, Q1 for quality ratio (for waste), Q2 for quality ratio (for waste and recycling), Q3 for quality left in the life cycle, and VCS for value-corrected substitution.
Sustainability 12 04366 g009
Figure 10. Possible incentives leading to a potentially disadvantageous constellation from a cascade view.
Sustainability 12 04366 g010
Figure 11. Possible paths along the cascade, which represent permutations of the entry of single participants (which represent the life cycles LC1, LC2, and LC3).
Sustainability 12 04366 g011
Figure 12. The core as a set-theoretical solution for allocation results.
Sustainability 12 04366 g012
Figure 13. Wood cascade from pallets to energy (photos: pixabay.com, CC).
Sustainability 12 04366 g013
Figure 14. Results of the case study. Bars represent the environmental burdens allocated to each life cycle according to the eight allocation procedures commonly applied. Overall impacts sum up to 15 (small deviations due to rounding).
Sustainability 12 04366 g014
Figure 15. The core (grey area) as a criterion whether allocation incentivizes the formation and continued existence of a cascade. The three life cycles (LC1, LC2, LC3) of the cascade are oriented towards the arrowed direction.
Sustainability 12 04366 g015
Table 1. Overview of allocation procedures [2,8,12,28,29,31]. Mathematical expressions were harmonized in order to align the scope to one system level.
Cut-Off E L C i = E R i 1 + E P M i + E P i + E U i + E W i                       f o r   1 < i n
E L C 1 = E P M 1 + E P 1 + E U 1 + E W 1
50:50 E L C i = E P M i + E R , i 1 0.5 + E P i + E U i + E R i 0.5 + E W i
Extraction load E L C i = E P M i + E P i + E U i + i = 1 n E W i                                               f o r   i = 1
E L C i = E P M i + E R i 1 + E P i + E U i                                                         f o r   1 < i n
Disposal load E L C i = E P i + E U i + E R i                                                                     f o r   1 i < n
E L C n = E P M 1 + i = 1 n E W i + E P n + E U n                                 f o r   i = n
Quality degradation 1st option E L C i = Q i Q i + 1 Q 1 ( E P M 1 + i = 1 n E W i ) + E P i + E U i + E R i           f o r   1 i n 1
E L C n = Q n Q 1 ( E P M 1 + i = 1 n E W i ) + E P n + E U n                   f o r   i = n
Quality degradation 2nd option E L C i = Q i Q i + 1 Q 1 ( E P M 1 + i = 1 n ( E W i + E R i ) ) + E P i + E U i     f o r   1 i n 1
E L C n = Q n Q 1 ( E P M 1 + i = 1 n ( E W i + E R i ) ) + E P n + E U n             f o r   i = n
Quality degradation 3rd option E L C i = Q i i = 1 n Q i ( E P M 1 + i = 1 n ( E W i + E R i ) ) + E P i + E U i
Value corrected substitution E L C i = M P i i = 1 n M P i ( E P M 1 + i = 1 n ( E W i + E R i ) ) + E P i + E U i
E L C i Environmental burden accredited to the i-th cascade cycle
E R , i 1 Recycling burdens from the i-1-th cascade cycle
E P M , i Environmental burden of the primary material input into the i-th cascade cycle
E P i Environmental burden of production in the i-th cascade cycle
E U i Environmental burden of product use in the i-th cascade cycle
E W i Environmental burden of waste management in the i-th cascade cycle
E R i Environmental burden accredited to recycling in the i-th cascade cycle
M P i Material price in the i-th cascade cycle
Q i Quality of the material at the beginning of the i-th cascade cycle
Q n Quality of the material at the beginning of the last cascade cycle
Table 2. Results of the literature search (CO: cut-off, AM: arbitrary method, QB: quantitative base, HM: hybrid procedure, MD: market development, SE: system expansion, OLR: open-loop recycling). Abbreviations in application cases: CHP: combined heat and power; CRT: cathode-tube ray; EIP: Eco-industrial parks; Li-ion batteries: lithium ion batteries; PET: polyethylene terephthalate; PV: photovoltaic.
PublicationAllocation TypeApplication CaseType
COAMQBHMMDSE
[7]Ahmadi et al. 2017 XLi-ion batteriesCascade
[32]Allacker et al. 2014 X GeneralOLR
[30]Allacker et al. 2017XX XGeneralCascade, OLR
[33]Andreola et al. 2007 X CRT glassOLR
[24]Ardente and Cellura 2011 X Food, Buildings, BiofuelsOLR
[34]Avadí 2020 X CompostOLR
[18]Azapagic and Clift 1999b X X GeneralMulti-output
[35]Azapagic and Clift 1999a X Boron productionMulti-output
[36]Bobba et al. 2018 XX Li-ion batteriesOLR
[37]Boguski et al. 1994 X GeneralOLR
[38]Borg et al. 2001 X Building areaOLR
[39]Botas et al. 2017 X Lubricating oilMulti-output
[40]Broeren et al. 2017X StarchMulti-output
[19]Chen et al. 2010 X ConcreteOLR
[20]Cherubini et al. 2011 XX XBiorefineryMulti-output
[41]Civancik-Uslu et al. 2019XXX PackagingOLR
[42]Cobo et al. 2017 X XGeneralOLR
[43]Corrado and Sala 2018 X XBioeconomyMulti-output
[21]Dubreuil et al. 2010 XMetalsOLR
[8]Ekvall and Tillman 1997XXXX GeneralOLR
[44]Ekvall 2000 XX Paperboard, NewspaperOLR
[45]Ekvall and Finnveden 2001XXX XGeneralMulti-output, OLR
[46]Ekvall and Weidema 2004 X X GeneralMulti-output, OLR
[47]Escamilla-Alvarado et al. 2017 X GeneralMulti-output, OLR
[48]Fernández-Dacosta et al. 2018 X XCO2Cascade
[49]Ferreira et al. 2001 XX Wood cascadeCascade
[50]Finnveden et al. 2009 X GeneralMulti-output, OLR
[51]Forte et al. 2018 X BioethanolMulti-output
[52]Frees 2008 XXAluminumOLR
[53]Frischknecht 2000 X CHPMulti-output
[54]Frischknecht 2010X XPlastics, MetalsOLR
[55]Garofalo et al. 2017X TomatoesMulti-output
[12]Gaudreault et al. 2012XXXX XGeneralOLR
[16]Guinée et al. 2004b X X Chemicals, AluminumMulti-output, OLR
[56]Heijungs and Frischknecht 1998 X Fuel productionCascade
[57]Helmdach et al. 2017 X BioeconomyMulti-output
[58]Hermansson et al. 2019 X Lignin carbon fiberMulti-output
[15]Höglmeier et al. 2015 XWoodCascade
[59]Hohenthal et al. 2019 X PaperboardCascade, OLR
[60]Iacovidou et al. 2017X X GeneralOLR
[61]Ilagan and Tan 2011 X AluminumOLR
[28]Johnson et al. 2013X X XMetalsOLR
[62]Jungmeier et al. 2002 XWoodCascade
[2]Kim et al. 1997 X GeneralCascade
[63]Kim and Overcash 2000 X AmmoniaMulti-output
[64]Klöpffer 1996 X X XGeneralOLR
[65]Koffler and Florin 2013 X AluminumOLR
[66]Koffler and Finkbeiner 2018X X XGeneralCascade
[67]Li et al. 2017 X HydropowerMulti-output
[68]Lindfors 1995XXX GeneralOLR
[69]Marinković et al. 2017 X Concrete recyclingOLR
[70]Martin et al. 2015 XX XEIPCascade
[71]Marvuglia et al. 2010 X GeneralMulti-output, OLR
[72]Matsuno et al. 2007 X SteelOLR
[73]McLaren et al. 2000 X GeneralCascade
[74]Medeiros et al. 2017X FurnitureCascade
[75]Mehr et al. 2018 WoodCascade
[76]Morão and de Bie 2019 X XBiocomopositesMulti-output
[77]Nakano et al. 2018X Wood productsCascade
[78]Nakatani 2014 X GeneralMulti-output, OLR
[27]Nicholson et al. 2009XXX GeneralOLR
[79]Oldfield et al. 2018 X XFoodCascade
[80]Olofsson and Börjesson 2018X GeneralOLR
[81]Parajuli et al. 2017 X BarleyMulti-output
[82]Parajuli et al. 2018 XCrops, livestockMulti-output
[83]Paras and Pal 2018 X ClothingOLR
[84]Paraskevas et al. 2013 X AluminumOLR
[85]Pawelzik et al. 2013 XBiomaterialsCascade
[86]Perez-Gallardo et al. 2018X XPV modulesOLR
[87]Rasmussen et al. 2019 X Building areaOLR
[88]Reale et al. 2015 X XMechatronic productsOLR
[89]Rice et al. 2017 X Dairy productsMulti-output
[90]Richa et al. 2017 X Li-ion batteriesCascade
[91]Risse et al. 2017 XWoodCascade
[92]Sandin and Peters 2018XXX XTextileOLR
[29]Schrijvers et al. 2016 XX XGeneralOLR
[93]Seghetta and Goglio 2018 X XSeaweedMulti-output
[94]Sfez et al. 2019 X Sewage sludgeCascade
[95]Shen et al. 2010X X XPET bottleOLR
[96]Sommerhuber et al. 2017 XWood-plastic compositesOLR
[97]Song et al. 2017 X OreMulti-output
[1]Suh et al. 2010 X XGeneralOLR
[98]Suter et al. 2017X WoodOLR
[99]Timonen et al. 2019 XX BioeconomyMulti-output
[100]Toniolo et al. 2017XX X Plastic productsOLR
[22]van der Harst et al. 2016bXXX XXAluminum, PolystyreneOLR
[101]Visintin et al. 2020X X XConcreteOLR
[102]Vladimirov and Bica 2019XX Construction compositesOLR
[103]Vogtländer et al. 2001 X GeneralCascade
[104]Weidema 2001 XGeneralMulti-output
[105]Weidema 2003 X GeneralMulti-output
[23]Werner 2000 X AluminumOLR
[106]Werner 2001XXX XUsed woodOLR
[107]Werner et al. 2007XXX XWoodCascade
[108]Williams et al. 2010 XPlasticsOLR
[109]Xia et al. 2020 X ConcreteOLR
[110]Yan and Holden 2018 X Dairy productsMulti-output
[111]Yang et al. 2020XX Li-ion batteriesCascade
[10]Zamagni et al. 2008XXXX XGeneralMulti-output, OLR
[112]Zhang et al. 2019X X XConcreteOLR
Table 3. Assumed environmental impacts for primary material use (EPMi), recycling (ERi), waste management (EWi), as well as quality (Qi) and price data (MPi) for pallets (i = 1), particleboard (i = 2), and MDF (i = 3). Environmental impacts for production (EPi) and use (EUi) are stated but not part of allocation procedures.
iEPMiERiEPiEUiEWiMPiQi
181.51140.180.57
251.51140.140.29
3201140.100.14
Table 4. Shapley value: possible partial coalitions and the permutations of entering. The mean value presents the final allocation factor.
π Permutationsδ Cost of the Coalitions
LC1LC2LC3
LC1,LC2,LC314.03.53.5
LC1,LC3,LC214.03.53.5
LC2,LC1,LC36.511.03.5
LC2,LC3,LC16.511.03.5
LC3,LC1,LC29.53.58.0
LC3,LC2,LC16.56.58.0
Mean9.56.55.0
Table 5. Marginal environmental burdens of all (partial) coalitions.
Input Values (Costs of coalitions)
ScenarioEnv. Burden
LC114.0
LC211.0
LC38.0
LC1+LC217.5
LC1+LC317.5
LC2+LC314.5
LC1+LC2+LC321.0
Table 6. Calculation of the core for the wood cascade based on rationality and marginality requirements. c ( O L C 1 ) ,   c ( O L C 2 ) ,   c ( O L C 3 ) result from the values for not forming a coalition at all, as depicted in Table 4 and Table 5.
RationalityMarginality
c(LC1)≤14 c(LC1) ≥ c(N)-c(LC2+LC3)=6.5
c(LC2)≤11c(LC2) ≥ c(N)-c(LC1+LC3)=3.5
c(LC3)≤8c(LC3) ≥ c(N)-c(LC2+LC1)=3.5

