Abstract
The location and context in which people live influences and conditions their opportunities in life. This becomes relevant in a world subject to rapid urban and demographic growth, in which different economic, social, and political forces generate and accentuate disparities in cities. The foregoing generates an unequal distribution of the different social groups in the territory known as socio-spatial segregation. The study of this phenomenon incorporates a large number of variables belonging to different dimensions. Nonetheless, few studies have addressed socio-spatial segregation with a multivariate analysis approach. In addition, the existing studies may have obtained misleading outcomes by not acknowledging the inherent compositional nature of their variables. The objective of the present study is twofold: (i) To assess whether the phenomenon of socio-spatial segregation in Guadalajara, Mexico exists; and (ii) to introduce and stress the use of compositional techniques for the study of socio-spatial segregation. The study applied principal component analysis and cluster analysis considering the compositional nature of census variables, particularly from economic and educative indicators. In addition, the study used geographical information tools to depict and interpret the results. The results are intended to serve in the fulfillment of the Sustainable Development Goals towards inclusive and sustainable cities.
1. Introduction
In September 2015, the member states of the United Nations approved 17 objectives and 169 goals for the sustainable development and committed to reach them for 2030. These objectives, also known as the Sustainable Development Goals (SDGs) seek equality among people, to protect the planet and to ensure prosperity through several actions under the motto of “leaving no one behind” [1]. In this sense and recognizing the SDGs as interdependent, the present study focuses on objectives 10 and 11 (reduced inequalities and sustainable cities and communities, respectively). In a very broad sense, these objectives seek to mitigate and to eradicate problems, such as poverty, inequality, and social exclusion. These problems are usually visible in the urban space, and the way in which the different social strata are grouped in the territory (depending on their capacity to acquire housing) influences their accentuation or eradication [2].
In this context, the existence of differentiation or unequal distribution of certain social groups within the urban space is known as urban segregation [3]. The term segregation emerged from urban sociology, and studying it can be traced back to the first half of the 20th century, by the Chicago School of Sociology [4]. From its origins, the social division of space was strictly linked to the concepts of income and ethnicity. However, when talking about segregation nowadays, it is necessary to broaden the spectrum of elements that generate segregation and to treat it as a dynamic process caused by different factors that have different intensities, which work together to accelerate or sustain the phenomena of segregation [5,6,7,8].
Although the study of segregation began around 1920, the first measurement is attributed to Jahn and colleagues in 1947 with the index of dissimilarity [9]. In their work, the authors highlighted the applicability of his index, which can be applied to any population or class. However, according to Cowgill and Cowgill [10], this index had two major flaws: First, it is difficult to calculate; and second, it has a lack of precision in measuring differences in concentration and dispersion.
The interest of different authors for this phenomenon, coupled with technological advances, led to the appearance of a large number of indexes. For this reason, Massey and Denton [6] emphasized the existing state of theoretical-methodological disorder and a low level of consensus in the use of indicators by the researchers of that time. In their study, the twenty most-relevant existing segregation indexes in the literature were selected and classified into five dimensions: (i) uniformity, (ii) exposure, (iii) concentration, (iv) centralization, and (v) clustering. For the uniformity dimension, Massey and Denton [6] proposed the dissimilarity index of Duncan and Duncan [11], which measures the degree to which the groups are distributed differently in the urban space. For the exposure dimension, Lieberson’s index [12] was selected to represent the degree to which the members of different groups share common areas. The index of relative concentration was proposed to measure the degree of agglomeration of a group in the urban space within the dimension of concentration. For the concentration dimension, the absolute centralization index was chosen to evaluate the degree to which groups are located in city centers. Finally, for clustering, the spatial proximity index was selected to measure the proximity between groups in the urban space.
These five dimensions address the lack of an element of spatiality in the measurement of segregation, which had represented the greatest criticism for the previous indexes [13,14,15,16]. Likewise, the proposed indexes in their different dimensions simplified the measurement of segregation by considering an average value, applied to race and religion, as a total indicator of segregation of a territory without having to show the various nuances that may exist within it [14].
The ambiguity of the concept of segregation [5,11,13], together with the incompatibility in the census information (temporality, statistical geographical areas and indicators), has made it impossible to evaluate and compare cities and population groups in the different national contexts [17,18].
Over time, different methods for measuring segregation have been proposed. These methods have evolved based on the disaggregation of census information, statistics, the dimensions of study and the available technologies for the treatment of data [13,19]. Nonetheless, few studies have addressed it from a multivariate statistical analysis approach [20]. Except the studies carried out by Lloyd and colleagues [21], who incorporated the log-ratio approach into the analysis of multivariate compositional data for the population characteristics of Northern Ireland, the few existing studies with a multivariate statistical analysis either ignored or did not know the compositional nature of their data; examples for this are found in the studies by CONAPO [22], Romero and Hernández [13], Schteingart [20], Jiménez and Donat [23], and Porcel-López [2], among others.
Different authors have highlighted problems when applying standard statistical methods to compositional data. A spurious correlation is the problem that has gained the most attention. Research on this topic can be traced back to work developed by Pearson [24]. To overcome the consequences of working with compositional data and to validate the statistical analysis, Aitchison [25] proposed transformations based on log-ratios. The log-ratio approach considers the compositional character of data, and standard statistical tools can then be applied to the obtained log-ratios.
Applications of compositional data analysis can be found in different areas. The first studies considering the log-ratio approach analyzed the mineral composition of soils, rocks and sediments. These studies yielded a reasonable interpretation (e.g., References [26,27,28]). Lloyd and co-workers [21] identified problems in the analysis of population studies using standard statistical methods and encouraged the use of log-ratio approach to overcome the different shortcomings of compositional data in population studies. Currently, examples of the application of compositional data methods can be found in a variety of fields, such as in the study of ecosystem services [29], microbiomes [30], tourism [31,32], and business and finance [33], among others.
Therefore, the objective of this study is twofold: (i) To assess whether socio-spatial segregation exists in the city of Guadalajara, Mexico; and (ii) to introduce and stress the use of compositional techniques for the study of socio-spatial segregation. Specifically, this approach has been applied, considering the socio-economic and socio-educative dimensions. Through these two dimensions, we aim to characterize the colonias of the city, which would help implement anti-segregation measures in the most vulnerable areas for compliance with the SDGs. In addition, the present study represents a quantitative contribution to the study of Guadalajara addressing issues that have been little addressed in the city from a quantitative approach.
2. Materials and Methods
2.1. Case Study: Guadalajara, Mexico
Guadalajara is the capital of the state of Jalisco. The city has the largest number of inhabitants in the state and is the second city with the largest number of inhabitants in Mexico, with a population of 1.4 million of which the 52% are women, 48% are men and 64% of its inhabitants range from 15 to 59 years old. Moreover, 25% of the population lives in multidimensional poverty [34]. It covers a surface of 13,421 hectares, giving an average density of 104 inhabitants per hectare [35]. Most of its soil is for urban use, land tenure is mostly private property, and the city is totally urbanized. Industry and commerce stand out as the main economic activities of the city [36].
Urban policies, characterized by the hegemony of certain economic and political forces, have made Guadalajara a place where the interests of class, and the logistics of wealth and accumulation, have interfered with rational urban planning. As mentioned by Marcuse and Van Kempen [37,38], cities are not naturally divided; rather, division of a city is the product of an intentional and active act by those who have the power to do it. For Guadalajara, the division of space dates back to its foundation in 1542. The Spanish Crown, through its urban ordinances and know-how, established a defined geometric scheme within the urban fabric and established a clear social hierarchy in the city [39].
Among the criteria of the Spanish Crown, cities should be located in the proximity of a river in order to guarantee access to water [40]. The city of Guadalajara settled on one side of the San Juan de Dios River, a natural border that internally divided the city [41]. The local bourgeoisie, the rich and renowned people, would concentrate on the west side of the river (except for the 200 indigenous allies who were responsible for the defense of the city). In contrast, the indigenous population (with no nobility titles) was located east of the river, installing a clear division of the urban space (Figure 1A,B): A Spanish city versus the city of the indigenous [40].
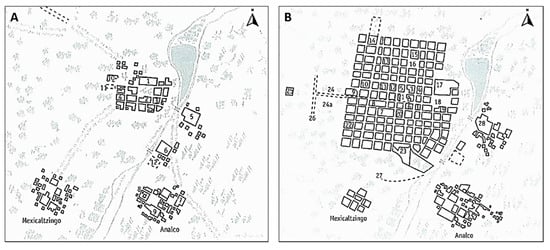
Figure 1.
The city of Guadalajara in two periods of time. Excerpts. (A) Guadalajara in the 16th century. (B) Guadalajara in 1732. Excerpts of the original maps. INAH Mexico. In La cuadrícula. Edited by the authors.
Even though the San Juan de Dios River was forced underground in 1896, and the Independencia Causeway was built over it, the planned urban growth continued on the west side of the river, as exemplified by the so-called colonias in the period 1894–1924. The product of foreign capital and inhabited by foreigners and wealthy families from its beginning, colonias were homogeneous subdivisions that responded to commercial interests, which sought to the increase of the value of the land and that accentuated the east-west and poor-rich dichotomy of the city [39,40,42,43,44,45,46,47,48].
In addition, structural adjustment policies were deepened in the country from 1980 onwards through constitutional reforms in Articles 27 and 115, as well as institutional reforms in housing agencies. The foregoing granted to municipal governments more authority in the management and administration of their territories, including urban planning. Moreover, through these reforms, communal lands were incorporated into the market under the logic of accumulation and wealth. With regard to the national housing agencies, the state stopped providing housing to the popular sectors, and the role was adopted by the private sector. This has created an even more significant social division and differentiation of the urban space in Mexican cities [44,49,50].
Accordingly, the city government has adopted the SDGs to its most recent development plans 2016–2018 and 2018–2021 in order to mitigate and reverse the existing social division. According to the city government, the Guadalajara 500/2042 Vision Municipal Development and Governance Plan will guide the transformation of the city through six main axes: A prosperous and inclusive city; in the community; quality in public services; orderly and sustainable; well managed; and safe and peaceful [34,51].
2.2. Compositional Data Analysis
The census information obtained for the realization of the present study has been converted to percentages. This represents the main feature of many quantitative analyses conducted in population, urban and geography studies [52]. The set of values normally used in such studies are parts of some whole and are commonly (although not necessary) expressed in a closed form, such as 100 (i.e., percentage) or 1 (i.e., proportion). Hence, the compositional character of these data should be taken into account.
Compositional data describe parts of a whole. They are commonly presented as vectors of proportions, percentages, concentrations or frequencies [53]. Compositional data are inherently multivariate. Anomalies may appear if compositional data are treated using standard statistical techniques, the most stagnant of which is the appearance of spurious correlations. As several multivariate analysis techniques are based on the variance-covariance structure of data, this may lead to wrong conclusions.
The initial discussion about this and other consequences of using compositional data can be found in Chayes [54], Aitchison [55,56], Rock [57], and Rollinson [58]. The standard statistical techniques for unrestricted random values cannot be used to analyze compositional data in their natural or raw form, including univariate and multivariate statistical analyses [21,53,59,60].
2.3. Log-Ratio Approach
To overcome the consequences of working with compositional data, and to validate statistical analyses, the log-ratio approach proposed by Aitchison [25] is applied. This approach allows us to work with log-ratios of compositions as real random variables, such that the multivariate classic statistics tools can be applied. Moreover, the analysis is based on the relative information between the components rather than their absolute values [55]. An introduction to some key principles for compositional data have been presented by Pawlowsky-Glahn and Egozcue [26], Egozcue [61], and Filzmoser, Hron and Templ [62].
The indicators used in this study are simple, two-part compositions, which are grouped and analyzed in different dimensions (i.e., socio-economic and socio-educative) (see Equation (1)). Data are transformed with the log-ratio approach. Hence, the value of the indicator and its complementary are analyzed jointly, as given in Equation (2).
where:
X = compositional vector of two parts
x1,x2 = parts of the compositional vector
= closure. The vector has been rescaled such that the components add up to 1. (A representative of the class of equivalence has been selected).
S2 = Simplex of two parts. Sample space for compositions, a subset of .
Special care should be taken for the values used in the numerator and the denominator of Equation (2). The above has a direct influence on the interpretation of the results obtained. Therefore, in this study, the aspects of the compositions that were considered as positive were placed in the numerator, and as negative, in the denominator (e.g., log-ratio of the educated population was divided by the uneducated population). Commonly, compositional vectors have more than two parts. Transformations such as the isometric log ratio (ilr) (also known as orthonormal log-ratio, olr), or the centered log-ratio (clr), also based on the log-ratio approach are more suitable in that case [53,62,63,64]. Moreover, components with zero values must be treated before the log-ratio approach, since zeros are not allowed in the method [65].
2.4. Principal Component Analysis
Principal Component Analysis (PCA) provides information about how observations differ from each another by finding a low-dimensional description of the data variability while reducing the complexity of the raw data. High dimensionality in the analysis of multivariate data could generate multicollinearity problems, which could lead to erroneous analysis. PCA identifies a set of independent and uncorrelated variables called principal components. PCA has as many components as the number of variables; however, a subset of the variables captures most of the original variability [66]. PCA is widely used to identify observations (e.g., subgroups of populations) that share common characteristics. Aitchison [67] presented an approach to PCA for compositional data. PCA is based on either the variance-covariance matrix or the correlation matrix [66]. PCA analysis using the variance-covariance matrix is more sensitive to the values on which it is based; therefore, PCA performed in this study is based on the correlation matrix (standardized variables).
2.5. Hierarchical Cluster Analysis
Cluster analysis groups and classifies observations with similar characteristics, as well as reveals characteristics of observations that are relatively different from other sets of observations. This study uses a hierarchical cluster analysis, which builds a nested hierarchy of clusters. O’Sullivan and Unwin [68] present the procedure in which the observations merge into clusters until only one cluster, which contains all the observations, is left (bottom-up agglomerative clustering). The importance of the method lies in the distances used to form the clusters (e.g., minimum distance, maximum distance or average between observations). The present study considers Ward’s hierarchical clustering method. Ward’s method is the only agglomerative clustering method that is based on the sum of squares criterion, minimizing the dispersion within the group in each binary amalgamation [69].
As next step, Geographic Information Systems (GIS) are used to visualize the distribution and the social division of space, based on the cluster analysis results, each colonia belong to a cluster and is mapped for a better analysis.
The study has used R [70] and Rstudio [71] in the multivariate descriptive statistical analyses performed.
2.6. Data Sets
The present study includes the analysis of census information of approximately 13,520 urban blocks, which are grouped into 395 colonias of the city (used as compositional vectors), which in turn are grouped into seven large urban districts (Centro, Cruz del Sur, Huentitán, Minerva, Oblatos, Olímpica and Tetlán), see Figure 2. Therefore, this study involves the use of different sources of information, as described.
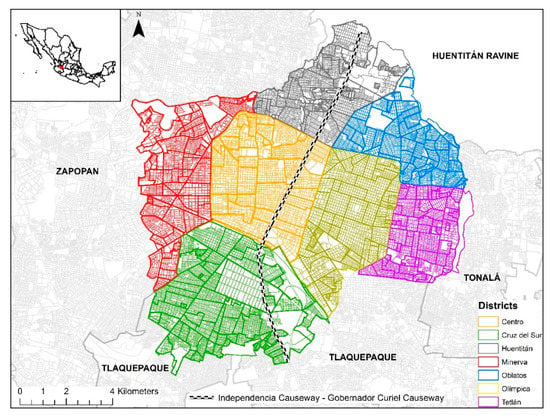
Figure 2.
Territorial boundaries. Guadalajara, Jalisco, Mexico.
The vector information corresponding to the GIS in its shapefile format was obtained from two sources. The vector information of the 13,520 urban blocks and the territorial limits of the city of Guadalajara was obtained from the National Institute of Statistics and Geography (INEGI) and was used as a cartographic base [72]. In this digitalized blueprint of the city, the INEGI assigs a unique code to each urban block. The territorial delimitation of the 395 colonias and the seven urban districts was obtained from GeoGDL [73].
Census information in Mexico is gathered every ten years. Thus, the most recent census information at the urban block level corresponds to the year 2010. Information corresponding to the indicators used in this study is obtained from the 2010 Population and Housing Census [74]. In this information, unique identification codes are presented for the different urban blocks. With ArcMap 10.2.2 data are matched and linked to the cartographic base from INEGI, which facilitates processing data at different urban scales (such as colonias and districts).
As the national census did not include the income variable in the census of 2010, indicators of material goods and services were used as a substitute for income received to approximate the economic dimension and to determine the spatial structure of the population in the city (Table 1).

Table 1.
Variables are measuring the socio-economic dimension.
Inequality is one of the great challenges in the 2030 agenda of the Sustainable Development Goals. In order to diminish existing gaps (and taking into account the economic system in which we live), individual skills based on technology, mathematics and science will be required [75]. In this sense, formal education provides individuals with a set of skills to enter the professional world and to grow in their personal and social development [76]. Therefore, indicators of school attendance, or completion of formal education, by age groups have been selected in the dimension of education (Table 2).

Table 2.
Variables are measuring the socio-educative dimension.
Finally, Figure 3 shows the flowchart with the different steps performed in this study.
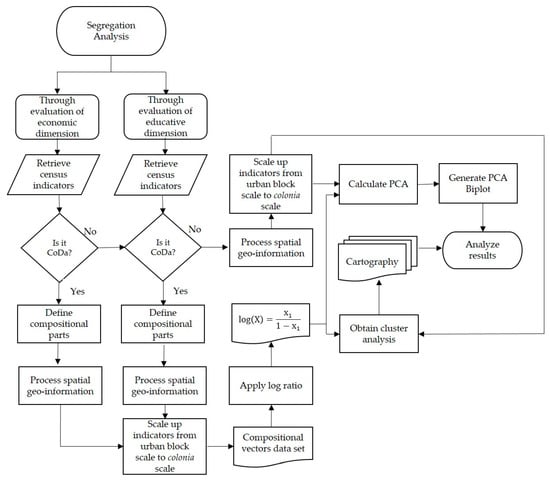
Figure 3.
Methodology flowchart.
3. Results
3.1. A Divided City
The principal component method has been applied to the socio-economic and socio-educative variables of the study, and is represented by the log-ratios of the considered indicators. Therefore, the compositional character of each bivariate composition is considered in a joint multivariate treatment.
As part of the results from the standard PCA conducted for the socio-economic variables, it can be seen that PC1 and PC2 explain 59.1% and 32.7% of the variation of data, respectively. Together, PC1 and PC2 capture 91.84% of the variability (Table 3). More importantly, PC1 and PC2 give a reasonable description of the variation in the data through their correlation with the variables (Table 3). From the correlation table, PC1 has a large negative correlation with Rel_Phone, and Rel_Auto, indicating that this first component primarily measures the financial capacity to acquire goods that are not considered as basic necessities (such as automobile and telephone). On the other hand, PC2 has a large positive correlation with Rel_TV, Rel_Fridge and Rel_Washer, indicating that this component primarily measures the financial capacity to acquire material goods considered as basic (Such as refrigerator, television and washing machine).

Table 3.
Principal components matrix: socio-economic dimension.
Rather than examining the numbers, the principal component Biplot is more helpful for understanding the transformed observations and the original variables (Figure 4). In the Biplot, angles between the variable arrows give an idea of the correlation between the variables. The smaller the angle, the greater the correlation (e.g., Rel_Auto and Rel_PC are highly correlated, while Rel_Fridge and Rel_Internet are not correlated). Likewise, the PCA Biplot gives a rough indication of how big or small the value of the variable for each observation is. (Note that, to better understand the behavior of the observations, colonias are color coded by urban district.)
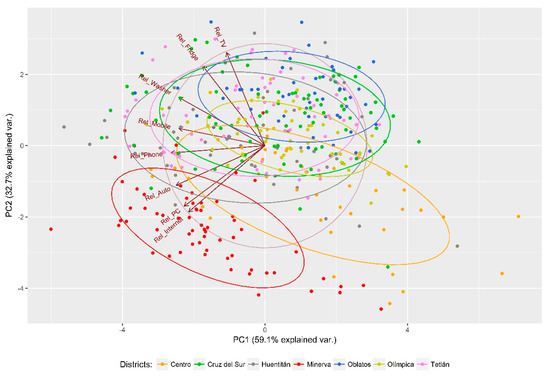
Figure 4.
Principal component Biplot, explaining 91.83% of the variability of observations by colonias and urban districts.
The Biplot reveals that the colonias belonging to the Minerva district are characterized by having a similar behavior between themselves but opposite from the rest. Specifically, the households with the most significant proportion of cars, internet and computers are found in the Minerva district (red) and its colonias. On the other hand, the colonias belonging to the Oblatos district (blue) have the lowest percentage of households with cars, computers and internet access. Moreover, these three indicators have the strongest relationship with each other.
Although the rest of the colonias are little appreciated, this first approach allows us to observe a clear differentiation between the Minerva and Oblatos districts, highlighting the west-east dichotomy in the city regarding the economic dimension.
The standard PCA results with regard to the socio-educative variables can be seen in Table 4. The two first components have variances of 59.1% and 25.3%, respectively, together explaining 84.4% of the variation. The variables with the largest positive correlations with the first component are Rel18HigherEducation, Rel15MaxElementarySchool and Rel15MaxMiddleSchool (Table 4); therefore, PC1 primarily measures the population with a higher educational level. Moreover, PC2 has a large positive correlation with Rel12To14 and Rel6To11, revealing that this component measures the basic years of education in the population. On the other hand, PC3 has a strong negative correlation with Rel3To5, indicating that this component primarily measures the absence of education in the first years of the population.

Table 4.
Principal components matrix: socio-educative dimension.
To better understand standard PCA, the principal component Biplot for this dimension was carried out (Figure 5). It is evident that the angle between the variable arrows Rel18HigherEducation and Rel15MaxMiddleSchool is small, meaning that there is a high correlation between these two variables. The same can be said with respect to Rel15MaxElementarySchool and Rel15MaxMiddleSchool In order to illustrate the behavior of the observations (for colonias), these have been color coded by urban district. Colonias belonging to the Minerva district (red) have the highest level of persons with a formal education, as compared to the six other districts (Figure 5). On the other hand, colonias belonging to the Oblatos district (blue) have the highest level of persons lacking a structured education. As in the economic dimension, the west–east dichotomy is evident, especially in the polarization of the Minerva–Oblatos districts.
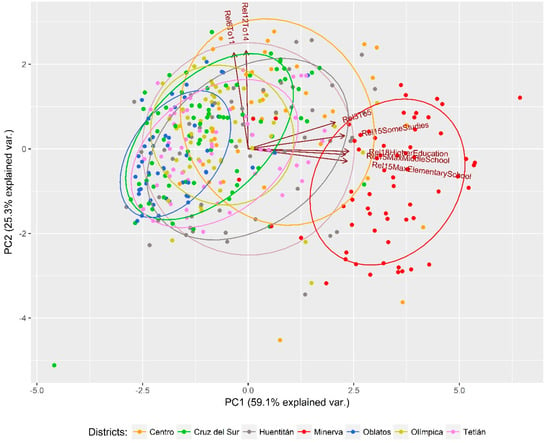
Figure 5.
Principal component Biplot explaining 84.4% of the variability of observations in the colonias and urban districts.
3.2. West-East, Different Urban Fragments from the Same City
As explained in Section 2.5, the selected clustering method is based on Ward’s method. Through the dendrogram obtained from the bottom-up agglomerative clustering, we decided to classify the colonias into four clusters (Figure 6). To examine differences in the territory, clusters are color coded.
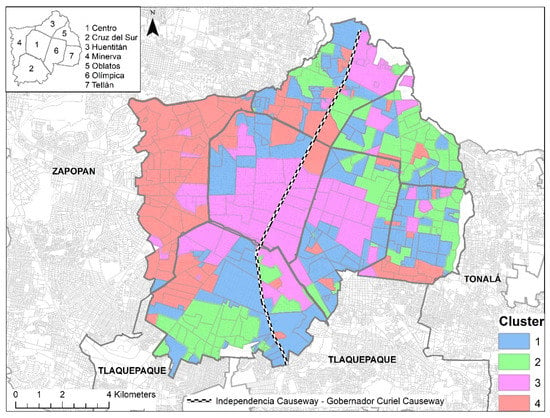
Figure 6.
Colonias of Guadalajara by cluster. Socio-economic dimension.
In the socio-economic dimension, the colonias belonging to cluster four (red) are mostly grouped in the Minerva district. Using the Independencia Causeway (dashed line) as a reference, the classification of colonias in cluster four is predominant (Figure 6). Moreover, colonias to the east of the Independencia Causeway are mostly in clusters one (blue), two (green) and three (purple).
As evident from the cluster characterization (Figure 7), and based on the variables selected to measure the economic dimension, colonias in clusters two and three are the most disadvantaged. These clusters are characterized by dwellings that mostly lack material goods (e.g., television, refrigerator, washing machine, car, computer, telephone, cell phone and internet); of these, cluster two lacks most non-essential goods, especially computer and internet access. Concerning cluster one, its proportion of dwellings with some material goods is almost similar to the ones lacking these goods. Finally, cluster four stands out from the rest. The relation of households that own a car is by far the highest. Likewise, this cluster has the highest relation of households that own different goods, with the exception of dwellings with television and refrigerator.
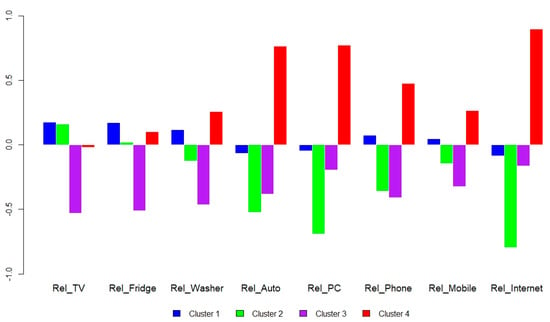
Figure 7.
Cluster characterization. Socio-economic dimension.
Figure 8 shows the results from the hierarchical cluster analysis conducted with respect to the educative variables. As a result of Ward’s method and the dendogram, the colonias are classified in four clusters. Most of the colonias belonging to the Minerva district are classified in cluster four (red). Moreover, to the west of the Independencia Causeway (dashed line), colonias in cluster one (blue) and two (green) are not as predominant as to the east of the Independencia Causeway.
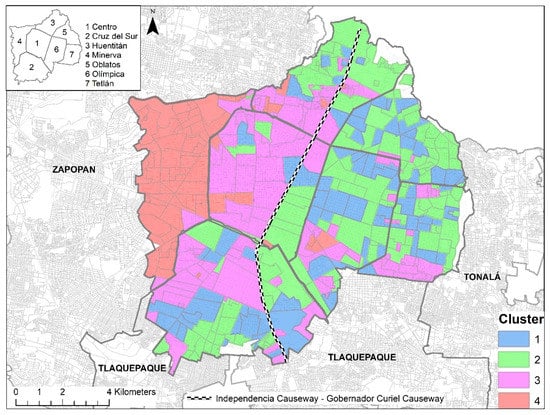
Figure 8.
Colonias of Guadalajara by cluster. Socio-educative dimension.
The cluster characterization shows that the colonias in cluster four stand out for having a highly educated population (e.g., Rel18HigherEducation), mainly in the population over the age of fifteen with secondary studies terminated (e.g., Rel15MaxMiddleSchool) (Figure 9). On the other hand, the colonias in clusters one and two are characterized for having a significant lack of formal education.
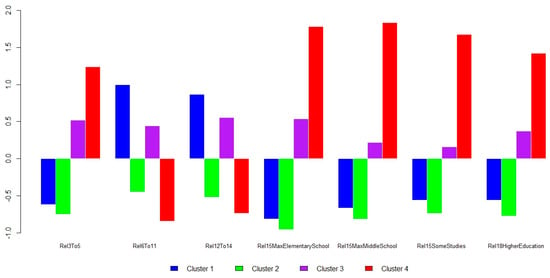
Figure 9.
Cluster characterization. Socio-educative dimension.
In regard to this dimension, and according to the results, the colonias in cluster two present the greatest lack of formal education in all the age groups analyzed. Even more importantly, and considering poverty is an intergenerational phenomenon, this cluster is the most vulnerable of all.
4. Discussion
4.1. Segregation and Urban Challenges
The analysis of the existence of socio-economic segregation in the city of Guadalajara has been carried out considering variables belonging to the socio-economic and the socio-educative dimensions. The results obtained show the existence of internal differentiation in the social structure of the city.
According to the analysis, the colonias belonging to the Minerva district have a higher education level and a major purchasing power compared to the rest of the city. On the other hand, the colonias that belong to the Oblatos district are those with the highest degree of vulnerability, reflected by a lower purchase power and the lowest educational levels.
The results come as consequences of the foundational processes of the city (Spanish city versus the city of the indigenous), which also have been accentuated to the present day by a multitude of different economic, social and political forces. This highlights the still existing dichotomy between west and east of the city. Moreover, the results obtained in the study are consistent with other studies in different periods of time where, through different approaches, also highlighted the west-east differences [39,40,41,42,43,45,46,47,48].
The results obtained in this study show the challenges that the city government will have to face, especially regarding the east of the city, in order to meet the SDGs by 2030, particularly Objectives 10 (reduced inequalities) and 11 (sustainable cities and communities).
Among the challenges, there are low schooling levels in the economically active population that limit the competitiveness and productivity of the municipality to attract investment with high added value. Nearly 80% of schools (741 schools) are over 30 years old (technically, they have served their useful life) and are unused. Moreover, approximately 44.2% of high school students drop out of school during the first year for two main reasons: The need for income and the lack of motivation [34]. Furthermore, the rise in urban land cost, the increase in construction materials and the real state sector has influenced the capacity to acquire housing.
Additionally, in 2018, according to the Federal Mortgage Society Price Index, the metropolitan area of Guadalajara presented the largest increase in the price of housing in the country, with 11% [34]. The lack of income and the increase in housing costs make it impossible for a sector of the population to have access to it. Due to the increase in housing costs, in the period 1990 to 2015, the city has lost about 11.5% of its population [34,35]. To mitigate this loss, the government aims to repopulate the city by increasing population density (vertically) in central areas and in the vicinity of public transport corridors. The 2018–2021 municipal urban development plan, states that the city repopulation will be achieved through an inclusive and sustainable approach. Likewise, it is contemplated that one of every five houses produced in the city would be affordable housing [34,77]. However, very little information regarding the specific policies to achieve these objectives is available in the development plans.
Furthermore, fear, the presence of criminal organizations, insecurity and the low quality of public infrastructure have an impact on social cohesion and can influence the transmission of information regarding employment opportunities [76,78]. In the Guadalajara metropolitan area, the crime rate is approximately 37.9 crimes per 100,000 inhabitants. However, only 4.9% of crimes are reported, and 81.2% of the population feels unsafe [79]. Likewise, 50% of the parks and gardens are in poor condition, and 37% of municipal sports units have a significant level of deterioration [34]. Consequently, there is an impact on the opportunities of people to fully develop and access to better jobs and income—which makes them be in a state of vulnerability.
4.2. Lessons and Methodological Implications
The results obtained in this study with the log-ratio approach in compositional data are congruent with those of the urban marginalization index [22]. However, it should be reminded that the application of standard methods may cause spurious correlations and wrong conclusions. Even though the application of standard methods to compositional data yielded interpretable and apparently reasonable results, the application of standard methods in compositional data are, at best, inappropriate [26]. As explained by Aitchison [25], Pawlowsky-Glahn and Egozcue [26], Filzmoser, Hron, and Reimann [60], Marcillo-Delgado, Ortego and Pérez-Foguet [80], Cruz-Sandoval, Ortego and Roca [29], the use of standard statistical methods in compositional data originate problems, such as prediction of values outside the sample space, spurious correlations and sub-compositional incoherence, among others.
Accordingly, ignoring the compositional nature of the data of any urban context might drive to the implementation of mitigation measures and urban policies in places where they are not completely necessary, and their impact might be less effective. This becomes relevant if we take into account the low tax collection of the city (a current common phenomenon in the Latin American context). Therefore, the low budget allocated to anti-segregation interventions and programs (41% of the budget in the city is assigned to security, and the rest is allocated in different areas). Thus, the present method (through the statistical analyses) accurately identifies the vulnerable areas in any urban context with the purpose of implementing anti-segregation actions towards more sustainable and inclusive cities, such as the provision and recovery of public spaces, the integral rehabilitation of disadvantaged neighborhoods, residential diversification, social innovation, anti-speculation taxes, land use controls, provision of infrastructure, social rented dwellings and social housing, among others [2,37,81,82,83].
4.3. Limitations and Future Research
The scale and the lack of detailed variables in the population census poses a challenge in this type of studies. In the former, the principles of confidentiality, zeros and missing values are higher, as the scale of the analysis is reduced, while the latter can be observed as a consideration of two-part compositions in this study. If the variables of the economic dimension in this study (with the existing information available) were considered as a composition of eight parts, many households would have been considered more than once in the same ratio—thereby, the results would have been skewed. In other words, the available census information from Mexico has only allowed for two-part compositions to be considered in this study. More parts could only be considered in the compositions as long as the population census disaggregates the variables in more detail. Consequently, other transformations must be taken into account (clr, ilr/olr).
Additionally, it would be interesting for future research to know whether public expenditure by the city government has a direct influence on differences in the social structure and to know whether there is an association between the expenditure and socio-economic strata. It would also be relevant to know if the government has caused gentrification processes through these urban interventions.
Finally, this study is intended to serve as a tool for decision-makers in identifying areas that need interventions towards the SDGs fulfillment, as well as in the proper management of compositional data.
5. Conclusions
A descriptive, multivariate statistical analysis of different indicators based in socio-economic and socio-educative dimensions was performed. Results from PCA and cluster analyses based on a log-ratio approach with two-part compositions showed a first picture of the existing socio-economic and socio-educative segregation pattern in the city of Guadalajara. This study supports the existence of patterns of segregation that have existed and have transcended the colonial period in the city of Guadalajara. The latter might mean that the old natural barrier of the San Juan de Dios River that separated the Spanish city from the city of indigenous persons, and which is now physically present by the Independencia Causeway, has become an “imaginary” barrier that continues to divide the rich and the poor.
Such a division is clearly seen in the polarization between the Minerva district and the rest of the districts. Moreover, recognizing segregation as a complex and multidimensional phenomenon, different indicators and dimensions should be incorporated into the study, considering the compositional nature and the log-ratio transformation of the data.
Author Contributions
Conceptualization, M.C.-S.; E.R. and M.I.O. methodology, M.I.O. formal analysis, M.C.-S.; E.R. and M.I.O. investigation, M.C.-S. data curation, M.C.-S. writing—original draft preparation, M.C.-S. writing—review and editing, M.C.-S.; E.R. and M.I.O. supervision, E.R. and M.I.O. All authors have read and agreed to the published version of the manuscript.
Funding
This work was developed in the framework of a grant received by the Mexican government through a CONACYT fellowship (Reference 612800) and partially supported by grants RTI2018-095518-B-C22 and PCI2019-103674 (MCIU/AEI/FEDER) of the Spanish Ministry of Science, Innovation and Universities, and the European Regional Development Fund.
Conflicts of Interest
The authors declare no conflict of interest.
References
- United Nations Development Programme Sustainable Development Goals. Available online: https://www.undp.org/content/undp/en/home/sustainable-development-goals.html (accessed on 5 June 2019).
- Porcel-López, S. Desigualdad social y segregación residencial, una relación compleja, 1st ed.; Cáritas, E., Ed.; Fundación Foessa; Fomento de estudios sociales y de sociología aplicada.: Madrid, España, 2020; ISBN 978-84-8440-823-9. [Google Scholar]
- Brun, J. Essai critique sur la notion de ségrégation et sur son usage en géographie urbaine. In La Ségrégation dans la Ville; Brun, J., Rhein, C., Eds.; L´Harmattan: Paris, France, 1994; pp. 21–57. [Google Scholar]
- Dawkins, C.J.; Reibel, M.; Wong, D.W. Introduction-Further Innovations in Segregation and Neighborhood Change Research. Urban Geogr. 2008, 28, 513–515. [Google Scholar] [CrossRef]
- Donat, C. La segregación urbana: Marco Teórico Conceptual y Estado de la Cuestión. In Barrios y Crisis. Crisis Económica, segregación urbana e innovación social en Cataluña; Blanco, I., Nel lo, O., Eds.; Tirant Humanidades: Valencia, Spain, 2018; pp. 27–50. ISBN 9788417203313. [Google Scholar]
- Massey, D.S.; Denton, N.A. The Dimensions of Residential Segregation. Soc. Forces 1988, 67, 281–315. [Google Scholar] [CrossRef]
- Peach, C. The Meaning of Segregation. Plan. Pract. Res. 1996, 11, 137–150. [Google Scholar] [CrossRef]
- Subirats, J.; Riba, C.; Giménez, L.; Obradors, A.; Giménez, M.; Querals, D.; Bottos, P.; Rapaport, A. Pobreza y exclusión social. Un análisis de la realidad española y europea. Fund. “La Caixa” 2004, 16, 1–190. [Google Scholar]
- Jahn, J.; Schmid, C.F.; Schragt, C. The Measurement of Ecological Segregation Author. Am. Sociol. Rev. 1947, 12, 293–303. [Google Scholar] [CrossRef]
- Cowgill, D.O.; Cowgill, M.S. Notes on Research and Teaching. Am. Sociol. Rev. 1951, 16, 825–831. [Google Scholar] [CrossRef]
- Duncan, O.D.; Duncan, B. A Methodological Analysis of Segregation Indexes. Am. Sociol. Rev. 1955, 20, 210–217. [Google Scholar] [CrossRef]
- Lieberson, S. An Asymmetrical Approach to Segregation. In Ethnic segregation in Cities; Peach, C., Robinson, V., Smith, S., Eds.; Croom Helm: London, UK, 1981; pp. 61–82. [Google Scholar]
- Romero, P.; Hernández, J. Propuesta de metodología para analizar el nivel de segregación residencial en la Zona Metropolitana de México. In Segregación Urbana y Espacios de Exclusión Ejemplos de México y América, Latina; Ejemplos de México y América, Latina; Aguilar, A.G., Escamilla, H.I., Eds.; Universidad Nacional Autónoma de México.Miguel Ángel Porrúa: México City, México, 2015; pp. 223–239. ISBN 978-607-401-963-6. [Google Scholar]
- Johnston, R.; Poulsen, M.; Forrest, J. Segregation matters, measurement matters. In Social-Spatial Segregation. Concepts, Processes and Outcomes; Lloyd, C.D., Shuttleworth, I.G., Wong, D.W.S., Eds.; Bristol University Press: Bristol, UK, 2015; pp. 13–44. ISBN 978-1447301349. [Google Scholar]
- Wong, D.W.S. Using general spatial pattern statistic to evaluate spatial segregation. In Social-Spatial Segregation. Concepts, Processes and Outcomes; Lloyd, C.D., Shuttleworth, I.G., Wong, D.W.S., Eds.; Bristol University Press: Bristol, UK, 2015; pp. 45–64. ISBN 978-1447301349. [Google Scholar]
- Lloyd, C.D.; Catney, G.; Shuttleworth, I.G. Measuring neighbourhood segregation using spatial interaction data. In Social-Spatial Segregation. Concepts, Processes and Outcomes; Lloyd, C.D., Shuttleworth, I.G., Wong, D.W.S., Eds.; Bristol University Press: Bristol, UK, 2015; pp. 65–90. ISBN 978-1447301349. [Google Scholar]
- Kertzer, D.I.; Arel, D. Census and identity: The politics of race, ethnicity, and language in national censuses; Kertzer, D.I., Hogan, D., Eds.; Cambridge University Press: Cambridge, UK, 2001; ISBN 9780521004275. [Google Scholar]
- Mateos, P. The international comparability of ethnicity and collective identity: Implications for segregation studies. In Social-Spatial Segregation. Concepts, Processes and Outcomes; Lloyd, C.D., Shuttleworth, I.G., Wong, D.W.S., Eds.; Bristol University Press: Bristol, UK, 2015; pp. 163–196. ISBN 978-1447301349. [Google Scholar]
- Lloyd, C.D.; Shuttleworth, I.G.; Wong, D.W.S. Social-Spatial Segregation. Concepts, Processes and outcomes; Bristol University Press: Bristol, UK, 2015; ISBN 978-1447301349. [Google Scholar]
- Schteingart, M. La división social del espacio en ciudades mexicanas: Un balance explicativo desde una perspectiva latinoamericana. In Segregación Urbana y Espacios de Exclusión Ejemplos de México y América, Latina; Aguilar, A.G., Escamilla, H.I., Eds.; Universidad Nacional Autónoma de México.Miguel Ángel Porrúa: Méxco City, Méxco, 2015; pp. 47–72. ISBN 6074019630. [Google Scholar]
- Lloyd, C.D.; Pawlowsky-Glahn, V.; Egozcue, J.J. Compositional Data Analysis in Population Studies. Ann. Assoc. Am. Geogr. 2012, 102, 1251–1266. [Google Scholar] [CrossRef]
- National Population Council. Marginalization Index. Available online: http://www.conapo.gob.mx/es/CONAPO/Indices_de_Marginacion_Publicaciones (accessed on 17 December 2019).
- Jiménez, E.; Donat, C. El Estudio de la segregación urbana: Estrategia metdológica. In Barrios y Crisis Crisis Económica, Segregación Urbana e Innovación Social en Cataluña; Blanco, I., Nel lo, O., Eds.; Tirant Humanidades: Valencia, Spain, 2018; ISBN 9788417203313. [Google Scholar]
- Pearson, K. Mathematical Contributions to the Theory of Evolution.--On a Form of Spurious Correlation Which May Arise When Indices Are Used in the Measurement of Organs. Proc. R. Soc. Lond. 1896, 60, 489–498. [Google Scholar]
- Aitchison, J. The Statistical Analysis of Compositional Data. Monographs on Satistics and Applied Probability, 1st ed.; Chapman & Hall Ltd., Ed.; Springer: London, UK, 1986; ISBN 978-0412280603. [Google Scholar]
- Pawlowsky-Glahn, V.; Egozcue, J.J. Compositional data and their analysis: An introduction. In Compositional Data Anlaysis in the Geosciences. From Theory to Practice; Buccianti, A., Mateu-Figueras, G., Pawlowsky-Glahn, V., Eds.; The Geological Society: London, UK, 2006; pp. 1–10. ISBN 1-86239-205-6. [Google Scholar]
- Kovács, L.Ó; Kovács, G.P.; Martín-Fernández, J.A.; Barceló-Vidal, C. Major-oxide compositional discrimination in Cenozoic volcanites of Hungary. In Compositional Data Analysis in the Geosciences: From Theory to Practice; Buccianti, A., Mateu-figueras, G., Pawlowsky-Glahn, V., Eds.; Geological Society: Bath, UK, 2006; pp. 11–23. ISBN 1-86239-205-6. [Google Scholar]
- Thomas, C.W.; Aitchison, J. Log-ratios and geochemical discrimination of Scottish Dalradian limestones: A case study. In Compositional Data Analysis in the Geosciences: From Theory to Practice; Buccianti, A., Mateu-figueras, G., Pawlowsky-Glahn, V., Eds.; Geological Society: Bath, UK, 2006; pp. 25–41. ISBN 1-86239-205-6. [Google Scholar]
- Cruz-Sandoval, M.; Ortego, M.I.; Roca, E. Tree ecosystem services, for everyone? A compositional analysis approach to assess the distribution of urban trees as an indicator of environmental justice. Sustainability 2020, 12, 1215. [Google Scholar] [CrossRef]
- Gloor, G.B.; Macklaim, J.M.; Pawlowsky-glahn, V.; Egozcue, J.J. Microbiome Datasets Are Compositional: And This Is Not Optional. Front. Microbiol. 2017, 8, 1–6. [Google Scholar] [CrossRef] [PubMed]
- Ferrer-Rosell, B.; Coenders, G.; Martínez-Garcia, E. Segmentation by Tourist Expenditure Composition: An Approach with Compositional Data Analysis and Latent Classes. Tour. Anal. 2016, 21, 589–602. [Google Scholar] [CrossRef]
- Coenders, G.; Ferrer-Rosell, B. Compositional Data Analysis in Tourism: Review and Future Directions. Tour. Anal. 2020, 25, 153–168. [Google Scholar] [CrossRef]
- Creixans-Tenas, J.; Coenders, G.; Arimany-Serrat, N. Corporate social responsibility and financial profile of Spanish private hospitals. Heliyon 2019, 5, e02623. [Google Scholar] [CrossRef]
- Government of Guadalajara. Plan Municipal de Desarrollo y Gobernanza 2018-2021; Government of Guadalajara: Guadalajara, Jalisco, 2018.
- IMEPLAN. Area metropolitana de Guadalajara, Expansión urbana, Análisis y Prospectiva: 1970-2045, 1st ed.; Orozco, A., Shalisko, V., Rodríguez, M., Hernández, D., Morfín, J., Chávez, R., Eds.; Editoriales e Industrias Creativas de México SA de CV: Guadalajara, Jalisco, México, 2015. [Google Scholar]
- Government of Jalisco Creative Digital City. Available online: http://www.ccdguadalajara.com/ (accessed on 2 January 2019).
- Van Kempen, R. The Academic Formulations: Explanations for the Partitioned City. In Of States and Cities; The Partitioning of Urban, Space; Marcuse, P., Van Kempen, R., Eds.; Oxford University Press: New York, NY, USA, 2002; pp. 35–56. ISBN 9780198297192. [Google Scholar]
- Marcuse, P. The Partitioned City in History. In Of States and Cities. The Partitioning of Urban Space; Marcuse, P., Van Kempen, R., Eds.; Oxford University Press: Oxford, UK; New York, NY, USA, 2002; pp. 11–34. ISBN 9780198297192. [Google Scholar]
- López, E. La cuadrícula en el desarrollo de la ciudad hispanoamericana. Guadalajara, México; Universidad de Guadalajara, Instituto Tecnológico y de Estudios Superiores de Occidente: Guadalajara, Jalisco, México, 2001; ISBN 970270104X. [Google Scholar]
- Vázquez, D. Guadalajara: Ensayos de interpretación. Guadalajara; El Colegio de Jalisco: Guadalajara, Jalisco, México, 1989; ISBN 9686142053. [Google Scholar]
- Aceves, J.E.; de la Torre, R.; Safa, P. Fragmentos urbanos de una misma ciudad: Guadalajara. Espiral 2004, XI, 277–320. [Google Scholar] [CrossRef]
- Brandis-García, D.; Mas-Hernández, R. Propiedad inmueble, morfología urbana y precios del suelo en Guadalajara (siglo XIX). Tiempos de América 1997, 1, 57–69. [Google Scholar]
- Rivera, E. Transformación socio-espacial y dinámicas del uso del suelo en Guadalajara, México: Análisis la producción del espacio urbano-metropolitano y sus posibles escenarios. In Proceedings of the International Conference Virtual City and Territory - 08o Congreso Internacional Ciudad y Territorio Virtual; Río de Janeiro, Brasil, 11–12 October 2012; pp. 1–19. [Google Scholar]
- Rivera, E. Introspecciones sobre el proceso, producción, construcción y reconstrucción de nuevos espacios de identificación urbana, a través de la memoria, vivencias y experiencias de sus habitantes. El caso del Barrio de San Juan de Dios en la ciudad de Guadalajara. In Proceedings of the 9° Congresso “Città e Territorio Virtuale: Citta’ Memoria Gente” Mario Cerasoli, Roma, Italia, 2–4 October 2013; pp. 1133–1142. [Google Scholar]
- Alvizo Carranza, C. La colonia obrera y la segregación urbana en Guadalajara. Rev. Hist. 2.0, Conoc. histórico en clave Digit. 2013, III, 9–26. [Google Scholar]
- Doñán, J.J. Oblatos-Colonias Andanzas Tapatías; Arlequín: Guadalajara, Mexico, 2013; ISBN 9786079046705. [Google Scholar]
- Cabrales, L.F.; Canosa, E. Segregación residencial y fragmentación urbana: Los fraccionamientos cerrados en Guadalajara. Espiral 2001, VII, 223–253. [Google Scholar] [CrossRef]
- Cabrales Barajas, L.; Chong Muñoz, M. Divide y venderás: Promoción inmobiliaria del barrio de Artesanos de Guadalajara 1898-1908. Available online: http://www.ub.edu/geocrit/sn/sn-218-82.htm (accessed on 27 January 2020).
- Marrufo, R.M.; Bass, S. Segregación socioespacial y servicios de salud en Ciudad Juáres. In Segregación Urbana y Espacios de Exclusión Ejemplos de México y América, Latina; Aguilar, A.G., Escamilla, H.I., Eds.; Universidad Nacional Autónoma de México. Miguel Ángel Porrúa: Mexico City, Mexico, 2015; pp. 139–162. ISBN 978-607-401-963-6. [Google Scholar]
- Moreno, O. Insustentabilidad de la vida, segregación social y pobreza urbana: Efectos de las políticas de vivienda en la era del ultraliberalismo. In Segregación Urbana y Espacios de Exclusión Ejemplos de México y América, Latina; Aguilar, A.G., Escamilla, H.I., Eds.; Universidad Nacional Autónoma de México.Miguel Ángel Porrúa: Mexico city, Mexico, 2015; pp. 307–328. ISBN 978-607-401-963-6. [Google Scholar]
- Government of Guadalajara. Plan Municipal de Desarrollo Guadalajara 2015-2018, 500 Visión 2042; Government of Guadalajara: Guadalajara, Jalisco, México, 2016; II.
- Evans, I.S.; Jones, K. Ratios and closed number systems. In Quantitative geography. A British View; Wrigley, N., Bennett, R.J., Eds.; Routledge & Kegan Paul: London, UK; New York, NY, USA, 1981; pp. 123–134. ISBN 978-0710007315. [Google Scholar]
- Pawlowsky-Glahn, V.; Egozcue, J.J.; Tolosana-Delgado, R. Modeling and Analysis of Compositional Data, 1st ed.; John Wiley & Sons: London, UK, 2015; ISBN 9783540773405. [Google Scholar]
- Chayes, F. Ratio Correlation A Manual for Students of Petrology and Geochemistry; University of Chicago Press: Chicago, IL, USA, 1971; ISBN 0226102203. [Google Scholar]
- Aitchison, J. The Statistical Analysis of Compositional Data. J. R. Stat. Soc. 1982, 44, 139–177. [Google Scholar] [CrossRef]
- Aitchison, J. The Statistical Analysis of Geochemical Compositions. Math. Geol. 1984, 16, 15–18. [Google Scholar] [CrossRef]
- Rock, N.M.S. Lecture Notes in Earth Sciences; Bhattacharji, S., Friedmand, G.M., Neugebauer, H.J., Seilacher, A., Eds.; Springer-Verlag New York Inc.: Nedlands, Western Australia, 1988. [Google Scholar]
- Rollinson, H.R. Another look at the constant sum problem in geochemistry. Mineral. Mag. 1992, 56, 469–475. [Google Scholar] [CrossRef]
- Wrigley, N. The Use of Percentages in Geographical Research. Area 1973, 5, 183–186. [Google Scholar]
- Filzmoser, P.; Hron, K.; Reimann, C. Univariate statistical analysis of environmental (compositional) data: Problems and possibilities. Sci. Total Environ. 2009, 407, 6100–6108. [Google Scholar] [CrossRef] [PubMed]
- Egozcue, J.J. Reply to “On the Harker Variation Diagrams;...” by J.A. Cortés. Math. Geosci. 2009, 41, 829–834. [Google Scholar] [CrossRef]
- Filzmoser, P.; Hron, K.; Templ, M. Applied Compositional Data Analysis, 1st ed.; Diggle, P., Gather, U., Scott, Z., Eds.; Springer Series in Statistics: Cham, Switzerland, 2018; ISBN 978-3-319-96420-1. [Google Scholar]
- Egozcue, J.J.; Pawlowsky-Glahn, V.; Mateu-Figueras, G.; Barceló-Vidal, C. Isometric Logratio Transformations for Compositional Data Analysis. Math. Geol. 2003, 35, 279–300. [Google Scholar] [CrossRef]
- Egozcue, J.J.; Pawlowsky-Glahn, V. Groups of Parts and Their Balances in Compositional Data Analysis. Math. Geol. 2005, 37, 795–828. [Google Scholar] [CrossRef]
- Martín-Fernández, J.A.; Palarea-Albaladejo, J.; Olea, R.A. Dealing with Zeros. In Compositional Data Anlaysis: Theory and Applications; Pawlowsky-Glahn, V., Buccianti, A., Eds.; Wiley: Hoboken, NJ, USA, 2011; pp. 43–58. [Google Scholar]
- O’Sullivan, D.; Unwin, D. Reducing the number of variables: Principal Component Analysis. In Geographic Information Analysis; John Wiley & Sons: Hoboken, NJ, USA, 2002; pp. 343–355. ISBN 0471211761. [Google Scholar]
- Aitchison, J. Principal component analysis of compositional data. Biometrika 1983, 70, 57–65. [Google Scholar] [CrossRef]
- O’Sullivan, D.; Unwin, D. Cluster Analysis: Identifying groups of similar obervations. In Geographic Information Analysis; John Wiley & Sons. Inc: Hoboken, NJ, USA, 2002; p. 436. ISBN 0471211761. [Google Scholar]
- Murtagh, F.; Legendre, P. Ward’s Hierarchical Agglomerative Clustering Method: Which Algorithms Implement Ward’s Criterion? J. Classif. 2014, 31, 274–295. [Google Scholar] [CrossRef]
- R Core Team. A Language and Environment for Statistical Computing. R Foundation for Statistical Computing; R Foundation for Statistical Computing: Vienna, Austria, 2014. [Google Scholar]
- RStudio Team. RStudio: Integrated Development Environment for R; RStudio, Inc: Boston, MA, USA, 2016. [Google Scholar]
- INEGI Cartografía geoestadística urbana, Cierre del Censo de Población y Vivienda. 2010. Guadalajara. Available online: https://www.inegi.org.mx/app/biblioteca/ficha.html?upc=702825588335 (accessed on 25 January 2020).
- Government of Guadalajara. Online mapping service of the Government of Guadalajara. Available online: https://mapa.guadalajara.gob.mx/ (accessed on 1 May 2019).
- INEGI Censo de Población y Vivienda. 2010. Available online: www.inegi.org.mx/programas/ccpv/2010/default.html (accessed on 24 May 2019).
- ECLAC Brechas, ejes y desafíos en el vínculo entre lo social y lo productivo; ECLAC: Montevideo, Uruguay, 2017; pp. 19–174.
- Subirats, J.; Gomà, R.; Brugué, J.; Coords, T.; Gomà, R.; Brugué, J.; Coords, T. Análisis de Los Factores de Exclusión Social; Fundación BBVA; Institut d’Estudis Autonòmics, Generalitat de Catalunya: Bilbao, Spain, 2005. [Google Scholar]
- Guadalajara Municipal Housing Institute (IMUVI). Programas Operativos de Vivienda. Available online: http://imuvigdl.gob.mx/programasoperativos (accessed on 26 January 2020).
- Van Eijk, G. Unequal Networks. Spatial Segregation, Relationships and Inequality in the City; Delft Centre for Sustainable Urban Areas, Ed.; IOS Press under the imprint Delft University Press: Amsterdam, The Netherlands, 2010; ISBN 9781607505556. [Google Scholar]
- INEGI. Encuesta Nacional de Seguridad Pública Urbana (ENSU). Available online: https://www.inegi.org.mx/programas/ensu/ (accessed on 23 March 2020).
- Marcillo-Delgado, J.C.; Ortego, M.I.; Pérez-Foguet, A. A compositional approach for modelling SDG7 indicators: Case study applied to electricity access. Renew. Sustain. Energy Rev. 2019, 107, 388–398. [Google Scholar] [CrossRef]
- Aymerich, J. Segregación Urbana y Políticas Públicas con Especial Referencia a América Latina. Rev. Sociol. 2004, 117–130. [Google Scholar] [CrossRef]
- Montaner, J.M.; Subirats, J. Repensar las políticas urbanas Apuntes para la agenda urbana; Montaner, J.M., Subirats, J., Observatorio, T., Eds.; Diputació de Barcelona: Barcelona, Spain, 2012; ISBN 13521-2012. [Google Scholar]
- Blanco, I.; Cruz, H. La innovación social en Cataluña: Un análisis socioespacial. In Barrios y Crisis. Crisis económica, Segregación Urbana e innovación Social en Cataluña; Blanco, I., Nel Lo, O., Eds.; Tirant Humanidades: Valencia, Spain, 2018; pp. 147–171. ISBN 9788417203313. [Google Scholar]
© 2020 by the authors. Licensee MDPI, Basel, Switzerland. This article is an open access article distributed under the terms and conditions of the Creative Commons Attribution (CC BY) license (http://creativecommons.org/licenses/by/4.0/).