1. Introduction
As referred by the European Commission (EC), transport is the main cause of air pollution in cities while it represents almost a quarter of Europe’s greenhouse gas emissions. In detail, road transport was recorded to be by far the biggest emitter accounting for more than 70% of all Greenhouse Gas (GHG) emissions from transport in 2014 (Climate Action—European Commission, 2017) [
1]. Therefore, the high records of carbon dioxide emissions from transport are making it one of the greatest challenges cities are facing today. Although many perceive these challenges as a great opportunity for low-carbon urban development that requires political will and conviction, a growing number of voices are against this statement, a matter that will be discussed further in the last section of the paper. The bicycle could be the solution to this problem, for it is an alternative way of commuting and at the same time it promotes sustainable urban mobility. Several studies have focused on the use of the bike for promoting sustainability in campus areas (e.g., Cherry et al., 2014 [
2]) or in urban environments (e.g., Zhang et al., 2015 [
3]).
However, cycling is facing certain barriers in many European cities. These barriers can be identified as economic, environmental, attitudinal, lack of infrastructure, scarcity of parking facilities, weather conditions, security, comfort, and the safety of cyclists. For instance, the lack of adequate cycling infrastructure and lack of safety were identified by De Souza et al. (2014) [
4] as one of the strongest barriers for using a bike. Additionally, Swiers et al. (2017) [
5], identified weather and safety as the primary barriers for cycling in their research. Furthermore, the lack of adequate bike lanes, difficulties of maintaining appearance, and weather were defined by Iwińska et al. (2018) [
6] as barriers for cyclists and non-cyclists that prevent them from using the bike in the city of Warsaw. Additionally, Wadud (2014) [
7] found that annual hourly bicycle flows vary in London’s network due to climate change. Thus, it is a challenge for many researchers to change this situation through decision/policymaking and through promoting sustainability in cities. To further integrate cycling into the multimodal transport policy, the European Commission reinforces cycling aspects within the European Mobility Week campaign (European Comission, 2017 [
8]).
Promoting cycling and thus sustainability in an urban environment is not an easy task, and it requires the identification of these barriers. Despite the obvious barriers to cycling (e.g., lack of infrastructure), there are also some unobserved factors (e.g., attitude and intention of not cycling) that also prevent commuters from cycling. Therefore, this study investigates the effects that socio-demographic and trip characteristics might have on the intention to use a bike instead of a car in the city of Larnaca. The city’s residents have low experience in cycling, or their cultural/lifestyle background prevents them from cycling. A two-step approach has been developed using Explanatory Factor Analysis (EFA) and Structural Equation Modeling (SEM).
The rest of the paper is organized as follows. The literature review is presented in the next section.
Section 3 presents the case study city (Larnaca, Cyprus). The methodological framework of the study, including the data collection and the development of EFA and SEM, is described in the fourth section. The fifth section interprets the outcomes of the SEM model. The sixth section analyzes the sustainable mobility planning aspects of urban cities, e.g., Larnaca. The last section offers some conclusions to the study.
2. Literature Review
Besides all the psychological, physical, and environmental benefits of cycling, there are also the economic benefits that can be gained from cycling. For example, Meschik (2012) [
9] found that in the case of Vienna, cycling is contributing to the overall economy as opposed to vehicular traffic. Additionally, Winslott Hiselius and Svensson (2017) [
10] denoted that many sustainable benefits can be gained from e-bikes especially when they replace trips made by cars. However, as noted by Wardman et al. (2007) [
11] over the forecasted time period of 1997–2027, the proportion of the population that cycles to work will fall from 5.8% to 2.4%, urging people to opt for cars due to the increase of car availability. Therefore, it is important to understand what factors are preventing commuters from using a bicycle as an alternative transport mode. In this study, particular focus is given to the residents of cities with low experience or with no cultural/lifestyle background in cycling. More specifically, the case study of the city of Larnaca (Cyprus) is deployed.
Investigating attitudes and intentions on behalf of cyclists will provide significant information on how cycling should be approached by policymakers, in order to adopt this mode choice in the commuters’ daily routine, especially for close destinations. For these investigations, it is important to identify and use correlated information that will assist the interpretation of the people’s intent to cycle. This information can be varied between different researches, which have the same topic as the one that is being discussed in this study. For instance, Piatkowski and Marshall (2015) [
12] investigated the impact that attitude, socio-demographics, and built environments might have on two types of cyclists (occasional cyclists and those interested in cycling but unwilling to cycle regularly). They found that socio-demographic characteristics, attitude and perception variables appeared to have a significant impact on commuter cyclists. Fernandez-Heredia et al. (2014) [
13] found that convenience and exogenous restrictions (e.g., danger) have a strong influence on attitudes towards the bicycle. Another study explored the factors that appear to influence the intention and behavior of bicycle-sharing commuting in China. One of the findings indicated that the attitude towards bicycle-sharing has no significant effect on males’ intention of bicycle-sharing commuting, contrary to the effect that it has on females (Cai et al. 2019) [
14]. In Segadilha and Sanches (2014) [
15], the authors identified the volume of motor vehicles, security, and street lighting as important attributes that influence the route choice of individuals in a medium-sized Brazilian city. Therefore, the information that was considered was based on the macro-economic, socio-demographic, and trip characteristics of Larnaca’s residents.
Analyzing the collected information can be a tricky thing, as it requires the use of suitable and appropriate methods that can incorporate this information. Therefore, the questions being raised here are: How unobserved information, and likewise the “intention” to cycle, can be measured? How can we measure the effects of overall factors (e.g., socio-demography and trip characteristics) on intention? Since these studies are concentrating more and more on parameters that incorporate psychological aspects, the emphasis is given to unobserved (latent) elements. Specific techniques are taken into consideration to handle such types of latent structures, such as Explanatory Factor Analysis (EFA) for identifying possible unobserved (latent) variables inside the dataset. For example, Munoz et al. (2016) [
16] implemented EFA to examine the structure of the latent and objective variables related to bicycle commuting. The findings for the objective factors showed that socio-economic and household characteristics, mode availability, and trip characteristics are related to bicycle commuting.
Identifying latent structures is important; however, incorporating these latent structures is a different aspect that must be taken under consideration. A suitable method for incorporating this latent information with the observed information is Covariance Based (CB) Structural Equation Modeling (SEM). Several studies have developed SEM for measuring these constructs (e.g., Politis et al. (2013) [
17]; Dimitriou et al. (2017) [
18]). For instance, Useche et al. (2018) [
19] used SEM to examine the effect of gender on cyclists’ risky and positive riding behavior, using as predictors demographic, psychological, and bike-use-related variables. Through the use of SEM implementation, they found that gender does indeed influence the statistical explanation of risky and protective behaviors.
The combination of the factor analysis (e.g., EFA) and SEM (EFA-SEM) is a powerful and robust technique for concrete analysis and for obtaining valid results that can and must be used by policymakers. For instance, Lois et al. (2015) [
20] implemented a confirmatory factor analysis for determining the constructs of the data. These constructs were further tested by the use of SEM. The findings of their analysis suggested that a more specific measure of perceived self-efficacy and targeting concrete behaviors can be used for raising interest in initiatives concerning urban cycling’s promotion. In Politis et al. (2012) [
21] an EFA was implemented to identify latent structures that were incorporated into the model development for identifying their role on daily travel activities from and to the Aristotle University of Thessaloniki, Greece. Thereinafter, to investigate the contribution of latent variables (e.g., attitude) concerning the intention to cycle, the SEM method was considered suitable. The findings of this research showed that the frequency of car use as a daily travel activity is an obstacle for promoting and supporting sustainable mobility measures.
The results that the combination of the EFA and SEM methods, along with the existing results obtained from relevant studies, will be very helpful for understanding how cycling must be approached by local authorities in Larnaca. For instance, from the study of Festa and Forciniti (2010) [
22] (investigation of attitudes towards cycling in Rende, a small town in Italy) it was found that bike use could be promoted by enlarging the existing bike network, by adopting bike-sharing systems, and by promoting specific policies targeted at sustainable transport modes. The work of García et al. (2019) [
23] presented the effects of cognitive, affective, and behavioral attitudes towards the use of walking and cycling on both intentions and real use of cars, public transport, bicycles, and walking. As was indicated from the results, an affective attitude towards cycling is negatively associated with walking. On the other hand, a cognitive attitude towards cycling is positively associated with the intention of both cycling and walking. Additionally, Passafaro et al. (2014) [
24] investigated the role of social and psychological factors in an attempt to predict the desire to cycle for necessary daily trips in a big city (e.g., Rome). The findings of their research indicated that positive anticipated emotions and past behavior were the most direct predictors of desire to cycle in contrast with the social norms and attitudes that appeared to predict desire indirectly through anticipated positive and negative emotions. In Zheng et al. (2019) [
25], the changes in traveling mode after the introduction of shared bicycles in China were identified. The results indicated that the use of shared bicycles is more popular among young and low-income populations.
Table 1 provides an overview of some specific literatures (relevant to the topic and methodology of this paper), which are used in this study to better understand the steps deployed for fulfilling this paper’s scope.
Consequently, several researches have been developed for investigating behavioral and psychological characteristics towards the use of the bicycle, incorporating socio-demographic, economic and trip characteristics data. The methods for analyzing these observed and unobserved constructs were CFA, EFA, and SEM. Therefore, this study developed a two-step approach implementing EFA-SEM methods. Overall, this paper has followed these previous literatures for completing its objective, which was the investigation of the factors that prevent residents of cities with low experience or with no cultural/lifestyle background in cycling from cycling. One of these cities is Larnaca (Cyprus).
3. Case Study
Larnaca is the third-largest city of Cyprus, with an urban population of approximately 50,000 inhabitants (according to the 2011 population census). Additionally, the city of Larnaca is where the country’s primary airport and the second busiest port are located (World Data [
26]; Shoham Shipping and Logistics [
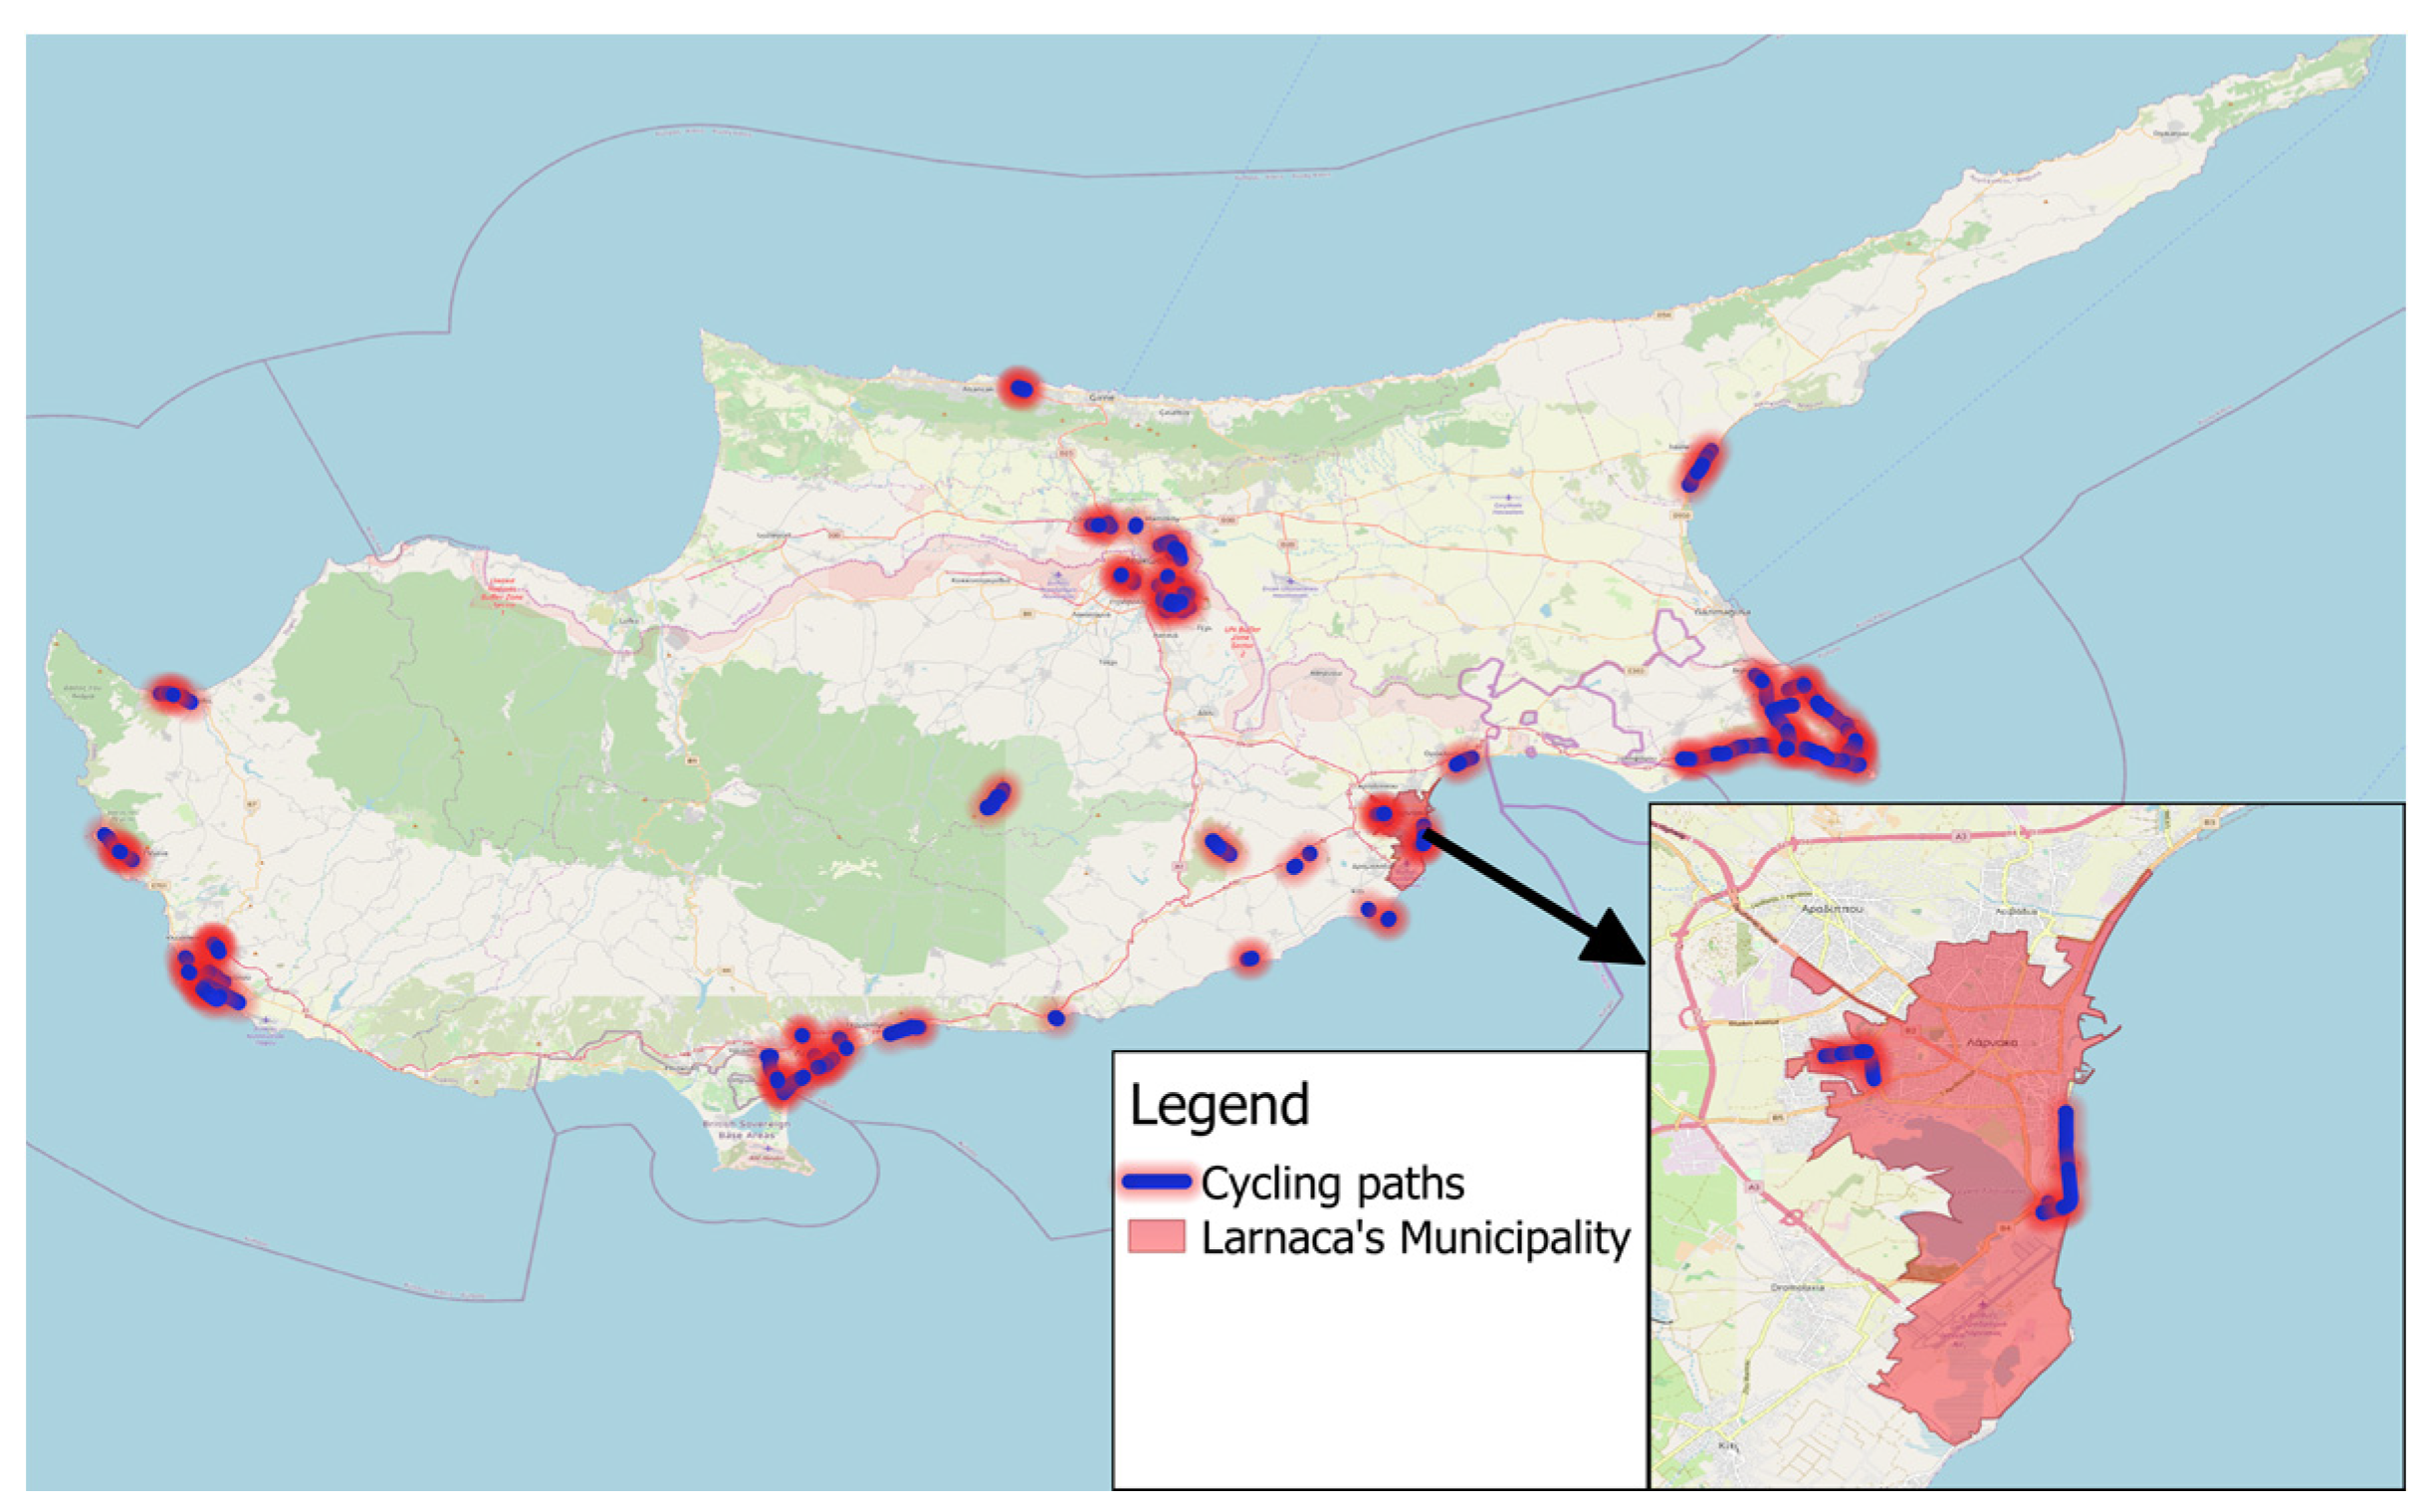
27]). The morphology of Larnaca is ideal for cycling due to its low ground level and the long coastal front (Larnaca region [
28]). Therefore, Larnaca is in a privileged position for adapting cycling as a way of transport on a daily level and also for leisure purposes.
Figure 1 presents the location of Larnaca in Cyprus and the lack of cycle infrastructure especially in Larnaca, a fact that worsens the conditions for cycling.
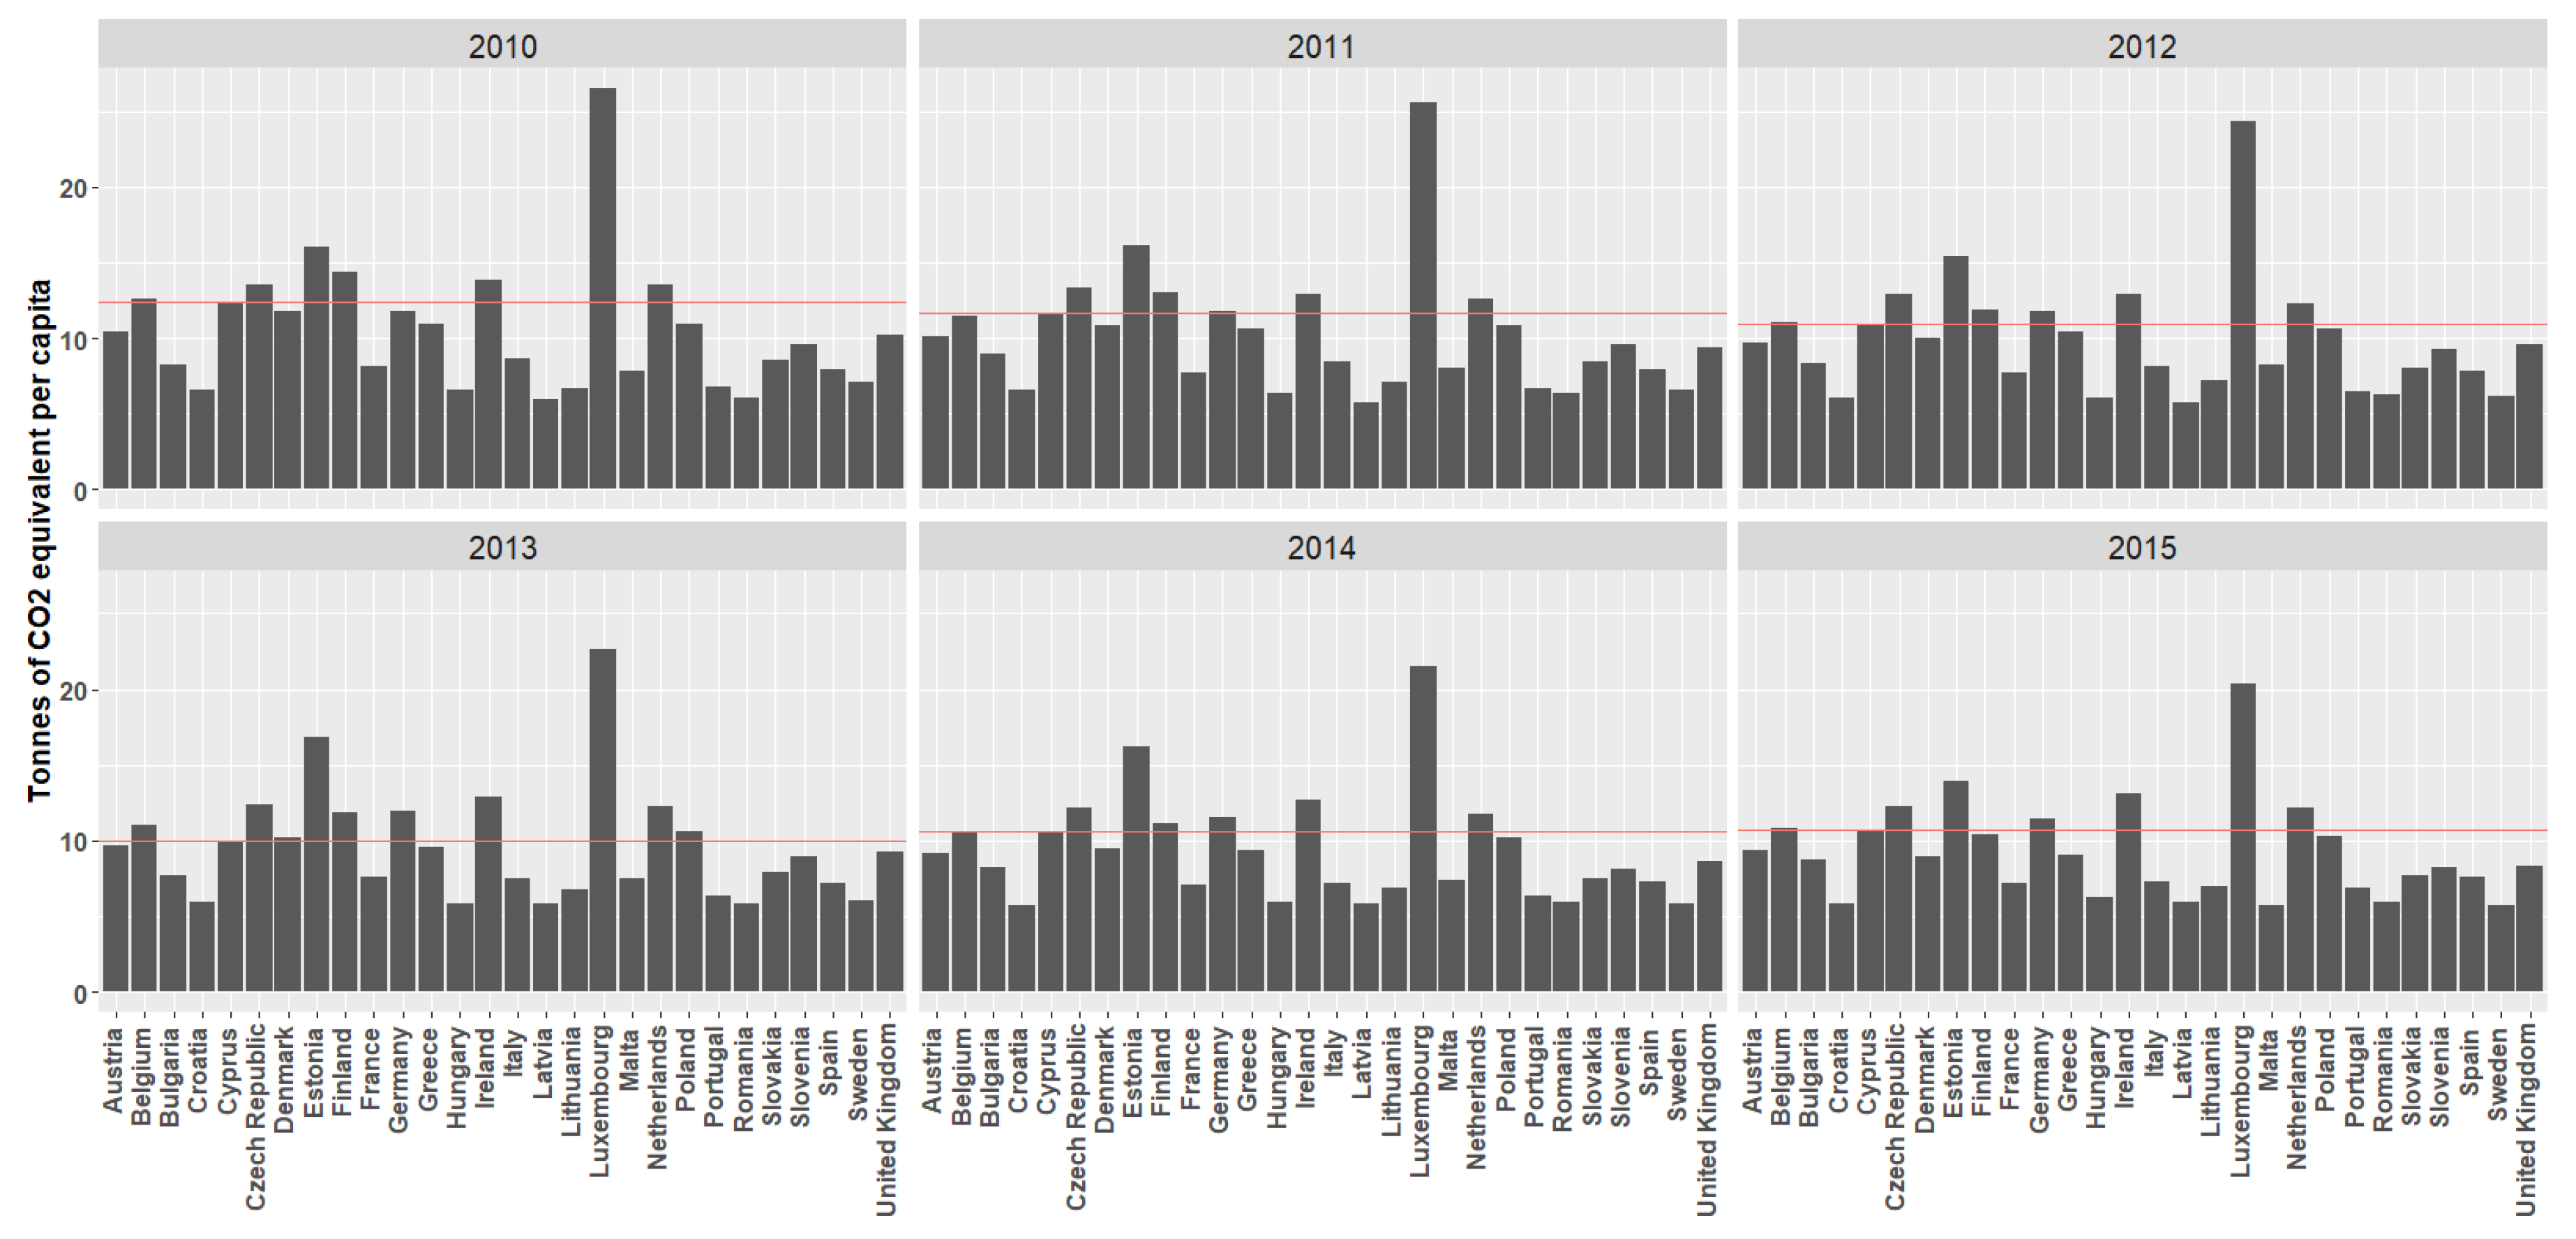
Additionally, in Larnaca, car use holds the first place as it is what locals prefer for their trips, a fact that has been identified in the survey. For this reason, Larnaca, and therefore Cyprus, are in a high ranking position inside the European Union (EU) concerning CO
2 emissions.
Figure 2 presents the place of the 28 member countries of the EU concerning the GHG emissions per capita (tons of CO
2 equivalent per capita) during the period of 2010 to 2015. As can be seen, the red line depicts the place of Cyprus over a certain period, which appeared to be in 8th place in the years 2010, 2011, 2014, and 2015. However, in 2012 and 2013 Cyprus dropped down to the 9th and 11th place, respectively. If one considers the size of Cyprus in population (almost one million) alone, one can understand that this does not compliment Cyprus at all. Therefore, some measures must be taken for change, specifically the promotion of sustainable mobility. Still, in Cyprus (Larnaca) the alternative means of transport, like the bike, do not exist. This fact strengthens the problem of GHG emissions. The lack of bike usage exists due to barriers (e.g., lack of bicycle network infrastructure, lack of safety and policy measures) that affect the intention of individuals in regards to cycling.
Furthermore, Cyprus is a Mediterranean island, and due to its geographic location high-temperature phenomena are occurring, especially during the summer period, a factor that prevents most people from cycling. However, for the remaining months of the year, the climate in Larnaca is ideal for cycling (the average temperature in the period of 1991–2007 was 17.7 °C based on Anon (2020) [
29]) and therefore it was not considered as a barrier for cycling. Thus, it was not included in the understudy variables. Instead, the factors that were investigated were based on the attitudinal and intentional characteristics of the residents of Larnaca since they cannot be directly measured.
Despite these circumstances, in 2011 Larnaca managed to be nominated for the European Mobility Award, which was handed to Bologna (Italy) at the Brussels Musical Instrument Museum on March 5, 2012 (European Mobility Week [
30]). Thus, Larnaca seems to be an ideal case for studying the intentional characteristics of the individuals and for replacing any other motorized means of transport with a bike, thus transforming the city of Larnaca into a sustainable urban environment.
4. Methodological Framework
This section was developed for investigating the use of bicycles in the city of Larnaca, Cyprus by providing answers to the concept question: Which observed factors (e.g., macro-economic, demographic and trip characteristics) influence the intention to cycle in the city of Larnaca, especially when the majority of the participants are willing to cycle (60%) but the percentage of cyclists is dramatically low (4%)? The step-by-step approaches followed in this section for answering this question are integrated into a concrete mathematical framework. Therefore in this study, a data collection approach has been taken for selecting a representative sample of Larnaca’s residents and descriptive statistics were provided for all information collected. To collect this information, a face-to-face questionnaire survey took place in the city of Larnaca, and therefore a total of 250 non-cyclists participated in the survey to identify the reasons that are preventing them from cycling.
However, in this part, it was considered that this sample may include latent information and thus a methodological framework was developed for identifying possible latent constructs inside the data sample using a suitable analysis, namely Exploratory Factor Analysis (EFA). The existence of two latent constructs was identified from EFA and was named “Socio-Demographic” and “Trip Characteristics”, which were used in the model’s development process. Furthermore, the intention of non-cyclists for cycling is a not directly observed variable. This is the reason why Structural Equation Modeling (SEM) was implemented for incorporating the observed and unobserved structures and for identifying their effect on the intention to cycle in the city of Larnaca. The knowledge of this information that SEM can provide, shows some insights to urban planners concerning the conditions that affect the intention of individuals, and thus they can suggest measures for overcoming these barriers, and transforming the city of Larnaca into a sustainable city.
4.1. Selecting the Appropriate Statistical Tool
The a-priori selection of the statistical tool that a researcher decides to use is of vital importance for the successful promotion of the main research questions, their robust treatment, and the documentation of the main findings. In this study, we utilize two well-known methodologies, Exploratory Factor Analysis (EFA) and Structural Equation Modeling (SEM), for analyzing cause and effect relationships of the given data.
4.1.1. Exploratory Factor Analysis
The British psychologist Charles Spearman was the first person in history to use the term “factor analysis” in order to explain the role of two factors in human intelligence (Spearman (1904) [
31]); in its full term, exploratory factor analysis was firstly used by Howe (1955) [
32], Andreson and Rubin (1956) [
33], and Lawley (1958) [
34].
The formation of the factor analysis model is:
For a p-element vector , there are a matrix of loadings, a k-element vector of scores, and a p-element vector of errors. Only the component is observed, but the major restriction is that the scores must be uncorrelated and of unit variance, and that the errors must be independent with variances . For doing factor analysis, the maximum likelihood procedure was preferred. The concept of using EFA was the provision of estimates of the correlation between variables and latent factors in the case that the variables are representing a latent part.
4.1.2. Structural Equation Modeling
The advantages of using (unobserved) factors instead of directly observed variables were highlighted by many researchers in the past, since the latter models do not take into account the measurement error and cause bias at the estimations (Schumacker Lomax (2004) [
35]); SEM techniques, for instance, are taking into account measurement error during the statistical manipulation of the data.
Based on the above comments, it was decided that the appropriate statistical technique that fits better to the objectives of this study is that of SEM, and more specifically an application of it known as MIMIC models (Multiple Indicators Multiple Causes). A MIMIC model stands for a multiple indicator multiple cause model, in which multiple indicators reflect the underlying latent variables or factors and the multiple causes (observed predictors) affect latent variables or factors (Wang and Wang (2019) [
36]).
MIMIC-type models have been used in transport studies for decades now in order to identify cause–effect relationships, especially for those factors related to the socio-economic background of the responders (age, income, gender, etc.). Indicative studies of MIMIC-related applications in transport are the works of Li et al. (2019) [
37] and Chen and Li (2017) [
38] in the field of public transport, Shrestha et al. (2007) [
39] and Allen et al. (2018) [
40] in the field of perceived trip quality and satisfaction, and Elyasi [
41] and Politis et al. (2013) [
17] in the field of road safety. Furthermore, an extended application of SEM techniques called Integrated Choice and Latent Variables (ICVL) models also treats personal characteristics of the responders as latent factors (Potoglou et al. (2015) [
42]). In addition, many psychology-oriented theories, like the Theory of Planned Behavior (TPB), the Transtheoretical Model (TTM), and the Technology Acceptance Model (TAM) are transposing the direct observed socioeconomic background of the cases into unobserved (latent) constructs.
In SEM there are two types of models: the measurement model and the structural model. The measurement model specifies how measured variables come together for explaining (the identified from EFA) latent factors. The measurement model is formed below:
where the
’s and
’s are observed for latent variables, the
’s and
’s are latent variables, the
’s are factor loadings, and the
’s and δ’s are error terms. The measurement model of the SEM involves Confirmatory Factor Analysis (CFA). The question raised at this point was the minimum number of indicators (observed variables) for explaining different latent constructs. According to Kline (2015) [
43], for the CFA models in the measurement model, there is a rule concerning the minimum number of indicators per factor. This rule is expressed as follows:
“If a standard CFA model with a single factor has at least three indicators; or has two or more factors where each factor has two or more indicators, then the model is identified”.
The structural model represents the notation of how well related the latent constructs are with each other. The structural model can be written as follows:
where
η is an
vector of latent endogenous variables,
ξ is an
vector of latent exogenous variables,
is an
vector of intercept terms,
B is an
matrix of coefficients that give the influence of
on each other,
Γ is an
matrix of coefficients of the effect of
on
, and
is the
vector of disturbances that contains the explained parts of the
’s. Therefore, the ability of SEM to incorporate and analyze the effects of latent variables on observed variables was the criterion for developing a SEM model instead of a classic regression model.
4.2. Data Collection
In order to collect the information required for this investigation (i.e., variables that explain the macro-economic, demographic, social, and mobility context of Larnaca’s residents), a face-to-face questionnaire survey was preferred amongst other methods of survey (such as an online survey, e.g., Uttley and Lovelace (2016) [
44]) due to the immediacy that the a face-to-face questionnaire offers to the participants. Additionally, this survey method provides the ability to control the sample’s equality concerning the participants’ gender. Unfortunately, this information (e.g., macro-economic, demographic, and social data) was not available from other resources. Therefore, the structure of the questionnaire was constructed in such a way as to obtain the above information.
For the purposes of this study and having taken under consideration the population size of Larnaca (approximately 50,000 inhabitants according to Cyprus’ Statistical Service [
45]), the representative number of questionnaires that was decided upon was approximately 400. However, during the questionnaires survey (from June to September 2014), it was noted that the population of Larnaca was not willing to spend time and complete the face-to-face surveys and thus the number of questionnaires remained at 250. The survey was based on random sampling but with only one constraint, the equality of the participants’ gender. The reason for this constraint was to reflect the proportion of the participants’ gender in regard to Larnaca’s total population. It must be mentioned that smaller samples introduce larger uncertainty. However, because of Larnaca’s small population, the 250 questionnaires are representative of the total population. Additionally, it must be noted that the reason for analyzing non-cyclists has to do with the fact that the sample of the cyclists was too small and thus not representative. The participants in the survey were above the age of 18. The survey aimed at balancing the participants by gender and thus the number of female and male participants was almost the same. Furthermore, the participants were approached at different places of interest inside the city of Larnaca.
The structure of the questionnaire consists of three sections. The first section focused on the socio-demographic characteristics of the participants (e.g., gender, age, monthly income). The second section considered the general trip characteristics of the participants. In particular, in this section, the participants were asked about their latest movement, i.e., the origin and the destination of their latest trip and its purpose and total travel time. The reason for focusing on their last trip and not on their daily, monthly, or annual trips was based on the hypothesis that the participants can easily recall recent trip characteristics and behavior or feelings gained from their trip (information that will support the objective of this paper). Additionally, this section continued by asking questions that will assist the identification of the relationship between the participants and the bicycle. The third section was concerned with the perceived level of service of the bicycle network infrastructure in the city of Larnaca. From this section, we collected important information concerning the participants’ opinion on improving the conditions for cycling in the city, by suggesting improvements, in a hierarchical order, that support the idea of adopting a bike as an alternative way for commuting. The last question of this section led to the creation of a “picture” of the participants’ intention to cycle. In detail, this question asked the participants if they would use the bicycle in case all of their suggestions were approved.
Table 2 shows the collected data that were used in the current research. As can be seen, the majority of the participants were considered educated people, aged between 19 to 39 years old with an income between 0–800 euros (per month) that have at least one car in their household and have at least one bike even though they do not cycle.
The variables “Know_B_B” (Knowledge of bicycling’s benefits) and “Availability” (Availability for replacing the last mean of movement with bicycle) were used for determining the intention of the participant to cycle in the city of Larnaca (dependent variables). The rest of the variables were considered as explanatory of the dependent variables. For observing the latent constructs inside the dataset, a suitable statistical technique was developed, namely Exploratory Factor Analysis (EFA).
4.3. Exploratory Factor Analysis
EFA is commonly used for identifying collinearity before performing any linear regression analysis (e.g., Structural Equation Modeling) and also for identifying statistically insignificant variables. The outcome of EFA showed the structures of the data and the number of latent variables. In detail, the reduction of the observed variables and the identification of the unobserved variables were followed through a data-driven approach. The first outcome of the EFA showed no clear structure among the sample and thus the procedure was followed by discarding some variables that appeared to be either collinear or statistically insignificant.
Table 3 presents the Kaiser–Meyer–Olkin (KMO) measure of sampling adequacy and Bartlett’s test of sphericity. From this table, it can be concluded that the EFA passes the cutting off criteria (KMO > 0.5 and Bartlett’s Test of Sphericity < 0.05) and that the concluded sample is adequate for further analysis.
At the next step, the EFA provided a three-factors (latent variables) construct explaining 72.792% of the variance. The cut-off for the number of the generated factors was all factors with an eigenvalue of ≥1. However, often a cut-off of 1 results in more factors than the user aimed for, or it leaves out a theoretically important factor whose eigenvalue is just below 1. For this study, based on the meaning and nature of the observed variables, we reached the conclusion with only the two latent factors, which explain 53.747% of the variance. The eigenvalue and percentage of the explained variance are presented in
Table 4.
Table 5 presents the concluded variables for both latent factors and their relationships. The two factors were “Socio-Demographic” and “Trip Characteristics”, and the observed variables that explained each of the two latent variables can be indeed characterized in the same group based on their meaning. The “Socio-Demographic” factor included the observed variables “Age”, “Income”, and “Education” and the latent factor “Trip Characteristics” included the variables “Route_Length”, “Transport_Mean”, and “Route_Time”. Notwithstanding the identification of the latent structures and the variables explaining them, the study continued with the estimation of the relationship that these structures have with the intention of cycling, using Structure Equation Modeling (SEM).
4.4. Structural Equation Modeling
SEM is an extension of the general linear model that offers estimations between observed and unobserved variables. In a general SEM path, the observed variables are depicted as rectangles or squares. The unobserved variables, which are called latent variables, are depicted as ovals or circles. Additionally, residuals are presented by ovals or circles (University of Texas at Austin (2012) [
46]).
The advantage of using the SEM model instead of a linear model is that SEM incorporates the indirect effects between the explanatory and dependent variables. Additionally, for studying different fields of the social sciences, researchers are advised to use the SEM model and analysis, which will allow the analysis of complex research problems based on an analysis of cause–effect phenomena (Tarka (2018) [
47]). Even though the causality should be inferred by the research design instead of the statistical model, we used the represented causality in a non-inferred way by developing the SEM model studying the direct and indirect constructs of observed and unobserved variables.
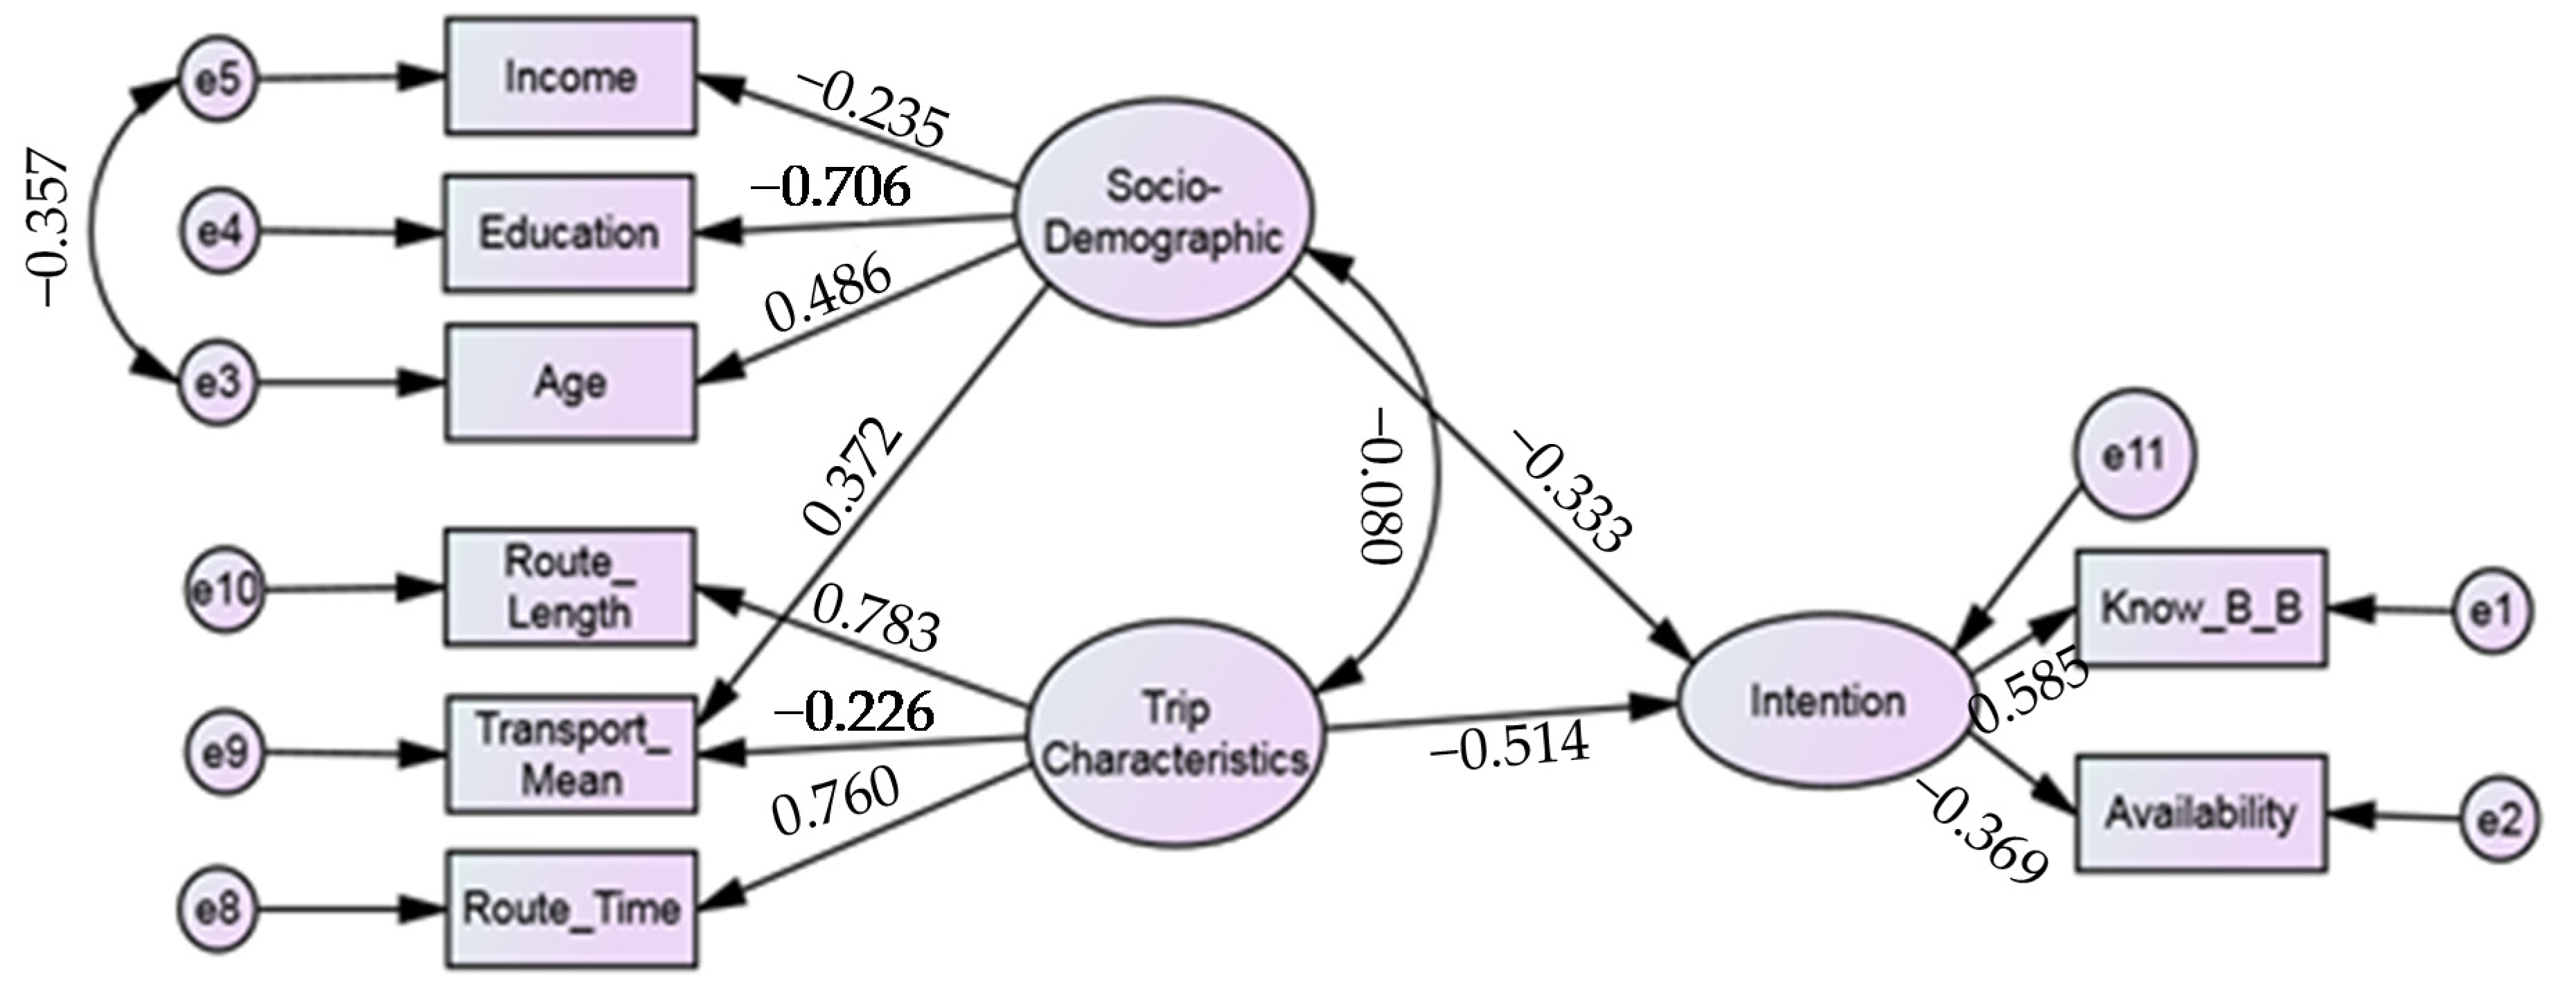
Notwithstanding the fact that EFA provided the structure of the data, the initial SEM path was modified to improve its fit, and thus the proposed model, which is depicted in
Figure 3, was converged. From this figure, it can be seen that latent variables (depicted with ovals) have an effect on the observed variables (depicted with rectangles), which include some residuals or errors (depicted by circles). Correlations and covariances are represented by bidirectional arrows, which represent relationships without an explicitly defined causal effect. By contrast, directional arrows show effect relationships. Therefore, in this figure, it can be seen that the latent variable “Socio-Demographic” has an effect on “Income”, “Education”, “Age”, and “Transport_Mean”. As far as the latent variables “Trip Characteristics” are concerned, they seem to have an effect on “Rout_Length”, “Transport_Mean”, and “Rout_Time”. The observed variable “Transport_Mean” appear to be related to both latent variables, a fact that was obtained from EFA and incorporated in SEM. The interpretation of these relationships, of the observed variable with both latent factors, is that as the demographic conditions of Larnaca increase (e.g., population and income), people are looking for alternative methods of commuting (e.g., motorcycle, bus). Furthermore, as the trip characteristics of a movement change (increase of trip length, non-cycling path networks, lack of safety, etc.) the people of Larnaca are expected to travel more with their private cars, as trip characteristics are becoming more complicated. Therefore, the signs of particular relationships reflect the above interpretation. Additionally, we can observe from the specific figure that the “Socio-Demographic” and “Trip Characteristics” latent variables are correlated or associated, but that there is no claim that “Socio-demographic” is causing “Trip Characteristics” or vice versa, and therefore this representation can be done through the bidirectional arrow. The same stands for the case of the residuals, i.e., when the covariance between residuals is high enough, the correlation or association symbol (bidirectional arrow) is added for representing this relationship with no causal effect and for improving the fit of the model.
Table 6 presents the Good-of-Fit (GOF) indices regarding the particular SEM path. As can be observed, the particular SEM model is considered as a GOF model, and thus it can be trusted and interpreted to improve the urban planning approach. The GOF indices that were concerned are: Root-Mean-Square-Error Approximation (RMSEA), the Adjusted Goodness-Of-Fit Index (AGFI), GFI, Comparative Fit Index (CFI), and chi-square.
Finally,
Table 7 presents the estimations between the observed and unobserved variables. All estimations were below a significant level of 5%. Further discussion of the results will be provided in the following section.
5. Discussion of the Results
The findings of the SEM model showed that socio-demographic and trip characteristics play a significant role when estimating people’s intention to cycle in the city of Larnaca in a direct way. The negative sign of these latent constructs depends on their measurement scale. Moreover, based on the Root-Mean-Square-Error Approximation (RMSEA), the Adjusted Goodness-Of-Fit Index (AGFI), GFI, Comparative Fit Index (CFI), and chi-square, the SEM model appeared to fit the data properly (statistically adequate), and thus the model can be considered robust for estimation reasons.
From
Table 7, it appears that trip characteristics have a higher explanatory value regarding the intention to cycle (β = −0.51) than socio-demographic factors do (β = −0.33). The meaning of each estimation appears to be reasonable. For instance, “Education” tends to increase one’s intention for cycling as the levels of education increase. This is one of the main outcomes of our study: the fact that well educated people are more inclined to cycle, mainly due to the fact that they are better informed about the benefits of active transport. As for the variable “Age”, it seems to have a negative impact on one’s intention to cycle, i.e., as people grow older, they are unwilling to use a bicycle for their trips or may not be able to cycle due to their perceived health or safety reasons. As for the variable “Income”, it seems that commuters with high incomes are more willing to cycle. An analogous result was found in the study of Liao (2016) [
48], where the socio-demographic factors, namely age, educational level, and city of residence, were associated with public bicycle use. As for the variable “Transport_Mean”, it plays a role in directly estimating both latent variables (“Socio-Demographic” and “Trip Characteristics”). It seems that this variable, when concerned with its indirect relationship with “Intention”, is a deterrent factor for using a bike, especially when the commuters use their bike for commuting purposes. A similar result was obtained by Verma et al. (2016) [
49], where they found that the odds of increased bicycle commuting are lower among those who have car availability. Furthermore, the rest of the variables from the factor “Trip Characteristics” also show a negative relationship with the intention of cycling. It seems that as the travel distance and travel time increase, cycling is not considered as an alternative transport mode for the residents of Larnaca. Overall, despite the positive effect that some observed variables have on the intention to cycle (“Income”, “Education”, and “Transport_Mean”), the socio-demography and trip characteristics of Larnaca’s population remain key factors that prevent Larnaca’s population from using a bike.
These findings were also confirmed by other studies, which indicate that in order to increase peoples’ intention to use the bike as an alternative transport mode in the city of Larnaca, local authorities should design strategies which will, in return, produce the desired impact on their residents’ intention (i.e., changing intention from negative to positive).
6. Policy Implications
The findings of this research should not go unnoticed especially to policymakers, who should consider the factors that keep away Larnaca’s commuters from cycling, thus promoting sustainable mobility inside the city of Larnaca.
In detail, the city’s authorities should consider encouraging non-cyclists to start or even to increase their bicycle use by arranging monthly mobility events, like the European Mobility Week campaign, but in a more frequent manner. Furthermore, due to the lack of infrastructure, commuters have car use as their first priority, even in cases of short-distance trips (below 10 km). This fact increases the need for addressing the factors that seem to prevent commuters from using the bike. Although the variable “Prevent_Bike” was omitted from the final SEM model, it appears that it is still important in order to interpret (even in a non-statistical way) the descriptive statistics (percentage) of this variable in
Table 1. As can be seen, the main reasons preventing people from using the bike are: the occupancy of the car (40%), lack of safety (15%), long distance between origin and destination (7%), and lack of comfort (7%). Therefore, local authorities should also take into account these factors in their considerations. Focus must be given to safety, because despite the fact that it is not the primary reason for preventing the use of bicycles, it remains a significant factor. For instance, Chataway et al. (2014) [
50] studied the differences between Brisbane (an emerging cycling city) and Copenhagen (an established cycling city) in terms of the cyclists’ safety perceptions, and provided reports on their behavior. The results showed a difference between the safety perceptions of cyclists in the two cities. Brisbane’s cyclists were identified as more fearful than Copenhagen’s cyclists due to traffic, to a lower perceived safety of infrastructure layouts, to higher use of safety gear, and higher attention to traffic. Concerning safety and infrastructure, it is essential to study the infrastructure that is possibly going to alter the commuters’ attitude in order to start using the bike. Likewise, Basu and Vasudevan (2013) [
51] studied the effects of some of the bicycle-friendly infrastructures in urban Indian bicycling from the users’ point of view. They identified the dedicated bicycle lane as the most preferred bicycle-friendly infrastructures based on public opinion. Additionally, Caulfield et al. (2012) [
52] examined the infrastructure preferences of cyclists in order to identify the factors that have the greatest influence on the level of cycling confidence and some other factors as well. They identified the direct routes with short journey times as being the most important to cyclists and non-cyclists in their route choice.
Further efforts could also be made in education, as it seems to be one of the variables that intensely affect people’s motivation to cycle. As for the participants who feel that age is a barrier for cycling, a shared system of electric bicycles might be a solution. However, to justify this proposal, a questionnaire-based survey is needed in order to investigate participants’ willingness to use bike-sharing systems. Last but not least, income has a significant effect on increasing the intention to cycle. However, there is a portion of people who cannot afford to buy a bicycle. Thus, for these people, Larnaca’s authorities should install a low-cost bike share system. Overall, the intention may not be easy to change, and thus this measure must be adopted in every sustainable urban mobility plan (SUMP).
Overall, all of the factors that were highlighted in this study as supporting the decision-making process of local authorities should be treated in a sensible way, i.e., cities’ authorities should be skeptical towards such findings and should carefully consider their respective investment plans for cycling infrastructure by taking into account that citizens already have a strong habit of using cars.
7. Conclusions
Cycling offers a variety of benefits compared to motorized forms of transport towards the vision of low-carbon development. Although many studies confirm the positive role of cycling in the provision of a low-carbon footprint [
53,
54], there are others that argue against the dominant role of cycling as a sustainable factor in cities [
55,
56].
The research question developed in this study was: What are the factors that are preventing Larnaca’s residents from cycling? This question has troubled local authorities especially when one considers that more than 60% of the commuters who do not use a bike express an interest in cycling. Such a contradiction makes a strong case for further investigating. This study attempted to contribute to the identification of the existing barriers that make cycling in Cyprus have low demand levels, despite the existence of an appropriate landscape and good weather conditions. This also applies to other Mediterranean countries like Greece, Italy, and Spain. The overall “picture” obtained from this study will provide significant support to the decision-making efforts of local authorities in creating a friendlier environment for commuters who wish to cycle, thus promoting a more sustainable city.
The approaches made for fulfilling this contribution are described below. The data collection procedure was carried out in 2014 using a face-to-face questionnaire survey with 250 participants inside the city of Larnaca, Cyprus. A straightforward methodology for identifying the structure of the data, such as Exploratory Factor Analysis (EFA), was considered important. The factors identified through the development of the EFA were characterized by socio-demographic and trip characteristic factors (observed variables) and thus titled “Socio-Demographic” and “Trip Characteristics”. For analyzing this latent component (identified in EFA) and for estimating the direct and indirect relationships between the observed and latent variables, a suitable method, namely SEM, was developed. It must be mentioned that several other methods could also be developed for fulfilling the scope of this study, such as the theory of planned behavior, norma activation theory, trans-theoretical models, and a stage model of self-regulated behavior change. However, the SEM model was adequate for this study. However, it can be argued that these methods will be considered in a future step of this research.
Concerning the results obtained from the SEM model, it seems that both latent factors, i.e., “Socio-Demographic” and “Trip Characteristics”, appear to have a significant relationship with the intention to cycle. However, variables such as “Education”, “Income”, and “Transport_Mean” have a positive relationship with the intention to cycle. Therefore, the overall study showed that changes in people’s intentions will also eventually change the way cities (in this case Larnaca) can be sustained by adopting cycling as an alternative method of commuting. In order to do so, they have to face the factors that prevent citizens’ intentions. Additionally, it must be mentioned that Good-of-Fit measures (i.e., AGFI, GFI, CFI, RMSEA, and Chi-square) showed that the SEM model is robust and thus can be trusted for interpretation purposes.
A number of limitations make this study questionable for the generalization of its findings, which is a matter that needs to be mentioned. One main drawback is the robustness of the sample size. Applying pure statistical calculations, the sample of 250 questionnaires in regards to the overall population of Larnaca, with the assumption of a 95% confidence level, leads to a confidence interval of 4.9, which may be considered as weak but not as non-acceptable for reliable outcomes. The unwillingness of responders to participate in the survey, along with time and staff constraints, rescheduled the timescale of the on-field survey. This is a lesson learnt for the case of questionnaire-based surveys in Cyprus that needs to be taken into consideration in similar future research. This issue may be overcome by utilizing modern data collection techniques, such as tablets with cellular connection for real-time data saving and transmission.
In future research, more attitudinal factors will be used along with a larger sample of questionnaires, which will be collected by expanding the study area to a larger buffer zone of Larnaca. Additionally, it is important to also study the intention of Larnaca’s commuters when it comes to the use of a shared system of electric bicycles. The methodology followed in this paper can also be enriched by developing behavioral change models or a simple logit model, which will provide a more accurate “picture” of Larnaca’s residents’ intention to cycle.


