Article

Rapid Multi-Dimensional Impact Assessment of Floods

by
David Pastor-Escuredo
1,2,3,*,
Yolanda Torres
2,4,
María Martínez-Torres
1 and
Pedro J. Zufiria
1,5
1
ETSI Telecomunicación, Universidad Politécnica de Madrid, 28040 Madrid, Spain
2
Innovation and Technology for Development Centre, Universidad Politécnica de Madrid, 28040 Madrid, Spain
3
LifeD Lab, 28010 Madrid, Spain
4
ETSI en Topografía, Geodesia y Cartografía, Universidad Politécnica de Madrid, 28031 Madrid, Spain
5
Departamento de Matemática Aplicada a las Tecnologías de la Información y las Comunicaciones, Information Processing and Telecommunications Center, Universidad Politécnica de Madrid, 28040 Madrid, Spain
*
Author to whom correspondence should be addressed.
Sustainability 2020, 12(10), 4246; https://doi.org/10.3390/su12104246
Submission received: 1 April 2020 / Revised: 11 May 2020 / Accepted: 15 May 2020 / Published: 22 May 2020
(This article belongs to the Section Sustainable Urban and Rural Development)

Abstract

:
Natural disasters affect hundreds of millions of people worldwide every year. The impact assessment of a disaster is key to improve the response and mitigate how a natural hazard turns into a social disaster. An actionable quantification of impact must be integratively multi-dimensional. We propose a rapid impact assessment framework that comprises detailed geographical and temporal landmarks as well as the potential socio-economic magnitude of the disaster based on heterogeneous data sources: Environment sensor data, social media, remote sensing, digital topography, and mobile phone data. As dynamics of floods greatly vary depending on their causes, the framework may support different phases of decision-making during the disaster management cycle. To evaluate its usability and scope, we explored four flooding cases with variable conditions. The results show that social media proxies provide a robust identification with daily granularity even when rainfall detectors fail. The detection also provides information of the magnitude of the flood, which is potentially useful for planning. Network analysis was applied to the social media to extract patterns of social effects after the flood. This analysis showed significant variability in the obtained proxies, which encourages the scaling of schemes to comparatively characterize patterns across many floods with different contexts and cultural factors. This framework is presented as a module of a larger data-driven system designed to be the basis for responsive and more resilient systems in urban and rural areas. The impact-driven approach presented may facilitate public–private collaboration and data sharing by providing real-time evidence with aggregated data to support the requests of private data with higher granularity, which is the current most important limitation in implementing fully data-driven systems for disaster response from both local and international actors.

1. Introduction

Natural disasters such as floods, storms, or earthquakes affect hundreds of millions of people worldwide every year [1,2,3]. Local and national civil protection and international humanitarian action mechanisms can be potentially improved with dynamic in-situ timely information across the disaster timeline. We generally consider disaster management for floods as a cyclic process comprising preparedness, warning, mitigation, response, evaluation, and relief. Impact assessments can help in quantifying needs, planning strategies, and resource allocation, and can provide a tool for evaluation and monitoring [4]. Rapid response is currently designed by combining an impact model and needs analysis to estimate requirements of the response [5]. From this perspective, new data sources can help implement a dynamic and more optimized response based on population dynamic patterns and evolution of the disaster. In summary, data-driven mechanisms throughout the management of disasters could improve decision-making, monitoring, evaluation, and learning activities [6]. A deeper understanding of the behavior during different disasters at different scales is necessary to build up more resilient communities and societies. Recently, the use of mobile phone data has allowed the quantification of behaviors and patterns caused by disasters by characterizing hotspots of mobility and social network behavior spatially and temporally [7,8], although these studies are mainly focused on small temporal intervals due to the availability of data. These studies are not real-time due to the same limitations in access to data. A comprehensive framework addressing both the necessary methodologies to generate actionable insights and the data access and privacy limitations is required for the implementation of real-time systems that also enable recovery monitoring.
The high penetration of mobile phones and the use of social media has motivated the analysis of these data sources to better understand natural disasters, giving rise to new opportunities [9]. Anonymized and aggregated Call Detail Records (CDRs) have enabled large-scale analysis of social patterns, especially studies on human mobility [10,11,12,13]. Humanitarian applications based on this data cover the monitoring of disease outbreaks [14,15], the detection of social crises and riots [16], monitoring of social integration [17] including homophily [18] or the quantification of social patterns and mobility during disasters. Information spreading has been analyzed to find characteristic patterns in social networks during disasters [19], Mobile phone data have also been used to predict movements during large disasters, such as the Haiti earthquake [20]. Similar solutions have been applied for fast analysis in other contexts to help deployment of operations [21], but no solution has prevailed. A first approach to combining remote sensing and mobile phone data was proposed using fine-grained mobile phone data, but scalability problems prevented it from becoming a standard solution [22]. The public availability of social media data has allowed their beneficial use for social purposes, such as unemployment estimations [23], understanding political conversation [24], measuring social segregation [25], or assessing the damage during natural disasters [26]. Satellite imagery has been used extensively for disasters and climate monitoring [27]. In recent years, it has been used to estimate poverty proxies using Machine Learning techniques applied solely to satellite data [28] or integrating these data with mobile phone data through a spatial model to increase geographical resolution of poverty indexes [29,30]. The trend in data for development has been to show potential applications and create indicators; however, the scope of the projects is very limited by the availability of data to transform studies into operational mechanisms.
In this work, we propose a framework to make a rapid multi-dimensional assessment of impact of floods by integrating data from heterogeneous sources. This framework is a module of a larger system, depicted in the Methods section, to frame the need. Social data with high spatio-temporal resolution complement environment sensors and satellite imagery to have a set of impact indicators reflecting population dynamics. We foresee that social-data-based proxies can trigger and optimize the response from the local and national mechanisms (e.g., civil protection, national emergency teams, etc.) and facilitate the intervention of international humanitarian actors when needed in a transparent way based on quantitative parameters. In addition to the first response, a dynamic impact assessment can be potentially useful for all phases of the disaster management cycle with a specific utility and scope depending on the nature of the flood. Furthermore, the framework intends to advance towards standard public–private partnerships during disasters to leverage high-value data and feed operational mechanisms to transform data into action. A major requirement for using fine-grained private data is to have evidence of need, so we propose several layers of granularity, starting from real-time data aggregates that are privacy-conscious, can be used in systematic operations without high privacy risks [31,32], and are well suited for unlocking more privacy-sensitive data [33,34]. These indicators were implemented using data made available for the UN Data For Climate Action (D4CA) Challenge [35] and other open data sources described in the Methods section. The Results section illustrates the approach in four different floods. The discussion provides details of how the framework helps improve disaster management and its limitations. The conclusion summarizes the contributions of the work and proposes future improvements.

2. Materials and Methods

2.1. Study Composed of Four Floods

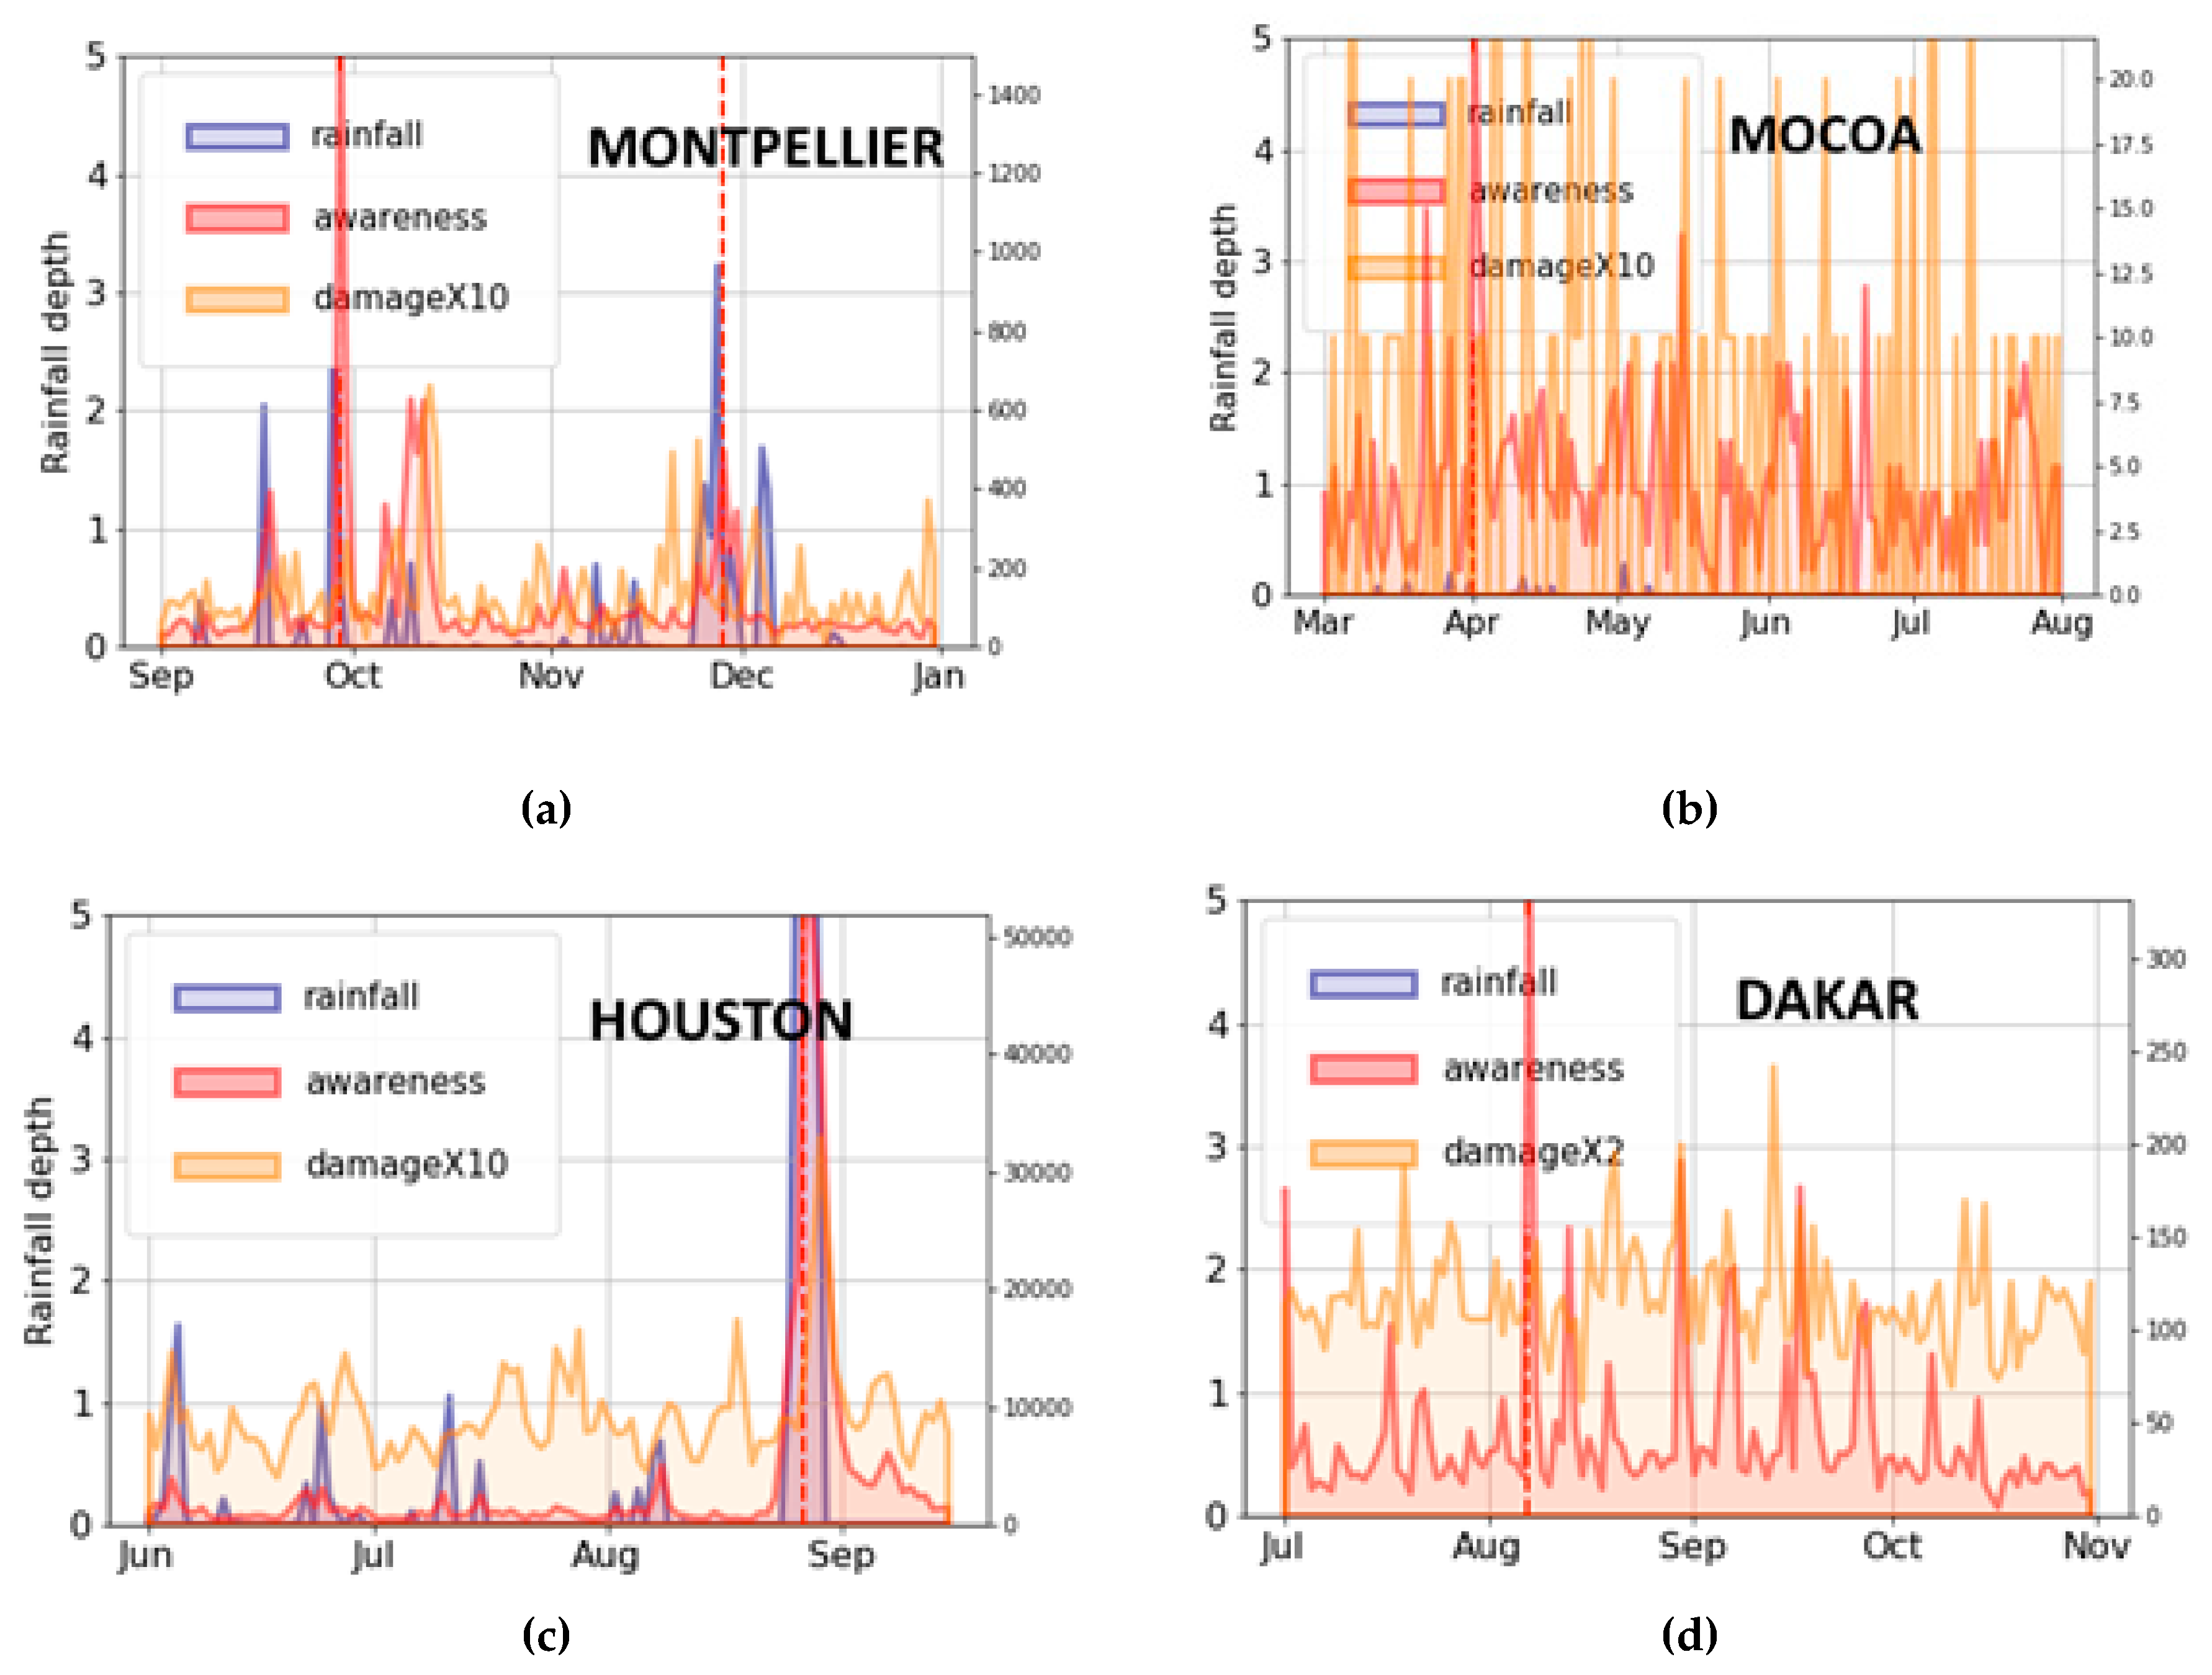
We selected four floods to make a study. CDR data were available for France in 2014–2015, so we selected two consecutive floods occurring in southern France (Montpellier area) in September and November 2014, where people were forced to use shelters and overnight flash floods occurred. We have previously worked with CDR data in Senegal, so we chose a flood that occurred in Dakar in the rainy season of 2013, from which little information could be found; even a precise date for the flood was missing, which highlights the need to having new data-driven systems. The other two floods happened the same year of the D4CA Challenge (2017) in Mocoa, Colombia (April 2017) and Houston, USA (August 2017), and had a great impact. The flood in Mocoa caused more than 1400 deaths and hundreds of disappeared people; sixteen neighborhoods were destroyed by the flow and the materials transported by the water. This flood was investigated and the rainfall occurred from 9.30 pm until 11.30 pm, when the flood took place, so it can be considered a flash flood. The flood in Houston was caused by Hurricane Harvey, which produced important damages, producing massive evacuations in several regions, such as Bay City, fortunately with few fatalities. Several flash floods were also identified in Houston.
The severity of the physical impact of the floods depends on several natural factors and the infrastructures of the location. The natural factors are the climatological dynamics, time of the flood (with more impact during night hours), proximity of rivers or other bodies of water that may overflow, the topography, the type of soil, including the presence of rocks and other materials that can be transported, and the state of conservation of the area, including landcover or deforestation. The infrastructural factors that can affect are mainly the general urban development, the type of buildings and pavement, the water canalization, and the soundness of dams and bridges. The topography and the presence of currents of water increase the spatial scope of torrential rainfalls, which makes it more difficult to detect floods using weather stations located in cities or other types of settlements. For this reason, we consider overflow as a primary cause of floods, along with rainfalls concentrated in the affected area.
The physical impact can be influenced and mitigated partially by an effective human response that depends on the capacities of the local, regional, and national authorities, civil protection, and the civil society in general. For this reason, measuring social dynamics can be the helpful to improve response mechanisms. For all of the floods, data from social media and weather estimations from stations were collected. Conclusions are drawn from insights across these cases, although not all of the analysis modules could be applied to all of them due to data availability limitations.

2.2. Data

The data used in this work were made available within the UN Data For Climate Action Challenge [36]:
Schneider Electric (SE): Hourly and daily weather observations and forecasts from official stations from 2010 to the present.
Planet: High-resolution multispectral satellite imagery data (PlanetScope product) with a global geographical scope and a history from 2009 to the present. The Analytic PlanetScope products provided by Planet are four-band (RGB, NIR—Near Infrared Reflectance -) high-resolution images, with a ground sample distance (GSD) of 3 m.
Orange: Call Detail Records are data collected at communication events that store a caller identifier, a call recipient identifier, the geolocation (the location of the antenna that registered the event), temporal stamp of each user when performing a call or other type of communication and other fields to manage the call. For the D4CA Challenge, these data were aggregated to preserve privacy [37] by providing “presence” data as the count of people per antenna (the exact position was modified to avoid the allocation of the antennas) at each hour as well as the volume of call data, also with the same resolution. Data were provided for France between May 2014 and April 2015.
Crimson Hexagon (CH): Social media posts of different platforms (Twitter, Facebook, Instagram, etc.) with a global scope and with a history from 2008 to the present [38]. Temporal resolution goes down to the time stamp of the social media post. By default, spatial resolution is at the level of small administrative regions. Geolocation data are not available for keyword searches, but smaller areas can be retrieved using longitude and latitude in the query.
Additional open data sources:
DEM-SRTM (Digital Elevation Model Shuttle Radar Topography Mission) NASA: Digital Elevation Model with 30 meter resolution worldwide [39].
Google trends: The Google trends platform has a worldwide coverage and long-term history. The spatial resolution is at the level of large administrative regions [40].
LANDSAT: Multispectral, medium resolution (15 to 60 m) ETM+ Landsat7. The temporal resolution is 16 days [41].
All data sources are summarized in Supplementary Table S1.

2.3. Framework to Interconnect Data Sources throughout Disaster Management

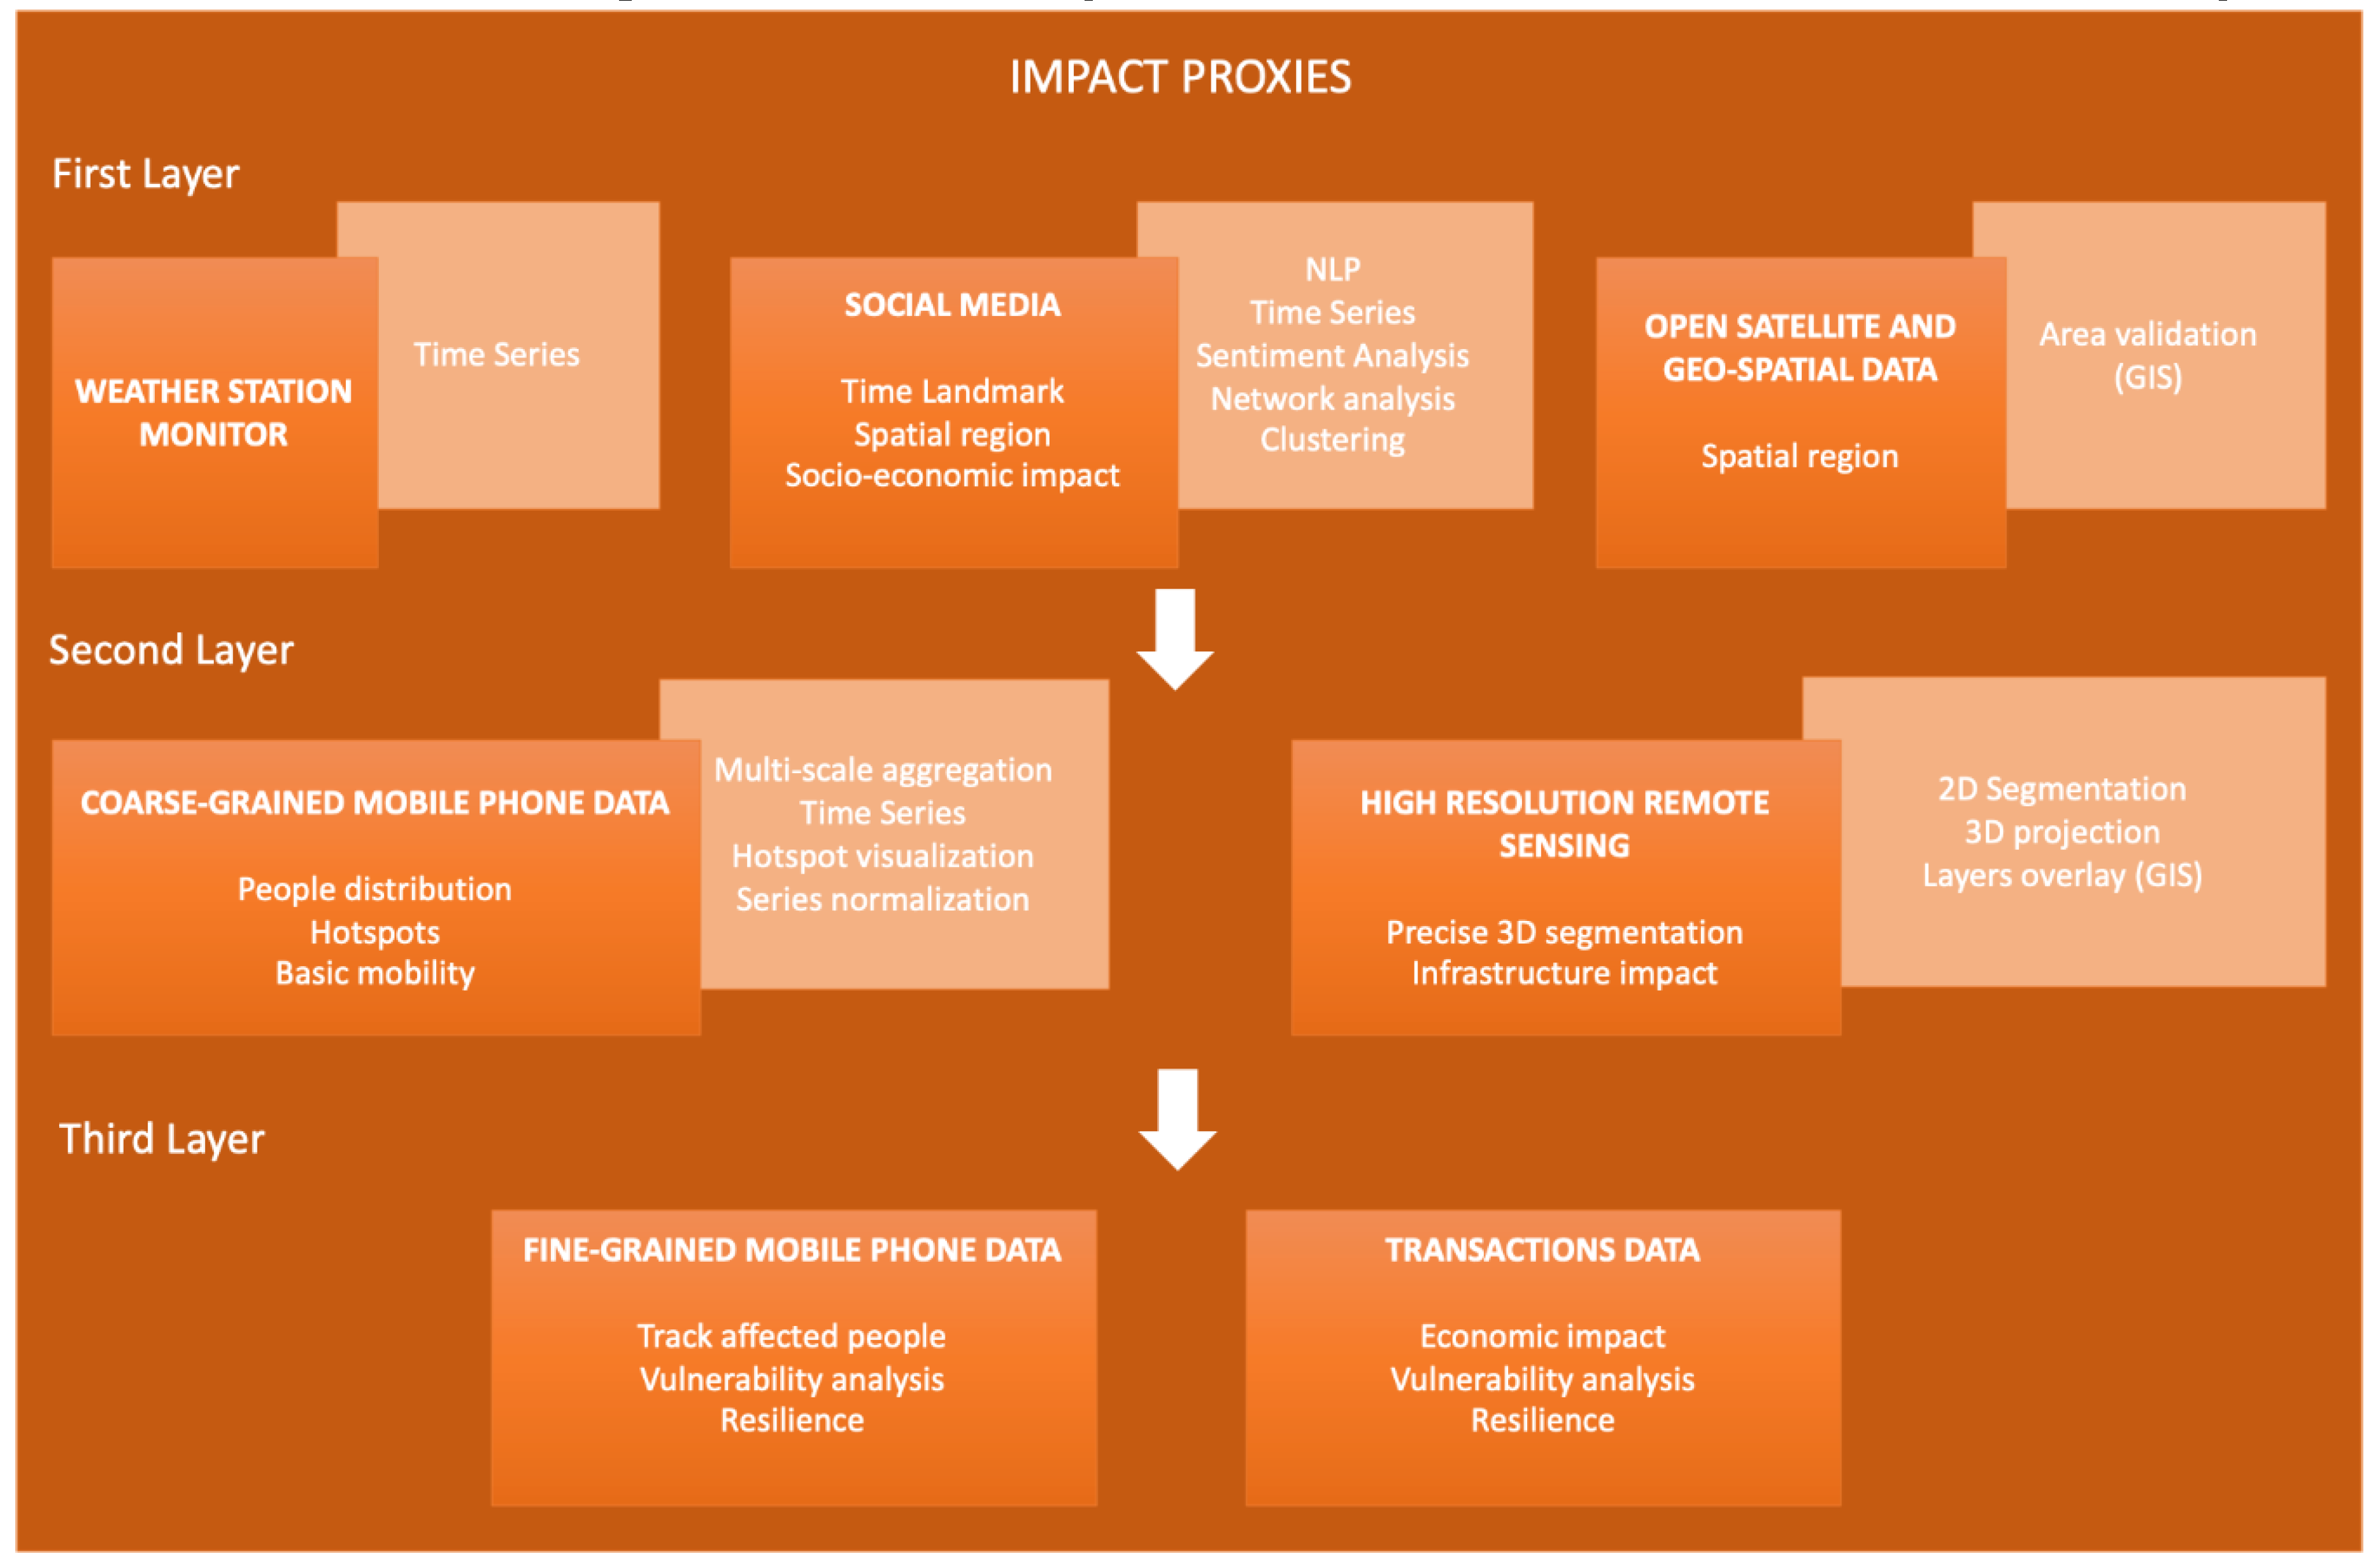
We propose a multi-dimensional impact assessment framework based on proxies implemented with heterogeneous data sources (Figure 1). The framework has different layers of data depending on the granularity, availability, and privacy level. The purpose of this design is that upper layers feed the bottom layers with evidence to unlock mechanisms to access privacy-sensitive and business-sensitive data. This is a way to favor public–private data collaboratives in a transparent way [42] and promote an ethical and responsible use of sensitive data for disaster response.
The first layer is composed of social media data and open satellite imagery. Social media data can be freely retrieved from several platforms, such as Twitter, and analyzed in real-time, so they are affordable and can be implemented without risks of privacy or ethics. In this work, we used social media data retrieved from the Crimson Hexagon platform, as described in the previous section. The output of the social media module provides a temporal landmark, a target spatial region, and proxies of socio-economic impact of the disaster.
Social media proxies are a product several factors: Awareness of the population regarding the flood, physical conditions of the flood (e.g., rainfall levels and duration), baseline behavioral patterns, penetration of social media use, cultural factors in the use of social media, and psychological factors such as fear. These proxies can be treated statistically to detect hotspots of activity. The dynamics of the perception characterize the temporal landmark of the flood. This means that the awareness of danger can anticipate the disaster or can follow it depending on the nature of the disasters. Potentially, the temporal resolution of this indicator can be hourly or even higher, but the volume of posts may not be sufficient to provide a robust indicator. The CH platform provided the indicator with a daily temporal resolution, posing a limitation for the study. A target spatial region can be derived from the geolocation of the hotspots—sets of coordinates of posts. This spatial characterization is suitable to identify geoclusters that require further attention, but cannot provide the entire affected region due to the limited sampling of social media posts. The spatial landmark can be validated with satellite imagery that has lower temporal granularity (weekly resolution). The proxy of social impact is based on the magnitude of the hotspots compared to the rest of the volume of posts.
Social impact proxies are the first step to planning and optimizing response in combination with needs assessment [5]. In addition, social impact complements the traditional quantification of physical impact on infrastructures and buildings, but requires more time to be assessed. The spatial region can help provide a proxy of socio-economic impact by overlaying geospatial resources of distribution of people, transportation, public services, or buildings.
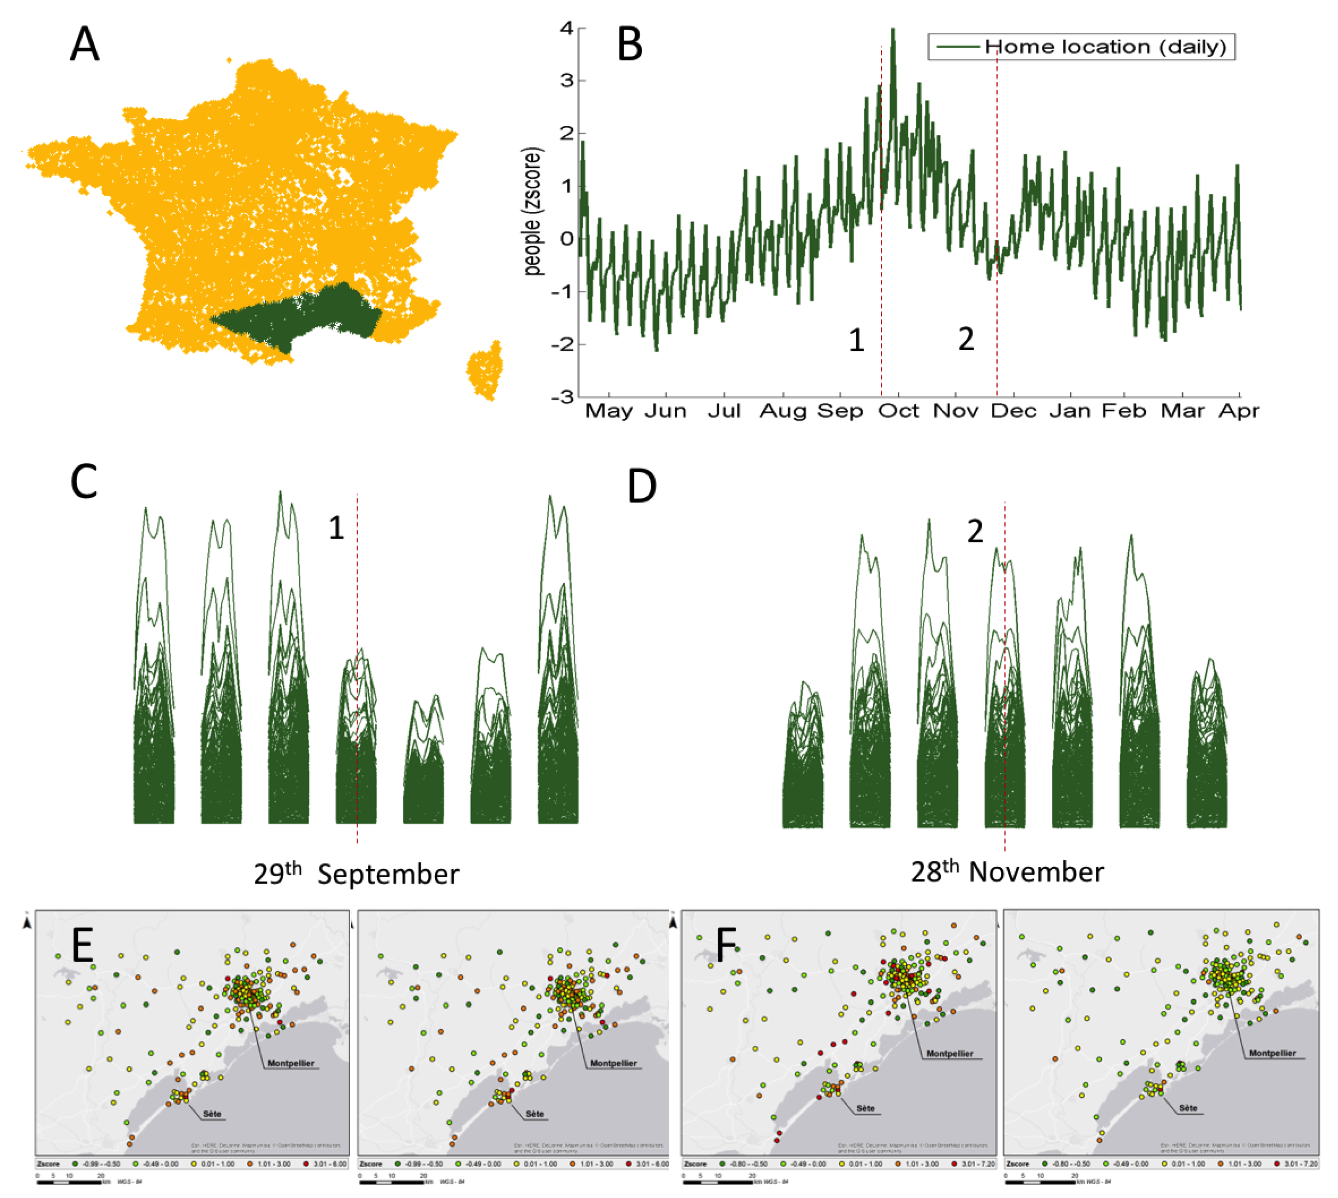
The first layer provides indicators to trigger response mechanisms as early as the sentiment in social media reflects the potential impact of the flood (Figure S1). We have implemented this layer for the four flood cases. The second layer is composed of coarse-grained aggregates of private data, which are privacy-conscious [34], but require infrastructure and agreements to be used in real-time. Mobile phone data have proved useful to observe the dynamics of disasters; however, many resolution and aggregation strategies are possible. In this framework, the second layer is based on “presence” data that aggregate individual data at the level of geolocated antennas to avoid privacy and reidentification risks. These data are the simplest data aggregate that can be produced with sufficient temporal and spatial resolution at the cost of population aggregation. Mobile phone data aggregates can be used to confirm the detection, assess the distribution of people, and calibrate the proxies of impact. In addition, high-resolution images from private sector organizations help refine the results of flood segmentation provided by the first layer. We have implemented this second layer for the flood case of Montpellier, where Orange data were available within the D4CA Challenge.
Finally, the third layer would be composed of fine-grained private data. The results from the second layer would provide evidence to unlock this data, which implies higher risk and cost, but is justified based on its utility for a better response against the disaster [33]. This layer would enable the analysis of the impact of the disaster in different population groups and track the affected population to estimate the resilience against the disaster [43]. In other words, this layer would help in implementing mitigation, relief, and recovery plans, as well as allowing evaluation of and learning from the disaster. This layer was not implemented in this work due to the lack of data availability in the cases studied.

2.4. Proxy Indicators

2.4.1. Rainfall Levels

The historic profiles of rainfalls in the affected areas were built using the Schneider Electric web service. For a given geolocation provided in a query, the service selects the closest station with a distance criterion and returns the data along the time interval requested with a daily resolution. We defined an approximate reference geolocation for each flood case using Geographical Information System (GIS) and built a time series with daily resolution for an interval of time of several years for each location.

2.4.2. Social Media Activity

We used Google trends to assess the representativeness of flood-related keywords at a country scale within a given temporal window (Figure S2). The results showed that when a large disaster occurs, such as the one in southern France in 2014, the use of specific keywords is sufficiently representative to be used as the basis of a detector of the disaster in providing temporal and spatial detail. In Google trends, the keywords “meteo”, “inonder”, and “assurance” were used for a national-level search in France that highlighted the region of Montpellier as expected (Figure S2).
Data provided by Crimson Hexagon were used to make social media analysis during floods. The social media platforms available via CH are Twitter, Google+, Blogs, Reddit, Forums, and Tumblr. However, only data from Twitter and Google+ were retrieved for this study. No metadata of users were collected. We used “buzz monitors” from the “ForSight” tool of the CH platform to retrieve posts according to geolocations and keywords. We describe the proxies used below:
Flood detection proxy: This proxy represents the volume of posts over time after filtering posts by region and keywords. We used simple and very specific keywords to avoid retrieving posts not related to floods: Flood, weather, rain, water, and river. The translation from Spanish and French was used for the floods occurring in non-English-speaking countries. The location was filtered using the CH platform filters to the smallest region available that enclosed the flood, which was at the level of the department. The social media platform with the most collected posts was Twitter (Figure S6).
Damage proxy: This proxy represents the volume of posts over time after filtering posts by region and keywords. Again, we used a small set of keywords to be restrictive in the posts retrieved: Insurance, property, and damage. The translations from Spanish and French was used for the floods occurring in non-English-speaking countries.
Keywords are summarized in Supplementary Table S2. Additionally, the total volume of posts was computed by filtering posts by geolocation using a bounding box and the longitude and latitude parameters as keywords for the search in the CH platform. Of note, the Global Positioning System (GPS) search was not compatible simultaneously with the keyword search.
The social media proxies were normalized by the total number of posts in the same region and the same temporal window for all cases. Additionally, when mobile phone data were available and to compensate for potential people distribution changes between normal periods and the disaster period that affect the representativeness of the proxy, the proxy was also normalized by the dynamic census computed from the CDRs.
The representativeness was assessed by gathering the posts one day before and after the day of the peak in the detection proxy. We used this temporal interval to normalize in time the number of posts containing target keywords compared to the total number of posts. Demographic representativeness was qualitatively assessed by filtering the number of unique users from the total number of posts during the interval of time of three days compared to available open data from census.
Sentiment and emotion analysis was performed using the readily available modules of the “ForSight” tool of CH (Figure S7).

2.4.3. Social Network Analysis from Social Media Posts

The CH platform allowed the retrieval of the original contents of posts, limited to a random sample of 10,000 posts for each case study. Although posts from some social media platforms can be openly accessed via APIs (e.g., Twitter), they are limited in time. The historic database of CH allowed retrieval of posts for all of the cases considered.
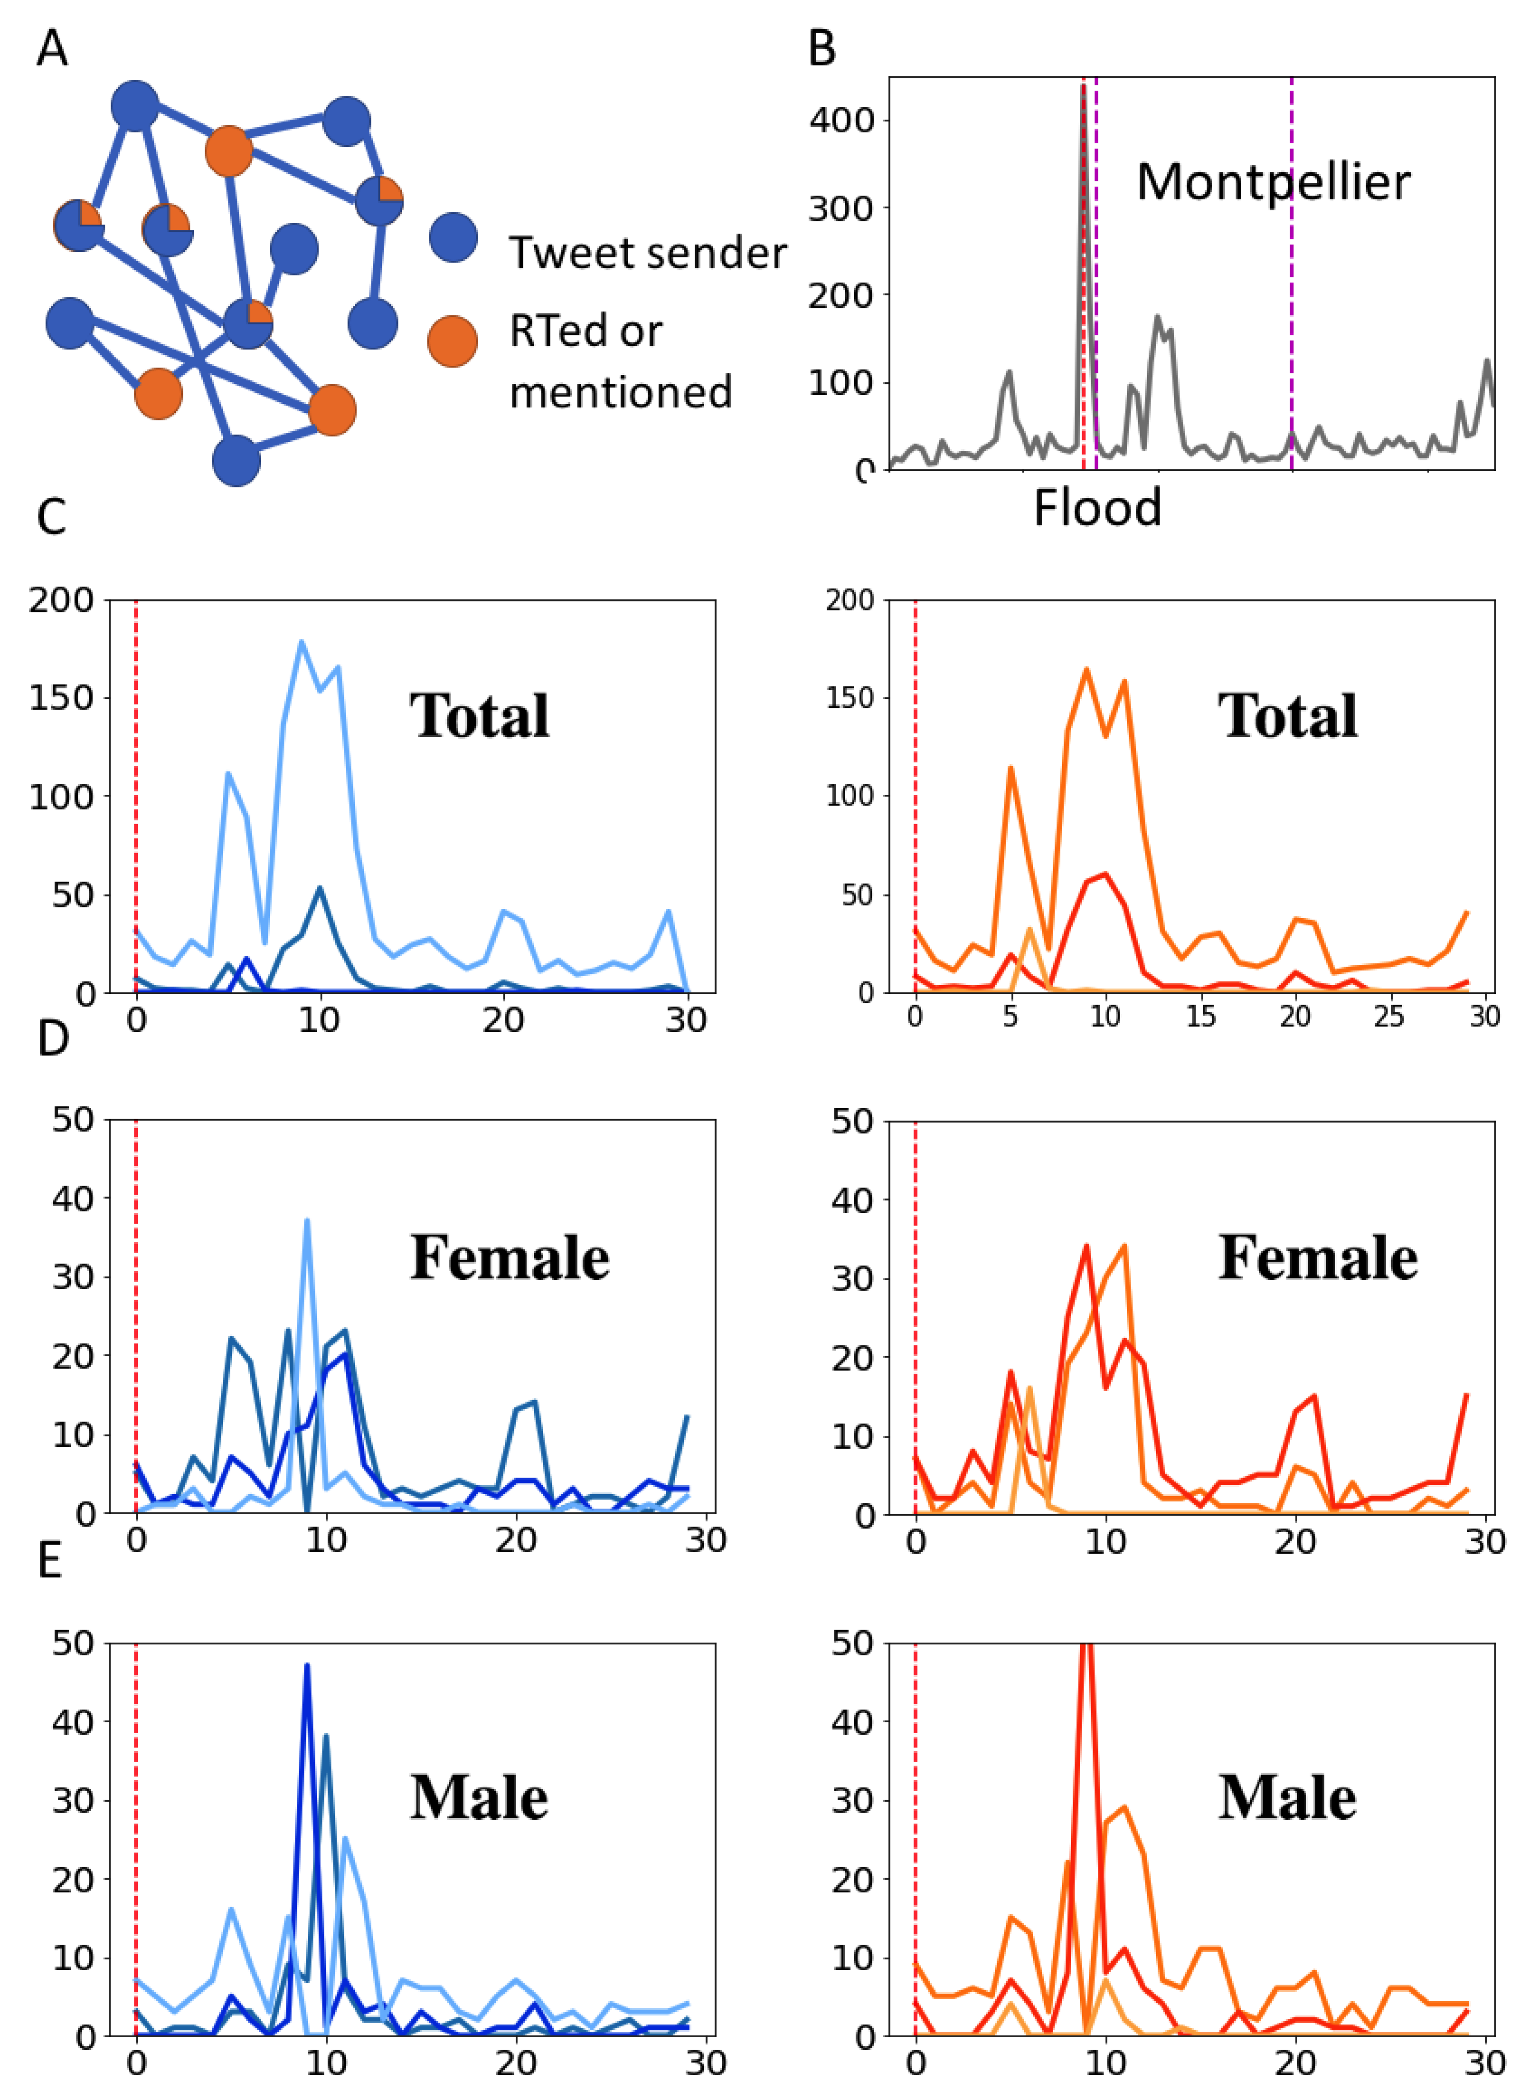
We modeled the interactions through social media posts as a network. A time series of graphs was built by creating a graph for each day during the 30 days after the detection of the flood by the detection proxies. Two types of nodes were differentiated: Users making posts and users being retweeted or mentioned in the posts. The number of posts referenced between users defined the weights of the links between the nodes. We used these graphs to measure the dynamics of the links established through the posts. We introduced directionality in the links by differentiating the posting nodes (sources of information) and the mentioned or retweeted nodes (sinks of information). We also differentiated each node by the gender of the user so the dynamics of the network could be disaggregated by gender (Figure 4 and Figure S8).
We then vectorized the pattern of activity of each user to have a time-evolving vector of connections established by him/her as a poster or retweeting user. We also performed this vectorization for nodes classified by gender to characterize potentially different patterns between female and male users. In order to provide a suitable classification, we performed k-means clustering based on the distance between vectors for male- and female-labeled nodes. The result was three different profiles, as the average of each cluster resulted in a single characteristic vector for each type of node (male and female) that summarized the characteristic temporal patterns.

2.4.4. Population Concentration

Mobile phone data (Orange) were fully anonymized and aggregated at the level of antennas for the D4CA Challenge so that they were privacy-secured, and the re-identification of users was not possible. The data consisted of both volume of calls and presence data aggregates. Of note, this aggregation of Call Detail Records does not allow the reconstruction of social networks or mobility of users [13].
In order to understand the impact of the flood on population distribution, we built a temporal multi-resolution description of people concentration based on the presence data at the antenna level with two different temporal resolutions based on the z-score of the presence time series.
Daily resolution: This resolution was used to assess the dynamic population changes due to mobility caused by the disaster. It serves as an initial timely proxy of the number of affected people as an alternative to surveys. The daily aggregation of the presence data was computed in two different ways: (1) By averaging the presence within a day and (2) by selecting an interval of hours (e.g., home location during 20:00–23:00) to accumulate the presence data. The computation based on the daily average was finally used in this work. This resolution was also used as a dynamic census to normalize social media proxies, introducing a geo-temporal correction factor of the population concentration.
Hourly resolution: This resolution was suitable to estimate the anomalies in the population movements immediately caused by the flood. Once the reference day of the flood was detected using proxies, we selected a temporal window (from two prior to two posterior days) to measure population movements during the disaster. Night hours of inactivity (1 am–8 am) were discarded.

2.4.5. Physical Impact

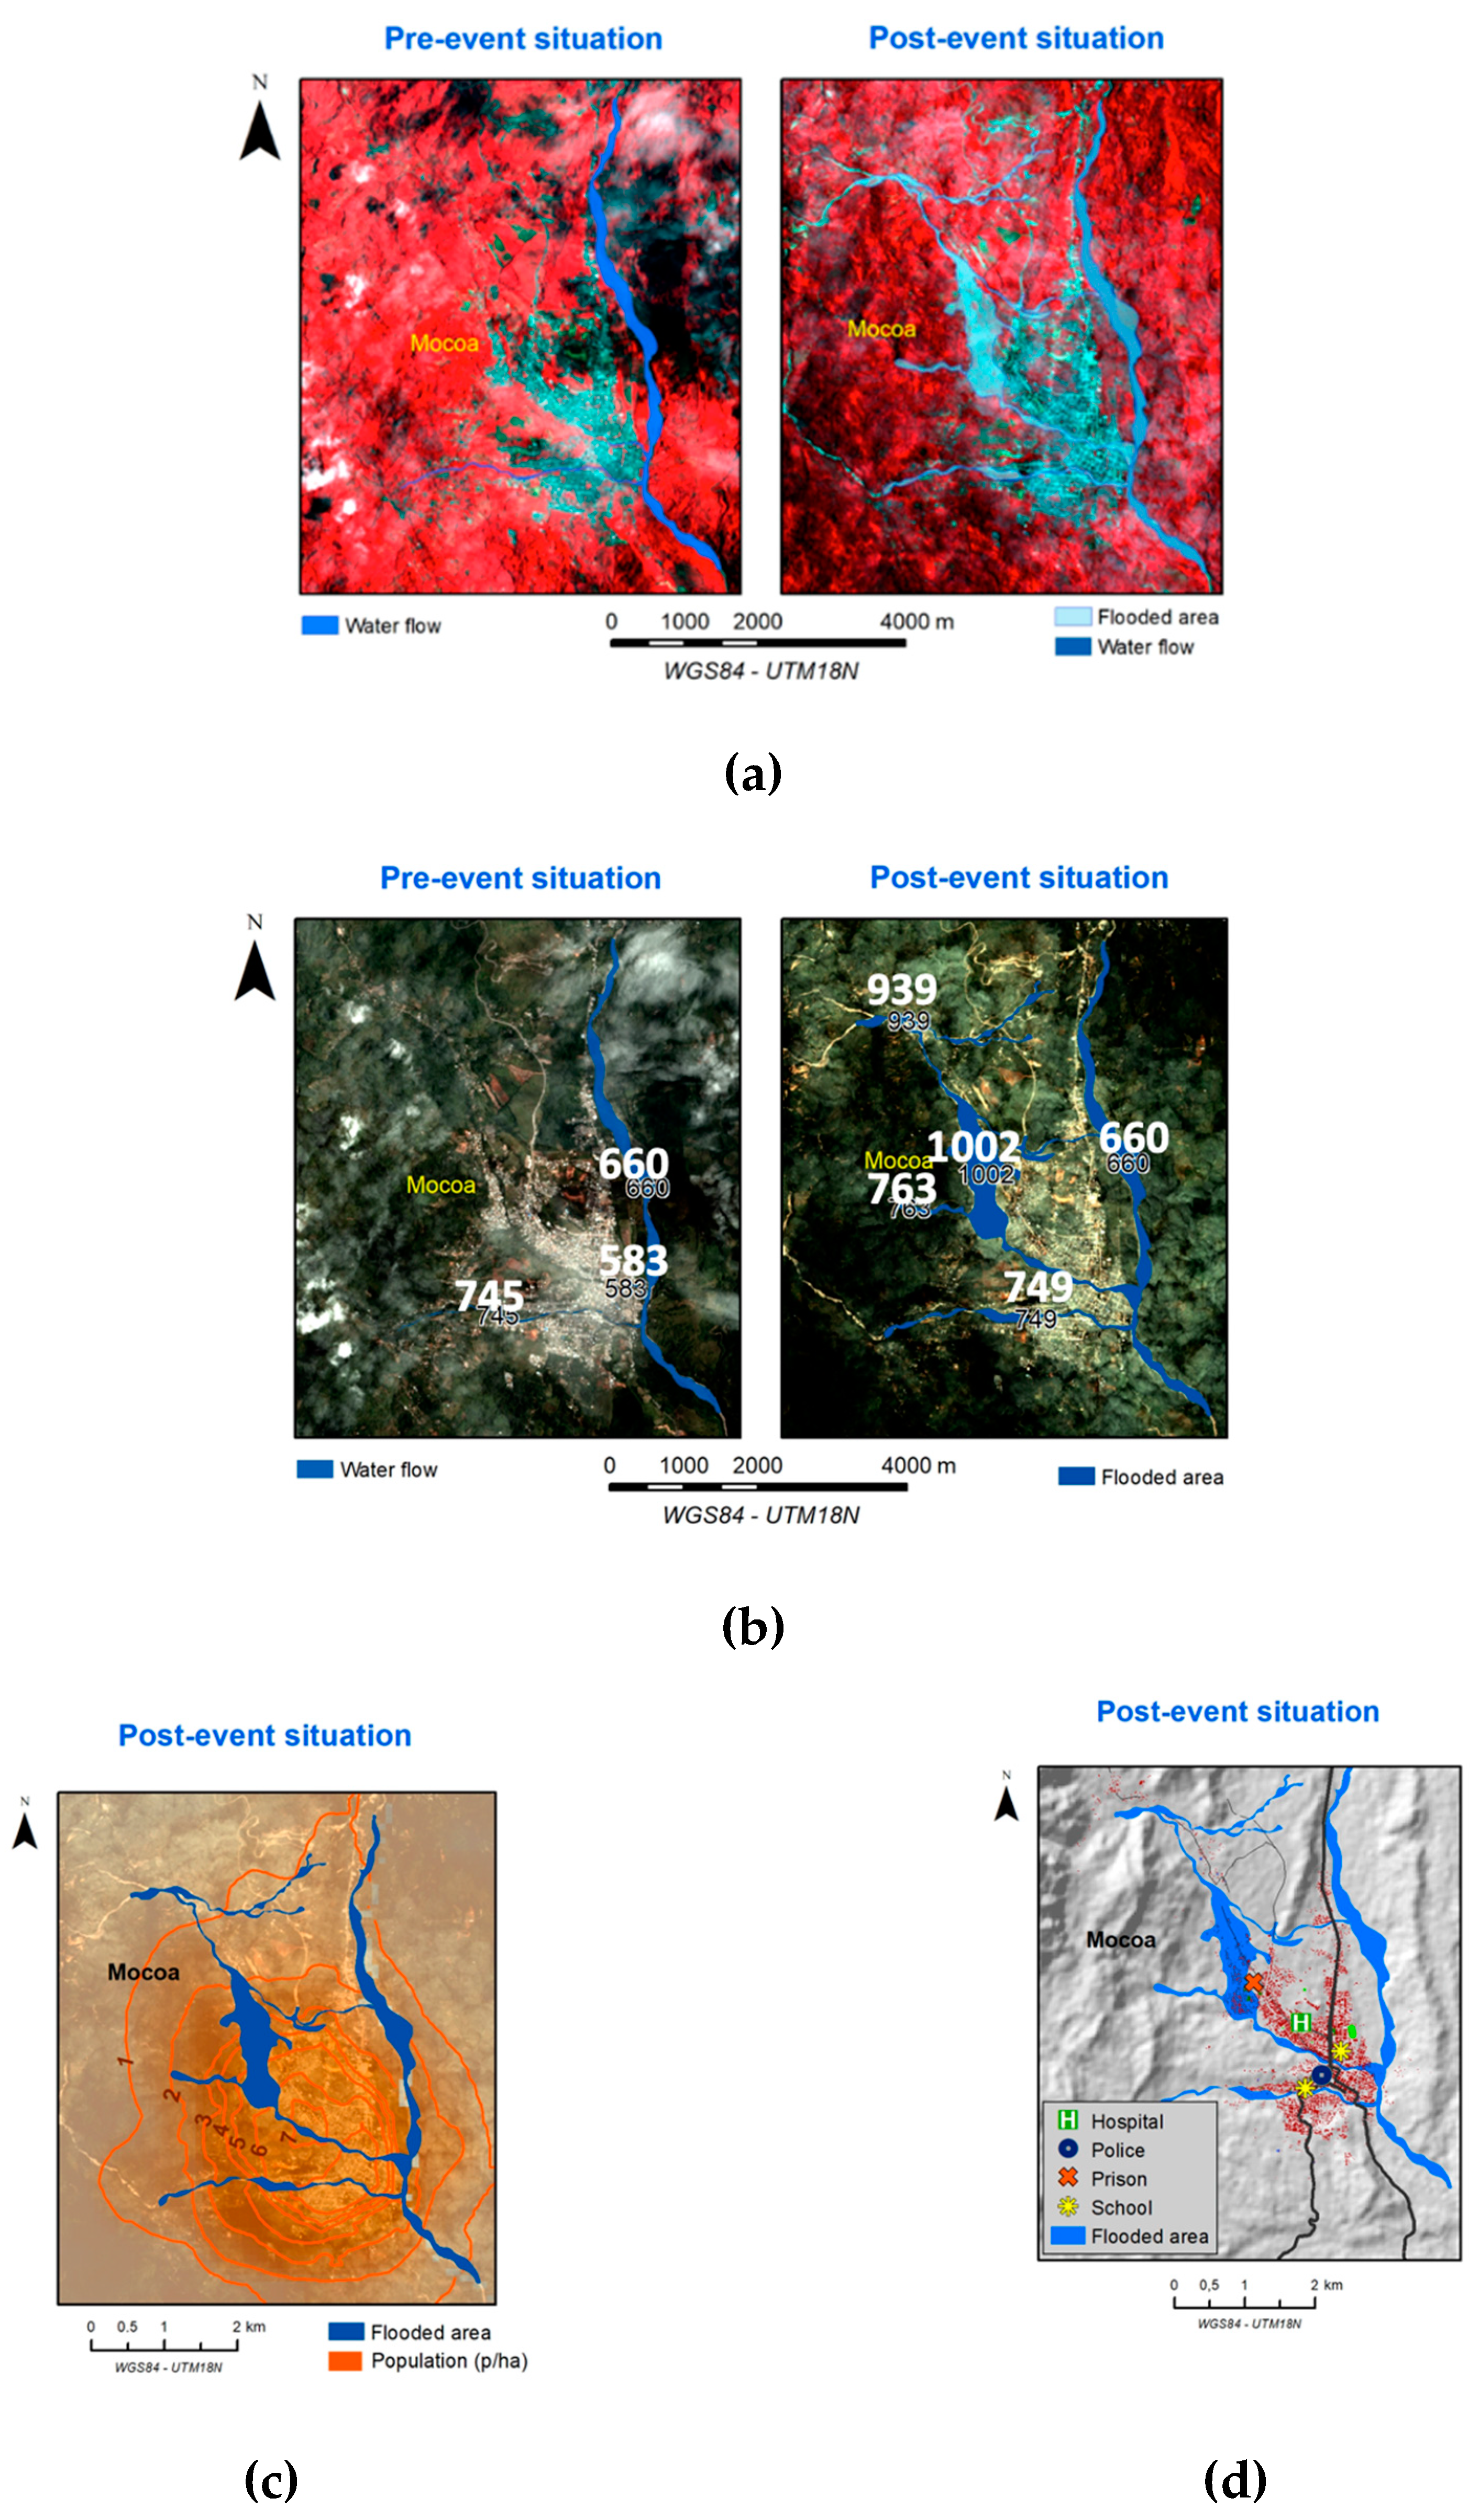
Physical impact is here characterized in terms of the flooded area and the level of water. We made a segmentation in quasi-3D in two steps: First, an area extraction based on satellite images (Planet data) and, then, a depth estimation crossing the extracted area with the relief determined by a standard Digital Elevation Model (DEM-SRTM Nasa). The quasi-3D segmentation was visualized as a 2D area with samples of depth in selected points.

2.5. Flooded Area Estimation through Satellite Imagery Analysis

The satellite images (Planet) were collected through an interactive platform made available for the D4CA Challenge. Images were downloaded upon request interactively by drawing a polygon as the region of interest. The analytic PlanetScope products provided by Planet are four-band (RGB, NIR) high-resolution images, with a ground sample distance (GSD) of 3 m [
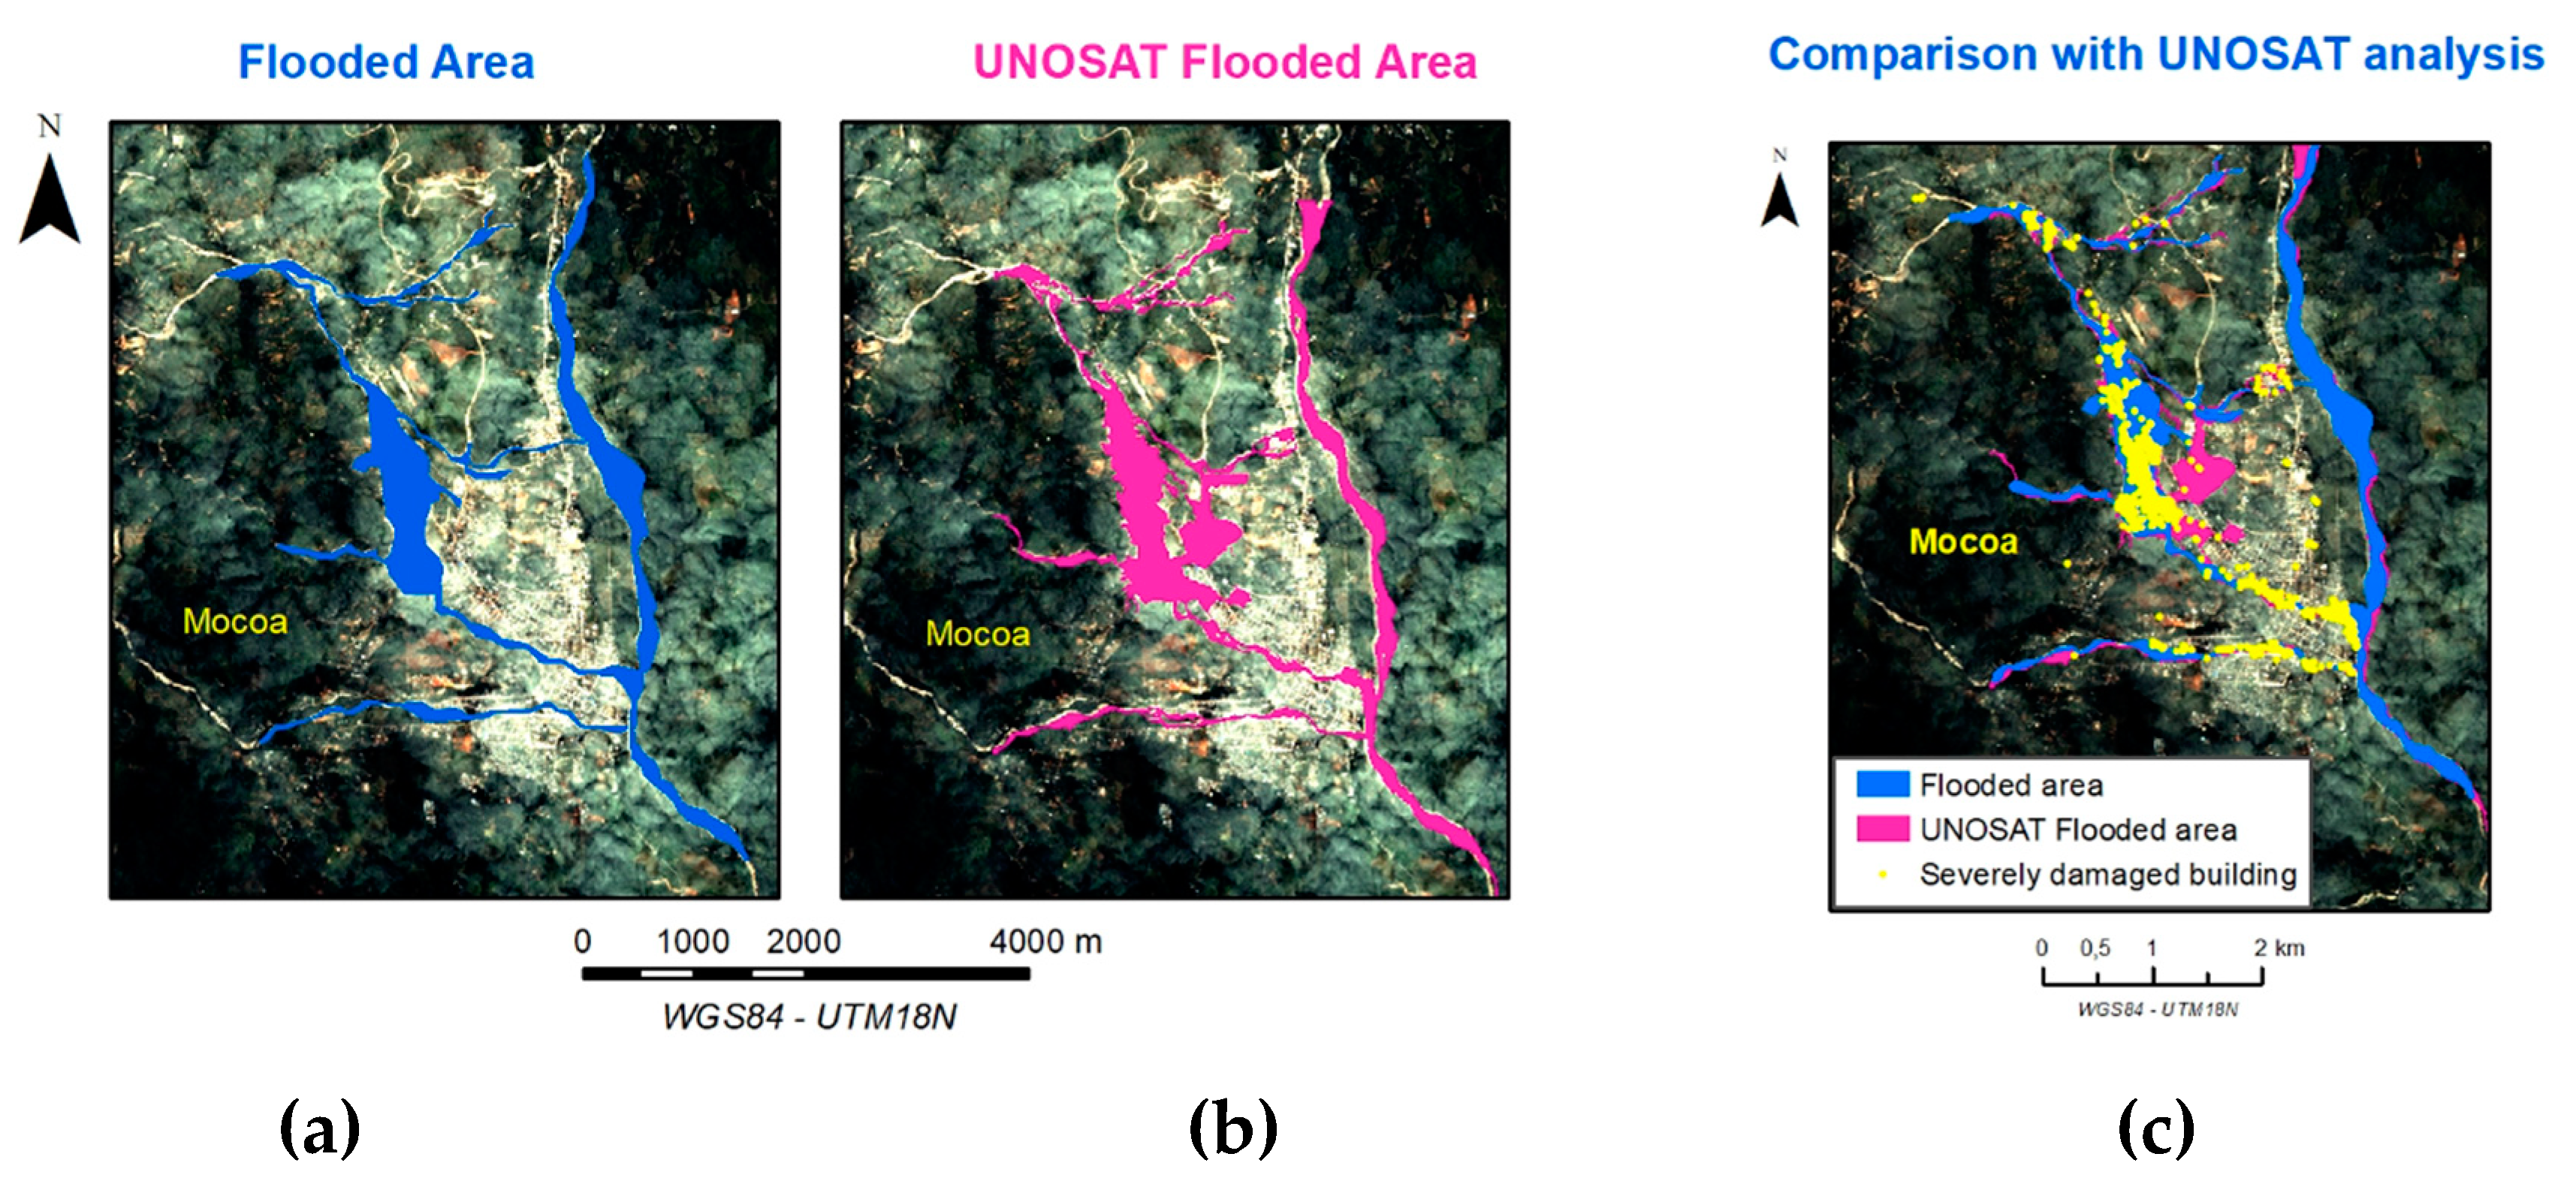
44]. These characteristics, along with the rather low cloud cover rate (0–25%), allowed for direct photointerpretation. The temporal resolution depended on the geographical locations, ranging from two to four weeks between consecutive images. To estimate the flooded area, we selected two images, before and after the dates registered for the floods, thus making change detection between the pre- and post-event situations.
The images were analyzed within a Geographical Information System, ESRI arcGIS [45]. Two band combinations were interchanged, as is needed for photointerpretation: True color (Red = band 3; Green = band 2; Blue = band 1) and infrared (Red = band 4; Green = band 3; Blue = band 2). The infrared combination highlights water bodies in light blue, making it easier to identify flooded areas. Water bodies were digitized in pre- and post-event images to create two hydrography polygon layers. Then, the flooded area was obtained by overlaying both polygons and performing a subtraction so that its surface could be measured.

2.6. Flooding Depth Estimation Using Digital Elevation Model (DEM)

We fed the GIS with the open Digital Elevation Model SRTM (Shuttle Radar Topography Mission—NASA) with 30 meter resolution to estimate the depth of the flooding based on the topography. This DEM was available as raster data, pixel-level image data with a georeference, that were downloaded from the USGS Earth Explorer.
The hydrography layer was obtained by analyzing satellite data pre-event with the GIS to segment the normal hydrography as a geometry. The hydrography layer (pre-event) and the flood area layer (post-event) were projected over the DEM to convert them into 3D data by adding the z-component to the x,y data of the layers. Then, both 3D layers were superimposed to compare their depth in order to estimate the flood elevation. For visualization, the z-components were extracted to obtain the mean, maximum, and minimum altitude of each river course and flooded area at specific geographical samples. Thus, by comparing pre- and post-event images and depth estimations, we could evaluate the river rise and water body levels.

3. Results

3.1. Detection and First Assessment of Impact

We compared the rainfall estimation obtained from the SE service with the detection proxy computed from social media data extracted from the platform of CH (Methods). Peaks in the rainfall estimation and the detection proxy were synchronized for floods due to torrential rainfalls in the affected areas: Montpellier (France) in September and November 2014 and Houston (USA) in August 2017 (Figure 2, Figure S3). The detection proxy of the floods in Montpellier was improved by the normalization with the dynamic census computed from presence data at a daily resolution derived from the CDRs (Methods, Figure S4). The population significantly changed between the two floods, so the normalization allowed for the compensation of the population distribution and the detection proxy provided a clear detection of the second flood as well (Figures S4 and S5).
Peaks in the detection proxy were present during floods due to overflow (Mocoa, April 2017), where no rainfall measurement could provide a timely detection (Figure 2). In Dakar (Senegal), a peak on 7 August 2013 and other peaks during September were observed, indicating potential floods, although there was no evident peak in the rainfall estimation throughout the year as well. This observation was consistent with humanitarian reports in the area [46], but they did not provide a clear temporal mark, as shown by the detection proxy. Overall, it was observed that the detection proxy derived from social media posts was a suitable warning indicator that can be used in floods produced by localized rainfalls or by overflows of water bodies and currents. Thus, the proxy is suitable to trigger a response and call the second layer of data described in the framework.
The representativeness of the proxies was analyzed by considering the number of detected posts around the peaks detected and performing a normalization in time (Methods). It was found that the detection proxy had 30–50% of representativeness, except for Mocoa, where very few posts could be retrieved (Table S3). The representativeness of the users compared to the total population was assessed by filtering the number of posts in comparison with the census. It was concluded that the representativeness varied depending on the location.
The ratio of volume of posts in the detection proxy is itself a proxy of impact. However, we proposed another proxy, the damage proxy (Methods), to distill complementary and fast information of the socio-economic impact of the flood [26]. The damage proxy was used to observe how many people were concerned about insurance or damages to properties because of the floods. As shown in Figure 3, this proxy revealed larger variability depending on the location compared to the detection proxy. The Montpellier floods caused a slight increase in the proxy 10–15 days after the floods. The damage proxy during the Mocoa flood featured noisy behavior with apparently random peaks, as well as during the flood in Dakar area. The Houston flood showed a clear peak in the damage proxy that was nearly synchronized with the awareness proxy. These results suggested that the damage of the flood as perceived by the population depends on many factors, especially economic and cultural; for instance, the number of insurance policies or the existence of heterogeneous uses of social media depending on the location. Compared to the detection proxy, presumably triggered by immediate fear of lives, the concern about property damage and its timing largely depends on the cultural and socio-economic factors of the country where the flood occurs. We also performed sentiment analysis (Figure S7), but due to the short lengths of posts and the types of words used, the results showed that there was not a specific sentiment—neither positive nor negative.

3.2. Social Network Short-Term Dynamics

We performed a network analysis to measure the dynamics of the social net as seen from the activity of social media users (see Figure 4). Posts allowed the reconstruction of the links created by the social media users as they were posting, replying, and retweeting. For the Montpellier floods, we gathered 8128 valid posts from the 11,123 available from the CH platform during a period going from the peak in the flood detection proxy to one month later (Methods). A total number of 1922 users posted those 8128 posts, from which 545 were female users.
A network model differentiating between posting users (blue) and mentioned or retweeted (orange) users (Methods, Figure 4A) was used to analyze the linking dynamics in the month after the flood (Figure 4B). We performed a profiling of users by taking their individual temporal profiles for both posting behaviors and retweet/mention profiles over time and applying unsupervised clustering to the profiles to find similar behavioral patterns (Methods). The result is a classification of temporal sinks (retweeted) and sources (posting) of post activities referred to the users.
Figure 4C showed the classified temporal profiles (blue and orange with different color levels) of posting users (blue-scale) and also the mentioned and retweeted users (orange-scale) for the Montpellier floods. Blue profiles represented temporal sources of activity, whereas orange profiles represented temporal sinks of activity. Profiling was also disaggregated by gender (Figure 4D for female and Figure 4E for male users). We observed that the profiles of both types of nodes are very similar (Figure 4C left and right), indicating some level of collective network response where the increasing activity is distributed in specific user groups. Narrowing down to the gender disaggregation, the interconnections created by the female users and male users showed some variability. While links by male users were more concentrated as temporal peaks, the links created by female users spanned more days. In both cases, blue and orange profiles are rather similar, supporting the hypothesis of concentration of activity in specific users. These results suggested some level of collective intelligence and gender-related behavioral patterns in how society reacts to disasters. However, the results are also very dependent on the geolocation, the culture, and the user patterns (Figure S10). These results could be used to create social safety nets by using major information hubs supported by leading nodes of the networks (user groups) to increment resilience.

3.3. Multi-Scale Population Distribution Dynamics During Floods

Daily aggregates of presence data provided by Orange were used to obtain a baseline of the dynamic census for the flood in Montpellier. These data were provided for the D4CA Challenge; however, their coarse aggregation makes them reasonable to be streamed in real-time if the detection proxy highlights a potential disaster. This would be a second layer of data in the early warning mechanisms and implies stable data-sharing agreements for coarse-grained data between humanitarian stakeholders and mobile phone operators.
The region of interest was selected by filtering antennas using a geo-polygon selected with a graphical interface provided by Planet (Figure 5A). The daily aggregated signal was used to observe large-scale variations in the populations due to seasonal behavior and also potential reallocation produced by the floods, as shown in Figure 5B. Once the floods in Montpellier were detected, higher granularity (hourly) presence data were used for monitoring the movements of affected population during the disasters two days before and after the date indicated by the awareness proxy (Figure 5C,D)). Presence data during the night (1–8 am) were disregarded because they introduced noise in the computation of the z-scores due to the very low activity.
We observed a very different behavior during the first and the second floods in Montpellier, which may be influenced by the large-scale modulation in the population and also by the short lapse between the two floods (Figure 5C,D). During the first flood, we observed that the population concentration decreased as opposed to the behavior observed in other flood studies [22]. The socio-economic level of the region and the transportation infrastructure level seemed to be determining factors for the underlying mobility during the disaster. Ground transportation collapse could easily happen in developing countries, whereas the developed transportation infrastructure allowed a fast evacuation of the region. Fast mobility to regions away from the disaster could only be measured using trajectories crossing the affected area [43,47]. However, trajectories cannot be reconstructed from presence data. This means that a third layer of data to reconstruct fine-grained mobility should be accessed if proofs of impact and large-scale displacement are provided from coarse-grained data.
During the second flood, we observed a slightly increasing concentration of people around the day of the flood and for a few antennas (Figure 5D). Because of the difficulties in obtaining a physical impact map of the flood due to the heavy clouds in the satellite data retrieved, it was not possible to make a hypothesis about the causes of this different behavior. The socio-economic profile of population staying in the region could be an important factor for this difference, since people with more resources could easily move away from the affected area as well.

3.4. Physical Impact through Remote Sensing

An assessment of the physical impact of floods can be made in situ or through remote sensing data (see Figure 6). This analysis is key to calibrate the impact measured from social data proxies and make early impact assessments that can be translated to parameters handled by humanitarian stakeholders and policy makers more robust.
Satellite imagery from Planet was used here to assess the area impacted by the flood in Mocoa (Figure 6). Integrating the segmented area from images with a Digital Elevation Model (DEM), we computed a 3D characterization of the flood, providing both surface and elevation at different points of the flood (Methods, Figure 6). River and flood segmentations were computed from image data that were available from March 14th (pre-event) and April 10th (post-event), while the flood happened on April 1st according to the news and the detection proxy (Figure 2). This delay is critical for early warning and is an accurate assessment of impact at the peak of the flood. The segmentation was compared with a segmentation made by UNITAR (LANDSAT data) available for April 4th and April 10th (Figure 7). The flooded area on April 4th was smaller. The area on April 10th was similar, but with additional segmented water bodies, were considered to be mis-segmented due to clouds (Figures S9 and S10).
A main source of segmentation errors is the presence of clouds during storms and floods. This is a limiting factor in assessing the impact through satellite imagery, leading to over-segmentations by considering cloud shades as water bodies. Satellite data for the other flooding cases were analyzed, but the difficulties in the characterization of water in urban areas or the presence of dense clouds prevented the reproduction of equivalent results. Regarding the 3D segmentation, the geospatial resolution of the SRTM-DEM, 30 m, and the lack of standards across available DEMs for elevation values hampered a full 3D reconstruction of the flood. There are existing open data satellite imagery resources, such as LANDSAT or COPERNICUS data, that will confirm part of the first layer of data. These sources can help confirm the geographical spot initially approximated by social media proxies. A better characterization to build 3D models would require higher-resolution data, such as Planet data, which would be part of a second layer of data that could be unlocked after clear evidence from the first data layer.
Overall, remote sensing data can help to accurately characterize a spatially accurate affected region depending on the presence of clouds (Figures S9 and S10). However, the temporal resolution of publicly available earth observation data is not sufficient for standalone early warning as it is implemented in many current systems. Remote sensing data, especially with high resolution, can be related to a social dimension to obtain socio-economic impact proxies by overlaying the segmentation with geographical information, such as population density, location of public services, or public buildings (Figure 6).

4. Discussion

A prompt and planned response to a flood is key for optimizing the necessary aid and for a rapid recovery and relief. A timely and effective early response can save lives and also large amounts of resources compared to a delayed response. Considering that response planning is guided by a qualitative assessment of needs and a quantitative assessment of impact [5], the framework presented is well suited to be the basis for improvement of current mechanisms for floods to be more real-time, accountable, efficient, and socially inclusive.
The first layer, which is composed of social media proxies, derived especially from Twitter, can be implemented in real-time. These proxies provide a temporal landmark, a spatial characterization of the hotspots, and an initial assessment of the socio-economic impact based on users’ behaviors, emotions, and concerns. Thus, their utility is conditioned by several factors: Awareness of the population regarding the flood, physical conditions of the flood (e.g., rainfalls level and duration, topography, area conservation, etc.), baseline behavioral patterns, penetration of social media use, cultural factors in the use of social media, and psychological factors such as fear. However, in spite of the potential factors of variability, a consistent spike of the detector proxy was observed, which can be used for triggering response, calibrating social impact, and requesting more data to better characterize the disaster. The damage proxy was proposed to estimate the impact of disasters on properties; however, its applicability seems to depend on the social context where the disaster occurs (types of properties, culture, types of insurance, social media activity patterns, etc.). A network-based analysis of posts has shown to be useful to shed light on the social organization of the affected community, which is critical for planning response or for understanding the spread of information through specific population groups. For instance, network structure description can be applied to understand and promote resilience and safety nets.
The applicability of this layer as an early warning process is limited by the temporal resolution of the series, although it can be incremented to an hourly resolution. The suitability of this layer also depends on the nature of flood and its speed, which depend on the factors enumerated in Section 2.1. People’s fear reflected in social media can anticipate impact when there is a reasonable interval between the rainfalls and the damage. Spatially, the spots provided by social media are just seeds to focus the acquisition of better spatial data from imagery techniques (e.g., satellites, drones, etc.). In general, patterns in social media seem to be useful for measuring social structure and opinion and short-time dynamics of the population, but not long-term effects of the disaster.
The second layer, consisting of coarse-grained aggregates of private data and only applied to the floods in Montpellier, allows the refinement of the first layer as well as a better assessment of impact of the flood in terms of mid-and long-term population dynamics. It can also be used to allocate resources better with a detailed geo-temporal map and to have a better estimation of long-term effects. In addition, this layer would allow timely monitoring and evaluation of the actions taken. In addition to the “presence” data available for this work, data of user-to-user communication can be useful to measure dynamics of the social network on different scales [18] beyond the network derived from social media. This layer also comprises high-resolution satellite imagery that is available on demand with a cost. We used Planet data with high spatial resolution to characterize the flooded area in Mocoa, although the temporal resolution was coarse. Some resources provide a daily resolution that is suitable to better track the flooded area and could be explored [48].
The third layer was not implemented in this work, but it was still presented for the sake of completeness of the whole view. The framework shown was designed by considering the need for a new generation of data-driven mechanisms for disaster management. As mentioned, one of the most acknowledged challenges is the real-time access to privacy-risky data [33,34]. The higher the utility, the more confident humanitarian stakeholders can be using fine-grained data. The utility has to be proven through evidence; thus, it will unlock more data sources incrementally and in a transparent and accountable way (Figure S11).
Regarding physical indicators, we found a severe demand for ad-hoc sensing for estimating physical impact, as periodic satellite observation is not sufficient for the timely assessment of the flood dimensions. Disasters such as the earthquake in Haiti triggered, for instance, the remote crowdsourcing of geo-resource mapping or the release of very high-resolution data, such as Google eye or LiDAR (Laser Imaging Detection and Ranging). It may be necessary to have on-demand multi-modal imagery of affected areas for very high-impact disasters [49]. Depending on the presence of clouds, imagery should be provided by satellites or drones [50]. Reducing the temporal gap to image the disaster is critical, as is resolving the detection of water bodies in adverse environmental conditions or in complex geographical locations, such as cities. We also consider that current open DEMs, such as SRTM, are not sufficient for a precise segmentation of floods that may affect small villages. Future systems will be 3D with high resolution and will allow rendering of environments for the digital reconstruction of the floods, also allowing simulations of impact on infrastructures.
The ultimate goal of data-driven policymaking is to build up resilience, especially in vulnerable regions. This requires indicators across the whole cycle of disaster management [51]. Indicators have a utility beyond supporting decision-making. They can be used to generate actionable knowledge and be the driver for multi-stakeholder collaboration and civil society’s participation. In this light, we designed the proposed framework and integrated different data sources. These proxies are also necessary to evaluate aid and financial systems from two sides: Objective indicators of impact (e.g., physical impact, mobility, and networks) and subjective impact as felt by the local population (e.g., from social media and surveys). Aligning these variables would lead to a faster recovery from disasters and would avoid potential long-term damage in the society nets, such as increased vulnerability or inequalities.

5. Conclusions

This work showed that social media in combination with satellite imagery, environmental data, and real-time presence data aggregates of Call Detail Records could enhance current disaster management and provide an assessment of impact. The three layers proposed form a connected system that can increment its power by plugging in more data sources. The first and second layers were tested to assess their utility, showing important benefits for planning response, designing mitigation, and monitoring the disaster.
The third layer, which was not implemented in this work, would comprise the fine-grained data necessary to assess disaggregated behaviors in order to monitor vulnerable locations and populations. These data would also help improve all phases along the disaster management cycle: Preparedness, warning, mitigation, response, evaluation, and relief. Fine-grained analysis is also the basis of learning factors of disasters’ impacts across several situations and of improving the preparedness of humanitarian stakeholders.
Future work aims at long-term observation of social patterns to understand resilience. Important challenges are the large variability observed across cases that requires new models and the further social and analytical research needed in order to find systematic global approaches. The availability of timely data and socio-economic contextual factors was very important, but the intrinsic behavioral dynamics also prompted further study. For instance, the initial results of this work suggested that the recursiveness or the periodicity of disasters in the same region largely affected the behaviors and, therefore, the way they should be monitored to support humanitarian action.
Operationally, we work towards engaging different stakeholders using the framework as an incentive and proof of need for sharing private data. Data indicators adapted to the different phases of the disaster management cycle are the basis for a collective intelligence for disasters. We consider that civil society must play a key role in the recovery and configuration of the new social state after the crisis. This demands not only analytical tools, but also tools to interact with the society, providing key actionable insight and leveraging the analysis to understand how to spread these insights. Finally, work has to be done towards facilitating and evaluating financial streams based on evidence to stimulate the society for self-organization and recovery.

Supplementary Materials

The following are available online at https://www.mdpi.com/2071-1050/12/10/4246/s1, Figure S1: Data for disaster management, Figure S2: Keyword concentration in regions using Google trends, Figure S3: Words used in social media posts during floods in Montpellier, Figure S4: Flood detection proxy corrected with CDR aggregates, Figure S5: Volume of flood detection proxy during Montpellier floods, Figure S6: Share of social media posts, Figure S7: Sentiment analysis during floods from Crimson Hexagon, Figure S8: Network dynamics comparison in several floods, Figure S9: Satellite data of flooded area, Figure S10: Clouds in satellite data during floods, Figure S11: Protocol for data access during disasters, Table S1: Datasets, Table S2: Keywords per proxy, Table S3: Representativeness of awareness proxy, Movie S1: Mobility with weekly resolution along the floods in Montpellier, Movie S2: Mobility during Montpellier flooding 1 using Call Detail Records, Movie S3: Mobility during Montpellier flooding 2 using Call Detail Records.

Author Contributions

Conceptualization, D.P.-E.; methodology, Y.Y., P.J.Z., and D.P-E.; software, M.M.-T. and D.P.-E.; validation, Y.T., P.J.Z., and D.P-E.; formal analysis, Y.T. and D.P.-E.; investigation, Y.T., P.J.Z., and D.P.-E.; resources, P.J.Z. and D.P.-E.; data curation, Y.T., M.M.-T., and D.P.-E.; writing—original draft preparation, D.P.-E.; writing—review and editing, Y.T., P.J.Z., and D.P.-E.; Y.T., M.M.-T., and D.P.-E.; supervision, P.J.Z. and D.P.-E.; project administration, D.P.-E.; funding acquisition, P.J.Z. and D.P.-E. All authors have read and agreed to the published version of the manuscript.

Funding

This research was partially funded by “Ministerio de Economía y Competitividad” of Spain, grant number MTM2015-67396-P to P.Z.

Acknowledgments

We would like to acknowledge the UN Data for Climate Action Challenge team for organizing the Challenge and gathering the data partners. Special thanks to United Nations Global Pulse for organizing the Challenge and being advisors of the project and to their Chief Scientist Miguel Luengo-Oroz. We would also thank the Challenge partners, Western Digital and Skoll Global Threats Fund, and the Challenge data partners that shared data for this work: Orange, Schneider Electrics, Earth Network, Crimson Hexagon, and Planet. We also thank the Innovation and Technology for Development Centre itdUPM for support and collaboration. Finally, we thank the African Risk Capacity team for fruitful discussions on data for disasters. The data used in this work, including high resolution satellite imagery, was provided by data partners of the UN Data For Climate Action Challenge www.dataforclimateaction.org. Mobile phone data was fully anonymized prior being released for the Challenge. Social media data was used under terms suitable from the data partners. The use and analysis of data was approved by the Ethics and Evaluation committee of the UN D4CA Challenge. The methodology and results have been approved for peer-reviewed publication by the Challenge organizers.

Conflicts of Interest

The authors declare no conflict of interest.

References

  1. Weiss, T.G. Humanitarian Challenges and Intervention; Routledge: New York, NY, USA, 2018. [Google Scholar]
  2. CRED, U. Poverty & Death: Disaster Mortality, 1996–2015; Centre for Research on the Epidemiology of Disasters: Brussels, Belgium, 2016. [Google Scholar]
  3. Alexander, D.C. Natural Disasters; Routledge: New York, NY, USA, 2017. [Google Scholar]
  4. UNOCHA. Humanitarian Response. Available online: https://www.humanitarianresponse.info/es/programme-cycle/space (accessed on 10 January 2020).
  5. OCHA. Preparedness. Available online: https://www.unocha.org/asia-and-pacific-roap/emergency-preparedness (accessed on 10 January 2020).
  6. Pulse, U.G. Big Data for Development: Challenges & Opportunities; Naciones Unidas: New York, NY, USA, 2012. [Google Scholar]
  7. Bagrow, J.P.; Wang, D.; Barabasi, A.-L. Collective response of human populations to large-scale emergencies. PLoS ONE 2011, 6, e17680. [Google Scholar] [CrossRef] [Green Version]
  8. Bengtsson, L.; Lu, X.; Thorson, A.; Garfield, R.; Von Schreeb, J. Improved response to disasters and outbreaks by tracking population movements with mobile phone network data: A post-earthquake geospatial study in Haiti. PLoS Med. 2011, 8, e1001083. [Google Scholar] [CrossRef]
  9. GSMA, U.G.P. The State of Mobile Data for Social Good; United Nations Global Pulse: New York, NY, USA, 2017. [Google Scholar]
  10. Gonzalez, M.C.; Hidalgo, C.A.; Barabasi, A.-L. Understanding individual human mobility patterns. Nature 2008, 453, 779. [Google Scholar] [CrossRef]
  11. Candia, J.; González, M.C.; Wang, P.; Schoenharl, T.; Madey, G.; Barabási, A.-L. Uncovering individual and collective human dynamics from mobile phone records. J. Phys. A Math. Theor. 2008, 41, 224015. [Google Scholar] [CrossRef] [Green Version]
  12. Lu, X.; Wetter, E.; Bharti, N.; Tatem, A.J.; Bengtsson, L. Approaching the limit of predictability in human mobility. Sci. Rep. 2013, 3, 2923. [Google Scholar] [CrossRef] [PubMed]
  13. Zufiria, P.J.; Pastor-Escuredo, D.; Úbeda-Medina, L.; Hernandez-Medina, M.A.; Barriales-Valbuena, I.; Morales, A.J.; Jacques, D.C.; Nkwambi, W.; Diop, M.B.; Quinn, J. Identifying seasonal mobility profiles from anonymized and aggregated mobile phone data. Application in food security. PLoS ONE 2018, 13, e0195714. [Google Scholar] [CrossRef] [Green Version]
  14. Wesolowski, A.; Eagle, N.; Tatem, A.J.; Smith, D.L.; Noor, A.M.; Snow, R.W.; Buckee, C.O. Quantifying the impact of human mobility on malaria. Science 2012, 338, 267–270. [Google Scholar] [CrossRef] [PubMed] [Green Version]
  15. Wesolowski, A.; Qureshi, T.; Boni, M.F.; Sundsøy, P.R.; Johansson, M.A.; Rasheed, S.B.; Engø-Monsen, K.; Buckee, C.O. Impact of human mobility on the emergence of dengue epidemics in Pakistan. Proc. Natl. Acad. Sci. USA 2015, 112, 11887–11892. [Google Scholar] [CrossRef] [PubMed] [Green Version]
  16. Dobra, A.; Williams, N.E.; Eagle, N. Spatiotemporal detection of unusual human population behavior using mobile phone data. PLoS ONE 2015, 10, e0120449. [Google Scholar] [CrossRef] [Green Version]
  17. Bakker, M.A.; Piracha, D.A.; Lu, P.J.; Bejgo, K.; Bahrami, M.; Leng, Y.; Balsa-Barreiro, J.; Ricard, J.; Morales, A.J.; Singh, V.K. Measuring fine-grained multidimensional integration using mobile phone metadata: The case of Syrian refugees in Turkey. In Guide to Mobile Data Analytics in Refugee Scenarios; Springer: Cham, Switzerland, 2019; pp. 123–140. [Google Scholar]
  18. Boy, J.; Pastor-Escuredo, D.; Macguire, D.; Jimenez, R.M.; Luengo-Oroz, M. Towards an understanding of refugee segregation, isolation, homophily and ultimately integration in Turkey using call detail records. In Guide to Mobile Data Analytics in Refugee Scenarios; Springer: Cham, Switzerland, 2019; pp. 141–164. [Google Scholar]
  19. Gao, L.; Song, C.; Gao, Z.; Barabási, A.-L.; Bagrow, J.P.; Wang, D. Quantifying information flow during emergencies. Sci. Rep. 2014, 4, 3997. [Google Scholar] [CrossRef] [Green Version]
  20. Lu, X.; Bengtsson, L.; Holme, P. Predictability of population displacement after the 2010 Haiti earthquake. Proc. Natl. Acad. Sci. USA 2012, 109, 11576–11581. [Google Scholar] [CrossRef] [PubMed] [Green Version]
  21. Wilson, R.; zu Erbach-Schoenberg, E.; Albert, M.; Power, D.; Tudge, S.; Gonzalez, M.; Guthrie, S.; Chamberlain, H.; Brooks, C.; Hughes, C. Rapid and near real-time assessments of population displacement using mobile phone data following disasters: The 2015 Nepal Earthquake. PLoS Curr. 2016, 8. [Google Scholar] [CrossRef] [PubMed]
  22. Pastor-Escuredo, D.; Morales-Guzmán, A.; Torres-Fernández, Y.; Bauer, J.-M.; Wadhwa, A.; Castro-Correa, C.; Romanoff, L.; Lee, J.G.; Rutherford, A.; Frias-Martinez, V. Flooding through the lens of mobile phone activity. In Proceedings of the IEEE Global Humanitarian Technology Conference (GHTC 2014), San Jose, CA, USA, 10–13 October 2014; pp. 279–286. [Google Scholar]
  23. Llorente, A.; Garcia-Herranz, M.; Cebrian, M.; Moro, E. Social media fingerprints of unemployment. PLoS ONE 2015, 10, e0128692. [Google Scholar] [CrossRef] [PubMed] [Green Version]
  24. Morales, A.; Borondo, J.; Losada, J.C.; Benito, R.M. Measuring political polarization: Twitter shows the two sides of Venezuela. Chaos Interdiscip. J. Nonlinear Sci. 2015, 25, 033114. [Google Scholar] [CrossRef] [Green Version]
  25. Morales, A.J.; Dong, X.; Bar-Yam, Y.; ‘Sandy’Pentland, A. Segregation and polarization in urban areas. R. Soc. Open Sci. 2019, 6, 190573. [Google Scholar] [CrossRef] [Green Version]
  26. Kryvasheyeu, Y.; Chen, H.; Obradovich, N.; Moro, E.; Van Hentenryck, P.; Fowler, J.; Cebrian, M. Rapid assessment of disaster damage using social media activity. Sci. Adv. 2016, 2, e1500779. [Google Scholar] [CrossRef] [Green Version]
  27. Torres, Y.; Arranz, J.J.; Gaspar-Escribano, J.M.; Haghi, A.; Martínez-Cuevas, S.; Benito, B.; Ojeda, J.C. Integration of LiDAR and multispectral images for rapid exposure and earthquake vulnerability estimation. Application in Lorca, Spain. Int. J. Appl. Earth Obs. Geoinf. 2019, 81, 161–175. [Google Scholar] [CrossRef] [Green Version]
  28. Jean, N.; Burke, M.; Xie, M.; Davis, W.M.; Lobell, D.B.; Ermon, S. Combining satellite imagery and machine learning to predict poverty. Science 2016, 353, 790–794. [Google Scholar] [CrossRef] [Green Version]
  29. Steele, J.E.; Sundsøy, P.R.; Pezzulo, C.; Alegana, V.A.; Bird, T.J.; Blumenstock, J.; Bjelland, J.; Engø-Monsen, K.; de Montjoye, Y.-A.; Iqbal, A.M. Mapping poverty using mobile phone and satellite data. J. R. Soc. Interface 2017, 14, 20160690. [Google Scholar] [CrossRef]
  30. Pokhriyal, N.; Jacques, D.C. Combining disparate data sources for improved poverty prediction and mapping. Proc. Natl. Acad. Sci. USA 2017, 114, E9783–E9792. [Google Scholar] [CrossRef] [Green Version]
  31. De Montjoye, Y.-A.; Hidalgo, C.A.; Verleysen, M.; Blondel, V.D. Unique in the crowd: The privacy bounds of human mobility. Sci. Rep. 2013, 3, 1376. [Google Scholar] [CrossRef] [PubMed] [Green Version]
  32. De Montjoye, Y.-A.; Radaelli, L.; Singh, V.K. Unique in the shopping mall: On the reidentifiability of credit card metadata. Science 2015, 347, 536–539. [Google Scholar] [CrossRef] [PubMed] [Green Version]
  33. Pulse, U.G. Mapping the Risk-Utility Landscape: Mobile Data for Sustainable Development and Humanitarian Action; Global Pulse Project Series no18; United Nations Global Pulse: New York, NY, USA, 2015. [Google Scholar]
  34. De Montjoye, Y.-A.; Gambs, S.; Blondel, V.; Canright, G.; De Cordes, N.; Deletaille, S.; Engø-Monsen, K.; Garcia-Herranz, M.; Kendall, J.; Kerry, C. On the privacy-conscientious use of mobile phone data. Sci. Data 2018, 5. [Google Scholar] [CrossRef] [PubMed]
  35. Pulse, U.G. UN Data for Climate Action Challenge. Available online: www.dataforclimateaction.org (accessed on 14 June 2017).
  36. UNGP. Data For Climate Action Challenge. Available online: http://dataforclimateaction.org/ (accessed on 14 June 2017).
  37. De Montjoye, Y.-A.; Smoreda, Z.; Trinquart, R.; Ziemlicki, C.; Blondel, V.D. D4D-Senegal: The second mobile phone data for development challenge. arXiv 2014, arXiv:1407.4885. [Google Scholar]
  38. Pulse, U.G.; Hexagon, C. Twitter and Perceptions of Crisis-Related Stress: Methodological White Paper. 2011. Available online: http://www. unglobalpulse.org/projects/twitter-and-perceptions-crisis-related-stress (accessed on 13 November 2017).
  39. Rodriguez, E.; Morris, C.S.; Belz, J.E. A global assessment of the SRTM performance. Photogramm. Eng. Remote Sens. 2006, 72, 249–260. [Google Scholar] [CrossRef] [Green Version]
  40. Choi, H.; Varian, H. Predicting the present with Google Trends. Econ. Rec. 2012, 88, 2–9. [Google Scholar] [CrossRef]
  41. Irons, J.R.; Dwyer, J.L.; Barsi, J.A. The next Landsat satellite: The Landsat data continuity mission. Remote Sens. Environ. 2012, 122, 11–21. [Google Scholar] [CrossRef] [Green Version]
  42. Susha, I.; Janssen, M.; Verhulst, S. Data Collaboratives as a New Frontier of Cross-Sector Partnerships in the Age of Open Data: Taxonomy Development; The GovLab NYU: New York, NY, USA, 2017. [Google Scholar]
  43. Pastor-Escuredo, D.; Savy, T.; Luengo-Oroz, M.A. Can Fires, Night Lights, and Mobile Phones Reveal Behavioral Fingerprints Useful for Development? arXiv 2015, arXiv:1501.00549. [Google Scholar]
  44. Team, P. Planet Application Program Interface: In Space for Life on Earth; Planet Team: San Francisco, CA, USA, 2017; Available online: Https://api. planet. com (accessed on 3 July 2017).
  45. Desktop, E.A. Release 10. Redlands CA Environ. Syst. Res. Inst. 2011, 437, 438. [Google Scholar]
  46. OCHA. Humanitarian Response Rapport; UNOCHA: Dakar, Senegal, 2013. [Google Scholar]
  47. Ghurye, J.; Krings, G.; Frias-Martinez, V. A framework to model human behavior at large scale during natural disasters. In Proceedings of the 2016 17th IEEE International Conference on Mobile Data Management (MDM), Porto, Portugal, 13–16 June 2016; pp. 18–27. [Google Scholar]
  48. Gallery, I.S.I. Satellite Map [Electronic resource]/Satellite Imaging Corporation. 2017. Available online: http://www.satimagingcorp.com/gallery/ikonos–20.01 (accessed on 15 May 2017).
  49. Santilli, G.; Vendittozzi, C.; Cappelletti, C.; Battistini, S.; Gessini, P. CubeSat constellations for disaster management in remote areas. Acta Astronaut. 2018, 145, 11–17. [Google Scholar] [CrossRef]
  50. Schumann, G.J.-P. Fight floods on a global scale. Nature 2014, 507, 169. [Google Scholar] [CrossRef] [PubMed]
  51. Pulse, U.G. Integrating Big Data into the Monitoring and Evaluation of Development Programmes; United Nations Global Pulse: New York, NY, USA, 2016. [Google Scholar]
Figure 1. Framework of impact indicators divided into three different layers of data according to granularity, availability, and privacy risk of the date required to implement the indicators. Dark boxes summarize indicators and light boxes show analysis steps.
Sustainability 12 04246 g001
Figure 2. Left: Historic profiles of rainfall (Schneider Electric (SE) data) in the four study cases selected. Dark blue indicates the year of the flood in comparison to other years, and the vertical dashed lines indicate the day of the flood as retrieved from news. Right: Detection proxy (red) over rainfall measurement (blue). The awareness proxy for the Montpellier flood was normalized by the Call Detail Record (CDR) aggregate, as indicated in the Methods section. Vertical dashed lines indicate the occurrence of a flood. Study cases (A) Monpellier, (B) Houston, (C) Mocoa and (D) Dakar.
Sustainability 12 04246 g002
Figure 3. Floods of the (a) Montpellier, (b) Mocoa, (c) Houston and (d) Dakar areas. Blue: Rainfall measurement. Red: Awareness proxy. Yellow: Damage proxy.
Sustainability 12 04246 g003
Figure 4. (A) Network model for interactions analyzed from posts. Blue for posting users and orange for retweeted or mentioned users. (B) Time series of interactions between all of the nodes. The time interval for profiling is marked with vertical lines in magenta. (C) Left: Profiling of all posting users; right: Profiling of mentioned and retweeted users. (D) Left: Profiling of all posting female users; right: Profiling of mentioned and retweeted female users. (E) Left: Profiling of all posting male users; right: Profiling of mentioned and retweeted male users.
Sustainability 12 04246 g004
Figure 5. (A) Antenna map from Orange with the selected area to analyze the floods, highlighted in green. (B) Daily resolution aggregated presence data in Montpellier during 2014–2015. (C) Hourly resolution aggregated around the days of the first flood. (D) Hourly resolution aggregated around the days of the second flood. Map of the z-score for (E) one day before the flood and (f) the day after the flood in both cases.
Sustainability 12 04246 g005
Figure 6. (a) Segmentation of the flood in Mocoa (right) compared to a baseline segmentation of the Mocoa River (left) over satellite data provided by Planet. (b) Segmentation and elevation of the flood in both situations over satellite data provided by Planet. (c) Segmented flooded area overlaid with a population density map extracted from worldpop.org. (d) Segmented flooded area overlaid with infrastructure data (shapefiles from Humanitarian Openstreetmaps Team). Planet data were provided as part of the UN Data For Climate Action (D4CA) Challenge and were approved for peer-reviewed publication (www.dataforclimateaction.org).
Sustainability 12 04246 g006
Figure 7. (a) Comparison of the segmentation performed in this work (blue—left) against (b) the segmentation performed by UNOSAT (pink—middle). (c) both segmentations are overlaid along with the damaged buildings in yellow (right). The underlying satellite images were provided by Planet as part of the UN D4CA Challenge (Methods) and were approved for publication (www.dataforclimateaction.org). The segmentation of the flooded area was performed as explained in the Methods section using GIS. The segmentation produced by UNOSAT and the layer with affected buildings were directly downloaded from UNOSAT. The composition images were made using GIS by overlying the geoshape layers on top of the raster data provided by Planet. LANDSAT data are open and available from https://earthexplorer.usgs.gov/.
Sustainability 12 04246 g007

