Article

The Impact of Employees’ Perceptions of Strategic Alignment on Sustainability: An Empirical Investigation of Korean Firms

1
Department of Business Administration, Global Business School, Soonchunhyang University, Asan 31538, Korea
2
Department of Security Convergence, Graduate School, Chung-Ang University, Seoul 06974, Korea
3
Department of Economics and Finance, Global Business School, Soonchunhyang University, Asan 31538, Korea
*
Author to whom correspondence should be addressed.
Sustainability 2020, 12(10), 4180; https://doi.org/10.3390/su12104180
Submission received: 3 April 2020 / Revised: 15 May 2020 / Accepted: 18 May 2020 / Published: 20 May 2020

Abstract

:
Despite the increasing amount of research on the use of strategic alignment to ensure sustainability, Korean companies have been found to lack an understanding of the initiative that connects strategic alignment and organizational performance. We argue the need for role clarity and employee engagement as two motivational mechanisms for strategic alignment to achieve better organizational performance. The research model uses variables related to strategic alignment, role clarity (goal and process clarity), employee engagement, and organizational performance. The model was tested by surveying 244 participants in 74 Korean companies. The results of the structural model tested using the partial least squares regression reveal that strategic alignment is indirectly related to organizational performance through goal clarity and employee engagement. This study also clarifies the motivation of strategic alignment in terms of individuals (e.g., psychological stability of individual goals and actions) and organizations (e.g., high level of engagement toward the organization’s active support). Further research issues are also discussed.

1. Introduction

In modern management, sustainability management is an essential element to succeed in competitive environments. During the last 10 years, sustainability management has been one of the significant goals to achieve for Korean organizations. A sustainable performance assumes a core role for corporations in terms of the sustainability. Lately, researchers e.g., [1,2] are tending to study the factors affecting the combination process between strategic alignment and organizational performance. Sustainable strategic alignment means the continuous conformity of the strategy with the organizational goals as time goes by.
Considering the importance of ensuring competitive advantage and organizational performance for sustainability, much research has been conducted on strategic alignment in business administration, strategies, and organizational studies [3,4,5,6,7,8,9,10,11,12,13,14,15,16,17]. Researchers describe strategic alignment in terms of fit [18], integration [19], bridge [20], fusion [21], linkage [22], and dynamic resource capability [23]. Strategic alignment is an important element in achieving strategic performance, including the allocation of resources to support organizational goals [24]. A firm’s ability to pursue and maintain a competitive advantage depends on its ability to acquire and deploy resources that meet the competitive needs of the organization [25]. When there is a lack of strategic alignment, organizations are weakened and fall behind their competition. Chenhall and Langfield-Smith [26] argued that an organization cannot sufficiently obtain a competitive advantage unless it connects all strategies to functional processes and information systems. This is because strategic alignment requires individuals at various levels to support the organization’s purposes and goals with the same level of commitment [11].
In this study, we review how the relationship between the strategic alignment and the behavioral result of the organization members for sustainability management affects the organizational performance. The majority of previous studies have primarily focused on strategic alignment between a strategic performance measurement system (SPMS) and organizational performance (perceived or real) [8,13,14,16,27,28,29,30], and the effect of the alignment between organizational strategies and structure on organizational performance [31,32]. On the other hand, empirical studies examining strategic alignment and employee behavioral outcomes are mostly qualitative research [33,34,35]. For example, Slack et al. [35] found that various factors affect employee engagement, which can be achieved by aligning the strategic goals of the organization with the personal goals of the employees; in particular, communication plays an important role. However, studies dealing with strategic alignment and employee behavioral outcomes in Korea are limited [12,13]. Studies reviewing the linkage between strategic alignment and organizational performance assume that such alignment affects the behavior of individuals within the organization, which promotes the achievement of organizational goals. However, there is a lack of strong evidence for such a linkage. Palmer and Markus [36] and Tallon [37] failed to identify a sufficient relationship between strategic alignment and organizational performance. For example, Tallon [37] revealed that after strategic alignment increased, 70% of companies reduced costs or increased sales and customer services, whereas 30% showed opposite results.
Despite the insufficient empirical research on whether strategic alignment has direct or indirect effects on organizational performance, it is an important topic, since there may be a theoretical difference between the direct and indirect effect models with actual impacts [38]. Psychological theories suggest that cognitive and motivational mechanisms are likely to explain the relationship between strategic alignment and organizational performance [39,40,41]. On the other hand, while recent research shows that strategic alignment is used as a means for achieving a strategic advantage for sustainability, it has a somewhat low impact on organizational performance [8,27]. In particular, Baker et al. [2] argued that only when strategic alignment is perceived as a strategic component rather than as a means to support strategic organizational operations can it positively impact organizational performance. Therefore, this study examines how strategic alignment, as a strategic component for organizational sustainability, can explain the relationship between strategic alignment, role clarity, employee engagement, and organizational performance.
To achieve the research objectives, we develop a model using a theory-driven approach and conduct survey-based empirical research on the relationships among strategic alignment, employee role clarity, engagement, and organizational performance. The remainder of this paper is organized as follows. In Section 2, we review previous literature on strategic alignment, role clarity, and employee engagement. In Section 3, we develop a research model through the literature review and formulate 10 hypotheses. We explain the data collection and analysis procedures in Section 4 and then present the empirical results in Section 5. Finally, we discuss the results, explain practical implications, and present the limitations and direction for further research in Section 6.

2. Literature Review

The concept of strategic alignment stems from the fundamental proposition that the strategy an organization implements is the result of conformity between various factors, such as organizational structure, technology, culture, environment, and employee behavior outcomes. This section discusses strategic alignment, role clarity, and employee engagement while reviewing the literature on strategic alignment and employee behavioral outcomes.

2.1. Strategic Alignment

When Netscape CEO Jim Barksdale stated that “The main thing is to keep the main thing, the main thing!” he illustrated the importance of the two following points: first, ensuring that everyone in an organization proceeds with the same purpose, and second, achieving that purpose (the “main thing”) by integrating the organization’s resources and systems [7]. Regarding alignment, Porter ([25], p. 73) stated that “Strategic fit among many activities is fundamental not only to competitive advantage but also to the sustainability of that advantage. It is harder for a rival to match an array of interlocked activities than it is merely to imitate a particular sales-force approach, match a process technology, or replicate a set of product features.”
Many studies have provided definitions of strategic alignment [42,43,44], assuming that it is used to bridge key organizational components such as strategies, leadership, culture, processes, people, and systems. We define alignment as the integration of core systems, processes, and responses to changes in the external environment. The framework of strategic alignment has two dimensions: vertical and horizontal alignment. Vertical alignment bridges employees and strategies, while horizontal alignment bridges business processes and customers. Aligned organizations can promptly respond to environmental changes, and their employees have the ability to detect these changes and quickly realign themselves with minimal effort.
Vertical alignment refers to a state in which all employees can clarify corporate strategies and explain how their daily business activities support those strategies. Chenhall [27] argued that vertical alignment is successful when lower-level achievements match organizational goals. Once they reach vertical alignment, employees understand the goals of the entire organization as well as their roles in achieving these goals. A culture of alignment is promoted when all levels of employees in the organization have clear, unambiguous views of the organization’s strategic goals [45]. This culture begins at the individual employee level and expands to linkages at the group and organization levels [46].
However, in addition to vertical alignment, companies must achieve horizontal alignment to attain sufficient growth and generate profits. In horizontal alignment, customers’ needs and interests become crucial elements in the organization’s thinking, planning, and employee behavior [7]. The work processes of organizations that are horizontally aligned are designed to provide both internal and external customers with what they want in the way they want and have the capacity to make quick changes when customer requirements change. For example, Rhee and Mehara [47] found that the strategic fit between operations and marketing is more important in understanding organizational performance than the choice of competitive strategies. Similarly, Alegre and Chiva [48] confirmed that a successful company must balance product innovation and competitive manufacturing priorities. From this viewpoint, Hicks [49] defines an organization’s strategic alignment as a “fit between a company’s internal structure and its external environment”. When alignment is achieved in both the vertical and horizontal dimensions, there are dynamic relationships among all four elements of strategy, people, processes, and customers. When the four elements of alignment are bridged at the same time, each element is supported and reinforced by another [7]. Figure 1 shows the alignment framework that displays the relationship of vertical and horizontal alignment.

2.2. Role Clarity: Goal and Process Clarity

Role clarity is affected by strategic alignment and is the degree to which employees have a clear perception of their role expectations and actions [41,50]. If employees are not sure of their roles, they avoid their job responsibilities, leading to tension and making it difficult to achieve strategic goals or exerting a negative effect on organizational performance [14,51]. Hall [41] argued that role clarity more clearly expresses roles than role ambiguity, which is why it is helpful to divide role clarity into goal and process clarity in terms of adequate behaviors to fulfill employees’ expectations and roles. Sawyer [52] established goal clarity and process clarity based on role theory. Clarity regarding goals and processes not only increases individuals’ understanding of their work objectives and paths but also emphasizes the alignment of colleagues, teams, and organizations. Clear goals and processes improve a team’s competencies by reinforcing collective interaction [53].
The core concept in goal clarity is that goals are important and that they must be clear in order to be perceived as important, thereby increasing one’s motivation to achieve the goal [54]. When there is a high level of goal clarity in an organization, the team members clearly understand the correlations among their subordinate goals, tasks, and team goals [53]. Clearer organizational goals increase the importance of an organization’s value system, which makes individuals’ self-concept and commitment more substantial [54]. Sawyer [52] defined process clarity as the degree to which individuals are certain about how they should perform their duties. When there is high process clarity at the employee and team levels, employees and team members clearly understand the procedures necessary to achieve their goals. Hu and Liden [53] argued that clarity in goals and processes at the employee and team level is positively related to employee and team performance as well as efficiency. Clear procedures toward goals are also very important for employee and team performance, because process clarity provides clearer and more active plans and visible strategies to achieve the goal [55].

2.3. Employee Engagement

Employees’ enthusiasm and efforts toward strategic goals are essential in order for organizations to achieve desirable results. In other words, organizational performance is the outcome of employee engagement [56]. Employee engagement has been defined in various ways by many researchers [57,58,59,60,61]. Employees must maintain a cognitive and emotional state to focus on their work. Therefore, we define employee engagement as a positive emotion among employees with which they act according to the organization’s utmost benefits and make discretionary efforts to achieve strategic goals.
Employee engagement is generally comprised of three dimensions: cognitive, emotional, and physical [57]. The cognitive dimension of employee engagement refers to the state in which employees are self-conscious about keeping their roles and goals consistent within the organization, and they understand the organization and its general goals. The emotional dimension indicates employees’ emotional attachment to their manager and colleagues, what they think about the organization and leader, and whether they have positive or negative attitudes toward them. The physical dimension of employee engagement refers to employees’ discretionary efforts and how long they intend to stay in their organization. Organizations with low employee engagement are not likely to achieve strategic goals or high performance even if their strategies are well-planned and their missions and strategies are aligned with their members to a substantial degree. Shon and Chang [62] emphasized the importance of engagement and argued that organizations must demand that employees develop active job engagement and innovative actions to achieve excellent results.

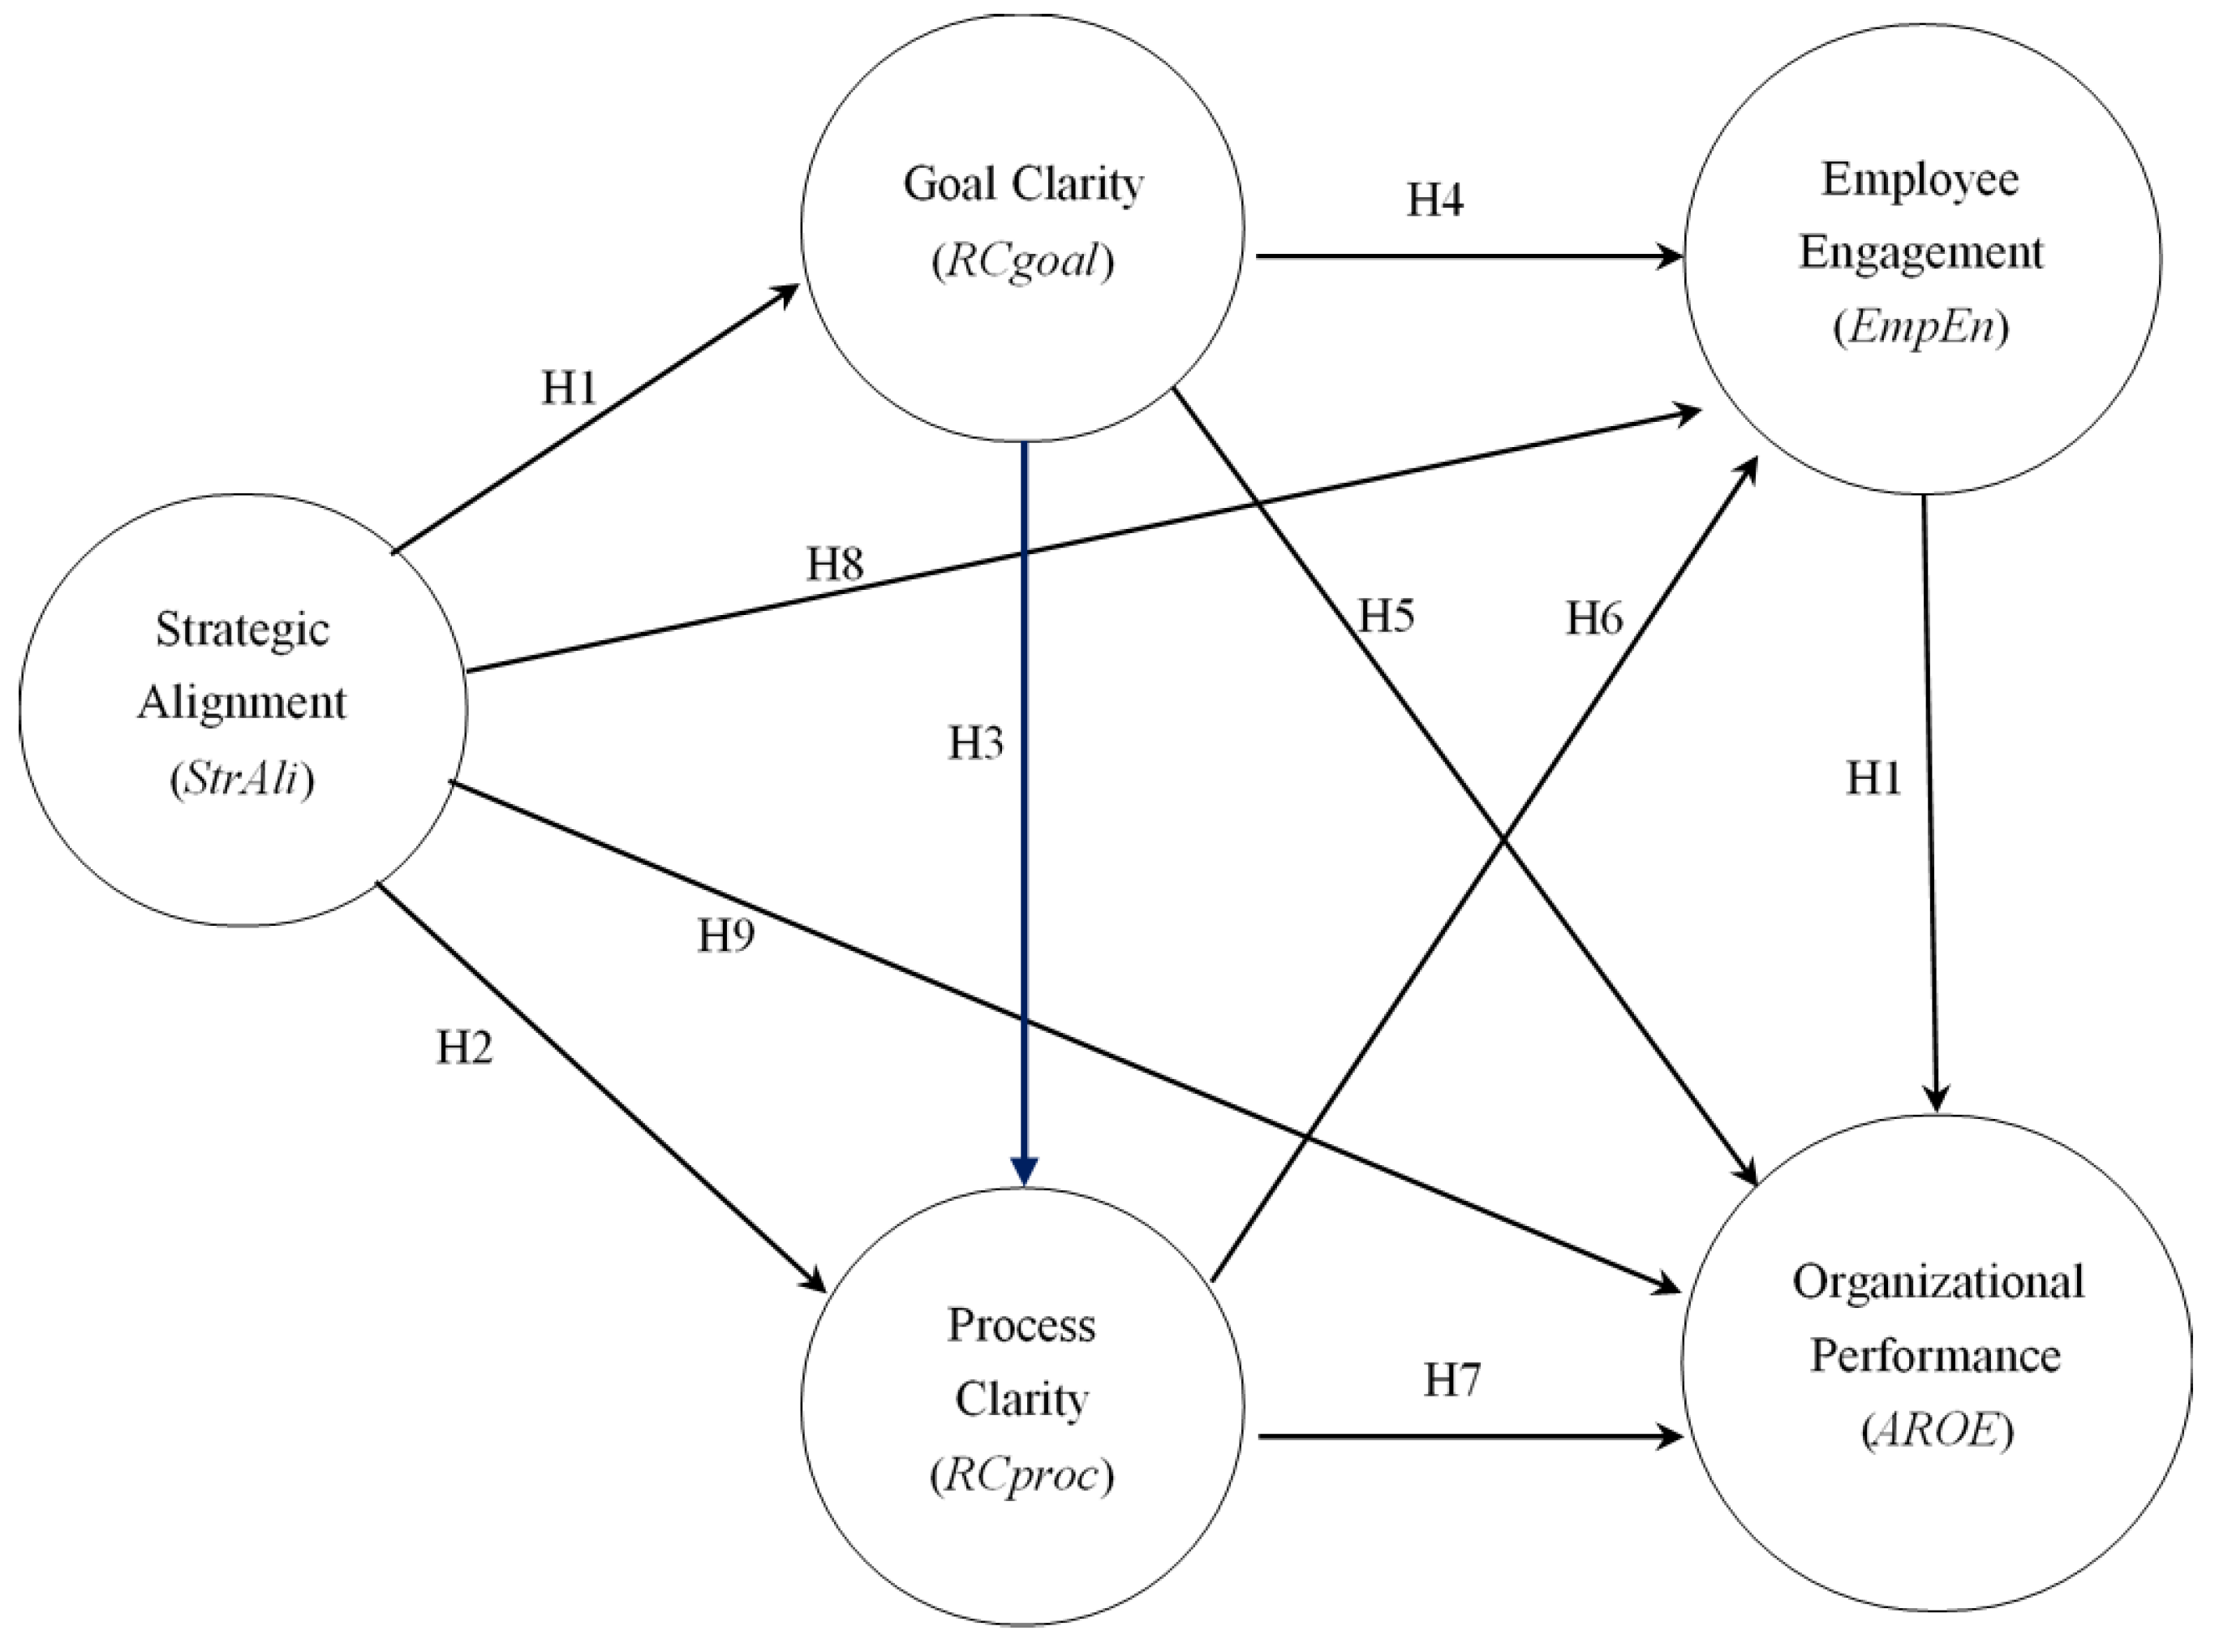
3. Research Model and Hypotheses

This section defines the key constructs with 10 hypotheses and provides the grounds for their correlations. Each construct is defined from the perspective of intrinsic attributes and presents reliable and measurable indicators. Figure 2 presents the research model, which shows the correlations among variables. Here, we provide the theoretical grounds for such correlations in the form of hypothesis development.

3.1. Relationships between Strategic Alignment and Role Clarity

Organizations have strategic orientations as a response to competitive market realities. This strategic orientation is led by the top management of the organization and concerns the organization’s business direction and goals accepted by employees and identifiable stakeholders [63,64]. In organizations that emphasize strategic alignment, employees feel responsible for the outcomes of their work [13,14,41]. Strategic alignment enables employees to be clearly aware of the organization’s goals and processes, understand their duties and responsibilities as well as the outcomes anticipated from their roles, and know how they are evaluated. Organizations that aim for strategic alignment better accept the importance of role clarity [41,65], which has two key elements: (1) goal clarity, which makes individuals perceive the importance of goals and motivates them to achieve the goals [52,53], and (2) process clarity, which makes individuals have confidence about how they perform their duties [52,53,55]. In organizations that have achieved strategic alignment, employees perform duties that are consistent with the strategic direction of the organization, do not have expectations or demands that conflict with their jobs, and are provided with sufficient results and feedback. Therefore, strategic alignment is expected to increase role clarity. As such, we developed the following hypotheses:
Hypothesis 1.
There is a positive relationship between strategic alignment and goal clarity.
Hypothesis 2.
There is a positive relationship between strategic alignment and process clarity.

3.2. Relationships between Role Clarity and Employee Engagement

Few organizations provide their employees with information about how to achieve goals. However, individuals that understand role expectations and outcomes make decisions and take actions that affect the outcomes in their field of work. Therefore, goal clarity, which increases employees’ motivation to achieve their goals by emphasizing the importance of such goals, requires process clarity. Although goal and process clarity are separate, process clarity is expected to support causal pathways via goal clarity [52]. Therefore, employees must achieve process clarity in terms of strategic and operational integration to internalize strategic alignment in their jobs and tasks. The key is thus to convert goal clarity into process clarity.
Employees that perform tasks with unclear goals have difficulty determining which skills and abilities they need to properly perform their tasks and whether they possess those skills and abilities [41]. Spreitzer [66] argued that roles can have individual meanings only when individuals understand their roles. Employees who understand clear business goals and how to achieve them can skillfully and confidently handle their tasks, but those who are unsure about their role expectations are likely to have a lower level of self-determination due to uncertainty [41,67]. When individuals’ goals and actions are aligned with organizational goals, employees have higher psychological stability in various regards (e.g., their roles, job values, and self-esteem), ultimately resulting in higher employee engagement [41].
Hypothesis 3.
There is a positive relationship between goal clarity and process clarity.
Hypothesis 4.
There is a positive relationship between goal clarity and employee engagement.
Hypothesis 5.
There is a positive relationship between goal clarity and organizational performance.
Goal and process clarity encourages the alignment of goals and processes with strategies. Role clarity focuses on developing individuals’ social identity by ensuring the internal stability of institutional logic [68,69]. In other words, if organizational goals become clearer, the organization’s value system becomes more important, helping individuals define their self-concept [54,69]. Employees can achieve results more effectively when they understand the goals that must be achieved and the methods through which tasks should be performed [41]. Previous studies have found that role ambiguity undermines performance [70,71].
Employees that achieve role clarity understand the expectations and outcomes of their roles. Those that are uncertain about their role expectations and outcomes hesitate to make decisions or take actions due to uncertainty, and try not to take the initiative [67]. However, individuals that understand role expectations and outcomes make decisions and take actions that affect the outcomes in their field of work [52]. We therefore formulated the following hypotheses.
Hypothesis 6.
There is a positive relationship between process clarity and employee engagement.
Hypothesis 7.
There is a positive relationship between process clarity and organizational performance.

3.3. Relationships between Strategic Alignment, Employee Engagement, and Organizational Performance

Strategic alignment has a positive impact on individuals’ values and organizational culture [65,72,73]. Organizations must continuously maintain competitive advantages to survive in a dynamic environment, and employee engagement can help implement strategies to secure competitive advantages. Strategically aligned employees feel that their work is meaningful [57,60,65]. Therefore, strategic alignment ensures that employees are devoted to their jobs and have self-efficacy, thereby increasing their concentration on their work.
Much research has found that strategic alignment is a driving force for organizational performance [32,74,75,76,77,78,79]. However, not all studies have supported a direct relationship between strategic alignment and organizational performance. For example, Joshi et al. [8] failed to find a direct relationship between strategic alignment and organizational performance, but reported that there was a significant relationship in certain conditions. West and Schwenk [80], Homburg et al. [81], Lindman et al. [82], Chenhall [27], and Kim and Lee [12] also reported similar findings, but revealed that strategic alignment has an indirect effect on organizational performance when there are mediator variables. On the other hand, regarding the relationship between alignment and organizational performance, Hayes et al. [74] and Smith and Reece [76] argued that the alignment of an organization’s business strategies and operating elements improves business performance. A sustainable competitive advantage occurs when an organization achieves operational excellence in business areas that are fundamentally linked with its strategies.
Employee engagement is expected to bring positive results to work performance because the experience of engagement is related to one’s sense of achievement and positive work experience [83,84]. Kahn [57] argued that employee engagement results in performance at the individual level (e.g., job quality and one’s experience) and the organizational level (e.g., organizational growth and productivity). Employees strive for a higher level of engagement when they perceive that their organization has an active high-level of support, which is likely to engender positive organizational performance [85]. This is because more highly engaged employees are more attached to the organization. We therefore posit the following hypotheses.
Hypothesis 8.
There is a positive relationship between strategic alignment and employee engagement.
Hypothesis 9.
There is a positive relationship between strategic alignment and organizational performance.
Hypothesis 10.
There is a positive relationship between employee engagement and organizational performance.

4. Research Method

4.1. Sample and Data

This study examined whether strategic alignment has a positive effect on organizational performance by increasing role clarity and employee engagement. First, data were collected from members of the organizations operating an SPMS. Second, performance managers of SPMS and employees who had a good understanding of the variables were invited to participate in the study. Third, five copies of the questionnaire were retrieved per organization. This study randomly selected 200 companies and organizations which adopted the SPMS, from a population of companies and organizations identified as operating an SPMS based on periodicals, articles, article searches, and cooperation of SPMS-related consulting companies.
We distributed 1000 copies of the questionnaire to public as well as other organizations and KOSPI- and KOSDAQ-listed companies that are likely to be implementing an SPMS. The questionnaire was sent to performance managers identified in advance, and was distributed to employees that could sufficiently understand and respond to the contents of the survey. The survey period was from August 28 to October 16, 2018. Questionnaires were returned via mail, email, Monkey Survey, and direct retrieval.
The survey items, which were selected from suitable items used in previous studies, were rated on a seven-point Likert scale. The items were then modified according to the purpose of this study through a review by experts (performance managers and consultants who participated in establishing the SPMS).

4.2. Variable Description

Strategic alignment refers to a setting in which all employees are heading toward one direction with a shared goal [7,86]. Achieving strategic alignment among employees promotes employee cooperation and organizational value. In this study, strategic alignment was measured by the extent to which an organization is internally and externally aligned and is heading in a single direction. The survey measured internal alignment, which is related to strategic alignment among employees, and external alignment, which concerns the matching of organizational resources with the external environment. A total of 16 items in 4 categories, such as understanding of organizational strategies (strategy), understanding of customers (customer), employee satisfaction with the organization (employee), and employee understanding about work processes (process), were rated on a seven-point Likert scale (1 = strongly disagree, 7 = strongly agree).
Strategic alignment scores were calculated using the following procedures. In the first step, the Euclidian distance method [6] was used to calculate the discrepancy between performance managers and employees in terms of the four factors (understanding of strategy, understanding of customers, employee satisfaction, understanding of work process) presented herein with regard to the organization’s proper implementation of strategies. Performance managers are those in the position of evaluating the employees’ performance. On the other hand, employees are those implementing the organization’s strategies on site and receiving evaluations of their performance. Strategic misalignment scores were calculated as follows—Equation (1).
Strategic misalignment score:
= i = 1 n ( X ¯ P i X ¯ E i ) 2 ,
where X ¯ P i = the average value of performance managers’ perception i, X ¯ E i = the average value of employees’ perception i.
In the second step, each organization’s strategic misalignment score was converted to a strategic alignment score by deducting the former from the maximum misalignment score, in Equation (2).
Strategic alignment score:
= Maximum   strategic   misalignment   score     strategic   misalignment   score .
Role clarity measures whether employees clearly understand the goals and responsibilities of their work as well as the processes required in performing the tasks related to their jobs. Kahn et al. [49] used the term “role ambiguity”, which indicates uncertainty about part of an individual’s role. In this study, the term “role clarity” is used to express the level of certainty rather than the ambiguity of expectations. This is not conceptually different from role ambiguity [52]. Role clarity was measured using 10 items, with 5 each in goal clarity and process clarity (1 = strongly disagree, 7 = strongly agree). Role clarity (goal and process clarity) was measured using the items in Hall [41].
Employee engagement measures the cognitive, emotional, and physical state of employees to determine whether they are performing their tasks with enthusiasm and are devoted to their work. We selected 7 suitable items among the 12 items used by Kahn [87] in their study on determinants of employee engagement and by May et al. [60] and Stringer [65]; each item was rated on a seven-point scale (1 = strongly disagree, 7 = strongly agree). May et al. [60] and Stringer [65] classified employee engagement into cognitive, emotional, and physical engagement, but it was measured as a single construct in this study.
Organizational performance: organizations emphasize strategic alignment to promote financial performance for sustainable management. One of the most commonly used indicators for an organization’s financial performance is return on equity (ROE) [88]. As an organization’s accounting performance, ROE is calculated as follows:
ROE = (Net Income/Total Equity) × 100.
Does the ROE of organizations that have achieved strategic alignment always have to be positive? There are some cases in which strategically aligned organizations show a negative ROE due to the business environment or changes in market conditions. In this case, however, we cannot say that an organization’s strategic alignment is not properly achieved because it may cause a small loss in a situation in which there is likely to be a large loss due to positive strategic alignment. However, the ROE of an organization that has achieved strategic alignment must at least be greater than the average ROE of the industry. Therefore, this study used adjusted ROE (AROE), in which the three-year average ROE of the industry is subtracted from that of individual organizations, to represent financial performance. ROE adjusted with the three-year average ROE of the industry is calculated as follows:
AROEijt = ROEitMROEjt.
Here, AROEijt is the three-year average market excess ROE of organization i in industry j, ROE is the three-year average ROE of organization i, and MROEjt is the three-year average ROE of industry j. Here, positive AROE shows that the organization achieved high ROE, and negative AROE shows that it achieved low ROE.
Table 1 provides a comprehensive summary of the aforementioned constructs, definitions, and literature base.

5. Results

5.1. Descriptive Statistics

We collected data by conducting a survey of performance managers and employees of public organizations and KOSPI- and KOSDAQ-listed companies in Korea. To reduce costs and increase the response rate of the survey, we distributed a total of 1000 copies of the questionnaire, that is, 5 copies to each of the 200 organizations that were determined to be operating a strategic performance management system (SPMS). This is because feedback must be actively exchanged through the SPMS for successful strategic alignment [89]. A set questionnaire (one copy for the performance manager and four copies for employees) was delivered to the organization’s performance manager, who then distributed four copies to various employees to ensure that responses were distributed among different departments and ranks. The employees completed the survey and delivered the results directly to the researchers. To increase the response rate, we sent a cover letter and questionnaire along with a postage-paid envelope and also allowed the participants to send the results via email. We also allowed them to respond to the survey via the online survey program “Monkey Survey”. We retrieved a total of 318 copies (74 performance managers, 244 from employees) from 74 organizations, and the response rate was 37.0% for organizations and 30.5% for employees (= (74/200) × 100, (244/800) × 100, responses of performance managers were used only in calculating strategic alignment scores, whereas only employee responses were used in the analysis). Financial performance data for each company were obtained separately from FnGuide. FnGuide is the Korean Center for Research in Security Prices, which provides financial information, statistics, and analyses on companies registered with the Korean Stock Exchange and KOSDAQ.
Descriptive statistics of survey responses are presented in Table 2. A total of 64.8% (158 respondents) worked in for-profit organizations and 35.2% (86 respondents) in public organizations. A total of 3.3% (eight respondents) were CEOs and directors, 84.8% (207 respondents) were heads of departments or managers, and 11.9% (29 respondents) were staff. A total of 58.2% (142 respondents) of the organizations were conglomerates or large companies and 41.8% (102 respondents) were small- and medium-sized companies. Meanwhile, the average period of continuous service among employees was 9.96 years, ranging from 1 to 31 years. Therefore, the respondents are considered to have sufficient career experience to understand the content of the survey. The organizations were distributed diversely in 14 types of businesses (KSIC-9), such as wood products (classified only among for-profit organizations).
Descriptive statistics of the variables in the collected data are summarized in Table 3. The alignment of strategy, customer, employee, and process that measured the level of strategic alignment was 9.568, 9.187, 9.115, and 9.245, respectively, showing that they were aligned to a considerable level, although not completely (the ideal alignment is 12 points). For role clarity of the organizations, the mean of goal clarity was 5.533 and that of process clarity was 5.114, maintaining at least a medium level. Moreover, the mean of employee engagement was 5.342. This indicates that achieving strategic alignment has a positive effect on role clarity and employee engagement. Meanwhile, for organizational performance, AROE was 10.379%, which indicates that achieving high strategic alignment affects the increase of role clarity and employee engagement, which has a positive effect on organizational performance.

5.2. Common Method Bias Test

Common method bias (CMB) occurs due to various reasons when survey data are self-reported [90]. This study attempted two methods to verify CMB. The first was Harman’s single-factor test, which has a simple verification method. The results showed that a single factor explained only 40.71% of the variance. This implies that CMB is not so severe as to affect the interpretation of the results. Second, we checked the VIF (variance inflation factors) of constructs using the full collinearity tests of Kock and Lynn [91]. According to Kock [92], “The occurrence of a VIF greater than 3.3 is proposed as an indication of pathological collinearity, and also as an indication that a model may be contaminated by common method bias. Therefore, if all factor-level VIFs resulting from a full collinearity test are equal to or lower than 3.3, the model can be considered free of common method bias.” Considering the results of Harman’s single-factor test and full collinearity test (see Table 3), the collected data did not have CMB.

5.3. Data Analysis: Partial Least Squares Regression (PLS)

We tested the hypotheses using the partial least squares (PLS) among the structural equation models (SEM). PLS is generally referred to as soft modeling [93] and is comprised of a measurement model and structural model. The measurement model specifies the relationship between observed items and latent variables, and the structural model specifies the relationship among latent constructs. In PLS, the models are estimated simultaneously [92]. Even though PLS simultaneously estimates the parameters for the models, they are analyzed and interpreted separately [94]. The benefits of PLS are as follows. First, PLS solves a few problems in terms of theory and estimation in CB-SEM (covariance-based structural equation modeling) [94]. In using measurement indicators, both reflective and formative indicators can be used more easily in PLS, unlike in CB-SEM [95]. We used reflective indicators when measuring the variables. Second, PLS is fit for SEM studies with small samples and can be analyzed even if there is a possibility of low causality among research units, unlike CB-SEM [93]. When used in a complicated model with a limited sample size, PLS shows higher statistical skills than CB-SEM [96]. The final sample size was 244, indicating that PLS was more suitable than CB-SEM.

5.4. Discussion of the Measurement Model

The measurement model was evaluated by the relationship between measured values and constructs using reliability and validity tests of the scales. We examined the loading of each item for each of the constructs to test the reliability of individual items (see Table 4). All measured values showed loadings of 0.70 and higher (except one employee engagement measure, which had a loading of 0.656) for the latent variables.
Convergent validity of the measurement model was assessed using composite reliability and average variance extracted (AVE). As shown in Table 4, for internal consistency, Cronbach’s alpha presented by Nunnally [97] and composite reliability score presented by Fornell and Larcker [98] all exceeded the threshold of 0.7. Meanwhile, AVE of all constructs ranged from 0.594 to 0.758, which is higher than the threshold of 0.5, showing that there was convergent validity [98].
Discriminant validity of the measurement model was assessed by comparing the root of AVE and correlation among constructs. Fornell and Larcker [98] assumed that the PLS measurement model has discriminant validity if the square root of AVE extracted in each factor is greater than the correlation coefficient between the relevant factor and others. As shown in Table 5, the diagonal line shows the roots of AVE. The values are all greater than the correlation among the constructs, and the measurement model therefore has discriminant validity. The results show that the measurement model is reliable and valid.

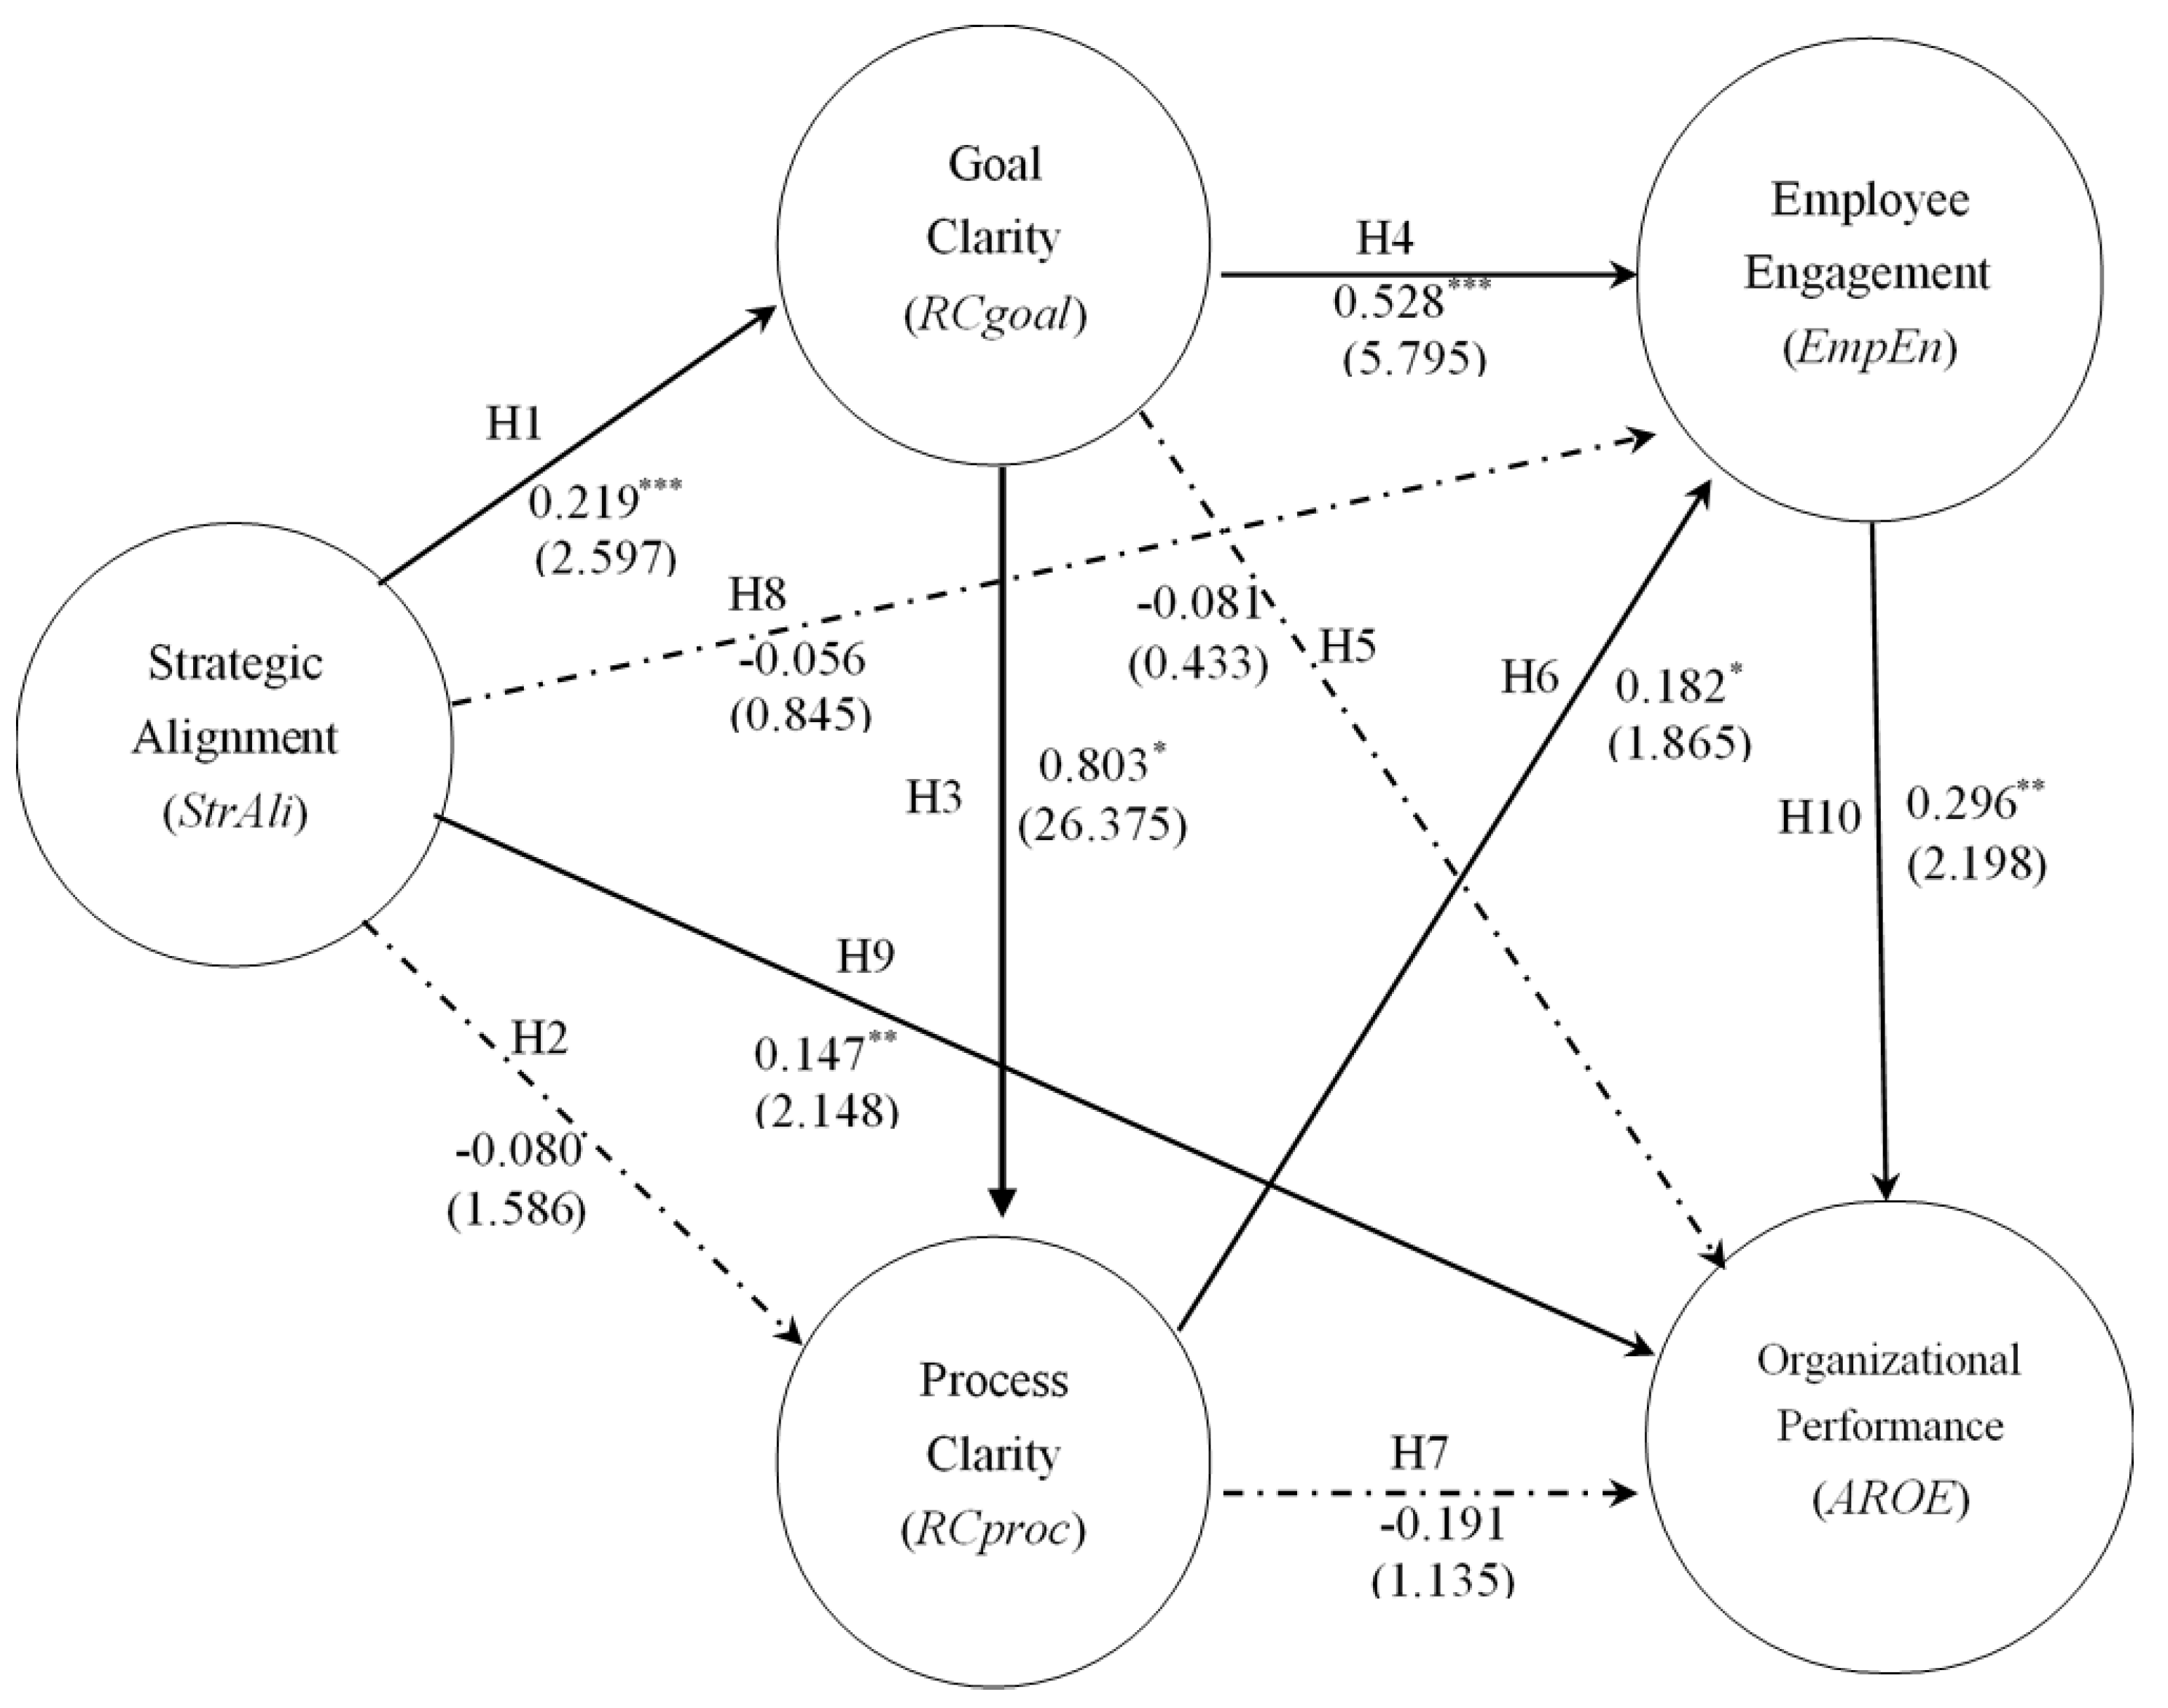
5.5. Discussion of Structural Model: Hypothesis Tests

Estimating the structural model in PLS was used in testing the hypotheses. Table 6 reports the R2 of constructs for endogenous variables and path coefficients. Table 6 shows the direct and indirect pathways among constructs.
PLS generates standardized βs, which are used in the interpretation in OLS regression equation and path coefficient in SEM (see Figure 3). There is no assumption of distribution in PLS, and thus bootstrapping (10,000 samples with replacement) was used to evaluate the statistical significance of each path coefficient [94].
Table 6 presents the PLS estimation results to verify the roles of both role clarity (goal and process clarity) and employee engagement in the relationship between strategic alignment and organizational performance. As shown in Figure 3 and Table 6, Hypotheses 1 and 2 posited that the organization’s StrAli has a positive relationship with the increase of RCgoal and RCproc. In fact, StrAli and RCgoal (β = 0.219, t = 2.597, p < 0.01) showed a significant positive relationship. This is consistent with the argument of Weiss and Piderit [68] and Ripoll [69] that when an organization is strategically aligned, organizational goals become clear for employees, making them attribute more importance to the goals and therefore substantializing them as part of individuals’ identities. Therefore, Hypothesis 1 was accepted. On the other hand, StrAli and RCproc (β = −0.080, t = 1.586, p > 0.10) showed an insignificant negative relationship. This is contrary to what was expected, but the result is not that surprising if we accept the argument by Ilgen et al. [100] and Collins [39] that RCproc, which indicates the extent to which an individual is certain about the way they perform a task, can clarify individual roles once the organization has set a concrete goal. In this study, RCgoal and RCproc (β = 0.803, t = 26.375, p < 0.01) showed a significant positive relationship, and as shown in Panel B of Table 6; RCgoal performs a mediating role (β = 0.176, t = 2.427, p < 0.05) in the relationship between Strali and RCproc. In other words, RCproc is not directly affected by StrAli but is indirectly affected through RCgoal. This result is consistent with the work of Kim and Lee [14], in which they argued that StrAli enables communication within the organization about specific procedures and methods of strategic implementation and provides forecasts and responsibilities for the members regarding the results of their performance of duties. Therefore, Hypothesis 2 was rejected.
Hypotheses 8 and 9 assumed that StrAli has a positive effect on EmpEn and AROE. Contrary to what was expected, EmpEn (β = −0.056, t = 0.845, p > 0.10) had an insignificant negative relationship with StrAli. This result is different from the findings of previous studies, which claim that an organization’s strategic alignment is a job resource and has a positive effect on employees’ job engagement [23,51,65,101]. Meanwhile, as expected, AROE (β = 0.147, t = 2.148, p < 0.05) had a significant positive relationship in StrAli. Previous studies state that rather than having a direct effect on organizational performance, strategic alignment has an indirect effect on performance when there are mediator variables [8,13,14,82]. As shown in Panel B of Table 6, RCgoal (β = 0.116, t = 2.194, p < 0.05) performed a significant mediating role in the relationship between StrAli and EmpEn, while RCgoal/EmpEn performed a significant mediating role (β = 0.034, t = 1.640, p < 0.10) between StrAli and AROE. This is consistent with the research by Lindman et al. [82] and Joshi et al. [8]. Hypothesis 8 was rejected, and Hypothesis 9 was accepted.
Hypotheses 3, 4, and 5 assumed that RCgoal has a significant positive effect on RCproc, EmpEn, and AROE. RCgoal showed a significant positive relationship with EmpEn (β = 0.528, t = 5.795, p < 0.01) and RCproc (β = 0.803, t = 26.375, p < 0.01). This result is also consistent with the argument that employees with high role clarity understand the goals of the tasks they are performing, are clearly aware of their responsibilities and duties, and ultimately show higher engagement [41,52]. This is supported by the argument that individuals feel that their roles are significant when they understand them [67]. On the other hand, RCgoal showed an insignificant negative relationship in terms of direct effect on AROE (β = −0.081, t = 0.433, p > 0.10). However, as shown in Panel B of Table 6, EmpEn (β = 0.156, t = 2.065, p < 0.05) performed a significant positive role of full mediation in the relationship between RCgoal and AROE. Therefore, Hypothesis 3 and Hypothesis 4 were accepted, and Hypothesis 5 was rejected.
Hypotheses 6 and 7 assumed that RCproc has a significant positive effect on EmpEn and AROE. RCproc showed a significant positive relationship with EmpEn (β = 0.182, t = 1.865, p > 0.10). This result is consistent with the argument that employees who are uncertain about the expectations and outcomes of their roles are hesitant in making decisions or performing tasks, whereas those who precisely understand their roles make adequate decisions and take proper actions that positively affect their performance [52,67]. Meanwhile, RCproc had an insignificant negative relationship with AROE (β = −0.191, t = 1.135, p > 0.10). Moreover, as shown in Panel B of Table 6, EmpEn (β = 0.054, t = 1.486, p > 0.10) did not perform a mediating role in the relationship between RCproc and AROE. The results of Hypothesis 6 and Hypothesis 7 showed that role clarity needed the mediating role of employee engagement rather than having a direct effect on corporate performance. Therefore, Hypotheses 3, 4, and 6 were accepted, whereas Hypotheses 5 and 7 were rejected.
Finally, Hypothesis 10 assumed that EmpEn has a significant positive effect on AROE. The results revealed that EmpEn and AROE (β = 0.296, t = 2.298, p < 0.05) had a significant positive relationship. This is consistent with the argument by Bakker and Schaufeli [102] that engagement has a positive effect on employees and motivates them to put their utmost efforts into organizational success, thereby improving organizational performance. Employees who are satisfied and engaged in their work are not only productive but are also a huge asset to the organization. Therefore, Hypothesis 10 was accepted.
Figure 3 shows the path coefficients related to the PLS structural model.

5.6. Contextual Analysis

We conducted a contextual analysis in three contexts to examine the roles of role clarity and employee engagement in the relationship between strategic alignment and organizational performance. The first context was pressure on sustainability. According to Liphadze and Vermaak [103], an increase in employees’ participatory behavior and the promotion of communication and awareness of the organization overall are key factors that increase organizational performance. The second context was market uncertainty, which reflects the characteristics of the market. The expansion of the eco-friendly product market indicates an increase in demand, while the increased threat of substitute products may reflect a decrease in demand. In addition, market uncertainty affects the organization’s ability to align strategically [104,105,106]. Organizations with low market uncertainty show diagnostic information sharing between the organization and members or among members, whereas those with high uncertainty tend to show reciprocal information sharing [107]. Finally, organization type (for-profit organizations and public organizations) performs an important role in understanding the organization’s strategy in accepting the business environment. For-profit organizations have clear goals (e.g., revenue or net income) and thus, it is relatively easy to implement strategies to promptly respond to changes in the business environment, whereas public organizations tend to have difficulty implementing strategies to quickly cope with environmental changes due to the rigidity of the organization. This tendency is especially strong in Korea. On the other hand, information on the classification of for-profit organizations and public organizations clarifies the differences between different organizational processes. Hence, the classification of organizational types was selected as a contextual variable and included in the analysis. The classification of the three contexts into two groups enabled us to compare and examine possible differences between them.
In this study, organizations were divided into a total of six groups, with two groups for each of the three contexts. First, we divided the organizations into those with high and low sustainability pressure. Environmental pressure (e.g., stakeholders call for environmentally friendly products and processes) and social pressure (e.g., stakeholders pay attention to companies’ commitment to ethical issues, human rights respect, labor conditions) demanded by stakeholders were rated on a seven-point Likert scale (1 = very weak, 7 = very strong). The second group was divided into the organizations with high and low market uncertainty. The technological changes in the key products of the organization and the threats of substitutes were rated on a seven-point Likert scale (1 = very low, 7 = very high). The third group was divided into for-profit organizations and public organizations.
We verified whether the measurement model was maintained in the six groups. The p-value of the Chi-square difference test comparing the unconstrained and full constrained models was greater than the significance level 0.05, implying that the factor structure has not changed [108].
Table 7 shows the unstandardized coefficients for comparison. There were some interesting results in the contextual analysis. First, the effects of strategic alignment, role clarity, and EmpEn varied depending on the context. In the overall model, the effects were strong in StrAliRCgoal, RCgoalRCproc, RCgoalEmpEn, and EmpEnAROE. This implies that RCgoal and EmpEn are key paths in the process in which StrAli affects AROE. StrAli did not have a direct effect on EmpEn and AROE, which is consistent with the results of previous studies [8,13,82]. Sustainability pressure and market uncertainty perform a substantial role in achieving strategic alignment. Organizations with high sustainability pressure and market uncertainty tend to make active use of RCgoal and EmpEn. However, public organizations use RCproc more than for-profit organizations, and the difference in the use of RCproc was statistically significant.
Second, in role clarity, only RCgoal had a positive effect on EmpEn and improved organizational performance. The result that RCproc, which is one aspect of role clarity, did not have a direct effect on EmpEn and AROE in the two contexts (sustainability pressure and market uncertainty) was unexpected. However, in both for-profit organizations and public organizations, RCproc had a significant positive effect on EmpEn. Meanwhile, the effect was greater in public organizations than for-profit organizations, but the gap was statistically insignificant. This may be because public organizations exert much greater pressure on employees regarding rule compliance in performing tasks than for-profit organizations, and the pressure is even greater in Korea.
According to the contextual analysis, EmpEn increases the response to AROE in the following two contexts, and this is statistically significant: (1) sustainability pressure and (2) market uncertainty. In organizations with high sustainability pressure or market uncertainty, the effect of EmpEn on AROE was much more statistically significant. This is not a surprise, considering that organizations with higher sustainability pressure or market uncertainty must respond more quickly to market demands.

6. Discussion and Conclusions

Using data from Korean companies, this study investigated the effects of employees’ perception of strategic alignment on role clarity (e.g., goal and process clarity), employee engagement, and corporate performance. This study presented several cases in Korea that provide empirical evidence regarding the behavioral outcomes of strategic alignment. We tested the structural model using PLS to review whether the relationship between strategic alignment and organizational performance is direct or indirect through the intervening variables of role clarity and employee engagement. The results indicate that role clarity and employee engagement are significantly related to an increase in organizational performance by strategic alignment. This result is consistent with the argument that cognitive and motivational mechanisms are helpful in explaining the effect of the management control system on organizational performance [41,65].
The results (1) show the importance of strategic alignment in improving organizational performance, (2) verify the importance of role clarity in employee engagement, and (3) contribute to the literature on the importance of strategic alignment in role clarity and employee engagement. These results are consistent with the argument that cognitive and motivational mechanisms help explain the impact on organizational performance [41,57,60,65]. In particular, strategic alignment was found to affect employees’ perceptions and motivation, thus affecting organizational performance. As such, this study contributes to the literature on the direct and indirect effects of strategic alignment on organizational performance [8]. From a theoretical perspective, this study demonstrated that the development of a theoretical model that includes relevant cognitive and motivational variables can help improve our understanding of how strategic alignment affects employee behavioral outcomes. The results of this research must be interpreted in light of the study’s limitations. First, this study was conducted only on Korean companies, and all data were collected from Korean organizations; thus, the empirical results cannot be generalized. Second, the data used in this study were cross-sectional. These data provided statistical results fit for our research model, but the cross-sectional design of the model makes it difficult to test the argument regarding causality among the variables. Third, the data were obtained via a self-report survey. Self-report data may engender CMB; we investigated the possibility of CMB using various statistical methods, and even differentiated the source of the data for independent and dependent variables (e.g., organizational performance data and survey data). However, it is necessary to establish a data collection process that fundamentally resolves this issue in the data collection stage. Finally, we attempted to include suitable variables while building the research model as much as possible, but there may still be some omitted correlated variables.
We offer a few suggestions for further research. First, this study was conducted in Korea and the empirical results cannot be generalized. Therefore, further research must expand the scope of data collection to investigate whether employees’ perception of strategic alignment is affected by the culture of each country. Second, this study showed the value of role clarity and employee engagement in strategic alignment. The basic assumption of this study was that strategic alignment is a useful method for promoting organizational performance through the reciprocal activities of role clarity and employee engagement. It is therefore important to conduct further research on employee behaviors and values. Third, it is necessary to perform an expanded survey on whether contextual factors affect the relationships reported herein. In this study, we analyzed a few contextual factors (i.e., sustainability pressure, market uncertainty, organization type, etc.). However, according to the results of reducing uncertainty over decision-making tasks, the relationship of strategic alignment with role clarity, employee engagement, and organizational performance is affected differently by contextual factors, such as the organization’s innovation level or organizational culture. Finally, this study did not evaluate heterogeneity that is not observed in SEM. Therefore, further research must integrate the evaluation of unobserved heterogeneity into data analysis strategies.

Author Contributions

Conceptualization, J.K. and H.K. (HyukJun Kwon); Methodology, J.K.; Data analysis, H.K. (Hyeob Kim). Writing and original draft preparation, J.K.; Writing, review, and editing, J.K., H.K. (HyukJun Kwon), and H.K. (Hyeob Kim); Funding acquisition, H.K. (HyukJun Kwon). All authors contributed to the writing. All authors have read and agreed to the published version of the manuscript.

Funding

This work was supported by the research program of Soonchunhyang University (Grant Number: 20200002).

Conflicts of Interest

The authors declare no conflict of interest.

References

  1. Chan, Y.E.; Sabherwal, R.; Thatcher, J.B. Antecedents and outcomes of strategic IS alignment: An empirical investigation. IEEE Trans. Eng. Manag. 2006, 53, 27–47. [Google Scholar] [CrossRef]
  2. Baker, J.; Jones, D.; Cao, Q.; Song, J. Conceptualizing the dynamic strategic alignment competency. J. Assoc. Inf. Syst. 2011, 12, 299–322. [Google Scholar] [CrossRef] [Green Version]
  3. Skinner, W. Manufacturing: The missing link in corporate strategy. Harv. Bus. Rev. 1969, 47, 136–145. [Google Scholar]
  4. Skinner, W. Manufacturing in the Corporate Strategy; Wiley & Sons: New York, NY, USA, 1978. [Google Scholar]
  5. Hitt, M.A.; Ireland, R.D.; Palia, K.A. Industrial firms’ grand strategy and functional importance: Moderating effects of technology and structure. Acad. Manag. J. 1982, 25, 265–298. [Google Scholar]
  6. Labovitz, H.G.; Rosansky, V.I. The Power of Alignment; John Wiley & Sons, Inc.: New York, NY, USA, 1997. [Google Scholar]
  7. Labovitz, H.G.; Rosansky, V.I. Rapid Realignment: How to Quickly Integrate People, Processes, and Strategy for Unbeatable Performance; John Wiley & Sons, Inc.: New York, NY, USA, 2012. [Google Scholar]
  8. Joshi, M.P.; Kathuria, R.; Porth, S.J. Alignment of strategic priorities and performance: An operations perspective. J. Oper. Manag. 2003, 21, 353–369. [Google Scholar] [CrossRef]
  9. Scherpereel, C.M. Alignment: The duality of decision problems. Manag. Decis. 2006, 44, 1258–1276. [Google Scholar] [CrossRef]
  10. Kaplan, R.S.; Norton, D.P. Alignment: Using the Balanced Scorecard to Create Corporate Synergies; Harvard Business Press: Boston, MA, USA, 2006. [Google Scholar]
  11. Kathuria, R.; Joshi, M.P.; Porth, S.J. Organizational alignment and performance: Past, present and future. Manag. Decis. 2007, 45, 503–517. [Google Scholar] [CrossRef] [Green Version]
  12. Kim, S.K.; Lee, S.W. Measurement diversity, alignment with firm strategy and organizational performance: A note on the mediating role of organizational learning. Korean Account. J. 2011, 20, 75–107. [Google Scholar]
  13. Kim, J.H. BSC (Balanced Scorecard) implementation factors and firm performance: The role of communication, strategic alignment, and cooperation. Korean Account. J. 2011, 20, 233–264. [Google Scholar]
  14. Kim, D.G.; Lee, J.H. The effects of strategic alignment on job performance through role stress: Focused on BSC perspective. Korea Int. Account. Rev. 2015, 63, 95–114. [Google Scholar]
  15. Painter, M.; Pouryousefi, S.; Hibbert, S.; Russon, J.A. Sharing vocabularies: Towards horizontal alignment of values-driven business functions. J. Bus. Ethics 2019, 155, 965–979. [Google Scholar] [CrossRef] [Green Version]
  16. Haseeb, M.; Hussain, H.I.; Kot, S.; Androniceanu, A.; Jermsittiparsert, K. Role of Social and Technology Challenges in Sustainable Competitive Advantage and Sustainable Business Performance. Sustainability 2019, 11, 3811. [Google Scholar] [CrossRef] [Green Version]
  17. Sholihah, M.; Maezono, T.; Mitake, Y.; Shimomura, Y. PSS strategic alignment: Linking service transition strategy with PSS business model. Sustainability 2019, 11, 6245. [Google Scholar] [CrossRef] [Green Version]
  18. Porter, M.E. The contributions of industrial organization to strategic management. Acad. Manag. Rev. 1981, 64, 609–620. [Google Scholar]
  19. Lawrence, P.R.; Lorsch, J.W. Organization and Environment; Reissued as a Harvard Business School Classic, Harvard Business School Press: Boston, MA, USA, 1967. [Google Scholar]
  20. Ciborra, C.U. De profundis? Deconstructing the concept of strategic alignment. Scand. J. Inf. Syst. 1997, 9, 67–82. [Google Scholar]
  21. Smaczny, T. Is an alignment between business and information technology the appropriate paradigm to manage IT in today’s organizations? Manag. Decis. 2001, 39, 797–802. [Google Scholar] [CrossRef]
  22. Henderson, J.C.; Venkatraman, N. Strategic alignment: A framework for strategic information technology management. In Transforming Organizations: 97–117; Kochan, T., Unseem, M., Eds.; Oxford University Press: New York, NY, USA, 1989. [Google Scholar]
  23. Alagaraja, M.; Shuck, B. Exploring Organizational Alignment-Employee Engagement Linkages and Impact on Individual Performance: A Conceptual Model. Hum. Res. Dev. Rev. 2015, 14, 17–37. [Google Scholar] [CrossRef]
  24. Papke-Shields, K.E.; Malhotra, M.K. Assessing the impact of the manufacturing executive’s role on business performance through strategic alignment. J. Oper. Manag. 2001, 19, 5–22. [Google Scholar] [CrossRef]
  25. Porter, M.E. What is strategy? Harv. Bus. Rev. 1996, 74, 61–78. [Google Scholar]
  26. Chenhall, R.H.; Langfield-Smith, K. The relationship between strategic priorities, management techniques and management accounting: An empirical investigation using a systems approach. Account. Organ. Soc. 1998, 23, 243–264. [Google Scholar] [CrossRef]
  27. Chenhall, R.H. Integrative strategic performance measurement systems, strategic alignment of manufacturing, learning and strategic outcomes. Account. Organ. Soc. 2005, 30, 395–422. [Google Scholar] [CrossRef]
  28. Yuliansyah, Y.; Jermias, J. Strategic performance measurement system, organizational learning and service strategic alignment: Impact on performance. Int. J. Ethics Syst. 2018, 34, 564–592. [Google Scholar] [CrossRef]
  29. Shao, Z. Interaction effect of strategic leadership behaviors and organizational culture on IS-business strategic alignment and enterprise systems assimilation. Int. J. Inf. Manag. 2019, 44, 96–108. [Google Scholar] [CrossRef]
  30. Hristov, I.; Chirico, A. The Role of Sustainability Key Performance Indicators (KPIs) in Implementing Sustainable Strategies. Sustainability 2019, 11, 5742. [Google Scholar] [CrossRef] [Green Version]
  31. Bergeron, F.; Raymond, L.; Rivard, S. Ideal Patterns of Strategic Alignment and Business Performance. Inf. Manag. 2004, 41, 1003–1020. [Google Scholar] [CrossRef]
  32. Avison, D.; Jones, J.; Powell, P.; Wilson, D. Using and validating the strategic alignment model. J. Strateg. Inf. Syst. 2004, 13, 223–246. [Google Scholar] [CrossRef]
  33. Collier, J.; Esteban, R. Corporate social responsibility and employee commitment. Bus. Ethics Eur. Rev. 2007, 16, 19–33. [Google Scholar] [CrossRef]
  34. Duarte, F. Working with corporate social responsibility in Brazilian companies: The role of managers: Values in the maintenance of CSR cultures. J. Bus. Ethics 2010, 96, 355–368. [Google Scholar] [CrossRef]
  35. Slack, R.E.; Corlett, S.; Morris, R. Exploring Employee Engagement with (Corporate) Social Responsibility: A Social Exchange Perspective on Organisational Participation. J. Bus. Ethics 2015, 127, 537–548. [Google Scholar] [CrossRef] [Green Version]
  36. Palmer, J.W.; Markus, M.L. The Performance Impacts of Quick Response and Strategic Alignment in Specialty Retailing. Inf. Syst. Res. 2000, 11, 241–259. [Google Scholar] [CrossRef] [Green Version]
  37. Tallon, P.P. The alignment paradox. CIO Insight 2003, 1, 75–76. Available online: https://www.cioinsight.com/c/a/Past-News/Paul-Tallon-The-Alignment-Paradox/ (accessed on 24 January 2020).
  38. Shields, M.D.; Deng, F.J.; Kato, Y. The design and effects of control systems: Tests of direct and indirect effect models. Account. Organ. Soc. 2000, 25, 185–202. [Google Scholar] [CrossRef]
  39. Collins, F. Managerial accounting systems and organizational control: A role perspective. Account. Organ. Soc. 1982, 7, 107–112. [Google Scholar] [CrossRef]
  40. Luckett, P.F.; Eggleton, I.R.C. Feedback and management accounting: A review of research into behavioral consequences. Account. Organ. Soc. 1991, 16, 371–394. [Google Scholar] [CrossRef]
  41. Hall, M. The effect of comprehensive performance measurement systems on role clarity, psychological empowerment, and managerial performance. Account. Organ. Soc. 2008, 33, 141–163. [Google Scholar] [CrossRef]
  42. Nadler, D.A.; Tushman, M.L. A model for diagnosing organizational behavior: Applying a congruence perspective. Organ. Dyn. 1980, 9, 35–51. [Google Scholar] [CrossRef]
  43. Tosti, D.; Jackson, S.F. Organizational Alignment. 2000. Available online: http://www.ichangeworld.com/docs/icwoa0303.pdf (accessed on 19 May 2020).
  44. Weiser, J.R. Organizational alignment: Are we heading in the same direction? Kans. Bank. 2000, 90, 11–15. [Google Scholar]
  45. Boswell, W.R.; Bingham, J.B.; Colvin, A. Aligning Employees through “Line of Sight”. Bus. Horiz. 2006, 49, 499–509. [Google Scholar] [CrossRef] [Green Version]
  46. Buller, P.F.; McEvoy, G.M. Strategy, human resource management and performance: Sharpening line of sight. Hum. Resour. Manag. Rev. 2012, 22, 43–56. [Google Scholar] [CrossRef]
  47. Rhee, M.; Mehra, S. Aligning operations, marketing, and competitive strategies to enhance performance: An empirical test in the retail banking industry. Omega 2006, 34, 505–515. [Google Scholar] [CrossRef]
  48. Alegre, J.; Chiva, R. Alignment between product innovation and competitive priorities. Int. J. Bus. Perform. Manag. 2004, 6, 287–297. [Google Scholar] [CrossRef]
  49. Hicks, K. Construct validation of strategic alignment in learning and talent development. Perform. Improv. Q. 2016, 28, 71–89. [Google Scholar] [CrossRef]
  50. Kahn, R.L.; Wolfe, D.M.; Quinn, R.P.; Snoek, J.D.; Rosenthal, R.A. Occupational Stress: Studies in Role Conflict and Ambiguity; Wiley: New York, NY, USA, 1964. [Google Scholar]
  51. Biggs, A.; Brough, P.; Barbour, J.P. Strategic Alignment with Organizational Priorities and Work Engagement: A Multi-Wave Analysis. J. Organ. Behav. 2014, 35, 301–317. [Google Scholar] [CrossRef]
  52. Sawyer, J.E. Goal and process clarity: Specification of multiple constructs of role ambiguity and a structural equation model of their antecedents and consequences. J. Appl. Psychol. 1992, 77, 130–142. [Google Scholar] [CrossRef]
  53. Hu, J.; Liden, R.C. Antecedents of team potency and team effectiveness: An examination of goal and process clarity and servant leadership. J. Appl. Psychol. 2011, 96, 851–862. [Google Scholar] [CrossRef]
  54. Dilulio, J.D. Principled agents: The cultural bases of behavior in a federal government bureaucracy. J. Public Adm. Res. Theory 1994, 4, 277–318. [Google Scholar]
  55. Knight, D.; Durham, C.C.; Locke, E.A. The relationship of team goals, incentives, and efficacy to strategic risk, tactical implementation, and performance. Acad. Manag. J. 2001, 44, 326–338. [Google Scholar]
  56. Bourne, M.; Pavlov, A.; Franco-Santos, M. The contributing effects of performance measurement and human resource management practices. Int. J. Oper. Prod. Manag. 2013, 33, 1599–1622. [Google Scholar] [CrossRef]
  57. Kahn, W.A. Psychological Conditions of Personal Engagement and Disengagement at Work. Acad. Manag. J. 1990, 33, 692–724. [Google Scholar]
  58. Harter, J.K.; Schmidt, F.L.; Hayes, T.L. Business-Unit-Level Relationship between Employee Satisfaction, Employee Engagement, and Business Outcomes: A Meta-Analysis. J. Appl. Psychol. 2002, 87, 268–279. [Google Scholar] [CrossRef] [Green Version]
  59. Shuck, B.; Wollard, K. Employee Engagement and HRD: A Seminal Review of the Foundations. Hum. Resour. Dev. Rev. 2010, 9, 89–110. [Google Scholar] [CrossRef]
  60. May, D.R.; Gilson, R.L.; Harter, L.M. The Psychological Conditions of Meaningfulness, Safety and Availability and the Engagement of the Human Spirit at Work. J. Occup. Organ. Psychol. 2004, 77, 11–37. [Google Scholar] [CrossRef]
  61. Robinson, D.; Perryman, S.; Hayday, S. The Drivers of Employee Engagement; Institute for Employment Studies: Brighton, UK, 2004. [Google Scholar]
  62. Shon, M.K.; Chang, Y.C. The effect of transformational leadership and transactional leadership on employee job engagement. J. Acad. Ind. Technol. 2013, 29, 125–153. [Google Scholar]
  63. Burney, L.L.; Widener, S.K. Behavioral Work Outcomes of a Strategic Performance Measurement System-Based Incentive Plan. Behav. Res. Account. 2013, 25, 115–143. [Google Scholar] [CrossRef]
  64. Homburg, C.; Artz, M.; Wieseke, J. Marketing Performance Measurement Systems: Does Comprehensiveness Really Improve Performance? J. Mark. 2012, 76, 56–77. [Google Scholar] [CrossRef]
  65. Stringer, C. The Relationship between Strategic Alignment, Meaningful Work, and Employee Engagement (Dissertation Dissertation); The University of New Mexico: Albuquerque, NM, USA, 2007. [Google Scholar]
  66. Spreitzer, G.M. Social Structural Characteristics of Psychological Empowerment. Acad. Manag. J. 1996, 39, 483–504. [Google Scholar]
  67. Spreitzer, G.M.; Kizilos, M.A.; Nason, S.W.A. Dimensional Analysis of the Relationship between Psychological Empowerment and Effectiveness, Satisfaction, and Strain. J. Manag. 1997, 23, 679–696. [Google Scholar]
  68. Weiss, J.A.; Piderit, S.K. The value of mission statements in public agencies. J. Public Adm. Res. Theory 1999, 9, 193–224. [Google Scholar] [CrossRef]
  69. Ripoll, G. Disentangling the relationship between public service motivation and ethics: An interdisciplinary approach. Perspect. Public Manag. Gov. 2019, 2, 21–37. [Google Scholar] [CrossRef]
  70. Abramis, D.J. Work role ambiguity, job satisfaction, and job performance: Meta-analyses and review. Psychol. Rep. 1994, 75, 1411–1433. [Google Scholar] [CrossRef]
  71. Tubre, T.C.; Collins, J.M. Jackson and Schuler (1985) revisited: A meta-analysis of the relationships between role ambiguity, role conflict and job performance. J. Manag. 2000, 26, 155–169. [Google Scholar] [CrossRef]
  72. Boswell, W. Aligning Employees with the Organization’s Strategic Objectives: Out of Line of Sight, Out of Mind. Int. J. Hum. Resour. Manag. 2006, 17, 1489–1511. [Google Scholar] [CrossRef]
  73. Decoene, V.; Bruggeman, W. Strategic Alignment and Middle-Level Managers’ Motivation in a Balanced Scorecard Setting. Int. J. Oper. Prod. Manag. 2006, 26, 429–448. [Google Scholar] [CrossRef]
  74. Hayes, R.H.; Wheelwright, S.C.; Clark, B.K. Dynamic Manufacturing: Creating the Learning Organization; The Free Press: New York, NY, USA, 1988. [Google Scholar]
  75. Powell, T.C. Organizational alignment as competitive advantage. Strateg. Manag. 1992, 13, 119–134. [Google Scholar] [CrossRef]
  76. Smith, T.M.; Reece, S. The relationship of strategy, fit, productivity, and business performance in a service setting. J. Oper. Manag. 1999, 17, 145–161. [Google Scholar] [CrossRef] [Green Version]
  77. Burn, J.M.; Szeto, C. Effective management of information technology: Closing the strategic divide! J. Sci. Ind. Res. 1999, 58, 171–180. [Google Scholar]
  78. Campbell, B.; Kay, R.; Avison, D. Strategic alignment: A practitioner’s perspective. J. Enterp. Inf. Manag. 2005, 18, 653–664. [Google Scholar] [CrossRef] [Green Version]
  79. Kim, M.G.; Woo, C.; Rho, J.J.; Chung, Y.H. Environmental Capabilities of Suppliers for Green Supply Chain Management in Construction Projects: A Case Study in Korea. Sustainability 2016, 8, 82. [Google Scholar] [CrossRef] [Green Version]
  80. West, C.T.; Schwenk, C.R. Top management team strategic consensus, demographic homogeneity, and firm performance: A report of resounding nonfindings. Strateg. Manag. 1996, 17, 571–576. [Google Scholar] [CrossRef]
  81. Homburg, C.; Krohmer, H.; Workman, J.P., Jr. Strategic consensus and performance the role of strategy type and market-related dynamism. Strateg. Manag. 1999, 20, 339–357. [Google Scholar] [CrossRef]
  82. Lindman, F.T.; Callarman, T.E.; Fowler, K.L.; McClatchey, C.A. Strategic consensus and manufacturing performance. J. Manag. Issues 2001, 13, 45–64. [Google Scholar]
  83. Sonnentag, S. Recovery, work engagement, and proactive behavior: A new look at the interface between nonwork and work. J. Appl. Psychol. 2003, 88, 518–528. [Google Scholar] [CrossRef] [PubMed] [Green Version]
  84. Schaufeli, W.B.; Bakker, A.B. Job demands, job resources, and their relationship with burnout and engagement: A multi-sample study. J. Organ. Behav. 2004, 25, 293–315. [Google Scholar] [CrossRef] [Green Version]
  85. Saks, A.M. Antecedents and consequences of employee engagement. J. Manag. Psychol. 2006, 21, 600–619. [Google Scholar] [CrossRef] [Green Version]
  86. Boyer, K.K.; McDermott, C. Strategic Consensus in Operations Strategy. J. Oper. Manag. 1999, 17, 289–305. [Google Scholar] [CrossRef]
  87. Kahn, W.A. To Be Fully There: Psychological Presence at Work. Hum. Relat. 1992, 45, 321–349. [Google Scholar] [CrossRef]
  88. Kim, J.H.; Kim, H.; Kwon, H.J. Corporate social responsibility activity combinations for sustainability: A fuzzy set analysis of Korean firms. Sustainability 2019, 11, 7078. [Google Scholar] [CrossRef] [Green Version]
  89. Ittner, C.D.; Larcker, D.F.; Randall, T. Performance Implications of Strategic Performance Measures in Financial Services Firms. Account. Organ. Soc. 2003, 28, 715–741. [Google Scholar] [CrossRef] [Green Version]
  90. Podsakoff, P.M.; Mackenzie, S.B.; Lee, J.Y.; Podsakoff, N.P. Common Method Biases in Behavioral Research: A Critical Review of the Literature and Recommended Remedies. J. Appl. Psychol. 2003, 88, 879–903. [Google Scholar] [CrossRef]
  91. Kock, N.; Lynn, G.S. Lateral collinearity and misleading results in variance-based SEM: An illustration and recommendations. J. Assoc. Inf. Syst. 2012, 13, 546–580. [Google Scholar] [CrossRef] [Green Version]
  92. Kock, N. Common method bias in PLS-SEM: A full collinearity assessment approach. Int. J. e-Collab. 2015, 11, 1–10. [Google Scholar] [CrossRef] [Green Version]
  93. Wold, H. Partial least squares. In Encyclopedia of Statistical Sciences; Kotz, S., Johnson, N.L., Eds.; Wiley: New York, NY, USA, 1985; Volume 6, pp. 581–591. [Google Scholar]
  94. Chin, W.W. The partial least squares approach to structural equation modeling. In Modern Methods for Business Research; Marcoulides, G.A., Ed.; Lawrence Eribaum Associates: Mahwah, NJ, USA, 1998; pp. 295–336. [Google Scholar]
  95. Hulland, J. Use of Partial Least Squares (PLS) in Strategic Management Research: A Review of Recent Studies. Strateg. Manag. 1999, 20, 195–204. [Google Scholar] [CrossRef]
  96. Reinartz, W.; Haenlein, M.; Henseler, J. An Empirical Comparison of the Efficacy of Covariance-Based and Variance-Based SEM. Int. J. Res. Mark. 2009, 26, 332–334. [Google Scholar] [CrossRef] [Green Version]
  97. Nunnally, J.C. Psychometric Theory; McGraw-Hill: New York, NY, USA, 1978. [Google Scholar]
  98. Fornell, C.; Larcker, D.F. Evaluating structural equations with unobservable variables measurement error. J. Mark. Res. 1981, 18, 39–50. [Google Scholar] [CrossRef]
  99. Preacher, K.J.; Leonardelli, G.J. Calculation for the Sobel Test: An Interactive Calculation Tool for Mediation Tests (Computer Software). Available online: www.quantpsy.org/sobel/sobel.htm (accessed on 19 May 2020).
  100. Ilgen, D.R.; Fisher, C.D.; Taylor, M.S. Consequences of individual feedback on behavior in organizations. J. Appl. Psychol. 1979, 64, 349–371. [Google Scholar] [CrossRef]
  101. Albrecht, S.; Breidahl, E.; Marty, A. Organizational Resources, Organizational Engagement Climate, and Employee Engagement. Career Dev. Int. 2018, 23, 67–85. [Google Scholar] [CrossRef]
  102. Bakker, A.; Schaufeli, W. Positive Organizational Behavior: Engaged Employees in Flourishing Organizations. J. Organ. Behav. 2008, 29, 147–154. [Google Scholar] [CrossRef]
  103. Liphadze, S.M.; Vermaak, A.P. Assessment of employees’ perceptions of approaches to sustainable water management by coal and iron ore mining companies. J. Clean. Prod. 2017, 153, 608–625. [Google Scholar] [CrossRef]
  104. Bergeron, F.; Raymond, L.; Rivard, S. Fit in strategic information technology management research: An empirical comparison of perspectives. OMEGA Int. J. Manag. Sci. 2001, 29, 125–142. [Google Scholar] [CrossRef]
  105. Chang, H.L.; Wang, K.; Chiu, I. Business-IT fit in e-procurement systems: Evidence from high-technology firms in China. Inf. Syst. J. 2008, 18, 381–404. [Google Scholar] [CrossRef]
  106. Huang, L.K. The contingent role of innovation between IT management sophistication and strategic alignment. J. Glob. Inf. Manag. 2009, 17, 60–92. [Google Scholar] [CrossRef] [Green Version]
  107. Simons, R. Performance Measurement and Control Systems for Implementing Strategies; Prentice Hall: Upper Saddle River, NJ, USA, 2000. [Google Scholar]
  108. Arbuckle, J.L. Amos 17.0 User’s Guide; Amos Development Corporation: Crawfordville, FL, USA, 2008. [Google Scholar]
Figure 1. The alignment framework. Source: adapted from Labovitz and Rosansky [7].
Sustainability 12 04180 g001
Figure 2. Research model.
Sustainability 12 04180 g002
Figure 3. Structural model results (n = 158). Unstandardized coefficients are significant at * p < 0.10, ** p < 0.05, *** p < 0.01. The dotted lines represent insignificant paths. StrAli refers to strategic alignment, RCgocl refers to role clarity in goal setting, RCproc refers to role clarity in process setting, EmpEn refers to employee engagement, AROE refers to firm performance.
Sustainability 12 04180 g003
Table 1. Constructs, definitions, and literature base.
VariablesDefinitionLiterature
Strategy AlignmentStrategyPerception and acceptance of the company’s strategy[6,7]
CustomerEfforts in managing information and process for customer satisfaction
EmployeeSatisfaction with work results and rewards of members of the organization
ProcessExecutives’ level of management in work processes
Role ClarityGoal ClarityExtent to which members clearly understand the goals and responsibilities of work related to their jobs[41,52]
Process ClarityExtent to which members clearly understand the processes required in performing tasks related to their jobs
EngagementEmployee EngagementEmployees’ enthusiasm for work in addition to individual participation and satisfaction[60,65,87]
Organizational
Performance
AROEThree-year average ROE of companies adjusted to three-year market average ROE by type of business[88]
Table 2. Description of sample.
(1) Respondents by KSIC-9
KSIC CodeNameFrequencyPercent
Profit organization:
16Wood products41.6
20Chemicals218.6
21Basic metals52.1
26Electronic components104.1
30Motor vehicles2911.9
32Furniture52.1
35Electricity supply93.7
41Construction93.7
46Wholesale and retail197.8
49Transportation52.1
60Broadcasting41.6
64Financial2811.5
71Other professional services20.8
96Information and communication services83.2
Non-profit organization:
Public organization8635.2
Total244100.0
(2) Respondents by Position
PositionFrequencyPercent
CEO20.8
Directors62.5
Heads of Department7530.7
Managers8735.7
Assistant managers4518.4
Staff2911.9
Total244100.0
(3) Firms by Size
Number of employeesFrequencyPercent
Less than 100229.0
100–2493413.9
250–4994618.9
500–9994317.6
1000–24992911.9
2500 and over7028.7
Total244100.0
(4) Company Tenure
MinimumMaximumMeanStd Dev.
Company tenure (years)1319.967.11
KSIC-9: Korea Standard Industry Code-9.
Table 3. Full collinearity VIFs.
ConstructsEmpEnAROERCgoalRCprocStrAli
EmpEn1.821
AROE
RCgoal2.7623.2701.051
RCproc2.6542.714
StrAli1.0671.0731.0001.051
Note: StrAli—strategic alignment, RCgoal—goal clarity, RCproc—process clarity, EmpEn—employee engagement, AROE—the three-year average of industry-adjusted return on equity.
Table 4. Measurement model and descriptive statistics (n = 158).
Constructs and ItemsLoadingsMeanStd. Dev
StrAli: AVE: 0.744; CR: 0.920; α: 0.887
strategy 0.904 ***9.5681.479
sa_s1Organizational strategies are clearly communicated to members.0.677 ***5.0380.961
sa_s2Organizational strategies guide the identification of the skills and knowledge I need.0.700 ***5.0060.882
sa_s3People here are willing to change when new organizational strategies require it.0.787 ***4.9240.952
sa_s4Our senior managers agree on the organizational strategy.0.813 ***4.8671.068
customers 0.780 ***9.1871.816
sa_c1For each service our organization provides, there is an agreed-upon, prioritized list of what customers care about.0.942 ***4.6771.294
sa_c2People in this organization are provided with useful information about customer complaints.0.732 ***4.8611.040
sa_c3Strategies are periodically reviewed to ensure the satisfaction of critical customer needs.0.737 ***4.7151.050
sa_c4Processes are reviewed regularly to ensure that they contribute to the attainment of customer satisfaction.0.705 ***4.8041.105
employee 0.856 ***9.1151.787
sa_e1Our organization collects information from employees about how well things work.0.642 ***5.0890.957
sa_e2My work unit or team is rewarded for our performance as a team.0.800 ***4.4941.349
sa_e3Groups within the organization cooperate to achieve customer satisfaction.0.844 ***4.7781.094
sa_e4When processes are changed, the impact on employee satisfaction is measured.0.827 ***4.7851.229
processes 0.904 ***9.2451.619
sa_pr1Our managers care about how work gets done as well as about the results.0.699 ***4.6141.140
sa_pr2We review our work processes regularly to see how well they are functioning.0.713 ***4.8541.024
sa_pr3When something goes wrong, we correct the underlying reasons so that the problem will not happen again.0.907 ***4.7911.031
sa_pr4Processes are reviewed to ensure they contribute to the achievement of strategic goals.0.703 ***4.9110.957
RCgocl: AVE: 0.758; CR: 0.940; α: 0.920
rc1The goals and objectives for my job0.909 ***5.5380.978
rc2How my work relates to the overall objectives of my work unit0.890 ***5.4870.979
re3My duties and responsibilities0.898 ***5.7090.859
rc4The expected results of my work0.866 ***5.5890.929
rc5What aspects of my work will lead to positive evaluations0.784 ***5.3421.135
RCproc: AVE: 0.660; CR: 0.906; α: 0.870
rc6How to divide my time among the tasks required of my job0.843 ***5.2910.996
rc7How to schedule my workday0.892 ***5.0571.039
rc8How to determine the appropriate procedures for each work task0.700 ***4.9181.190
rc9The procedures I use to do my job are correct and proper0.742 ***5.1581.016
rc10I know the best way to do my job0.868 ***5.1461.011
EmpEn: AVE: 0.594; CR: 0.909; α: 0.882
ee1Performing my job is so absorbing that I forget about everything else0.656 ***4.5701.149
ee2Time passes quickly when I perform my job0.776 ***5.5441.053
ee3I really put my heart into my job0.871 ***5.4750.933
ee4I get excited when I perform well in my job0.795 ***5.3101.179
ee6I am rarely distracted when performing my job0.822 ***5.5510.980
ee7I don’t think about other things when performing my job0.868 ***5.6010.980
AVE—average variance extracted 0.5 or above indicates good convergent reliability. CR—composite reliability of 0.7 or above indicates good convergent reliability. Cronbach’s alpha of 0.7 or above indicates good indicator reliability. *** p < 0.001.
Table 5. Inter-construct correlation, discriminant validity (n = 158).
Constructs aMeanStd Dev.StrAliRCgoclRCprocEmpEnAROE
StrAli9.7241.4680.862b
RCgocl5.5300.8500.219 ***0.871
RCproc5.1140.8520.096 ***0.786 ***0.812
EmpEn5.3420.8360.770 ***0.591 ***0.591 ***0.770
AROE10.37912.8870.134 ***−0.003−0.065 ***0.142 ***1.000
*** p < 0.001, a StrAli—Strategic Alignment, RCgocl—Role Clarity in goal setting, RCproc—Role Clarity in process setting, EmpEn—Employee Engagement. b The square root of the AVE value for each of the constructs along the diagonal (in bold).
Table 6. PLS (partial least squares) results: path estimations for the complete sample, n = 158.
Panel A: Path Coefficients, t-Statistics, and R2
Latent VariablePath to
RCgoalRCprocEmpEnAROE
StrAli0.219 (2.597) ***−0.080 (1.586)−0.056 (0.845)0.147 (2.148) **
RCgoal0.803 (26.375) ***0.528 (5.795) ***−0.081 (0.433)
RCproc0.182 (1.865) *−0.190 (1.135)
EmpEn0.296 (2.298) **
AROE
R20.0480.6230.4510.074
Panel B: Indirect Effects and t-Statistics (Sobel’s Test)
Latent VariableLinkagesPath to
RCgoalRCprocEmpEnAROE
RCgoalRCproc 0.146 (1.783) *−0.153 (1.128)
EmpEn 0.156 (2.065) **
RCprocEmpEn 0.054 (1.486)
StrAliRCgoal 0.176 (2.427) **0.116 (2.194) **−0.018 (1.124)
RCproc −0.015 (1.197)0.015 (0.814)
EmpEn −0.017 (0.698)
RCgoal/EmpEn 0.034 (1.640) *
RCproc/EmpEn 0.043 (1.502)
RCgoal/RCproc 0.032 (1.474)−0.033 (0.952)
RCgoal/RCproc/EmpEn 0.009 (1.286)
Coefficients are significant at * p < 0.10, ** p < 0.05, *** p < 0.01. Note: StrAli—strategic alignment, RCgocl—role clarity in goal setting, RCproc—role clarity in process setting, EmpEn—employee engagement, AROE—firm performance. Sobel’s test is used to test the statistical significance of the indirect relationship between an independent construct and a dependent construct through a mediator [99]. The test generates t-statistics and p-values for the indirect path.
Table 7. Contextual analysis (unstandardized coefficient and t-values).
RelationshipSustainability Pressure aMarket Uncertainty aOrganization Type b
High (n = 117)Low (n = 41)│Diff.│High (n = 101)Low (n = 57)│Diff.│Profit (n = 158)Public (n = 86)│Diff.│
StrAli -> RCgoal0.299
(3.786) ***
0.117
(0.693)
0.182
(1.098)
0.284
(2.759) ***
0.183
(1.238)
0.102
(0.558)
0.168
(1.598) *
−0.130
(0.498)
0.298
(1.396)
StrAli -> RCproc−0.064
(1.104)
−0.118
(0.988)
0.054
(0.447)
−0.102
(1.648) *
−0.031
(0.336)
0.071
(0.637)
−0.079
(1.287)
−0.071
(0.819)
0.008
(0.046)
StrAli -> EmpEn−0.035
(0.499)
−0.100
(0.730)
0.065
(0.449)
−0.031
(0.410)
−0.077
(0.557)
0.045
(0.306)
−0.056
(0.658)
−0.042
(0.468)
0.014
(0.103)
StrAli -> AROE0.127
(1.584)
0.135
(0.657)
0.008
(0.041)
0.145
(1.491)
0.145
(1.116)
0.000
(0.007)
RCgoal -> RCproc0.820
(26.097) ***
0.767
(9.643) ***
0.053
(0.738)
0.836
(26.409) ***
0.773
(14.103) ***
0.063
(1.068)
0.779
(26.475) ***
0.863
(23.564) ***
0.085
(1.738) *
RCgoal -> EmpEn0.546
(5.007) ***
0.497
(2.248) **
0.049
(0.209)
0.511
(3.917) ***
0.603
(3.364) ***
0.092
(0.418)
0.356
(6.549) ***
0.542
(5.149) **
0.014
(0.083)
RCgoal -> AROE−0.502
(0.231)
−0.106
(0.372)
0.054
(0.128)
−0.024
(0.104)
−0.099
(0.498)
0.075
(0.206)
RCproc -> EmpEn0.179
(1.473)
0.178
(0.820)
0.001
(0.002)
0.217
(1.528)
0.061
(0.326)
0.156
(0.654)
0.146
(1.646) *
0.361
(3.354) ***
0.215
(1.398)
RCproc -> AROE−0.297
(1.412)
−0.021
(0.121)
0.276
(0.737)
−0.337
(1.426)
−0.021
(0.158)
0.316
(0.928)
EmpEn -> AROE0.463
(2.979) ***
−0.121
(0.585)
0.583
(2.024) **
0.480
(2.919) ***
−0.099
(0.764)
0.579
(2.439) ***
Coefficients are significant at * p < 0.10, ** p < 0.05, *** p < 0.01. a—companies (profit organization) that can use ROE from the sample data in this paper (excluded for response data from both performance managers and public organizations), b—all sample data (excludes for response data from performance managers), third, EmpEn has a significant effect on AROE.

