1. Introduction
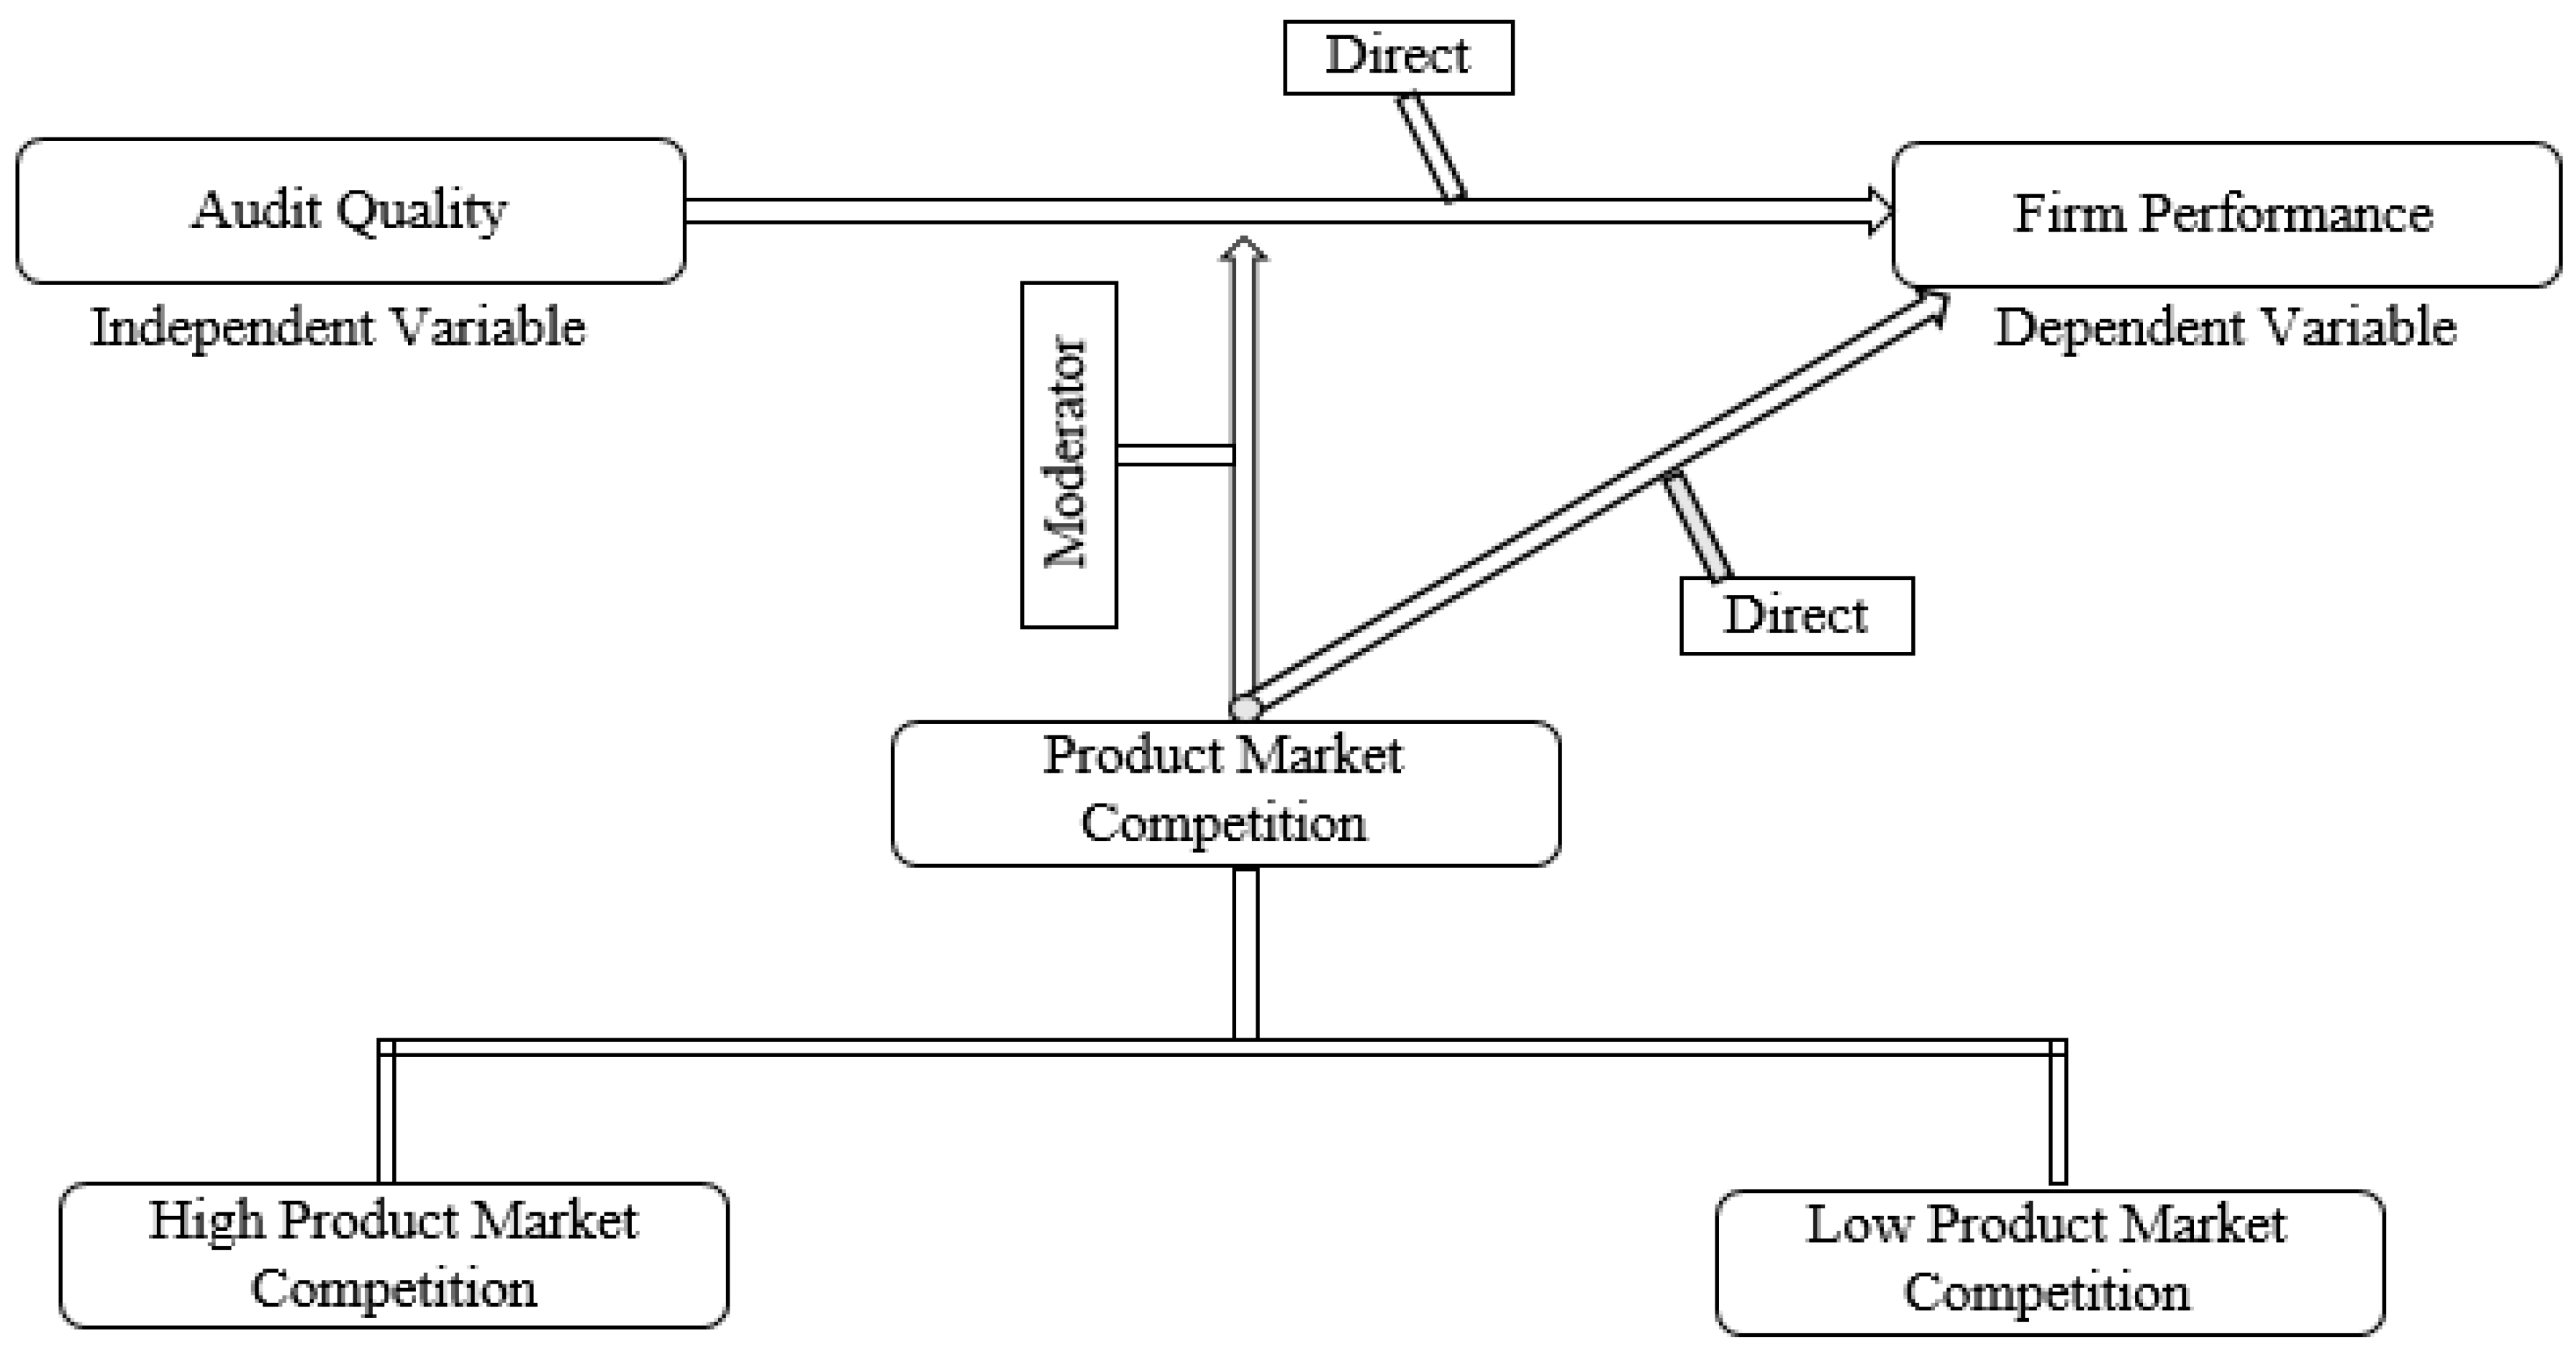
This study mainly examines the impact of audit quality (AQ) on firm performance (FP), and focuses on the product market competition (PMC) to investigate the impact on the association between the AQ and FP. We classified the PMC into high product market competition (HPMC) and low product market competition (LPMC) by considering the Herfindahl–Hirschman Index (HHI). We selected the Pakistani manufacturing sector and used panel data for the period from 2010 to 2017.
The major problem in this study that motivated our investigation is the lack of adept human resources regarding the financial and accounting professional in the Pakistani market. We believed that fraudulent practices and a deficiency of transparency are major problems in the firms of developing economies, like Pakistan [
1,
2]. Furthermore, in the Pakistani context, few studies investigated the association between the AQ and FP. On the contrary, many previous studies demonstrated mixed evidence related to the relationship between the AQ and FP. For example, Al Ani and Mohammed [
3]; Arshad, Satar, Hussain, and Naseem [
4], and Matoke and Omwenga [
5] reported a positive connection between the AQ and FP. On the other hand, Lin and Hwang [
6], and Sulong, Gardner, Hussin, Mohd Sanusi and McGowan [
7] discovered a negative association between the AQ and FP. There was no conclusive evidence in the previous literature regarding the connection between the AQ and FP, either positively or negatively connected.
In this regard, we proposed that the PMC is an imperative mean to inspect the connection between AQ and FP. Leventis, Weetman, and Caramanis [
8] contended that competition is a fine tool for firms to overcome the agency cost. In addition, Wang and Chui [
9] reported that the PMC compels firms to adopt a high quality audit for improved financial performance. Moreover, Marciukaityte and Park [
10] explained that the HPMC enhances a firm’s transparency and financial reporting with quality audits for a differentiated image in the market. Samuel and Schwartz [
11] presented that the HPMC demands quality audits for an innovative and differentiated image in high-competition. Therefore, we applied the interaction of PMC to examine the connection between the AQ and FP.
To complete this investigation, this study employed various statistical techniques. Initially, we detected the endogeneity in the dataset by employing the Durbin–Wu–Hausman test. Further, we used the fixed-effect model to control the heterogeneity issue. Finally, we applied the generalized method of moment (GMM) model to control the endogeneity issue from our panel dataset. Additionally, we employed the robustness examination to provide strong evidence about our results.
This study demonstrated various outcomes. The AQ significantly and positively affected the FP, and the HPMC positively affected the FP, while the LPMC negatively affected the FP. The interaction of HPMC positively affected the connection between the FP and AQ. In addition, the interaction of LPMC negatively affected the connection between the FP and AQ. These findings contribute to the literature in the following ways. First, this investigation expanded the significance of the AQ for the industrial sector. Secondly, this investigation provided evidence regarding the significant role of the PMC for the FP and AQ. Furthermore, the agency problem was mitigated by PMC to resolve the issues between managers and shareholders that ultimately enhanced the firm’s financial reporting [
12].
This study has multiple recommendations for governments, policymakers, owners, investors, and shareholders. The government can play a significant role to enhance the AQ for firms. An independent audit creates a good social image of the firm in the market. Policymakers of the firms can consider the AQ and PMC as important corporate governance (CG) factors for improved outcomes. This study is a beacon light for countries that have the same capital and financial market who can implement these findings for positive outcomes. According to our knowledge, this is a purely new study for equally developing and developed economies.
The rest of the paper is classified into various sections. In
Section 2, we describe the importance of this study in the context of Pakistan. In
Section 3, we show the literature review and theory building framework for hypothesis development. In
Section 4, we briefly explain the methodology adopted for the investigation. In
Section 5, we show the results and discussion. Lastly, in
Section 6, we conclude the study along with policy implications. The investigation process and the conceptualization of its findings are shown in
Figure 1.
2. Importance of the Study in the Context of Pakistan
Pakistan is a country that faces poor law implementation and is involved in intense political corruption [
1,
2]. Ibrahim [
13] proved the difficulties of CG in Pakistan and their outcomes suggested that the Security and Exchange Commission of Pakistan (SECP) needs to extend the internal and external CG mechanism in Pakistan in the form of the appointment of non-executive directors and one legal professional for audits. Similarly, Malaysian Banks in 2007 issued guidelines for listed firms to make an AC, which should contain non-executives and not less than three members appointed by the decision of the majority of independent non-executives [
14].
Ali Shah and Butt [
15] reported that the Pakistani industrial market is controversial because most of the firms in Pakistan have family ownership and unrepresentative board directors. This situation may create an agency problem. Pakistan was ranked at 116 out of 176 countries in the context of corruption [
16]. In addition, the Pakistani market has a higher rate of lack of transparency, highly concentrated ownership, and a low equity market, which is associated with huge volatility and turnover and majorly relies on bank financing rather than the equity financing [
2,
17]. However, the Pakistani market is following the Anglo-American code of corporate governance, which makes it unique compared to other developing economies [
18].
Practical auditing practices in Pakistan are not very strong because 87% of companies are owned by the controlling shareholders, which have involvement in management tasks [
19]. Various scholars stated that corporate governance and auditing practices could gain strength, due to multiple organizational and managerial systems across different countries, such as security and safety laws, political conditions, taxation rules, and cultural differences. However, Pakistani corporate governance practices are different from developed economies because these practices are still under improvement [
20,
21]. Moreover, Pakistan listed firms are facing resource constraints for adopting the proper corporate governance practices as independent audit and other board committees [
22]. In addition, family members hold key positions in the corporate governance of Pakistani firms and have an influence on the auditors and other board practices [
23].
Despite this reality, Pakistan is considered a law abiding country that considers investor security and protection on priorities for the enhancement shareholders confidence, which builds up suitable stock markets [
24,
25]. Pakistan has exclusive financial and capital markets that have various social and political structures in comparison to developed economies [
18]. The issue of fairness and transparency has enhanced the demand for the quality of audit and corporate governance all over the world; thus, a legislative in the US passed the Sarbanes–Oxley Act in 2002. Pakistan developed a proper legal system to cope with the above-mentioned problems and enacted the code of corporate governance, which was established by SECP in 2002 with collaboration International Monitory Funding (IMF) and the World Bank [
2,
17].
This code is intended for the improvement of governance, transparency, and financial reporting to protect investor interests. This code normally provides regulations for companies to pursue the accounting rules and regulations related to financial reporting disclosure, top management compensation problems, ownership structure, etc. There is a provision available for external auditors in this code of CG. This provision explains that an external auditor must be independent and from well-reputed firms as per ratings provided by the Institute of Chartered Accountants of Pakistan (ICAP). The AC recommendations are applicable to appoint an auditor for one year. According to SECP, every listed firm must replace their external auditors every five years [
26].
Furthermore, the research work on auditing practices in Pakistan is limited, and few studies have investigated the role of audits for firm performance, e.g., Reference [
4,
27,
28]. No prior studies investigated the reason and need for auditing and why it may be associated positively or negatively with firm performance. There is a need to further enhance the accounting practices in Pakistan, according to the International Financial Reporting Standard (IFRS) for worthy financial reporting. After considering the above circumstances related to audit activities and corporate governance, there is an intense need to look at the AQ and PMC role for FP in Pakistan.
3. Theoretical Framework and Hypothesis Development
3.1. Audit Quality and Firm Performance
The Cadbury Code was published in the United Kingdom in 1992 to deal with audit matters, and this code has recommendations for firms to create Audit Committees (AC) with an independent expert [
29]. In addition, an auditor has a social responsibility to reduce the risk related to misstatement and to enquire after financial statement rules and regulations [
30]. In this context, agency theory sheds light on the association between the agent and the principal. This affiliation leads to certain problems, including information asymmetry and agency costs. The principal can be influential on an agent by providing incentives or other rewards [
31].
The agent can also be a part of principal interest for the sake of incentives (Bonazzi and Islam [
32]. The audit of a financial statement is an observing apparatus that helps to minimize the information asymmetry and keep safe the intentions of multiple shareholders by providing a suitable guarantee that the records are free from any kind of errors and frauds [
3]. Moreover, the Limperg institute of the Netherlands presented the inspired confidence theory for auditors in 1985. This theory proposed that if auditor works as a principal, it may have a lack of trust in the agents; therefore, they use another technique to reinforce the trust in the agents, such as an external audit [
5].
An auditor has various responsibilities, such as finding the error and frauds, detect misleading information, and presenting them truly for transparency. The audit is an element of governance, which has a significant role in the private and government sector as well. A professional and independent auditor can improve transparency in both sectors [
27]. An auditor has a major role in managing and controlling the accounting and financial activities, which produces quality in the transparency of financial statements [
33].
An audit committee (AC) can play a vital role in quality audits, and an AC works as a sub-committee of the board, which is the imperative part of corporate governance [
34]. The Security and Exchange Commission of Pakistan (SECP) has formed and implemented multiples provisions in this perspective [
35]. The SECP presented the code of corporate governance, which has a proper introduction for hiring external and internal auditors. This AC is not only for the assistance for the Board of Directors (BOD), but it also addresses the shareholders’ concern. The BOD of every listed firm has the responsibility to form this AC, which shall not be less than the three members, including the chairman. The chairman must be an independent director.
The major purpose of this AC is to monitor the financial reporting activities and other transparency matters. This AC shall meet with the head of audits and BOD quarterly in every financial year. The BOD shall measure the performance of this AC. This AC has various terms of references for further improvement of the AQ, such as quarterly performance examinations, an inspection of financial reports before publication, facilitation of the external auditors, to examine the efficiency of internal auditors, management letter evaluations provided by the external auditor, and detailed inspections of the internal control system.
Audit quality (AQ) is an imperative tool of a strong equity market, for that reason, an audit can raise the worth of financial statements and directly encourage the CG activities with translucent financial reporting [
36]. The AQ helps to improve the performance of firms [
3]. The independence of the audit committee positively correlates with the FP [
4]. The large firms invest handsome amounts of funds to reduce audit errors and faults, which results in the shape of good performance (DeAngelo [
37]; Beatty [
38]). Audit committees, with their independence, form a valuable way to affect the audit fees and performance of the auditors in Pakistan [
34]. The improved quality of the financial reporting of the firms is associated with an effective AQ [
39]. The degree of auditor independence matters for the best quality of an audit, which leads to better performance of the firms [
5].
The development of the first hypothesis is based on the above empirical literature and theoretical foundation:
Hypothesis 1. Audit quality has significant and positive effects on firm performance.
3.2. The Connection between Firm Performance and Product Market Competition
According to Smith [
40], a monopoly is sometimes not a good situation for businesses because it leads to poor management. Competing theories reported a negative connection between competition and profitability [
41]. Therefore, Porter [
42] demonstrated that in high-competition firms, profit may suffer because a competitive market leads to a reduction in pricing power. Additionally, the classical theory suggested that competition plays a resistance role for firms in the same industry [
42]. This is because high-competition may produce extra barriers for firms and may ultimately stop or reduce firm growth. Firms falling in that circumstance will lead to lower profitability. On the other hand, Porter [
43] proposed a hypothesis that stated that firms in high-competition attempt to enhance efficiency by making innovative products. Different assessments are available as economists stated that the effectiveness of resource allocation could be improved by product market competition [
41]. Classical theories stated that competition is to be considered as a role of opposition amid firms within the same sector [
42].
The agency cost can also be minimized with the help of a competitive market. Competition is an imperative means to put pressure on managers for working harder on behalf of shareholders, and thus, agency cost can be minimized with PMC [
12]. High-competition encourages corporate governance factors to be focused on the improvement of profit [
44]. A competitive market is helpful to enhance the firm’s profit [
45]. In addition, product market competition is not only important for firm performance but also improves corporate governance practices [
46]. Higher competition is a valuable source for the improvement of firm performance and market share [
47]. The improvement of firm performance generally depends upon the good corporate governance practices; thus, in this context, competition plays a vital role [
48]. High-competition improves firm management as well as the whole CG, which ultimately captures a higher profit than less competitive firms [
49].
Furthermore, high-competition forces firms to reduce the overuse of resources and adopt social activities for market differentiation. This practice enhances a firm’s profitability [
50]. Product market competition plays as an alternative model of corporate governance, which forces management to be disciplined and work hard for the maximization of profit [
51,
52]. In addition, high-competition and low-competition have different roles for firm performance. Higher competition enhances firm performance, while lower competition reduces firm performance [
53]. After considering the above empirical and theoretical literature, we proposed the subsequent hypothesis:
Hypothesis 2. The extent of product market competition is directly linked to firm performance: If the extent of PMC is high, FP is higher, and vice versa.
3.3. The Connection between Audit Quality and Firm Performance with the Moderating Role of Product Market Competition
According to the previous literature, audit quality is beneficial for the improvement of firm performance because audit quality builds stakeholder confidence, which leads to higher profitability [
3,
4]. Economic institutions argue that market forces have huge effects on audit quality, which forces firms to adopt international accounting rules and regulations [
30]. Furthermore, it is always a top priority for firms to reduce the agency cost, and competition plays a vital role in minimizing the agency cost [
8].
Market investigations suggested that competition is an important aspect of the market. For example, the firms in France considered audit quality as joint auditing because the dominance of large audit firms can be reduced by market competition [
54]. Audit firms also have competition in the market; therefore, they focus on the quality of work to win the confidence of the owners and shareholders [
55].
Prior scholars discovered that agency problems among managers and shareholders could be mitigated by a product’s market competition, and this enhances the need for firm audit quality [
8]. Product market competition (PMC) forces firms to present transparent reports of the financial and non-financial matters for the satisfaction of shareholders and investors, which improves the relationship with management. This improved relationship reduces agency cost and leads to increase in the profit of firms [
10]. A highly competitive market requires a firm reputation and image for long-term survival, and fair and transparent reporting of the financial matters enhances the firm’s reputation, which can be associated with quality of audit [
56,
57,
58]. Firms have huge incentives for external auditors to mitigate higher agency costs in the competitive market [
36]. Audit quality enhances confidence between managers and shareholders, which ultimately reduces agency costs [
59]. High-competition demands quality audits for firms to win investor confidence [
11].
Manufacturing firms are more willing to pay higher audit fees for quality audits in highly competitive market for the enhancement of profit [
9]. The concept of product market competition for the improvement of firm performance has gained importance with the passage of time throughout the world [
60]. A competitive market has several peers for firms as every firm attempts to make differentiation in the competitive market [
61]. In addition, higher product market competition (PMC) improves the firm’s financial reporting, and thus, accurate financial reporting builds confidence between the stakeholders and managers, which captures good profits [
10].
Furthermore, PMC is much valuable for the firms of the developing economies because higher competitive market compels firms to adopt regulations for the improvement of firm performance [
41]. Audit quality and higher competitive market increase in the audit fees for the satisfaction of shareholders and investors, which ultimately enhances profit [
9]. Porter [
43] discovered that firms are interested in developing an innovative image in a highly competitive market, and enhance firm reputation and image by increasing the audit quality [
33]. Moreover, firms in higher competitive markets focus on the audit practices to improve transparency for the satisfaction of shareholders, and that practice enhances firm profits [
11].
Branco and Villas-Boas [
62] reported that the accuracy of financial and non-financial reporting of firms gives higher access in the capital market. The audit quality and audit market are associated with supply and demand, and this association may be enhanced or reduced with the competition in the market [
11]. PMC is a valuable tool to enhance firm performance because it forces firms to adopt better quality of audit [
9]. Moreover, Marciukaityte and Park [
10] argued that PMC enhances transparency and financial reporting of firms with quality audit for a differentiated image in the market. Similarly, Samuel and Schwartz [
11] suggested that higher PMC demands quality audit for an innovative and differentiated image.
On the other side, competition is also associated with a higher business risk [
63]. According to the scholars, firms with high product market competition face low profits and this situation creates risks for businesses and motivate firms to avoid the accounting regulations [
62].
Therefore, by following the above studies, this research used product market competition (PMC) as an interactive element to discover the conditions that create positivity or negativity between the FP and AQ. This study was the first of its type to analyze the moderating role of PMC. No previous study discovered the moderating role of PMC on the connection between firm performance and audit quality. After considering the above empirical and theoretical literature, we proposed the subsequent hypotheses,
Hypothesis 3. Audit quality significantly positively affects firm performance with moderating effects of high product market competition.
Hypothesis 4. Audit quality significantly negatively affects firm performance with moderating effects of low product market competition.
4. Data, Sample and Research Methods
4.1. Sample Selection and Data Collection
The manufacturing sector of Pakistan was selected for this investigation. This sector was further divided into 16 different sub-sectors: woolen, textile weaving, chemical, textile composite, fertilizer, cement, pharmaceutical, transport, oil and gas marketing, engineering, cable and electrical goods, automobile parts and accessories, oil and gas exploration, synthetic and rayon, automobile assembly, and refinery. These sectors include 242 companies that satisfy the need for data for this investigation. We dropped all those firms that did not have data. Moreover, we also dropped those firms that were declared defaulted by the Pakistan Stock Exchange (PSX). Furthermore, we selected only those firms that were registered in the PSX after 2008 and continued the work during the whole sample period.
We selected only those firms that owned 100 million rupees (62,0391 USD) or more as outstanding shares. In addition, we selected only those firms that had an external auditor [
35]. Finally, after applying this criterion to choose the firms, we deleted 95 companies from the sample and selected 147 companies for investigation. We collected data from different sources, including the Pakistan Stock Exchange (PSX), State Bank of Pakistan (SBP), Securities and Exchange Commission of Pakistan (SECP), and the firms’ annual reports and data from 2008 to 2017.
The following reasons encouraged us to choose the manufacturing sector for analysis. The manufacturing sector has the highest participation in Pakistani exports compared with the other sectors [
64]. Manufacturing firms have higher transparency and information disclosure in Pakistan with the motive of a positive image in the market [
65]. In addition, manufacturing firms that are involved in the production process have large resources and huge labor costs, which leads to higher competition and requires adept professionals for auditing. Therefore, there is an intense need to investigate the product market competition and audit activities [
9]. The role of corporate governance practices is crucial in manufacturing firms, and better corporate governance enhances firm performance [
66].
4.2. Measurement of Variables
4.2.1. Firm Performance
This study used firm financial performance as a dependent variable. Accurate measurements of the variables have fair and significant effects on empirical studies; therefore, there is a need to calculate the variables accurately [
67]. We measured firm performance using two variables, return on assets (ROA) and sustainable growth rate (SGR). First, ROA is measured as the total profit of the firm is divided by the total assets of the firm [
68,
69,
70]. Various scholars revealed that ROA is a good performance measure as a comparison to the other accounting-based measurements [
71,
72]. Furthermore, ROA shows the management behavior for the use of asset efficiency and enhances the shareholders’ value [
73].
Second, SGR is a valuable market base measure as it shows financial policies that lead to a higher profit of the firm [
74]. Moreover, market-based measurements show the firm’s opportunities and growth [
75]. We measured the SGR by using the following formula, in line the previous study conducted by Feng, Chen, and Tang [
76].
4.2.2. Audit Quality Measurement
According to recent literature, various scholars used multiple means to compute the AQ, such as Safdar, Chaudhry, Mirza, and Yu [
77], and DeFond and Zhang [
78], who proposed an AQ measurement using the auditor size, for example, a firm that is audited by the big four companies. In addition, Matoke and Omwenga [
5] developed an AQ measurement with different proxies, such as auditor independence, auditor firm size, auditor experience, and auditor expectation. Importantly, some scholars used audit fees as AQ measurements because the fees normally summarized both the supply and demand elements related to an audit [
79]. Therefore, we used two approaches to calculate accurate measurements for the AQ. First, by following Frankel, Johnson, and Nelson [
79], and Waweru [
33], we calculated the AQ as the statutory audit fees to the number of sales. Secondly, we used the auditory experience as another audit quality measurement by considering (Matoke and Omwenga [
5]).
4.2.3. Product Market Competition
According to Zou, Zeng, Lin, and Xie [
80], HHI is the best approach to calculate the firm PMC. PMC as HHI is an imperative tool to examine for audit studies because it presents an actual competitive position of the firm in the market which is based on the sales [
9]. In addition, Javeed, Latief, and Lefen [
41] reported that PMC as HHI has positive effects on the firm performance. For empirical studies, HHI is the best approach to calculate the market competition because PMC reveals the firm position in the form of sale and product sales put pressure on competitors [
80]. Moreover, Giroud and Mueller [
44] also exposed that firm-level competition normally depends upon the product sales which reflects the firm profitability as well, and therefore, HHI has importance for the calculation of firm-level competition. Empirical studies on corporate governance generally considers HHI to examine the product market competition in firm-level data [
81]. Giroud and Mueller [
44] exposed that firms facing competition have a focus on sales for the maximization of profit.
This study used firm-level data; therefore, there are various examples available that used firm-level data and PMC measured by HHI. Singla and Singh [
81], and Moradi, Bagherpour, Velashani, and Omidfar [
66] used HHI to find the PMC with firm-level data. Considering Giroud and Mueller [
44], we calculated the HHI as the summation of wholesales, which was settled by obtaining the square of all shares in the market for a given sector. Furthermore, these results decided which firms were high-competition and which were low-competition. If the estimated HHI showed value more than 0.01 (100), then these firms should be considered as a less competitive market. Every sector shows an industry, so the total sales of a firm is divided by the particular sector sales, and calculated individually every year.
where S
ijt represents the firm market share, j represents the industry t year, and N
jt points to the number of firms in a year.
4.2.4. Controlled Variables
Control variables have a significant role for supporting the dependent and independent variables, and outcomes of the control variables may vary as per industry structure [
82]. We have used control variables which are significantly important for corporate governance studies, and the majority of the control variables revealed the positive association (Haniffa and Cooke [
83], Mohd Ghazali [
84], Jennifer Ho and Taylor [
85]).
We have calculated the firm size by taking a natural log of the assets [
86]. In addition, we used board size estimated as the cumulative volume of directors in the board panel [
34]. We applied the audit committee size (ACS) as another important control variable. By following Rustam, Rashid, and Zaman [
34], we determined the total number of directors serving on the audit committee. Furthermore, we applied leverage, which was calculated as the total liabilities to the total assets of the firm [
76]. Finally, we added one more control variable with the name of asset turnover, which was estimated as the total sales of a firm divided by the total assets of a firm [
87]. The summary of all variables measurement is provided in
Table 1.
4.3. Empirical Models
4.3.1. Endogeneity Issue
The endogeneity issue refers to the correlation of independent variables with residuals or error terms. Endogeneity bias generally occurred due to the wrong inferences and incompatible measures, which may indicate uncertain findings and inappropriate theoretical clarification [
88,
89]. Li [
86] revealed that there are two circumstances in which the endogeneity issue can occur. First, when the regression analysis is performed, the causality between variables occurred. Specifically, when random shocks are used in the regression analysis, the error term affected the predicted variable. Secondly, the explanatory variables may not have a direct effect on the predicted variables, but their relationship may be associated through some third variable. If the third variable is not explicitly controlled, the error term may absorb the effect of this variable. Therefore, there is a need to test the endogeneity bias in the data and use appropriate techniques to deal with it.
4.3.2. Fixed Effect (FE) Model
The invisible heterogeneity issue can also occur in the usage of panel data, due to the stringent endogeneity. Stringent endogeneity refers to the situation in which the predicted and explanatory variables have no effect on each other [
90,
91]. To deal with the invisible heterogeneity issue, the usage of the OLS model only may not be fruitful. According to researchers, the FE or RE models are the best techniques to overcome the unnoticeable heterogeneity. Additionally, Gujarati [
92] reported that the FE model is considered as a time invariable residual. Furthermore, Wooldridge [
93] provided evidence and exposed that the FE model does not allow the lag of dependent variables to use independent variables in the econometric examination. Normally, there is a proper criterion to select a fixed or random-effect model. The Hausman test results decide which model is more appropriate for data [
90,
91].
4.3.3. Generalized Method of Moments (GMM) Model
GMM or dynamic model was discovered by Arellano and Bond [
94] to employ during the analysis of panel data. In this model, the causation between variables is generally considered dynamic over time. A lag of the dependent variable is used as the explanatory variable in this model.
Consequently, the lagged values of dependent variables are considered a good tool to solve the endogeneity from the panel data. Generally, the GMM model solves the endogeneity issue with inner altering data, which is referred to as modification alludes for a condition when a variable’s previous value is subtracted from its present value [
93]. Various scholars reported that the GMM model is best to control the endogeneity problem from panel data [
76,
86,
91,
95].
Our study used Equations (1)–(4) for the examination. The Durbin–Wu–Hausman test was employed using OLS regression to find the endogeneity in our panel data [
90,
91,
96]. Fixed-effect model is employed to solve the unnoticeable heterogeneity, which was selected on the basis of the Hausman results (Schultz, Tan, and Walsh [
90]; Wintoki, Linck, and Netter [
91]). Finally, we applied GMM model to cover all endogeneity issues from our panel data (Li, Gong, Zhang, and Koh [
82]; Li [
86]; Feng, Chen, and Tang [
76]; Wintoki, Linck, and Netter [
91,
95]).
These Equations (1)–(4), reveal both the dependent variables, ROA and SGR, as , which developed two alternate equations for every model; shows the Audit Quality and ; shows the high product market competition, ; shows the low product market competition ; shows the interaction of AQ and HPMC; and shows the interaction term of AQ and LPMC; the control variables are indicated by ; is the error term; is the constant term, n = 1, 2, 3, 4; are also constants; and m = 1, 2, 3, 4, 5, 6, 7.
5. Results and Discussion
5.1. Descriptive Statistics
Table 2 describes the statistical analysis of each variable. A total of 1406 observations were reported in this study.
5.2. Empirical Analysis
5.2.1. Endogeneity Test
We applied the Durbin–Wu–Hausman test to find the endogeneity in the panel data [
90,
91,
96]. Our main study model used firm financial performance as the dependent variable, which was measured by ROA and SGR. To examine the endogeneity bias in our panel dataset, we replaced each independent variable (AQ
1, AQ
2, HPMC, LPMC and Interaction Terms) with a dependent variable. The Durbin–Wu–Hausman test results are explained in
Table 3, which shows the F statistics. The F-stat reveals that the independent variables were endogenous. According to the rule of econometrics, if we have only one endogenous variable, then the suitable techniques should be employed to cope with the endogeneity issue [
92].
5.2.2. Analysis of Hypothesis 1
Table 4 shows the coefficient value to examine the connection between the AQ and FP. The coefficient values presented in Model 1 as, AQ
1 was 0.381 with the FE model, which was significant and positive at the 1% level, and the value of AQ
2 was1.212, which was significant and positive at the 1% level. In addition, the results of the Hausman test were in favor of FE model compared to the RE model. In addition, Model 1 reported the results of the GMM model as the coefficient values of AQ
1 and AQ
2, respectively, were 0.0413 and 0.7351, and both values were significant at the 1% level. Moreover, Model 2 demonstrated the value of AQ
1 was 2.176, which was statistically significant at the 1% level with the FE model and the coefficient value of AQ
2 was 0.981, which was statistically significant at the 1% level with the FE model. Moreover, the Hausman test result was also significant in Model 2, which supports the FE model. Additionally, Model 2 showed the coefficient values with the GMM model. The coefficient value of AQ
1 was 0.986, and AQ
2 was 3.575, which were statistically significant at the 1% level. Finally, these results supported our hypothesis and confirmed that AQ positively affected FP. To support our outcomes, there are multiples authors who reported the same findings [
3,
4,
5].
5.2.3. Analysis of Hypothesis 2
Table 5 presents the coefficient value of the HPMC and LPMC on FP. Model 3 presented that the coefficient value of HPMC was 0.148, which is significant at the 1% level, and the value of HPMC was 0.696 with the GMM model, which is also significant at the 1% level. The result of the Hausman test supported the FE model rather than the RE model. Model 4 demonstrated that the values with the FE model and GMM model, respectively, were 0.585 and 0.351, and both values were significant at the 1% level. In addition, the Hausman test value confirmed an appropriate selection of the fixed-effect model by having 8.92 at the 1% significance level. These results confirmed that HPMC significantly ad positively affected FP. Our outcomes are supported by various scholars (Ammann, Oesch, and Schmid [
51]; Byun, Lee, and Park [
52]).
In addition, Model 5 presented the LPMC and FP association. For the FE model, the value of the LPMC was 1.532, with no significant level, while, for the GMM model, the value of LPMC was −0.771. The Hausman test value was 6.19 and was significant at the 1% level, which supported the FE model rather than the RE model. Furthermore, Model 6 demonstrated that the value of the LPMC with the FE model was −1.150, significant at the 10% level, while the value of the LPMC with the GMM model was −0.344, significant at the 5% level. The results of the Hausman test supported the FE model. These results indicated that the LPMC negatively correlated with the FP. Our results are supported by various researchers [
12,
42].
5.2.4. Analysis of Hypothesis 3 and 4
Table 6 reports the coefficient value for the connotation between the AQ and FP along with the moderating role of HPMC and LPMC. Model 7 presented that the coefficient value of the interaction of the HPMC and AQ
1 of the fixed-effect model was 1.932 and the coefficient value of HPMC × AQ
2 was 0.878. These both values were significant at the 1% level. The results of the Hausman test supported the FE model. The coefficient values of the interaction terms HPMC × AQ
1 and HPMC × AQ
2 with the GMM model, respectively, were 0.596 and 0.124 at the1% significance level. In Model 8, the value of HPMC × AQ
1 was 0.451, significant at the 1% level with the FE model, and the value of HPMC × AQ
2 was 0.619, significant at the 1% level. The Hausman test value was 20.63 at the1% significance level and confirmed the appropriation of fixed-effect model. Furthermore, Model 8 presented the coefficient values of HPMC × AQ
1, and HPMC × AQ
2 with the GMM model, respectively, were 0.661 at the 10% significance level and 1.907 at the 5% significance level. These results supported our hypothesis that the AQ was positively associated with the FP with a moderating effect of the HPMC. These findings are consistent with [
9,
11].
Moreover, Model 9 presented that the coefficient value of LPMC*AQ
1 was 2.75, which was not significant with the FE model, while the value of LPMC × AQ
2 was 0.82. The Hausman test value was 48.82, which was significant at the 1% level, indicating that the FE model was a more suitable model than the RE model. The GMM model coefficient value of LPMC × AQ
1 was −6.219, significant at the 1% level, and the value of LPMC × AQ
2 was −8.312 with the GMM model, significant at the 1% level. In Model 10, the value of the fixed-effect model as LPMC × AQ
1 was −1.425, which was not significant, and the value of LPMC × AQ
2 was −0.529. The Hausman test value was 38.90, significant at the 1% level. Moreover, the value of the GMM model of LPMC × AQ
1 was −4.210 at the1% level. The value of the GMM model of LPMC × AQ
2 was −0.952, which was significant at the 1% level. These results confirmed that the AQ was negatively associated with the FP with a moderating effect of the LPMC. These findings are in line with the previous study [
62].
5.2.5. Robustness Test
To provide strong evidence regarding our results, we adopted a new measurement for our key variables. As various scholars reported that FP can be measured in different ways, the earning per share (EPS) is also an appropriate tool to calculate the FP [
97,
98,
99]. Therefore, we replaced our main model dependent variables with EPS to analyze the connection between the AQ and FP with the moderating effect of the PMC. Furthermore, we used a proxy for new measurements of the AQ. The auditor must be from the Big Four audited firms by following previous studies [
77,
78].
In addition, we used new measurement for the PMC by following [
100]. They reported that the learner index is another appropriate tool to calculate the firm competition. The learner index decides whether a firm has a high- or low-competitive market, based on a calculated median value. Therefore, we replaced our main model dependent and independent variables with these new variable measurements to further validate our outcomes.
Table 7 shows the results of the robustness test.
5.3. Discussion
In view of the results of this study, the first hypothesis of this study proved that the AQ and FP have a positive correlation. Multiple scholars supported our argument [
3,
4,
5]. Furthermore, Masood and Afzal [
27] reported that the AQ can improve firm transparency and gain shareholders’ confidence, which leads to higher profitability. Furthermore, Guedhami, Pittman, and Saffar [
39] contended that firm financial reporting is a good tool to attract investors and that AQ can enhance the financial reporting of firms. The interest of stakeholders for good AQ firms enhances and captures good profit and differentiated image in the market. Auditors prevent firms from internal and external frauds, which save a firm’s profits [
101].
The second hypothesis of this study contended that the HPMC positively affected the FP. Our findings are consistent with (Ammann, Oesch, and Schmid [
51]; Byun, Lee, and Park [
52]). Competition compels firms to form new products for product differentiation, which captures a good profit [
42]. Furthermore, Raith [
12] recorded that the increased level of competition puts significant pressure on managers and other authorities to work hard for-profit maximization.
The results of our second hypothesis demonstrated that the LPMC negatively affected the FP. The findings of this study are similar to the previous studies (Porter [
42]; Raith [
12]). Porter and Strategy [
42] reported that firms stay relaxed in the low-competitive market; therefore, the firm’s development and growth are low in that environment. This situation takes firms towards lower profitability. Furthermore, low-competition has limited opportunities for firms to make new products and have the same products with a limited profit margin.
The third hypothesis of this study stated that the AQ positively affected the FP with the moderating role of the HPMC. Leventis, Weetman, and Caramanis [
8] discovered that agency cost could be minimized by firm competition and reducing a cost captures a higher profit for firms. Furthermore, Wang and Chui [
9] proved that firms want to differentiate themselves in the competitive market for profit maximization; thus, they are willing to pay higher audit fees for enhanced AQ. In addition, Marciukaityte and Park [
10] contended that high-competition put pressure on firms to disclose fairly all financial matters with their stakeholders and demanded a strong audit. A fair audit is evidence that the financial matters of a firm are clean, and following the rules and regulations.
The fourth hypothesis of this study indicated that the AQ negatively affected the FP with the moderating role of the LPMC. In low-competitive markets, firms normally emphasize profit-building rather than following the rules and regulations. In low-competition, firms avoid paying higher audit fees for quality audits [
62]. Furthermore, low-competitive markets often have a monopoly situation; thus, every firm avoids such regulations to save money.
6. Conclusion and Policy Implications
This study investigated the connection between the AQ and FP with the moderating role of the PMC; and used data from the manufacturing sector of Pakistan from 2008 to 2017. This study used different techniques, including OLS regression, the fixed-effect model, and the GMM model. By focusing on agency theory, the findings of the study revealed that there was a positive association between the AQ and FP. In addition, the PMC was divided into two parts, the HPMC and LPMC following HHI. This study showed that the HPMC positively affected FP; on the other hand, the LPMC negatively affected the FP. Furthermore, findings of the study suggested that there was a positive connection between the AQ and FP with the interaction of the HPMC. There was a negative connection between the AQ and FP with the interaction of the LPMC. Furthermore, there were some limitations of this study—for example, this study only focused on the manufacturing sector, while other sectors could be used for investigation in the future. In addition, due to data limitations, this study used only 147 firms out of 559. Other corporate governance key elements, including the CEO, ownership structure, and board committees, could be taken as moderating factors to inspect the impact on the association regarding the AQ and FP.
Based on the results of this study, there is a need to give recommendations to governments, policymakers, corporate management, owners and investors of developed and developing economies. First, firms should consider the accounting standards for the improvement of their AQ. Second, firms should know the stakeholders’ demands regarding the AQ and satisfy them. Third, auditing activities of firms can be improved by having independent and expert auditors. Fourth, the government should develop strong and stringent regulations for firms having a quality audit and constantly monitor those activities. Fifth, the government should appreciate and acknowledge those firms that have good quality audits and sharing of this knowledge with their stakeholders.
Sixth, shareholders, investors, and international authorities can put pressure on firms to have a good quality audit. Seventh, this study contributed to the literature by providing the importance of the PMC for the improvement of AQ. Moreover, the outcomes of this study encourage researchers, investors, shareholders, and owners to participate in a competitive market for improved AQ that may lead to higher profits. The higher expenses for audits were considered as a small fraction because, with the improved AQ, the firms can gain more profit in the form of huge investors and shareholders’ trust.
Companies with a large PMC can create an innovative image in the market by AQ. In addition, firms can capture handsome profits by adopting quality audits in the form of investor and shareholder satisfaction. More importantly, this is a state-of-the-art work, which sheds light on the importance of the PMC for AQ and FP. This study extended the role of transparency with AQ for highly competitive markets. The industrial sector has great importance for both developed and developing countries; therefore, the profitable sector can positively contribute to the development and improvement of the economic situation.
For further studies, the function of the financing configurations, company patterns, audit market competition, and the other CG aspects, such as the CEO role and ownership structure, can be investigated in relation to the AQ and FP.


