Article

Digital Cement Integrity: A Methodology for 3D Visualization of Cracks and Microannuli in Well Cement

by
Torbjørn Vrålstad
* and
Ragnhild Skorpa
SINTEF Industry, Petroleum Department, 7034 Trondheim, Norway
*
Author to whom correspondence should be addressed.
Sustainability 2020, 12(10), 4128; https://doi.org/10.3390/su12104128
Submission received: 1 April 2020 / Revised: 12 May 2020 / Accepted: 13 May 2020 / Published: 18 May 2020
(This article belongs to the Special Issue Drilling Technologies and Process Safety)

Abstract

:
Leakages of greenhouse gases, such as methane and carbon dioxide from wells, may have considerable environmental consequences. Although much emphasis is currently put on understanding well barrier failures, and thus, preventing well leakages, especially for an important barrier material as cement, there are still several knowledge gaps and unknowns. However, a step-change in well integrity understanding may be obtained by applying advanced characterization techniques and scientific approaches to studying well barrier materials and their failure mechanisms. This paper describes the development of an experimental methodology that uses X-ray computed tomography to obtain 3D visualizations of cracks and microannuli in annular cement sheaths. Several results are included that demonstrate the value of using such digital methods to study well cement, and it is shown that such experimental studies provide an improved understanding of cement sheath integrity. For example, it is seen that radial cracks do not form in symmetrical patterns and that microannuli do not have uniform geometries. Such experimental findings can potentially be used as benchmark to validate and improve cement integrity simulation tools.

1. Introduction

A fundamental understanding of well barriers is crucial to avoid leakages of greenhouse gases such as methane and CO2. For example, several petroleum wells experience well barrier failures [1,2], and over time, such well integrity problems may cause significant amounts of methane leakages [3,4]. Furthermore, wells have been identified as the most likely CO2 leakage pathway during carbon capture and storage (CCS) operations [3,5,6,7]. Improving well integrity will therefore lead to reduced emissions of greenhouse gases.
Cement sheaths are among the most important barrier elements in both petroleum wells and CO2 injection wells. To prevent leakages of downhole fluids, the cement sheath needs to retain its integrity throughout the entire lifetime of the well, i.e., during the production and injection phase, and also, after well abandonment [4,8,9]. There are different types of cement sheath failure modes [10,11,12,13,14], where the two most common and well-understood are radial cracks and microannuli. Simply put, radial cracks may form in the cement sheath during temperature or pressure increase in the well, which causes the casing to expand. This casing expansion leads to increased tangential (i.e., hoop) stress in the cement, and radial cracks subsequently form if the resulting tangential stress exceeds the tensile strength of the cement. Whereas microannuli, i.e., cement debonding towards the steel casing or surrounding rock, may form during temperature or pressure decrease in the well, which causes the casing to contract. This casing contraction leads to increased tensile stress in the surrounding cement sheath, and cement debonding subsequently occurs if the induced tensile stress exceeds the cement’s tensile bond strength towards the casing and/or formation. Both radial cracks and microannuli can thus form as a result of normal production operations that involve temperature and pressure cycling, such as repeated shut-downs/start-ups, pressure tests and fluid injections [15]. Such dynamic loading scenarios could be particularly severe for CO2 injection wells [16], and for example, in a well after 30 years of CO2 injection, prominent leak paths at both the cement-casing and cement-formation interfaces were found after coring [17].
Consequently, several laboratory experiments have been performed to study and understand these cement sheath failure modes and the resulting loss of zonal isolation [15,18,19,20,21,22]. Furthermore, other authors have focused on studying microannuli formation and the resulting flow through these leakage pathways [23,24,25,26]. All these studies have provided valuable understanding of cement failure and loss of zonal isolation. However, fluid flow was used as verification of cement failure in most of these experimental tests. Although well-suited as function tests of cement sealing ability and zonal isolation, such a characterization approach provides limited information about how the cement fails and few details about the resulting leak paths. For example, Bois et al. [27] have pointed out the difference between cement mechanical integrity, i.e., the presence of cracks and microannuli, and cement hydraulic integrity, i.e., the resulting flow rates through the cement barrier. There are several unanswered questions, such as: are both radial cracks and microannuli formed, how many radial cracks are there, what are the aperture and geometry of the radial cracks, are the microannuli homogeneous and uniformly present around the entire circumference, what is the aperture of the microannuli, and how do fluids flow through these leak path geometries? Answers to such questions will lead to an improved understanding of well cement failure mechanisms, and thus, an improved understanding of both mechanical and hydraulic integrity of cement. Subsequently, such answers may lead to the development of improved cement integrity predictions tools.
There are several ways to find answers to these questions, both experimentally and numerically. For example, Stormont et al. [24] and Garcia Fernandez et al. [25] have experimentally studied gas flow through microannuli and found that the microannulus aperture can vary considerably around the circumference. They did, however, not visualize the actual microannulus geometries. X-ray computed tomography (CT) is a powerful, non-destructive characterization method that allows visualization and quantification of defects inside material samples and is therefore well-suited to study cement failure mechanisms as well. Several authors have therefore used CT to study defects, cracks, and porosity inside cement samples [22,28,29,30,31,32], as well as to study cement carbonation and subsequent leak path alteration during CO2 exposure [33,34,35,36,37,38,39,40]. In our group, we have recently developed an experimental characterization procedure where we use CT for 3D digital visualization of well cement in realistic annular geometries. With our dedicated and tailor-built cement sheath integrity experimental set-up [41,42], we have visualized microannuli and cracks in cement formed during thermal cycling [41,43,44,45,46] and pressure cycling [42,47,48,49], and we have also used the digital cracks and microannuli obtained from CT scans as imported leak path geometries in computational fluid flow simulations [45,50,51,52]. Furthermore, we have also used CT to study cement-formation bonding [53,54,55,56], cement durability [57,58], and cement-mud interactions [59].
This paper describes and reviews the 3D digital characterization methodology that we have developed, which can be used to find answers to some of the questions listed above. We include several examples of obtained results that illustrate the value of using such digital methods to study cracks and microannuli in well cement. Moreover, we highlight how these findings provide an improved understanding of cement integrity and zonal isolation, thereby contributing to reducing well leakages.

2. Experimental Methodology

2.1. Sample Preparation

The experimental set-up and procedure to generate defects in the cement sheath have been described in detail in previous publications [41,42,43,44,45,46,47,48,49], and only a brief description will be given here. The experimental set-up consists of rock (usually sandstone), cement and casing to resemble a downscaled section of a well. The casing (carbon steel, API 5L X-52) has an outer diameter of 60.3 mm and is surrounded by a cylindrical rock (inner diameter of 76 mm, outer diameter of 150 mm). This gives an 8 mm thick cement sheath located in between the rock and casing, as illustrated in Figure 1a. The height of the experimental setup is 200 mm. The sample is placed in a cell and the cement was cured at elevated temperature in a confined environment for 5 days. The confinement cell has been tailor-made for the purpose and is made of aluminum to be X-ray transparent.

2.2. CT Scanning Procedure

X-ray Computed Tomography (CT) was used to determine information about location, geometry and number of defects in 3D. As this is a non-destructive technique, it can be used to study defects in the cement sheath and surrounding rock prior to, during and after experiments without breaking the confining atmosphere or otherwise damaging the sample. By measuring the attenuation of X-ray beams through a sample, the CT scanner generates projection images which are reconstructed to 2D cross sectional images. The cracks and defects in the cement sheath were mapped by scanning the sample with a Siemens Somatom Sensation medicinal CT. The images were taken with 140 V and a displacement of 1 mm/slice, resulting in 200 cross sectional 2D images with an in-plane resolution of 200 µm. The resolution of the images depends both on the scanning parameters, such as number of detectors, scan time, voltage and current as well as the sample itself. Thus, the resolution of the cross sectional 2D images gives a limit to which defects that can be seen and analyzed.

2.3. Post Processing of CT Images

Analysis of the 2D cross sectional images and subsequent 3D reconstruction of the cement sheath was performed using the Avizo software [60]. The process of obtaining 3D volumes from the 2D images has been illustrated in Figure 1b–e. A typical 2D cross sectional image obtained from the CT is shown in Figure 1b. As can be seen from the image, one can separate between the rock, cement and casing. Defects present in the cement sheath are seen as black voids in the 2D image. In Figure 1c, the different defects have been segmented out and highlighted using different colors. Three different colors have been used to visualize defects in the cement; blue to describe defects at the cement/casing interface, red color for the defects in the bulk cement and green color for defects present at the cement formation interface. In the case of a mudfilm present at the cement/rock interface, this was highlighted by a dark-green color. Additionally, in some tests, we have used a fourth color (purple) to highlight defects propagating into the surrounding rock. Figure 1d illustrates how the 2D cross sectional images from CT scanning were stacked to obtain a 3D volume. Finally, the resulting 3D volume, using the above described colors to highlight the defects, is illustrated in Figure 1e.

2.4. Simulation of Fluid Flow

The specific volumes of the cracks and microannuli were extracted using Avizo and imported into StarCCM+ [61] for computational fluid flow (CFD) simulations as described in references [45,50,51,52]. The surface was manually repaired to maintain the structural features of the geometries. To simplify the geometry, small and unconnected dead ends were removed. An inlet was defined at the bottom, and an outlet at the top of the geometry. Both the inlet and outlet surface were set with a pressure outlet boundary, while a wall boundary was used for the rest of the surface. Polyhedral meshing with five layers of prism mesh were used to create the volume mesh. To stabilize the flow, an additional 10 layers of extruder mesh were added to both the inlet and outlet surface. Pressure was then applied at the extruder region at the inlet, creating a pressure driven mass flow through the geometry. The pressure drop was varied from (20–500 Pa) over the geometry. The mass flow was assumed to be laminar and modelled using segregated flow, constant density and a steady state approximation. Methane gas was used as the model fluid. Each simulation was run until convergence of the residuals, mass flow and pressure drop were observed (~2500 iterations).

2.5. Limitations of Experimental Procedure

It is important to note that there are some experimental limitations of the procedure that influences the quality and operational relevance of the obtained results. Regarding the experimental set-up, the main limitation is the downscaling, both radially and axially. Another important limitation is the lack of confining stress around the rock during experiments, which may significantly influence the propagation of cracks [62]. Therefore, the obtained results cannot be quantitatively transferred directly to field situations, but most of the major findings and conclusions should still be qualitatively valid. Moreover, since the rocks have a limited radius in the experiments, as opposed to unlimited size in the field, results that show complete rock failure are considered experimental artifacts.
The main limitation of the CT characterization is the instrument’s resolution. In the current experiments, the radial CT resolution is approx. 200 µm, which means that any cracks and debonded areas smaller than this will not be detected. Other studies have shown that microannuli and cracks often are significantly smaller than 200 µm [20,23,24,25], so it is likely that there are such small defects in our samples as well that cannot be seen due to the detection limit. The CT resolution could potentially be improved by decreasing the sample size further, as CT resolution is dependent upon sample size, or when more advanced CT instruments are developed in future.
Moreover, the CT resolution is also a limitation for the subsequent CFD simulations, as potential flow path geometries smaller than the resolution are not accounted for. The main limitation is however that it is assumed that the obtained leak path geometries are fixed and do not change during flow, and this assumption is incorrect as it is known that increased pressure differences may increase the available flow path size [27].

3. Results and Discussion

3.1. Visualization of Radial Cracks and Internal Defects in Cement Sheaths

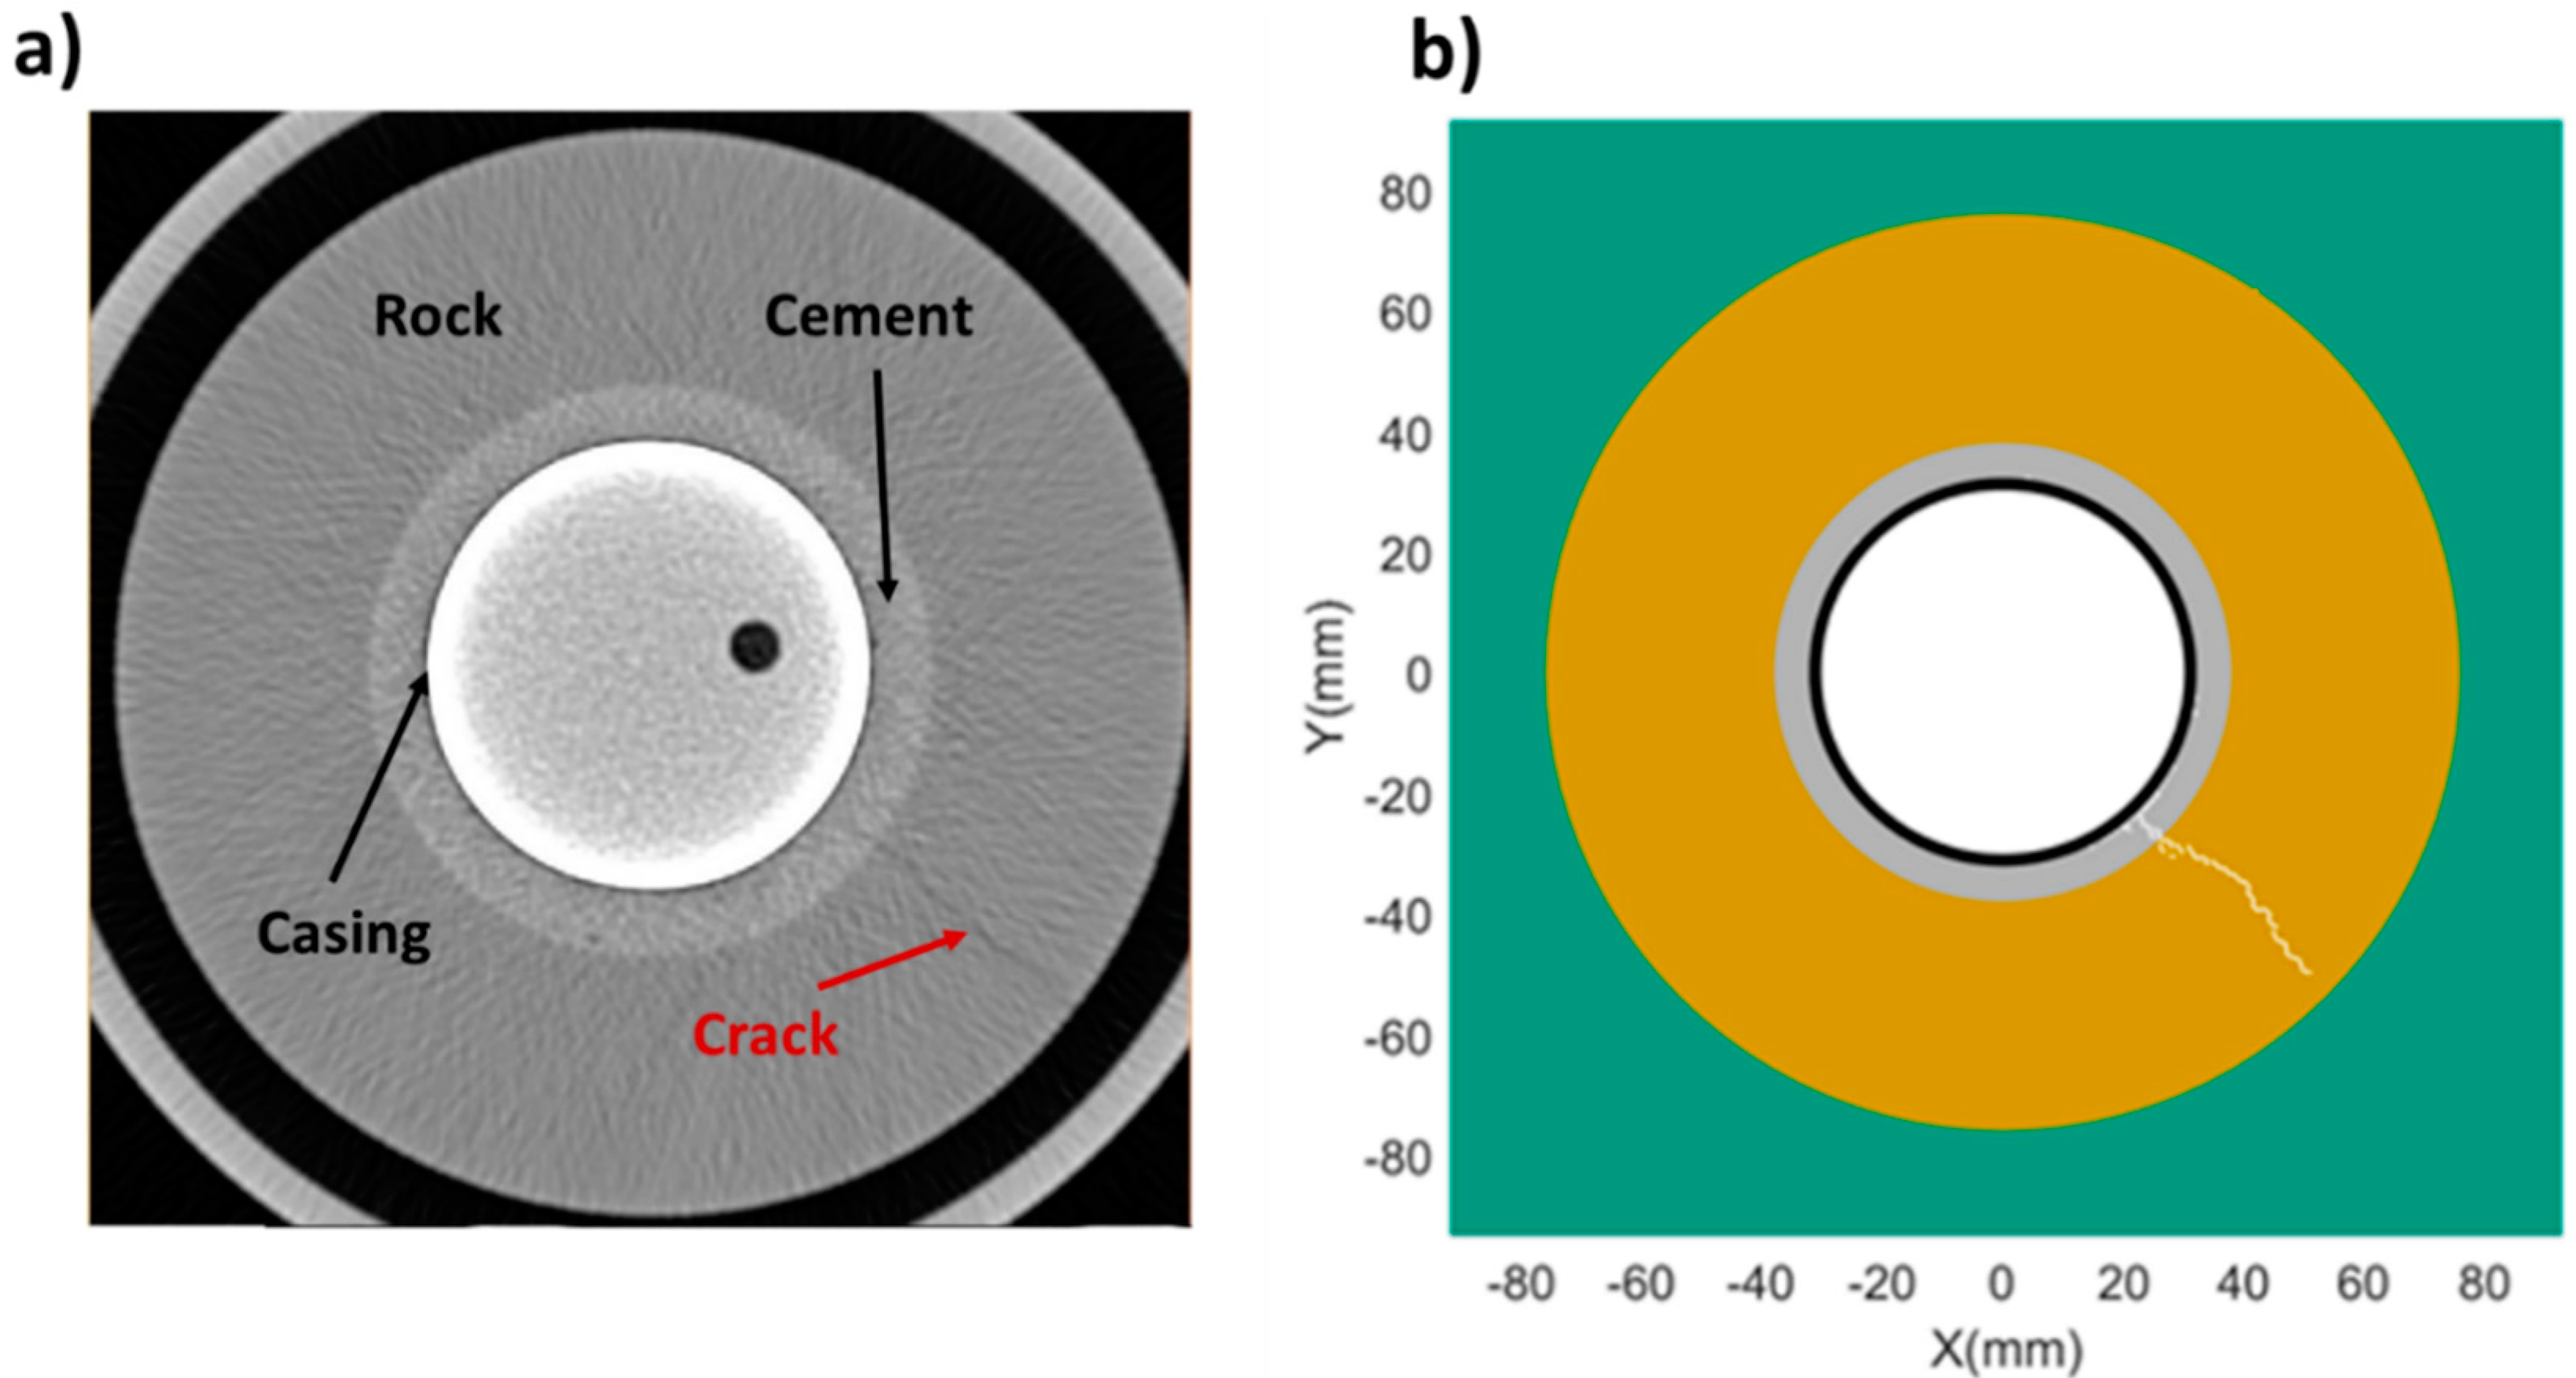
In model simulations of cement sheath failures, it is common to assume symmetrical stress conditions in the cement, which result in the formation of several radial cracks in a symmetrical pattern [63,64,65,66]. However, experimental findings do not show such symmetrical crack patterns. For example, Figure 2a shows a 2D CT image of an experimentally created radial cement crack due to pressure increase inside the casing [42]. It is seen that only one crack is formed, and not several cracks in a symmetrical pattern. This observation is typical of and consistent in our experimental studies: during pressure increase, the cement sheath starts failing with a single radial crack [47,48,49]. Sometimes it is seen that other, subsequent cracks are formed as well, but usually not in a predictable, symmetrical pattern. Gheibi et al. [62] used an in-house, modified discrete element model (MDEM) to simulate the experiment in Figure 2a, and the result is shown in Figure 2b. Only one radial crack was observed in this simulation, which was achieved by introducing heterogeneity in the model by imposing random tensile strength values from a uniform distribution [62].
Furthermore, it is also seen from Figure 2 that the radial crack in the cement propagates into the rock as well, a finding that was also observed by Fahrman et al. [29]. However, it should be noted that these experimental tests were performed without confining stresses in the rock. Gheibi et al. [62] showed that the crack propagation into the rock will decrease and ultimately stop with increasing confining stress. Therefore, substantial crack propagation into the rock will probably not occur under more realistic conditions when the rock experiences confining stresses.
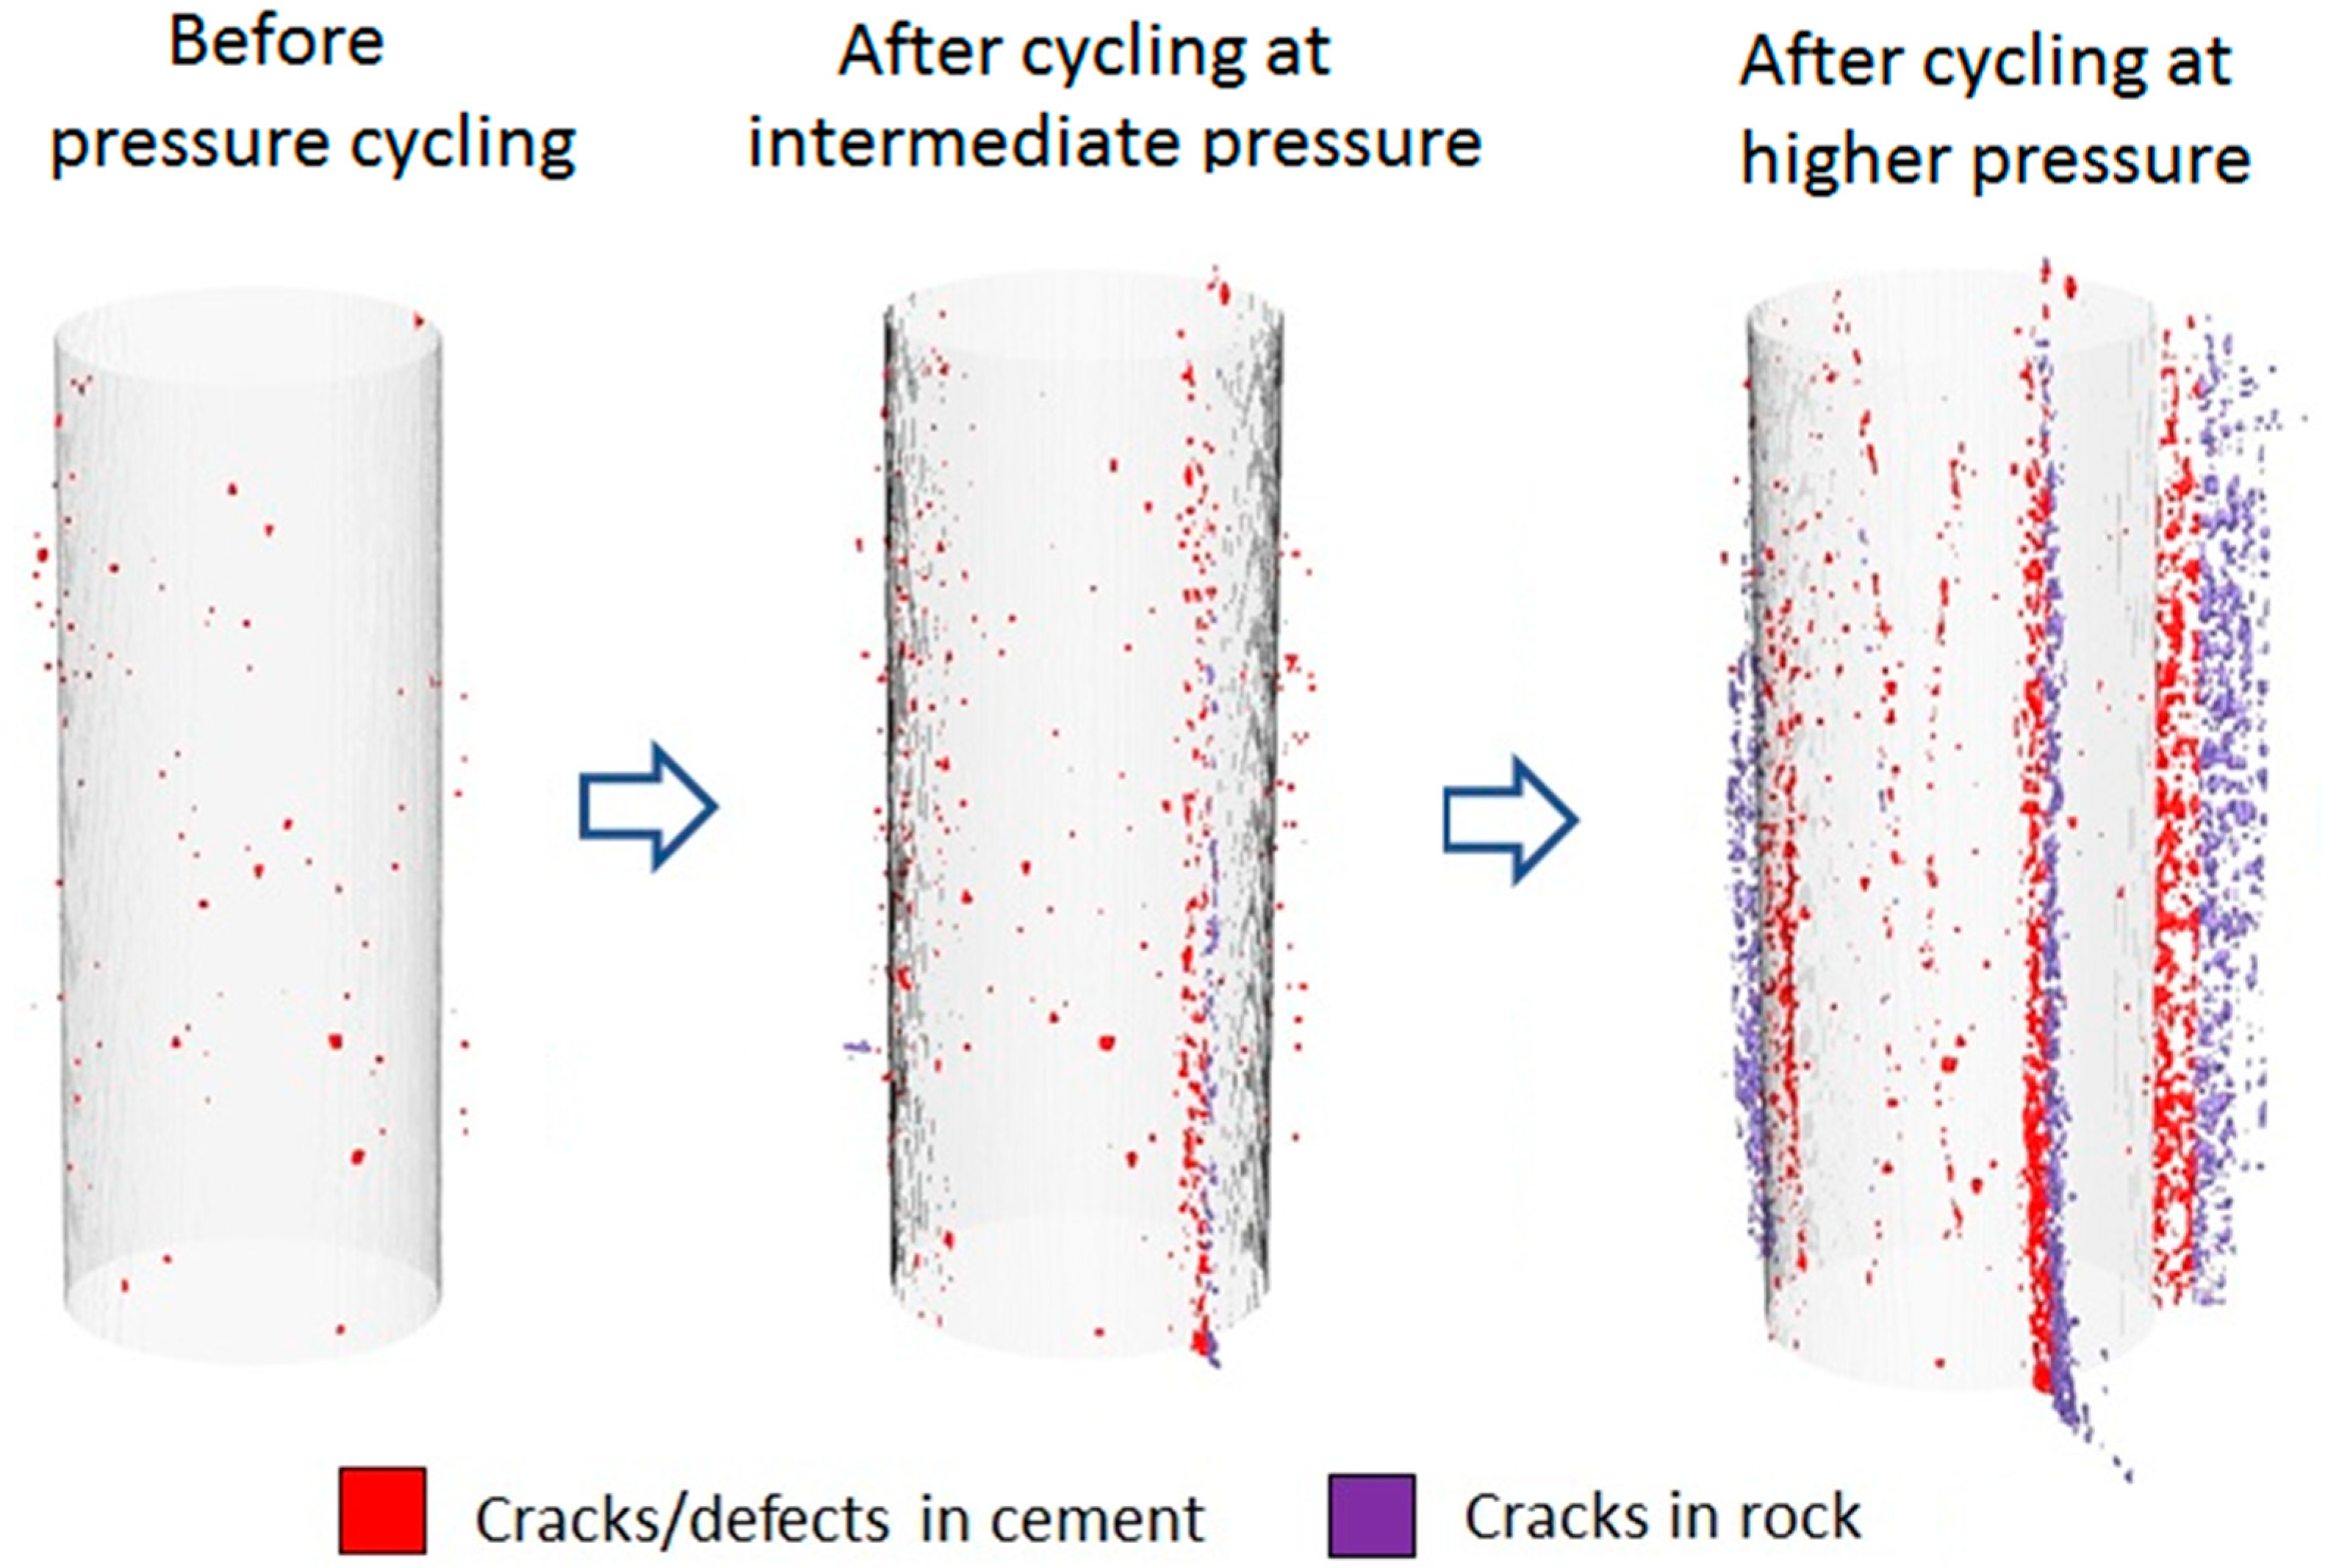
Figure 3 shows 3D visualizations of experimentally created radial cracks formed in the cement sheath during pressure cycling where the surrounding rock is softer than the cement [47]. It is seen that one crack appears first, followed by more cracks at higher pressures. The subsequent cracks do not form in a symmetrical pattern. All cracks propagate into the rock as well. Moreover, it was also found that the cement withstood a much higher pressure before failure when the surrounding rock was stiffer than the cement [47,49]. This finding confirms previous model predictions and established theory that rock stiffness vs. cement stiffness significantly influences cement sheath integrity [10,11,12,13]. In this regard, it is also relevant to observe that casing eccentricity has an influence on cement sheath integrity [44,47], where the cement sheath cracks at somewhat lower pressure for eccentric casing than centralized casing. It should be noted that the crack usually appears in the medium- or wide side of the cement [47], and not in the narrow side as might be expected.
Although the number of cracks, whether they propagate into the rock or not, and where they are located, may not be important with respect to cement mechanical integrity (a failure is after all, a failure), these details can be very important with respect to cement hydraulic integrity and subsequent loss of zonal isolation. Furthermore, if cement sheath integrity modelling tools are unable to predict such details accurately, then these models may need improvement.
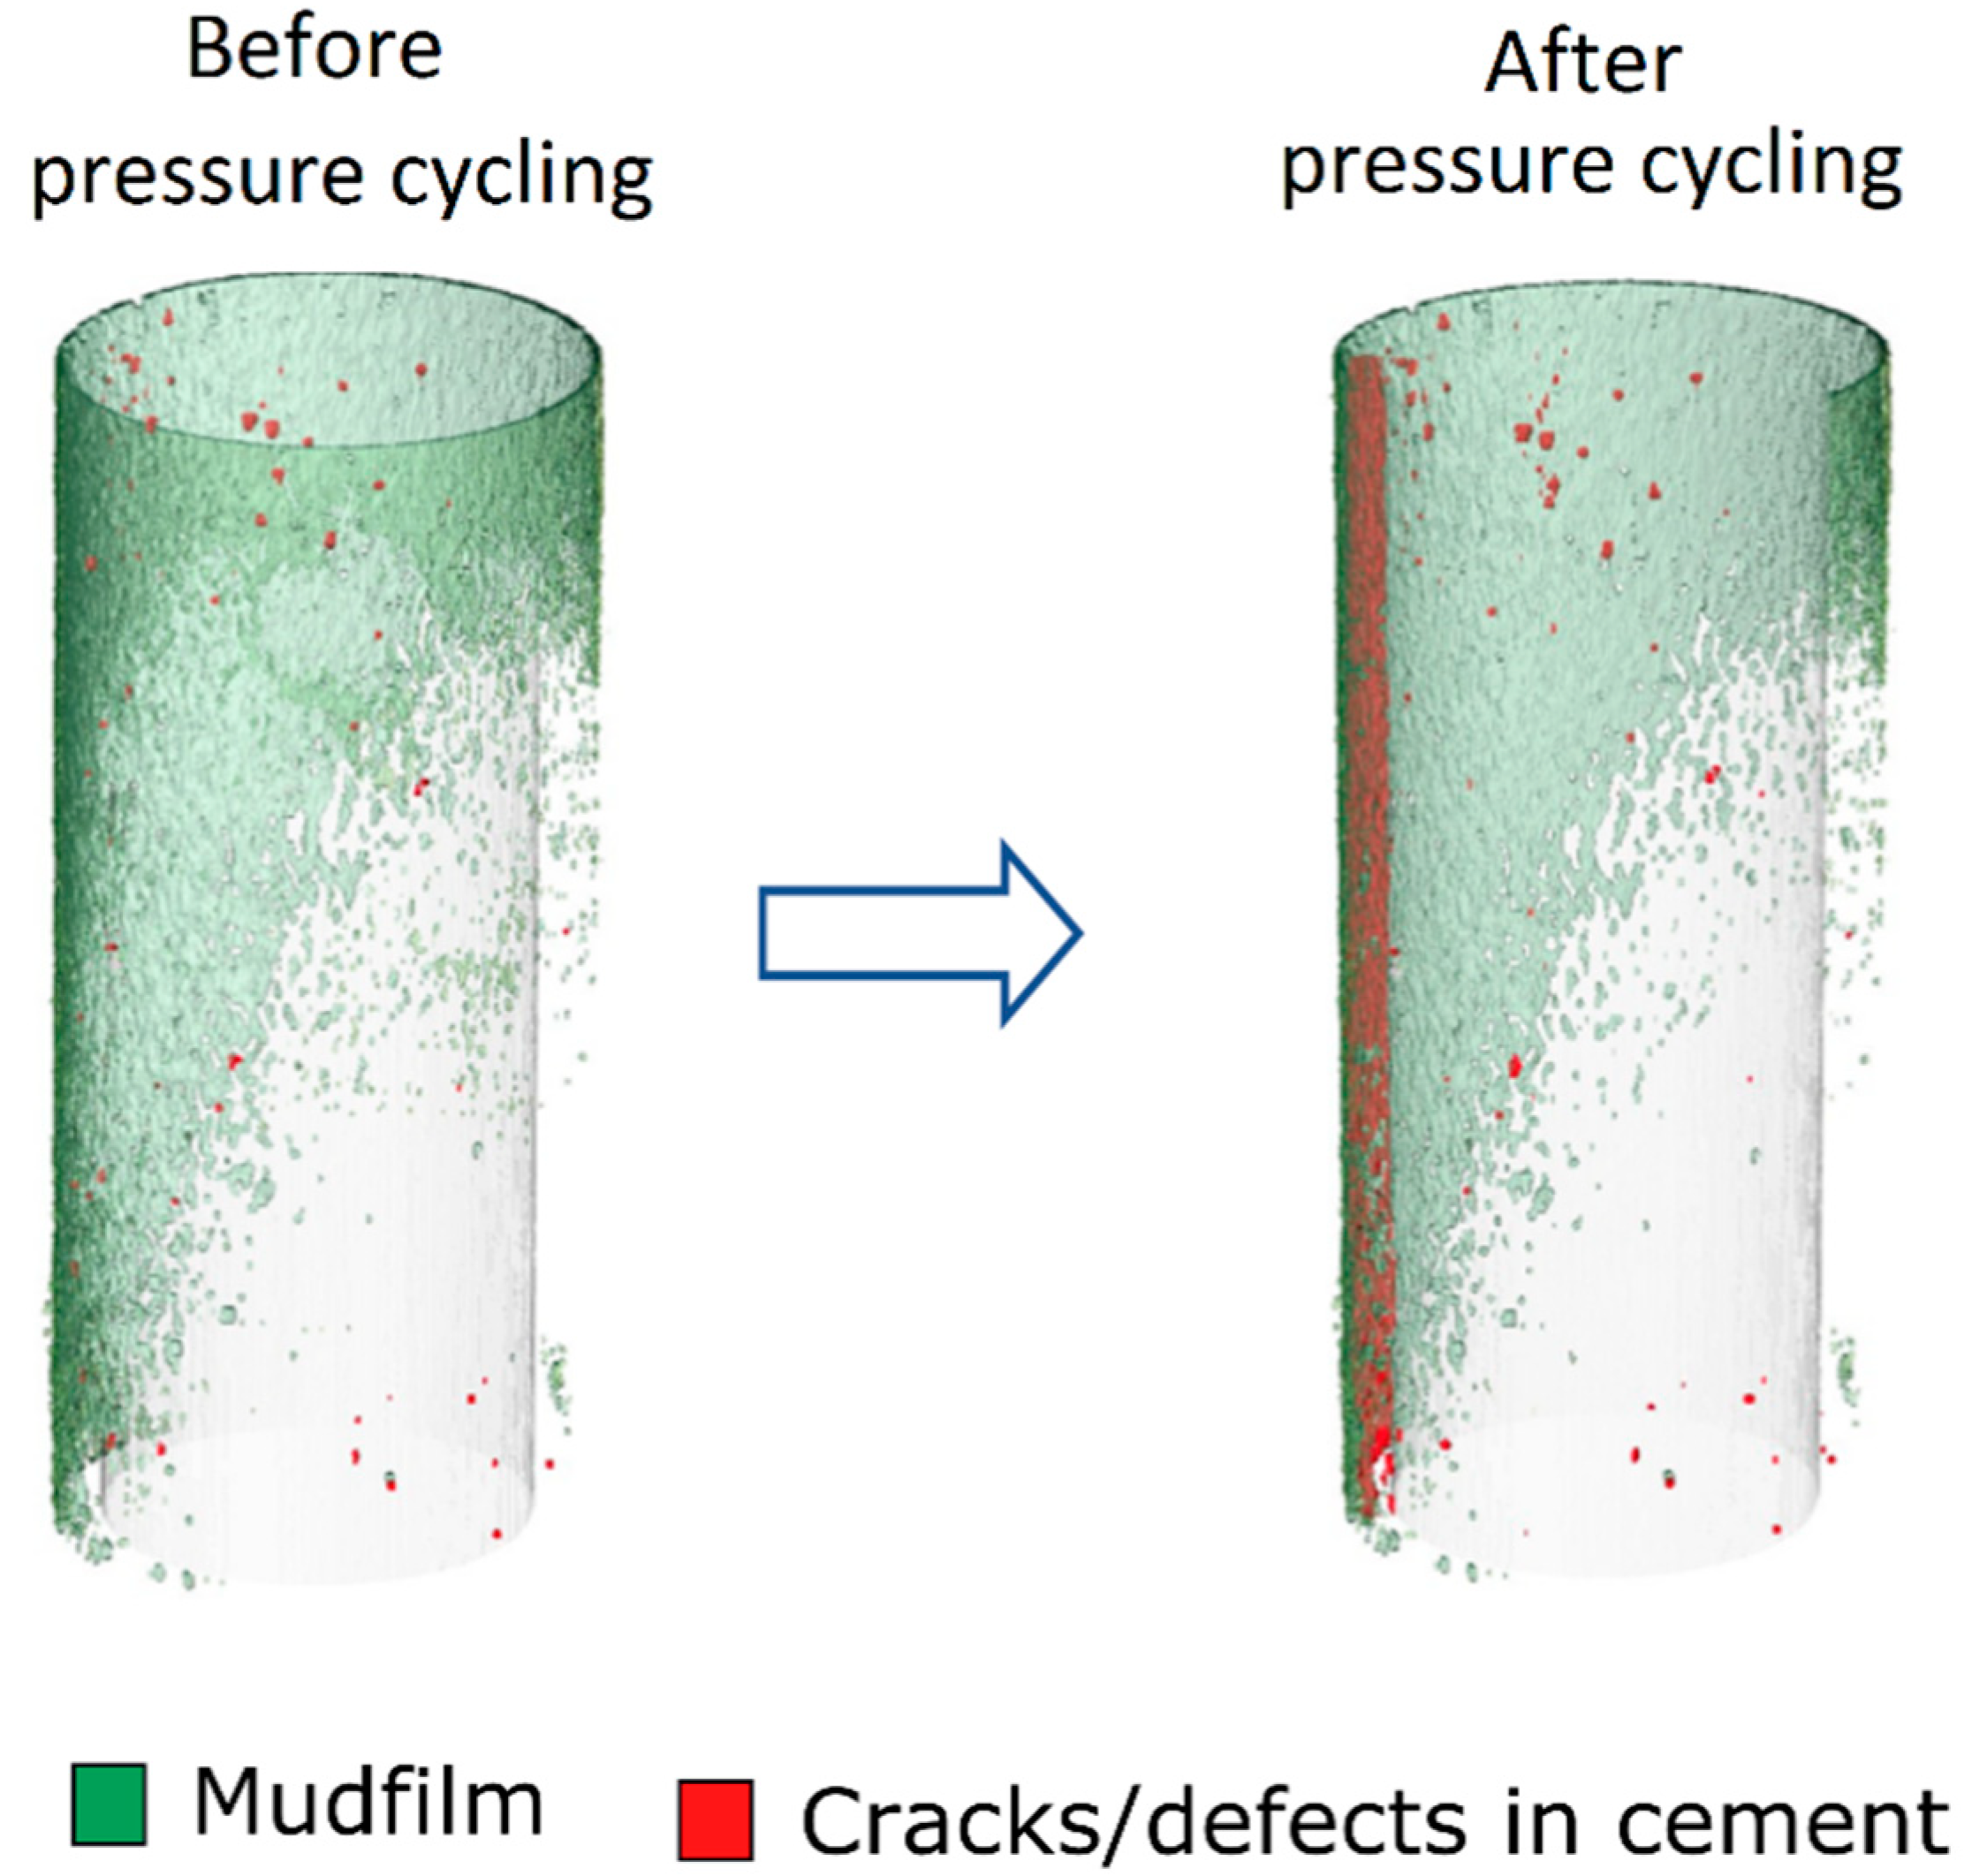
In actual well conditions, there is often a mudfilm or remains of a filtercake at the interface between cement and rock. How will the presence of drilling fluids influence the crack formation and subsequent propagation? Figure 4 shows an example of the formation of radial cracks in cement with a mudfilm present at the rock/cement interface [48]. First, it is seen that the mudfilm is not complete, i.e., it does not cover the entire interfacial area. Secondly, it is seen that the only appearing crack is formed in the area covered with mudfilm. Finally, it is seen that the crack does not propagate into the rock, i.e., the crack stops at the interface. Although all experimental tests with mudfilm do not follow this exact pattern, it is evident that the presence of mudfilm influences the formation of radial cracks in cement sheaths. Furthermore, it should be noted that the cement withstood less pressure before failure in all tests with mudfilm than in comparable tests without mudfilm [48].
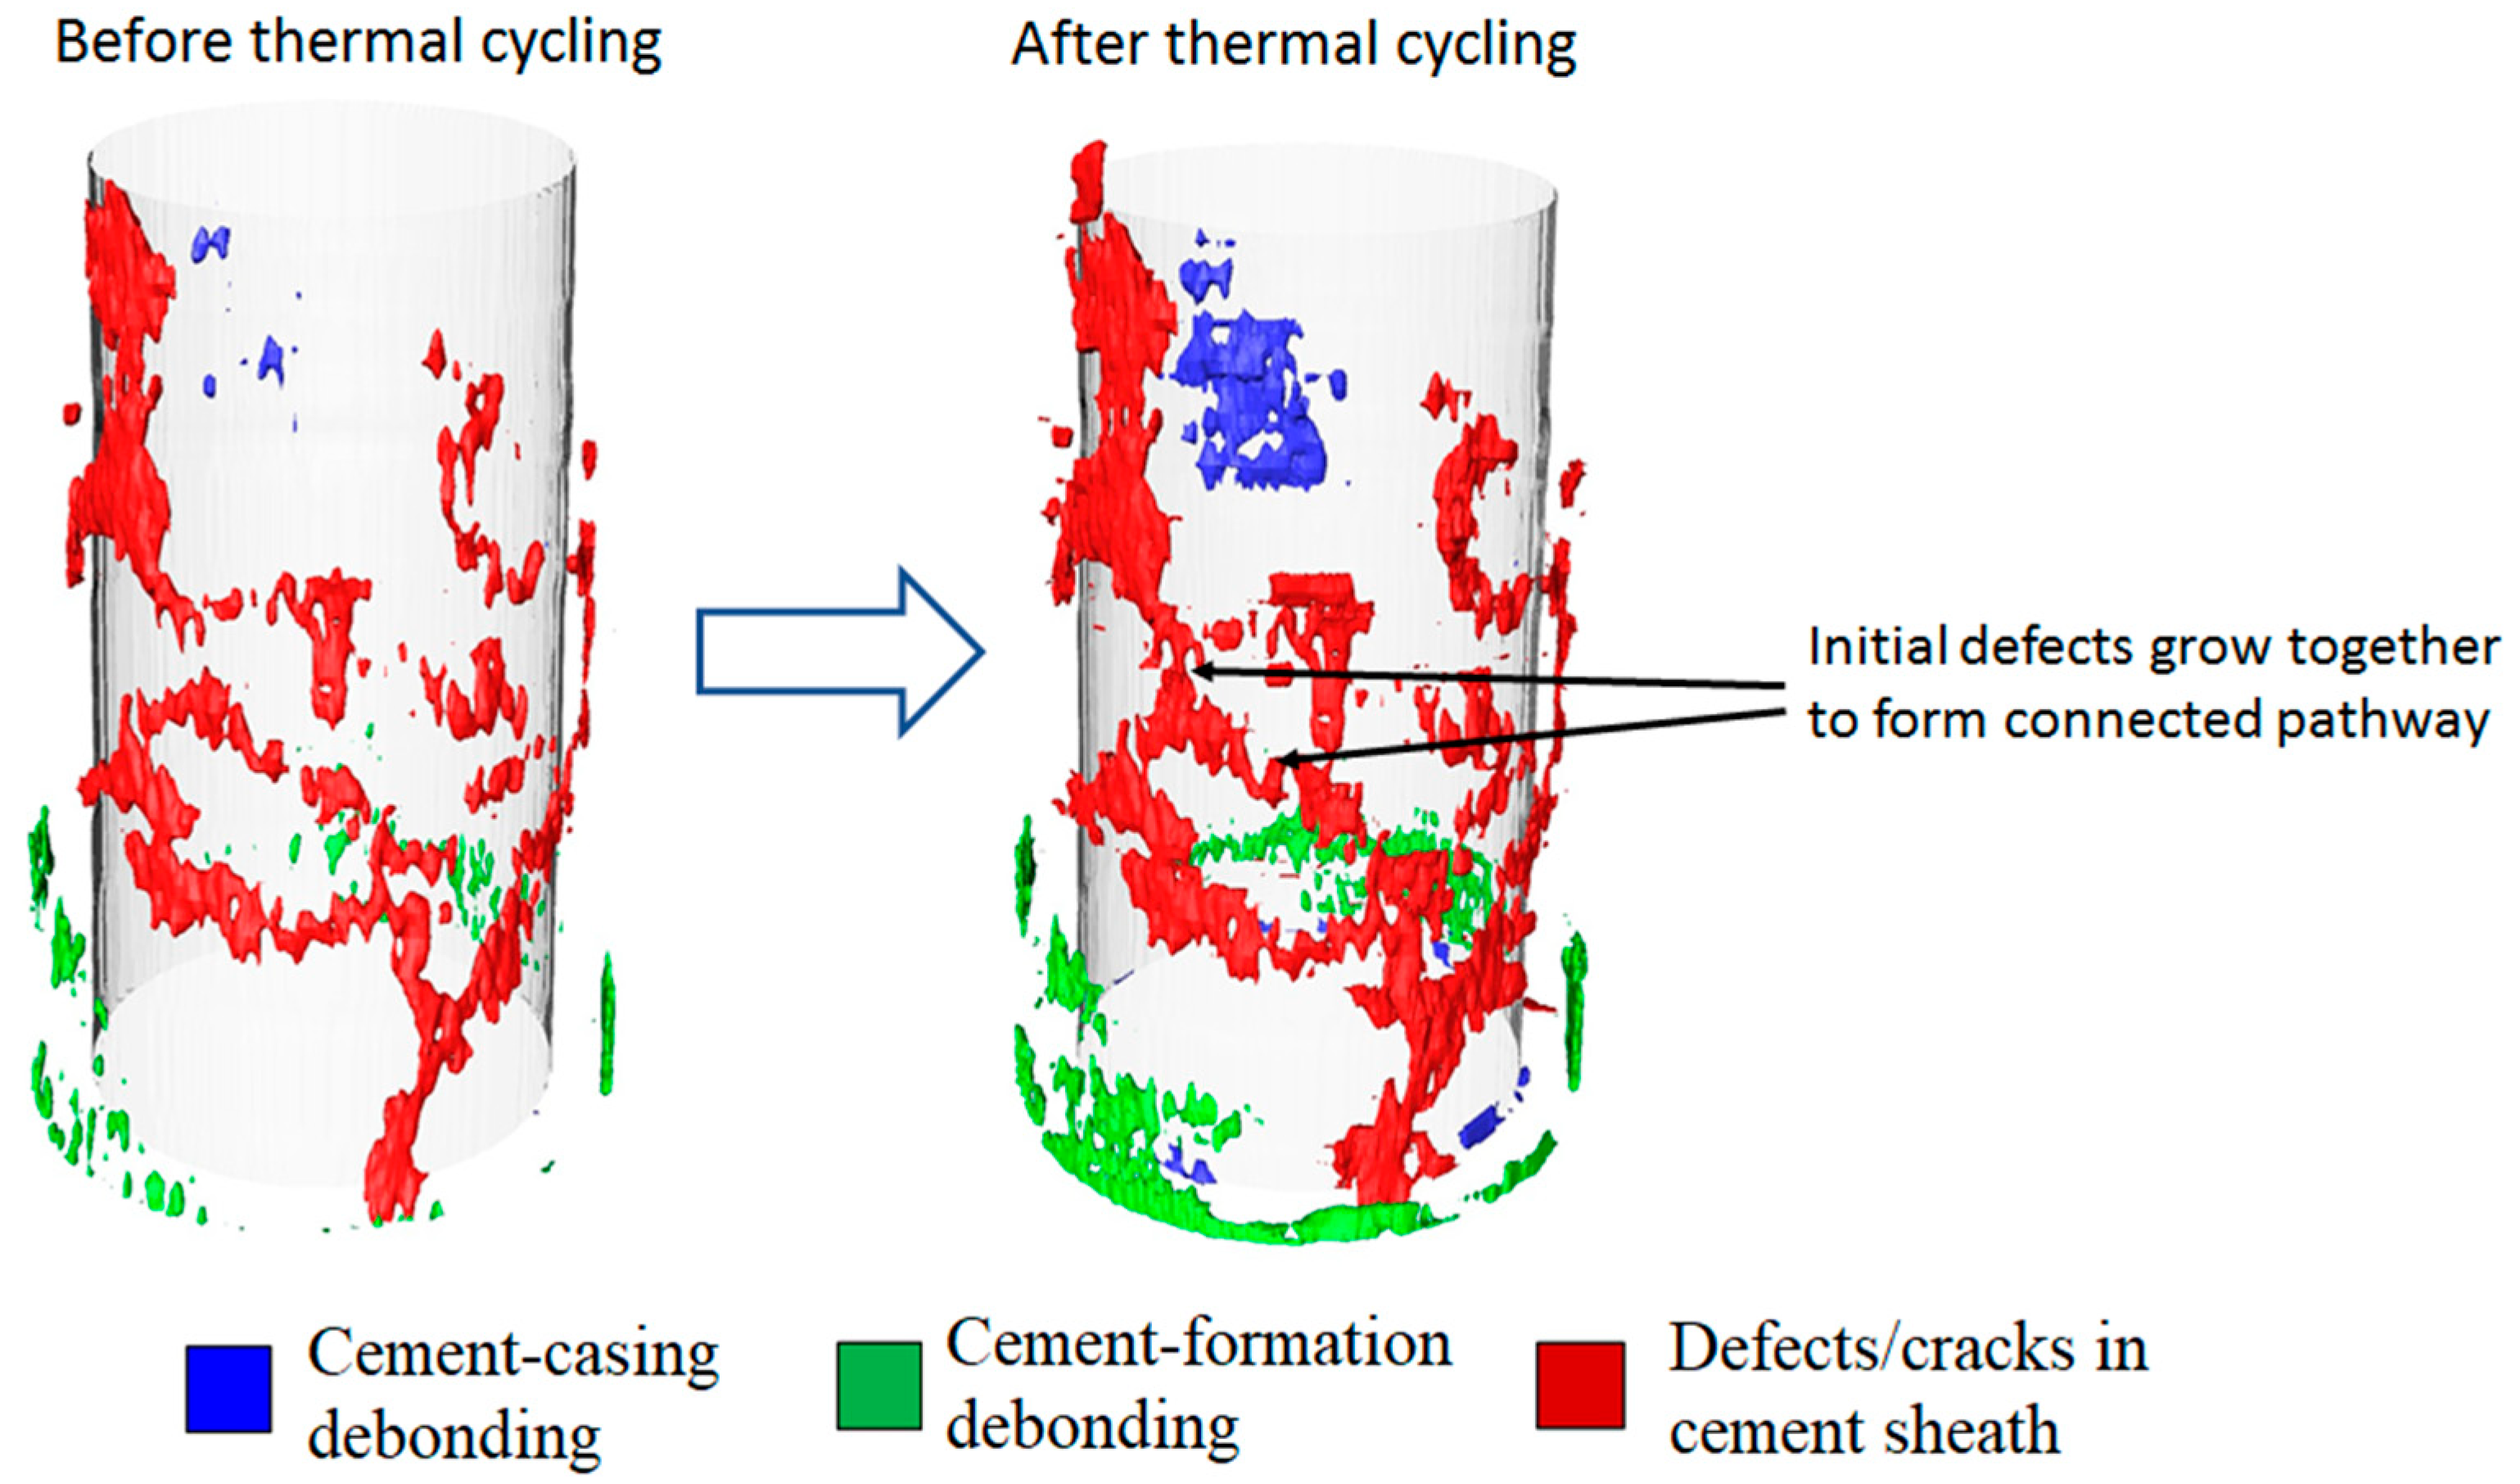
Figure 5 shows that there are also other possible types of internal cement sheath failures than radial cracks [45]. Initially, the sample in this test had several internal defects inside the cement sheath, which were probably caused by fluid loss. Then, the sample was subjected to thermal cycling, where the curing temperature was the highest temperature in the cycle. In other words, the cement experienced induced stress only due to casing contraction during cooling, and not due to casing expansion. Normally, casing contraction leads to microannuli formation when the induced tensile stress exceeds the tensile bond strength at the cement interfaces, but as seen in Figure 5, in this sample, the large amount of internal defects leads to a tensile failure of the cement itself as well: the initial defects increase in size during thermal cycling, grow together and form a continuous leak path through the cement sheath [45]. Thus, although radial cracks are not seen in this sample, the cement sheath still loses its sealing ability due to a leak path inside the cement. Finally, it could be noted that an increase in casing-cement debonding is seen as well.

3.2. Visualization of Microannuli and Cement Debonding

When there is no or poor bonding between the cement and its surrounding casing or formation, the resulting debonded areas are usually called “microannuli” [9]. These debonded areas could be created initially during cement placement and setting due to cement shrinkage or incomplete mud removal, or later during production and injection operations due to casing contraction and expansion [13]. In most cases, however, such microannuli represent a potential leakage pathway for downhole fluids.
Essential questions regarding microannuli are what sizes, geometries and shapes they have. In other words, are microannuli homogeneous and uniform around the entire circumference of the cement, or not? Model simulations have shown that the size of microannuli can be dependent on wellbore characteristics such as formation properties, casing size and cement stiffness [27,67], however, the resulting shapes can be challenging to determine from such simulations. Stormont et al. [24] and Garcia Fernandez et al. [25] found experimentally that the microannulus aperture can vary considerably around the circumference when they studied gas flow through different microannuli, and concluded that microannuli have complex geometries. For simplicity however, a common approach in many studies is to assume microannuli uniformity, which for example, works well when converting measured fluid flow rates to microannuli apertures by introducing the terms “equivalent” or “effective” microannulus [20,68,69,70]. A limitation of this approach is that the estimated microannuli sizes are not really correct and give no accurate information about the actual microannuli geometry [9,50].
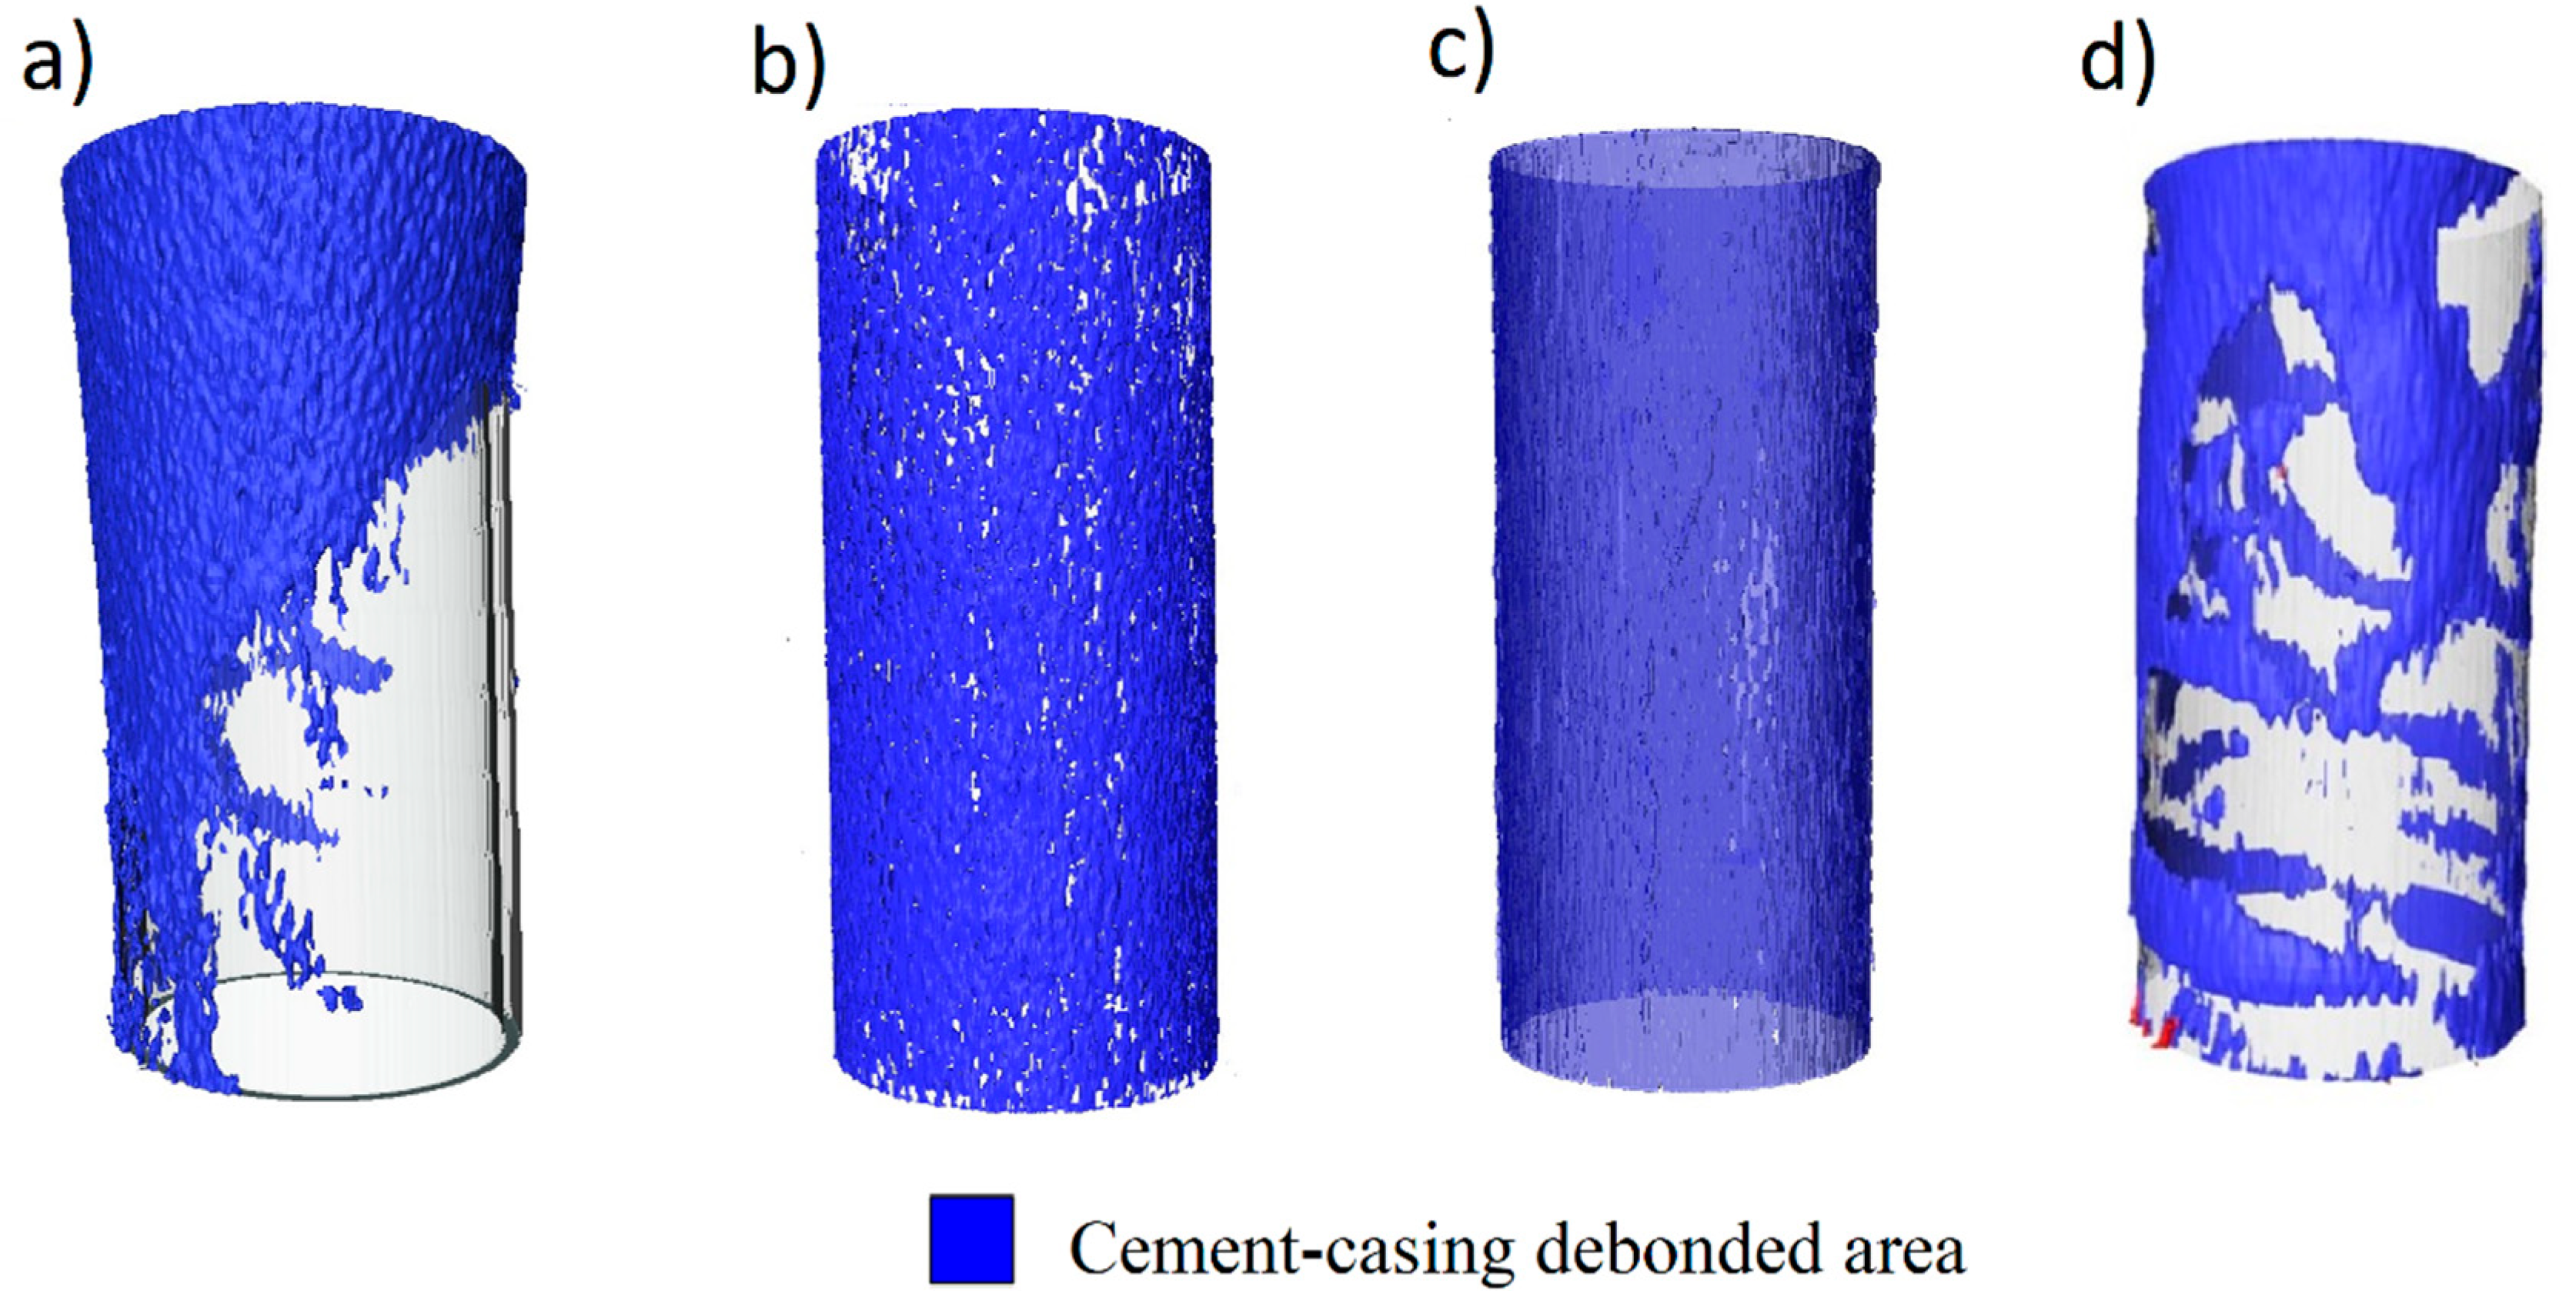
Figure 6 shows four examples of experimentally created cement-casing microannuli [9,41] and it is seen that they are not homogeneous and uniform. On the contrary, the microannuli geometries are heterogeneous and can be somewhat random. Figure 6a shows a microannulus formed during cement shrinkage, and it is seen that a considerable part of the cement-casing interface is fully bonded and that the debonding mostly occurs at one side of the casing resulting in a partly “halfmoon-shaped” microannulus. Figure 6b shows the resulting debonded area after complete radial cracking of the cement sheath, whereas Figure 6c,d show examples of the debonded area due to mudfilm, cured at ambient pressure and at elevated pressure, respectively. Of these four examples, the microannulus geometry showed in Figure 6a is perhaps the most relevant and interesting and is possibly also the geometry that is most consistent with the experimental findings of Stormont et al. [24] and Garcia Fernandez et al. [25].
Despite the merits of the simplified approach of assuming uniform microannuli, real microannuli geometries, such as those exemplified in Figure 6, should be taken into account when studying cement integrity and the resulting interfacial fluid flow behavior.
Furthermore, another experimental observation that has been made is that the debonding that occurs as a result of thermal cycling operations starts at initial defects already present. An example is seen in Figure 5, where the blue area (i.e., debonding towards casing) has increased considerably after thermal cycling, and that the resulting debonded area propagated from small, initial defects at the interface present before cycling. This finding is consistent in our experimental studies on microannuli during thermal cycling [41,44,45]. Moreover, this point was used as a basis by Ichim and Teodoriu [71] in a FEA study to understand how such initial defects are created, resulting in suggestions on how to improve experimental testing of well cement.

3.3. Visualization of Fluid Flow through Cracks and Microannuli

To fully understand well leakages, important questions to answer are: how do different downhole fluids flow through cracks and microannuli in cement, and how can the resulting leak rates be predicted? Fluid flow through well cement can be relatively straightforward to predict when assuming that the leak path geometries are homogeneous and uniform. The resulting leak rates are calculated by existing equations and extrapolated to predict different scenarios. Thus, uniform leak path geometries and linear flow behavior are, for example, usually used in models that predict potential future leak rates from plugged and abandoned wells [72,73]. However, due to the heterogeneity of real well cement leak paths, such simplified estimations are inaccurate. There is therefore a need to use realistic leak path geometries in fluid flow simulations to improve the accuracy of leak rate predictions as well as the overall understanding of well leakages.
An advantage of characterizing cement microannuli and cracks by X-ray computed tomography is that the obtained, digital geometries can subsequently be imported into computational fluid dynamics (CFD) simulation tools and used as leak path geometries in fluid flow simulations. Such an approach was used by Jung and Kabilan et al. [35,36] when simulating CO2 flow through cement cracks prior to and after cement carbonation, to visually illustrate the sealing effect of carbonation. Although they used cylindrical cement samples where cracks were created during compression tests, and thus, not realistic annular geometries, they demonstrated the value of this approach. Therefore, by using realistic, annular crack geometries and microannuli such as those shown in Figure 3, Figure 4, Figure 5 and Figure 6 as imported geometries in CFD tools, subsequent flow simulations have the potential to provide valuable understanding of actual well leakages. It should be noted however, that a major limitation of this approach is that it is assumed that the leak path geometries are fixed and do not change during flow. This assumption is incorrect, and for example, increased pressure differences may open up microannuli, and thus, increase the available flow path size [27,74].
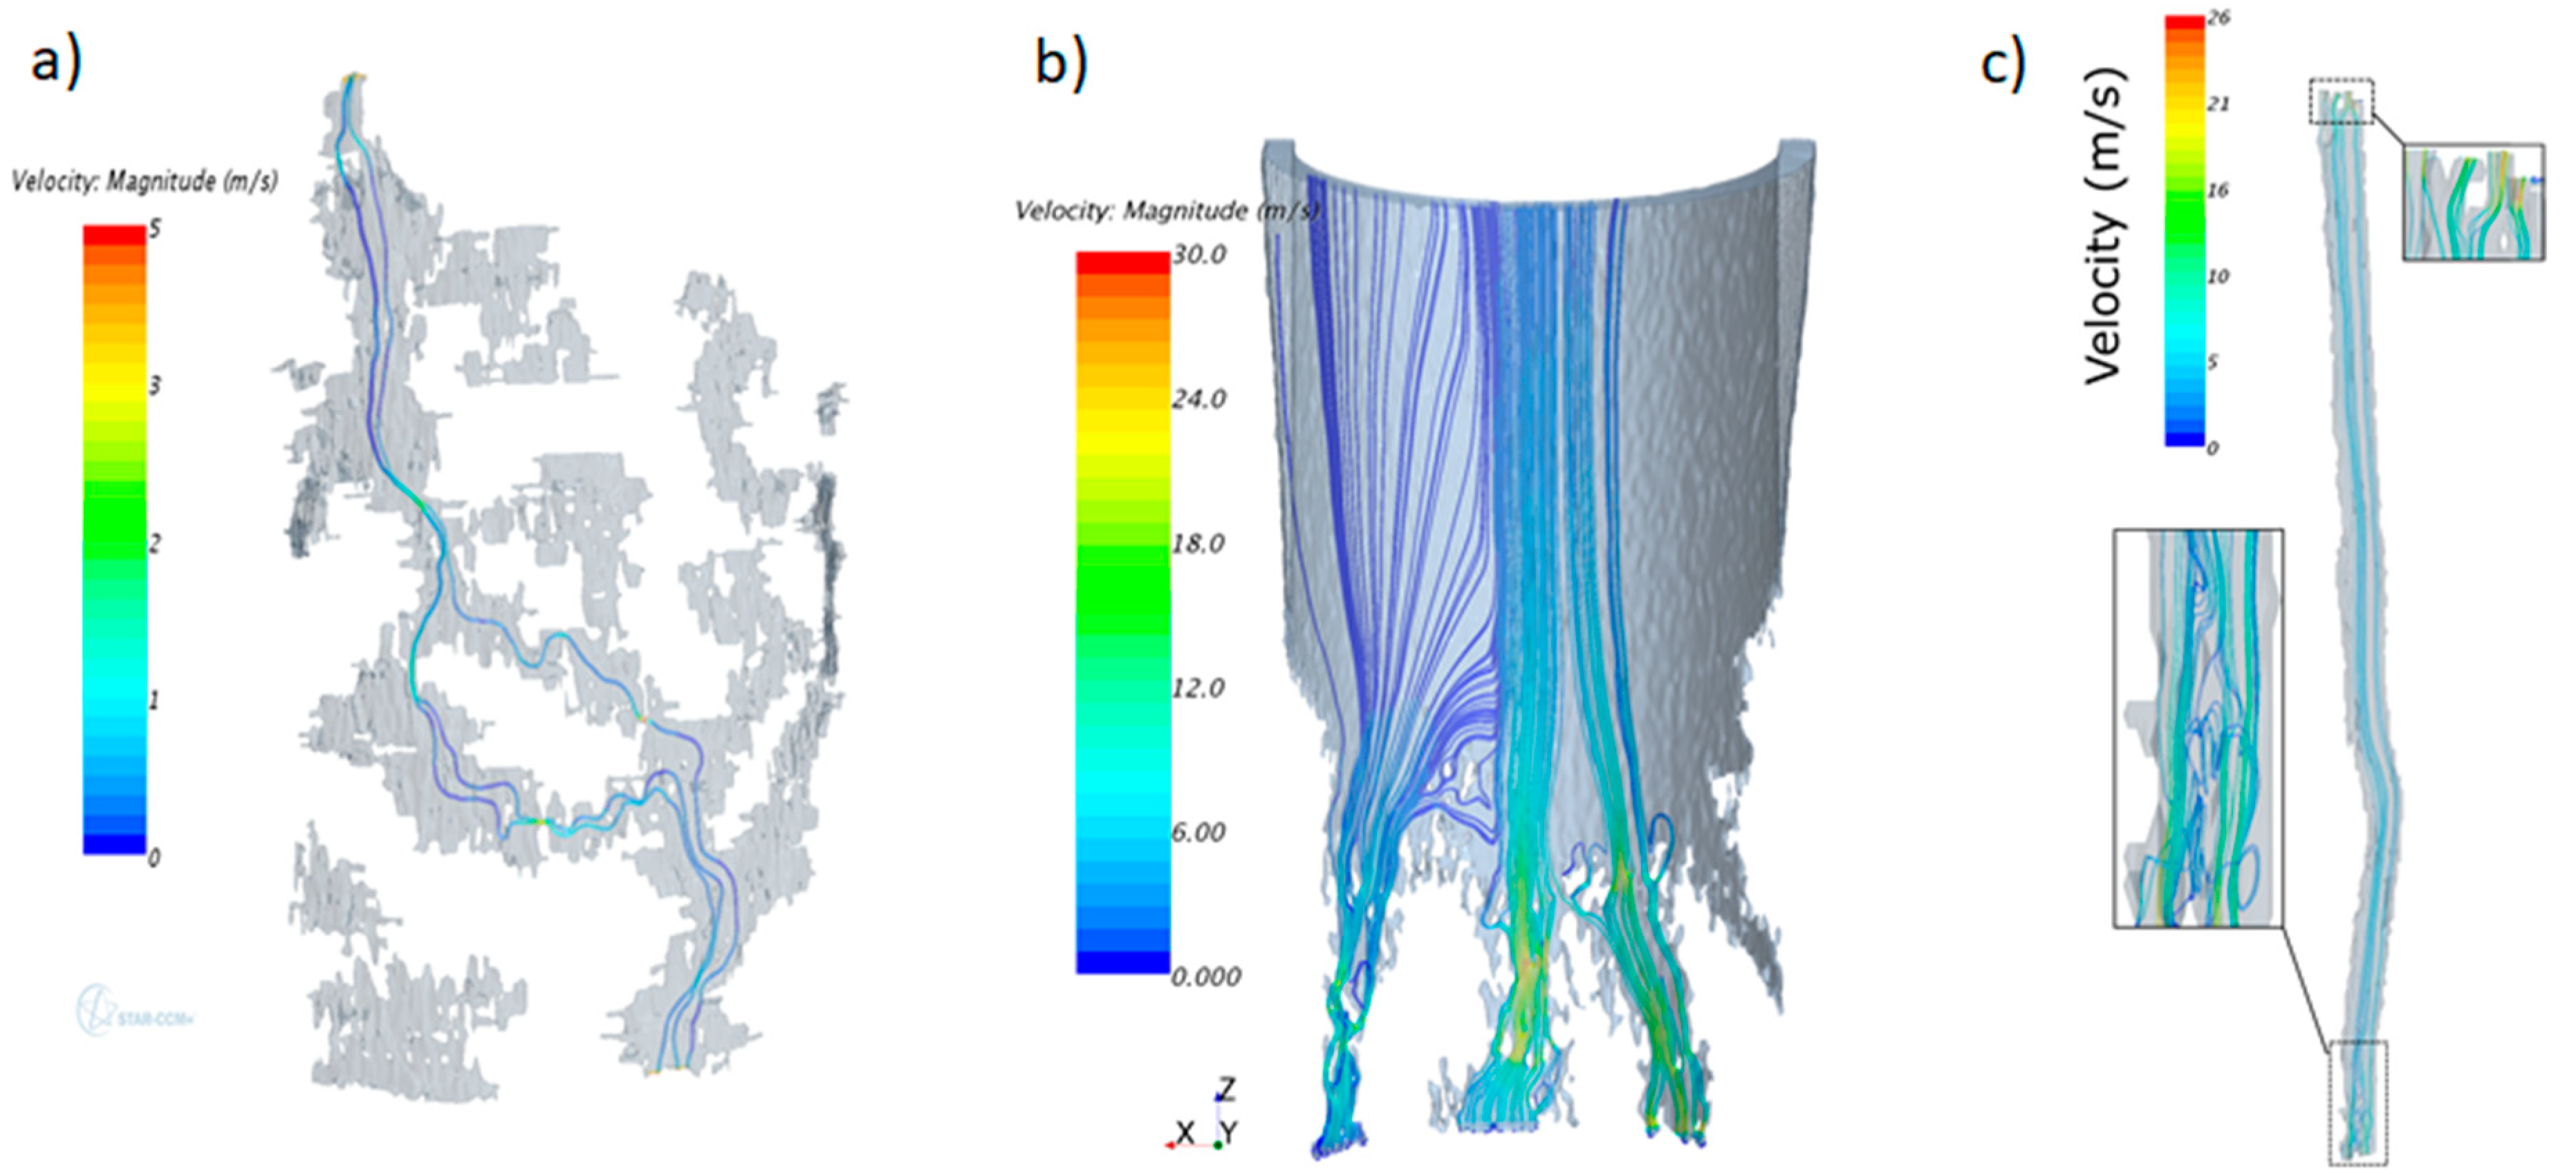
Figure 7 shows three examples where experimentally created cracks and microannuli have been used as leak path geometries in CFD flow simulations [50,51,52]. Methane was used as fluid in these simulations. Figure 7a visualizes flow through the internal defects shown in Figure 5, Figure 7b visualizes flow through the microannulus shown in Figure 6a, whereas Figure 7c visualizes flow through a radial crack such as those shown in Figure 3 and Figure 4. A common finding for all these simulations is that the heterogeneous geometries create tortuous flow patterns with vortexes. Both the non-uniformity of the overall geometry and local heterogeneities such as surface roughness and flow path bottlenecks contribute to these complex flow patterns. Furthermore, it is observed that the resulting flow rates are not linearly dependent upon pressure difference [50,51,52], as could be expected from Darcy’s law. It is seen that the less uniform the leak path geometry is, the less linear the relationship between flow rate and pressure difference is, whereas a completely uniform and homogeneous microannulus shows predicable and linear flow behavior. However, this may depend upon fluid type and viscosity, as found in references [51,52]. Much work is still needed to fully understand flow behavior during well leakages, but it is important to take such heterogeneities and non-linearities into account when predicting leak rates from real wells.

4. Conclusions

Digital characterization methods such as X-ray computed tomography have the potential to provide 3D visualizations of cracks and microannuli in well cement, and thereby, give new insights of cement failure mechanisms. For example, in this paper it has been shown that:
  • Radial cracks do usually not form in symmetrical and predictable patterns. Only one crack is formed first, and subsequent cracks may form later. The cement cracks may propagate into the surrounding rock.
  • Microannuli do not have uniform geometries with homogeneous aperture around the circumference. Real microannuli geometries can be somewhat random and may depend upon how they are generated.
  • Fluid flow through cracks and microannuli do not follow Darcian linearity, due to local heterogeneities and complex flow patterns.
Such experimental findings can be used as a benchmark to validate available model simulation tools predicting both mechanical and hydraulic cement integrity, as well as to potentially improve these models. Therefore, by using scientific approaches and advanced methodologies such as the digital cement integrity methodology described here, a step-change in understanding of cement sheath integrity and well leakages may be obtained.

Author Contributions

Conceptualization, T.V.; methodology, T.V. and R.S.; formal analysis, R.S.; writing—original draft preparation, T.V. and R.S.; writing—review and editing, T.V. and R.S. All authors have read and agreed to the published version of the manuscript.

Funding

The methodology described in this paper was developed through the research center DrillWell, funded by the Research Council of Norway, Aker BP, ConocoPhillips, Equinor and Wintershall DEA.

Acknowledgments

The authors would like to thank their colleagues Malin Torsæter, Jelena Todorovic and Nils Opedal, as well as former NTNU PhD-students Jesus De Andrade and Anisa Noor Corina, for their valuable contributions to the methodology. We are also grateful to Axel-Pierre Bois for fruitful discussions about cement integrity and microannuli in particular.

Conflicts of Interest

The authors declare no conflict of interest.

References

  1. Bourgoyne, A.T.; Scott, S.L.; Regg, J.B. Sustained Casing Pressure in Offshore Producing Wells (OTC-11029). In Proceedings of the Offshore Technology Conference, Houston, TX, USA, 3–6 May 1999. [Google Scholar]
  2. Vignes, B.; Aadnoy, B. Well Integrity Issues Offshore Norway. SPE Prod. Oper. 2010, 25, SPE-112535-PA. [Google Scholar] [CrossRef]
  3. Watson, T.L.; Bachu, S. Evaluation of the potential for gas and CO2 leakage along wellbores. SPE Drill. Complet. 2009, 1, SPE-106817-PA. [Google Scholar] [CrossRef] [Green Version]
  4. Trudel, E.; Bizhani, M.; Zare, M.; Frigaard, I. Plug and abandonment practices and trends: A British Colombia perspective. J. Pet. Sci. Eng. 2019, 183, 106417. [Google Scholar] [CrossRef]
  5. Gasda, S.E.; Bachu, S.; Celia, M.A. Spatial characterization of the location of potentially leaky wells penetrating a deep saline aquifer in a mature sedimentary basin. Environ. Geol. 2004, 46, 707–720. [Google Scholar] [CrossRef]
  6. Zhang, M.; Bachu, S. Review of integrity of existing wells in relation to CO2 geological storage: What do we know? Int. J. Greenh. Gas Control 2011, 5, 826–840. [Google Scholar] [CrossRef]
  7. Carrol, S.; Carey, J.W.; Dzombak, D.; Huerta, N.J.; Li, L.; Richard, T.; Um, W.; Walsh, S.D.C.; Zhang, L. Review: Role of chemistry, mechanics, and transport on well integrity in CO2 storage environments. Int. J. Greenh. Gas Control 2016, 49, 149–160. [Google Scholar] [CrossRef] [Green Version]
  8. Kiran, R.; Teodoriu, C.; Dadmohammadi, Y.; Nygaard, R.; Wood, D.; Mokhtari, M.; Salehi, S. Identification and evaluation of well integrity and causes of failure of well integrity barriers (A review). J. Nat. Gas. Sci. Eng. 2017, 45, 511–526. [Google Scholar] [CrossRef]
  9. Vrålstad, T.; Saasen, A.; Fjær, E.; Øia, T.; Ytrehus, J.D.; Khalifeh, M. Plug & abandonment of offshore wells: Ensuring long-term well integrity and cost efficiency. J. Pet. Sci. Eng. 2019, 173, 478–491. [Google Scholar]
  10. Thiercelin, M.J.; Dargaud, B.; Baret, J.F.; Rodriquez, W.J. Cement Design Based on Cement Mechanical Response. SPE Drill. Complet. 1998, 13, SPE-52890-PA. [Google Scholar] [CrossRef]
  11. Bosma, B.; Ravi, K.; van Driel, W.; Schreppers, G.J. Design Approach to Sealant Selection for the Life of the Well (SPE 56536). In Proceedings of the 1999 SPE Annual Technical Conference and Exhibition, Houston, TX, USA, 3–6 October 1999. [Google Scholar]
  12. Ravi, K.; Bosma, M.; Gastebled, O. Improve the Economics of Oil and Gas Wells by Reducing the Risk of Cement Failure (IADC/SPE 74497-MS). In Proceedings of the IADC/SPE Drilling Conference, Dallas, TX, USA, 26–28 February 2002. [Google Scholar]
  13. Bois, A.-P.; Garnier, A.; Rodot, F.; Sain-Marc, J.; Aimard, N. How to Prevent Loss of Zonal Isolation Through a Comprehensive Analysis of Micro-Annulus Formation. SPE Drill. Complet. 2011, 26, SPE-124719-PA. [Google Scholar] [CrossRef]
  14. Bois, A.-P.; Garnier, A.; Galdiolo, G.; Laudet, J.-B. Use of a Mechanistic Model to Forecast Cement-Sheath Integrity. SPE Drill. Complet. 2012, 27, SPE-139668-PA. [Google Scholar] [CrossRef]
  15. Therond, E.; Bois, A.-P.; Whaley, K.; Murillo, R. Large-Scale Testing and Modeling for Cement Zonal Isolation in Water-Injection Wells. SPE Drill. Complet. 2017, 32, SPE-181428-PA. [Google Scholar] [CrossRef]
  16. Nygaard, R.; Salehi, S.; Weideman, B.; Lavoie, R. Effect of Dynamic Loading on Wellbore Leage for the Wabamun Area CO2-Sequestration Project. J. Can. Pet. Technol. 2014, 53, SPE-146640-PA. [Google Scholar] [CrossRef]
  17. Carey, J.W.; Wigand, M.; Chipera, S.J.; WoldeGabriel, G.; Pawar, R.; Lichtner, P.C.; Wehner, S.C.; Raines, M.A.; Guthrie, G.D., Jr. Analysis and performance of oil well cement with 30 years of CO2 exposure from the SACROC Unit, West Texas, USA. Int. J. Greenh. Gas Control 2007, 1, 75–85. [Google Scholar] [CrossRef]
  18. Goodwin, K.J.; Crook, R.J. Cement Sheath Stress Failure (SPE 20453). In Proceedings of the 65th Annual Technical Conference and Exhibition, New Orleans, LA, USA, 23–26 September 1990. [Google Scholar]
  19. Jackson, P.B.; Murphey, C.E. Effect of Casing Pressure on Gas Flow through a Sheath of Set Cement (SPE 25698). In Proceedings of the SPE Drilling Conference, Amsterdam, The Netherlands, 23–25 February 1993. [Google Scholar]
  20. Boukhelifa, L.; Moroni, N.; James, S.G.; Le Roy-Delage, S.; Thiercelin, M.J.; Lemaire, G. Evaluation of Cement Systems for Oil and Gas Well Zonal Isolation in a Full-Scale Annular Geometry. SPE Drill. Complet. 2005, 20, SPE-87195-PA. [Google Scholar] [CrossRef]
  21. Kupresan, D.; Heathman, J.; Radonjic, M. Casing Expansion as a Promising Solution for Microannular Gas Migration. SPE Drill. Complet. 2014, 29, 366–371, SPE-168056-PA. [Google Scholar] [CrossRef]
  22. Shadravan, A.; Schubert, J.; Amani, M.; Teodoriu, C. Using Fatigue-Failure Envelope for Cement Sheath-Integrity Evaluation. SPE Drill. Complet. 2015, 30, 68–75, SPE-168321-PA. [Google Scholar] [CrossRef]
  23. Nagelhout, A.; Bosma, M.G.R.; Mul, P.; Krol, G.; van Velzen, H.; Joldersma, J.; James, S.G.; Dargaud, B.; Schreuder, R.; Théry, F. Laboratory and Field Validation of a Sealant System for Critical Plug-and-Abandon Applications. SPE Drill. Complet. 2010, 25, 314–321, SPE-97347-PA. [Google Scholar] [CrossRef]
  24. Stormont, J.C.; Garcia Fernandez, S.; Taha, M.R.; Matteo, E.N. Gas flow through cement-casing microannuli under varying stress conditions. Geomech. Energy Environ. 2018, 13, 1–13. [Google Scholar] [CrossRef]
  25. Garcia Fernandez, S.; Matteo, E.N.; Taha, M.R.; Stormont, J.C. Characterization of wellbore microannuli. J. Nat. Gas Sci. Eng. 2019, 62, 13–25. [Google Scholar] [CrossRef] [Green Version]
  26. Al Ramadan, M.; Salehi, S.; Kwatia, G.; Ezeakacha, C.; Teodoriu, C. Experimental investigation of well integrity: Annular gas migration in cement column. J. Pet. Sci. Eng. 2019, 179, 126–135. [Google Scholar] [CrossRef]
  27. Bois, A.-P.; Vu, M.-H.; Noël, K.; Badalamenti, A.; Delabroy, L.; Thérond, E.; Hansen, K. Evaluating Cement-Plug Mechanical and Hydraulic Integrity. SPE Drill. Complet. 2019, 34. SPE-191335-PA. [Google Scholar] [CrossRef]
  28. Kutchko, B.; Crandall, D.; Moore, J.; Gill, M.; Haljasmaa, I.; Spaulding, R.; Harbert, W.; Benge, G.; DeBruijn, G.; Shine, J.M. Assessment of Foamed Cement Used in Deep Offshore Wells (SPE-170298-MS). In Proceedings of the SPE Deepwater Drilling and Completions Conference, Galveston, TX, USA, 10–11 September 2014. [Google Scholar]
  29. Fahrman, B.P.; Huerta, N.J.; Crandall, D.; Moore, J.E. Visualizing Well System Breakdown: Experimental and Numerical Analyses (ARMA 17-867). In Proceedings of the 51st US Rock Mechanics/Geomechanics Symposium, San Francisco, CA, USA, 25–28 June 2017. [Google Scholar]
  30. Pang, X.; Maxson, J.K.; Jimenez, W.C.; Singh, J.P.; Morgan, R.G. Microscale Characterization of Field and Laboratory Foamed Cement by Use of X-Ray Microcomputed Tomography. SPE J. 2017, 22, SPE-180278-PA. [Google Scholar] [CrossRef]
  31. Dalton, L.E.; Brown, S.; Moore, J.; Crandall, D.; Gill, M. Laboratory Foamed-Cement-Curing Evolution Using CT Scanning: Insights from Elevated-Pressure Generation. SPE Drill. Complet. 2019, 34, SPE-194007-PA. [Google Scholar] [CrossRef]
  32. Yang, X.; Kuru, E.; Gingras, M.; Iremonger, S.; Taylor, J.; Lin, Z. Quantifying 2D and 3D Fracture Leakage Pathways Observed in Wellbore Cement after Uniaxial Compressive Loading (SPE-198683-MS). In Proceedings of the SPE Thermal Well Integrity and Design Symposium, Banff, AB, Canada, 19–21 November 2019. [Google Scholar]
  33. Jung, H.B.; Jansik, D.; Um, W. Imaging Wellbore Cement Degradation by Carbon Dioxide under Geologic Sequestration Conditions Using X-ray Computed Microtomography. Environ. Sci. Technol. 2013, 47, 283–289. [Google Scholar] [CrossRef]
  34. Jung, H.B.; Um, W. Experimental study of potential wellbore cement carbonation by various phases of carbon dioxide during geologic carbon sequestration. Appl. Geochem. 2013, 35, 161–172. [Google Scholar] [CrossRef]
  35. Jung, H.B.; Kabilan, S.; Carson, J.P.; Kuprat, A.P.; Um, W.; Martin, P.; Dahl, M.; Kafentziz, T.; Varga, T.; Stephens, S.; et al. Wellbore cement fracture evolution at the cement-basalt caprock interface during geologic carbon sequestration. Appl. Geochem. 2014, 47, 1–16. [Google Scholar] [CrossRef]
  36. Kabilan, S.; Jung, H.B.; Kuprat, A.P.; Beck, A.N.; Varga, T.; Fernandez, C.A.; Um, W. Numerical Simulation of Permeability Change in Wellbore Cement Fractures after Geomechanical Stress and Geochemical Reactions Using X-ray Computed Tomography Imaging. Environ. Sci. Technol. 2016, 50, 6180–6188. [Google Scholar] [CrossRef]
  37. Um, W.; Rod, K.A.; Jung, H.B.; Brown, C.F. Geochemical alteration of wellbore cement by CO2 or CO2 + H2S reaction during long-term carbon storage. Greenh. Gas. Sci. Technol. 2017, 7, 852–865. [Google Scholar] [CrossRef]
  38. Chavez Panduro, E.A.; Torsæter, M.; Gawel, K.; Bjørge, R.; Gibaud, A.; Yang, Y.; Bruns, S.; Zheng, Y.; Sørensen, H.O.; Breiby, D.W. In-Situ X-ray Tomography Study of Cement Exposed to CO2 Saturated Brine. Environ. Sci. Technol. 2017, 51, 9344–9351. [Google Scholar] [CrossRef]
  39. Chavez Panduro, E.A.; Torsæter, M.; Gawel, K.; Bjørge, R.; Gibaud, A.; Bonnin, A.; Schlepütz, C.H.; Breiby, D.W. Computed X-rayTomography Study of Carbonate Precipitation in Large Portland Cement Pores. Cryst. Growth Des. 2019, 19, 5850–5857. [Google Scholar] [CrossRef]
  40. Bjørge, R.; Gawel, K.; Chavez Panduro, E.A.; Torsæter, M. Carbonation of silica cement at high-temperature well conditions. Int. J. Greenh. Gas Control 2019, 82, 261–268. [Google Scholar] [CrossRef]
  41. De Andrade, J.; Sangesland, S.; Skorpa, R.; Todorovic, J.; Vrålstad, T. Experimental Laboratory Setup for Visualization and Quantification of Cement-Sheath Integrity. SPE Drill. Complet. 2016, 31, SPE-173871-PA. [Google Scholar] [CrossRef]
  42. Skorpa, R.; Øia, T.; Taghipour, A.; Vrålstad, T. Laboratory Set-up for Determination of Cement Sheath Integrity During Pressure Cycling (OMAE2018-78696). In Proceedings of the ASME 2018 37th International Conference on Ocean, Offshore and Arctic Engineering, Madrid, Spain, 17–22 June 2018. [Google Scholar]
  43. Albawi, A.; De Andrade, J.; Torsæter, M.; Opedal, N.; Stroisz, A.; Vrålstad, T. Experimental Set-Up for Testing Cement sheath Integrity in Arctic Wells (OTC 24587). In Proceedings of the OTC Arctic Technology Conference, Houston, TX, USA, 10–12 February 2014. [Google Scholar]
  44. De Andrade, J.; Torsæter, M.; Todorovic, J.; Opedal, N.; Stroisz, A.; Vrålstad, T. Influence of Casing Centralization on Cement Sheath Integrity During Thermal Cycling (IADC/SPE-168012-MS). In Proceedings of the IADC/SPE Drilling Conference and Exhibition, Dallas, TX, USA, 4–6 March 2014. [Google Scholar]
  45. Vrålstad, T.; Skorpa, R.; Opedal, N.; De Andrade, J. Effect of Thermal Cycling on Cement Sheath Integrity: Realistic Experimental Tests and Simulation of Resulting Leakages (SPE-178467-MS). In Proceedings of the SPE Thermal Well Integrity and Design Symposium, Banff, AB, Canada, 23–25 November 2015. [Google Scholar]
  46. Todorovic, J.; Gawel, K.; Lavrov, A.; Torsæter, M. Integrity of Downscaled Well Models Subject to Cooling (SPE-180052). In Proceedings of the 2016 SPE Bergen One Day Seminar, Bergen, Norway, 20 April 2016. [Google Scholar]
  47. Vrålstad, T.; Skorpa, R.; Werner, B. Experimental Studies on Cement Sheath Integrity During Pressure Cycling (SPE/IADC-194171-MS). In Proceedings of the SPE/IADC Drilling Conference and Exhibition, The Hague, The Netherlands, 5–7 March 2019. [Google Scholar]
  48. Skorpa, R.; Werner, B.; Vrålstad, T. Effect of Mud on Cement Sheath Integrity (SPE-195625-MS). In Proceedings of the SPE Norway One Day Seminar, Bergen, Norway, 14 May 2019. [Google Scholar]
  49. Skorpa, R.; Werner, B.; Vrålstad, T. Effect of Rock on Cement Sheath Integrity: Shale vs. Sandstone (OMAE2019-96738). In Proceedings of the ASME 2019 38th International Conference on Ocean, Offshore and Arctic Engineering, Glasgow, UK, 9–14 June 2019. [Google Scholar]
  50. Skorpa, R.; Vrålstad, T. Visualization of Fluid Flow Through Cracks and Microannuli in Cement Sheaths. SPE J. 2018, 23, SPE-180019-PA. [Google Scholar] [CrossRef]
  51. Corina, A.N.; Skorpa, R.; Sangesland, S.; Vrålstad, T. submitted.
  52. Skorpa, R.; Vrålstad, T. Leakages through radial cracks in cement sheaths: Effect of geometry, viscosity and aperture (OMAE2020-18496). In Proceedings of the ASME 2020 39th International Conference on Ocean, Offshore and Arctic Engineering, Fort Lauderdale, FL, USA, 28 June–3 July 2020. [Google Scholar]
  53. Opedal, N.; Torsæter, M.; Vrålstad, T.; Cerasi, P. Potential Leakage Paths along Cement Formation Interfaces in Wellbores; Implications for CO2 Storage. Energy Procedia 2014, 51, 56–64. [Google Scholar] [CrossRef] [Green Version]
  54. Opedal, N.; Todorovic, J.; Torsæter, M.; Vrålstad, T.; Mushtaq, W. Experimental Study on the Cement-Formation Bonding (SPE 168138-MS). In Proceedings of the SPE International Symposium and Exhibition on Formation Damage Control, Lafayette, LA, USA, 26–28 February 2014. [Google Scholar]
  55. Opedal, N.; Todorovic, J.; Torsæter, M.; Akervoll, I.; Jafarzade, G. Filter Cake Behavior during Leakage at the Cement-Rock Interface in Wellbores (ARMA-15-341). In Proceedings of the 49th U.S. Rock Mechanics/Geomechanics Symposium, San Francisco, CA, USA, 28 June–1 July 2015. [Google Scholar]
  56. Opedal, N.; Lavrov, A.; Todorovic, J.; Torsæter, M. The importance of shale caprock damage for well integrity. Int. J. Greenh. Gas Control 2018, 74, 182–190. [Google Scholar] [CrossRef]
  57. Vrålstad, T.; Todorovic, J.; Saasen, A.; Godøy, R. Long-Term Integrity of Well Cements at Downhole Conditions (SPE-180058-MS). In Proceedings of the SPE Bergen One Day Seminar, Bergen, Norway, 20 April 2016. [Google Scholar]
  58. Khalifeh, M.; Todorovic, J.; Vrålstad, T.; Saasen, A.; Hodne, H. Long-term durability of rock-based geopolymers aged at downhole conditions for oil well cementing operations. J. Sustain. Cem. Based Mater. 2017, 6, 217–230. [Google Scholar] [CrossRef]
  59. Skorpa, R.; Todorovic, J.; Torsæter, M. Porosity changes in mud-affected rock and cement upon reaction with CO2. Energy Procedia 2017, 114, 5266–5274. [Google Scholar] [CrossRef]
  60. Thermo Fisher Scientific. Avizo Software for Materials Research: Materials Characterization and Quality Control (Reprint). Available online: https://assets.thermofisher.com/TFS-Assets/MSD/brochures/brochure-avizo-software-materials-research.pdf.
  61. Siemens PLM Software. Star-CCM+ (Reprint). Available online: https://mdx.plm.automation.siemens.com/star-ccm-plus.
  62. Gheibi, S.; Sangesland, S.; Vrålstad, T. Numerical modeling of radial fracturing of cement sheath caused by pressure tests (OMAE2019-96319). In Proceedings of the ASME 2019 38th International Conference on Ocean, Offshore and Arctic Engineering, Glasgow, UK, 9–14 June 2019. [Google Scholar]
  63. TerHeege, J.H.; Orlic, B.; Hoedeman, G.C. Characteristics of mechanical wellbore failure and damage: Insights of discrete element modelling and application to CO2 storage (ARMA 15-174). In Proceedings of the 49th US Rock Mechanics/Geomechanics Symposium, San Francisco, CA, USA, 28 June–1 July 2015. [Google Scholar]
  64. Lavrov, A.; Todorovic, J.; Torsæter, M. Numerical study of tensile thermal stresses in a casing-cement-rock system with heterogeneities (ARMA 15-110). In Proceedings of the 49th US Rock Mechanics/Geomechanics Symposium, San Francisco, CA, USA, 28 June–1 July 2015. [Google Scholar]
  65. Roy, P.; Walsh, S.D.C.; Morris, J.P.; Iyer, J.; Hao, Y.; Carrol, S.; Gawel, K.; Todorovic, J.; Torsæter, M. Studying the Impact of Thermal Cycling on Wellbore Integrity during CO2 Injection. ARMA 16-0668. In Proceedings of the 50th US Rock Mechanics/Geomechanics Symposium, Houston, TX, USA, 26–29 June 2016. [Google Scholar]
  66. Orlic, B.; Chitu, A.; Brunner, L.; Koenen, M.; Wollenweber, J.; Schreppers, G.-J. Numerical investigations of cement interface debonding for assessing well integrity risks (ARMA 18-1298). In Proceedings of the 52nd US Rock Mechanics/Geomechanics Symposium, Seattle, WA, USA, 17–20 June 2018. [Google Scholar]
  67. Wise, J.; Cedola, A.; Nygaard, R.; Hareland, G.; Arild, Ø.; Lohne, H.P.; Ford, E.P. Wellbore Characteristics that Control Debonding Initiation and Microannuli Width in Finite Element Simulations. J. Pet. Sci. Eng. 2020, 191, 107157. [Google Scholar] [CrossRef]
  68. Aas, B.; Sørbø, J.; Stokka, S.; Saasen, A.; Godøy, R.; Lunde, Ø.; Vrålstad, T. Cement Placement with Tubing Left in Hole during Plug and Abandonment Operations (IADC/SPE-178840-MS). In Proceedings of the IADC/SPE Drilling Conference and Exhibition, Fort Worth, TX, USA, 1–3 March 2016. [Google Scholar]
  69. Corina, A.N.; Opedal, N.; Vrålstad, T.; Skorpa, R.; Sangesland, S. The Effect of Casing Pipe Roughness on Cement Plug Integrity. SPE Drill. Complet. 2020. SPE-194158-PA. [Google Scholar] [CrossRef]
  70. Skadsem, H.J.; Gardner, D.; Beltrán-Jiménez, K.; Kragset, S.; Delabroy, L.; Ruckert, F. Fluid Migration Characterization of Cemented Sections Retrieved from a North Sea Production Well (SPE/IADC-199663-MS). In Proceedings of the SPE/IADC Drilling Conference and Exhibition, Galveston, TX, USA, 3–5 March 2020. [Google Scholar]
  71. Ichim, A.C.; Teodoriu, C. Revisiting Thermal Well Integrity Through a Closer Look at Casing-Cement-Formation Interaction (SPE-182525-MS). In Proceedings of the SPE Thermal Well Integrity and Design Symposium, Banff, AB, Canada, 28 November–1 December 2016. [Google Scholar]
  72. Moeinikia, F.; Ford, E.; Lohne, H.P.; Arild, Ø.; Majourmerd, M.M.; Fjelde, K.K. Leakage Calculator for Plugged-and-Abandoned Wells. SPE Prod. Oper. 2018, 33, 790–801, SPE-185890-PA. [Google Scholar] [CrossRef]
  73. Ford, E.; Moeinikia, F.; Majourmerd, M.M.; Lohne, H.P.; Arild, Ø. Consequence Quantification of Barrier System Failures in Permanently Plugged and Abandoned Wells (SPE-191298-MS). In Proceedings of the SPE Norway One Day Seminar, Bergen, Norway, 18 April 2018. [Google Scholar]
  74. Beltrán-Jiménez, K.; Skadsem, H.J.; Gardner, D.; Kragset, S.; de Souza, M.I.L. Leakage Through Micro-Annulus Geometries Incorporating Pressure-Driven Elastic Deformation (OTC-29718-MS). In Proceedings of the Offshore Technology Conference Brazil, Rio de Janeiro, Brazil, 29–31 October 2019. [Google Scholar]
Figure 1. Experimental setup and CT segmentation process. (a) 2D Cross-section of the sample, illustrating how the cement sheath in located in between the rock and the casing. (b) A 2D CT image showing defects in the cement sheath. (c) Identification of defects in the cement sheath based on their location and using colors to separate the defects. (d) The stack of 2D CT images assembled into a 3D volume. (e) The final 3D volume of the cement sheath with defects.
Sustainability 12 04128 g001
Figure 2. (a) A typical experimentally obtained 2D CT image of radial crack in cement sheath [42] and (b) subsequent MDEM simulation of that experiment [62]. Resolution of CT images is approx. 200 µm.
Sustainability 12 04128 g002
Figure 3. X-ray computed tomography 3D visualization of radial cracks formed in cement and rock due to pressure increase inside the casing [47]. Resolution of CT images is approx. 200 µm.
Sustainability 12 04128 g003
Figure 4. X-ray computed tomography 3D visualization of radial cracks formed in cement with mudfilm at cement/rock interface due to pressure increase inside the casing [48]. Resolution of CT images is approx. 200 µm.
Sustainability 12 04128 g004
Figure 5. X-ray computed tomography 3D visualization of internal cracks formed in cement sheath with several initial defects during thermal cycling [45]. Resolution of CT images is approx. 200 µm.
Sustainability 12 04128 g005
Figure 6. Examples of X-ray computed tomography 3D visualizations of experimentally created microannuli at cement-casing interface: (a) due to cement shrinkage [9], (b) after full cement sheath cracking [9], (c) with mudfilm cured at ambient pressure [41], (d) with mudfilm cured at elevated pressure [41]. Resolution of CT images is approx. 200 µm.
Sustainability 12 04128 g006
Figure 7. Examples of CFD simulations of gas flow through experimentally created leak paths in cement sheaths: (a) internal defects [50], (b) microannulus [51] and (c) radial crack [52]. Simulations are based upon CT images with approx. 200 µm resolution.
Sustainability 12 04128 g007