Sustainable Supply Chain in the Era of Industry 4.0 and Big Data: A Systematic Analysis of Literature and Research


Abstract
1. Introduction
- RQ1:
- Which are the top contributing authors, countries, and institutions in the field of Big Data and Industry 4.0 as applied to SSCM?
- RQ2:
- Is it possible to define research categories on the basis of relevant common points?
- RQ3:
- Which are the future research necessities in the field of Big Data and Industry 4.0 as applied to SSCM?
2. Literature Review
2.1. Sustainable Supply Chain Management
- introduce the concept of continuous improvement and the need to be customer-oriented to the supply chain employees [22];
- optimize the two-directional flow of information, goods, technology, knowledge, human resources, and services among all the components of the chain [23];
- achieve both specific and common goals to improve long-term performance, for each company and for the supply chain as a whole [24].
2.2. Industry 4.0
2.3. Big Data
3. Software Tools and Research Methodology
3.1. Software Tools
3.2. Research Methodology
- Analysis of the evolution over time of the number of articles published included in the list,
- Analysis of the evolution of the number of citations generated by the articles,
- Analysis of the number of articles published by author,
- Analysis of the number of articles published by country,
- Analysis of the number of articles published by institution,
- Analysis of the content of the 10 most cited articles on the list,
- Analysis of the h-index indicator,
- Analysis of the number of articles published per journal,
- Analysis of the indicators of relevance, impact, and prestige of the 10 journals with the most published articles on the list. The indicators analysed were the following: CiteScore, Impact Factor, Normalized Source Factor, and Scimago Journal Rank.
4. Bibliometric Analysis
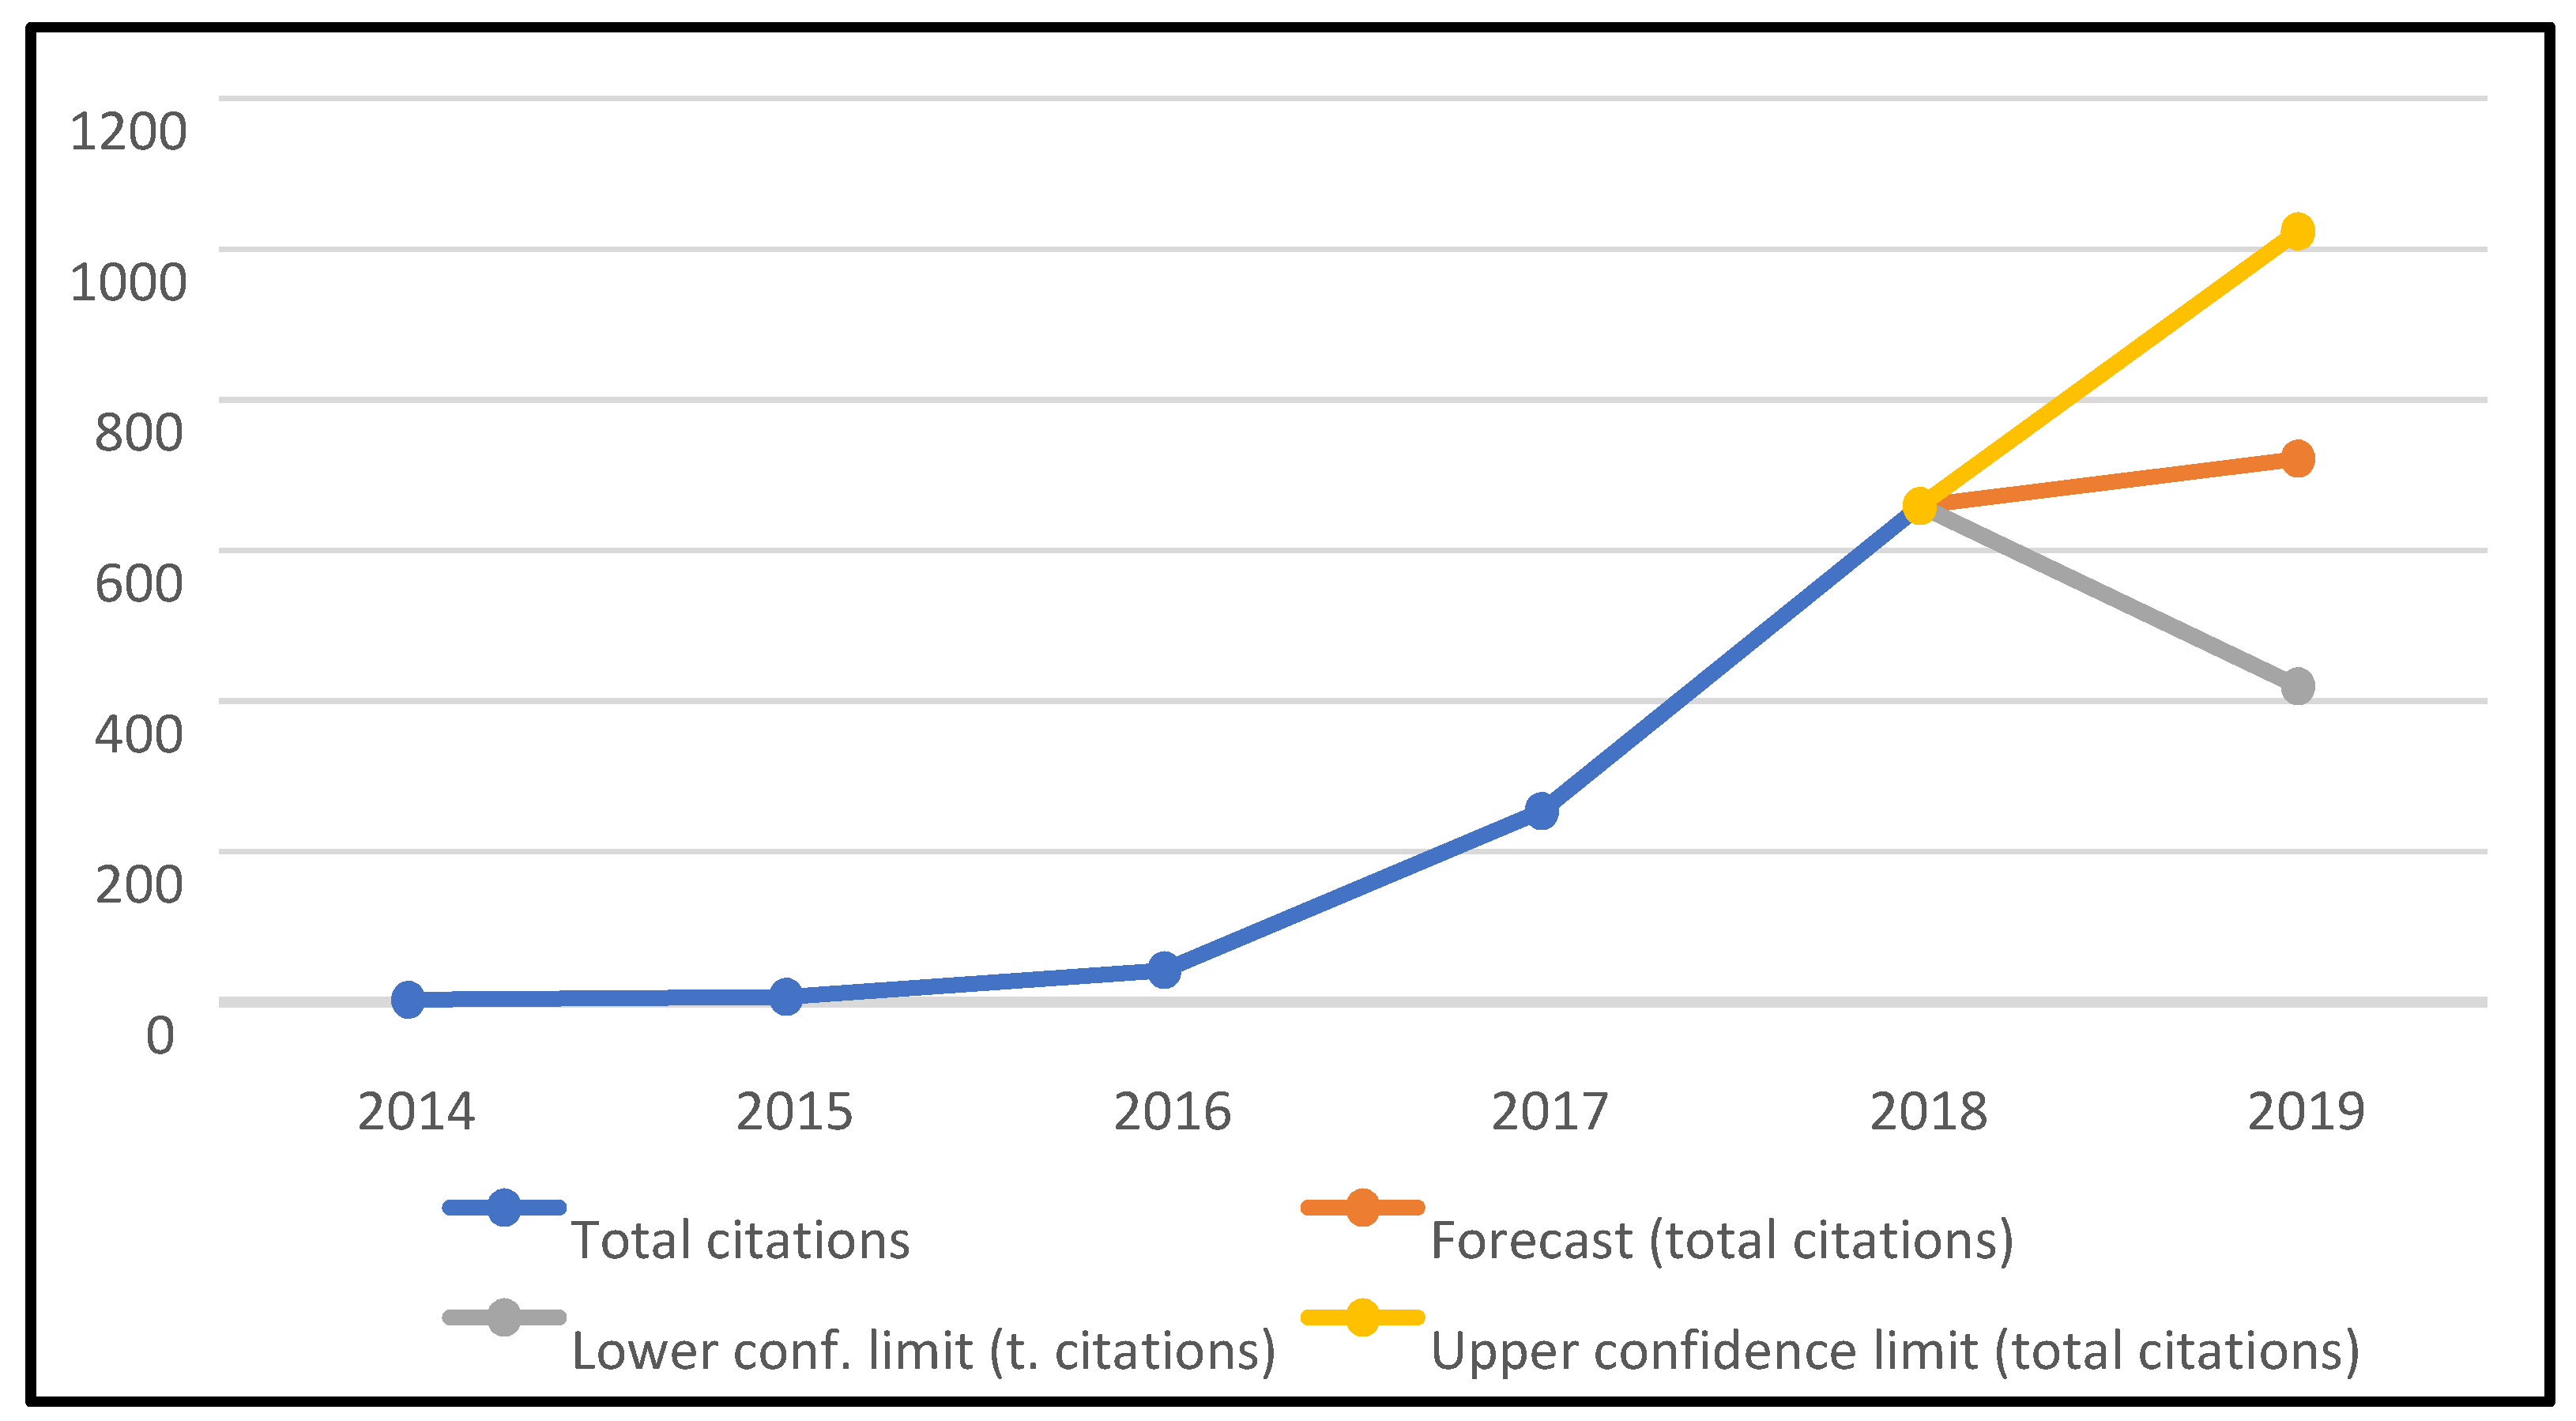
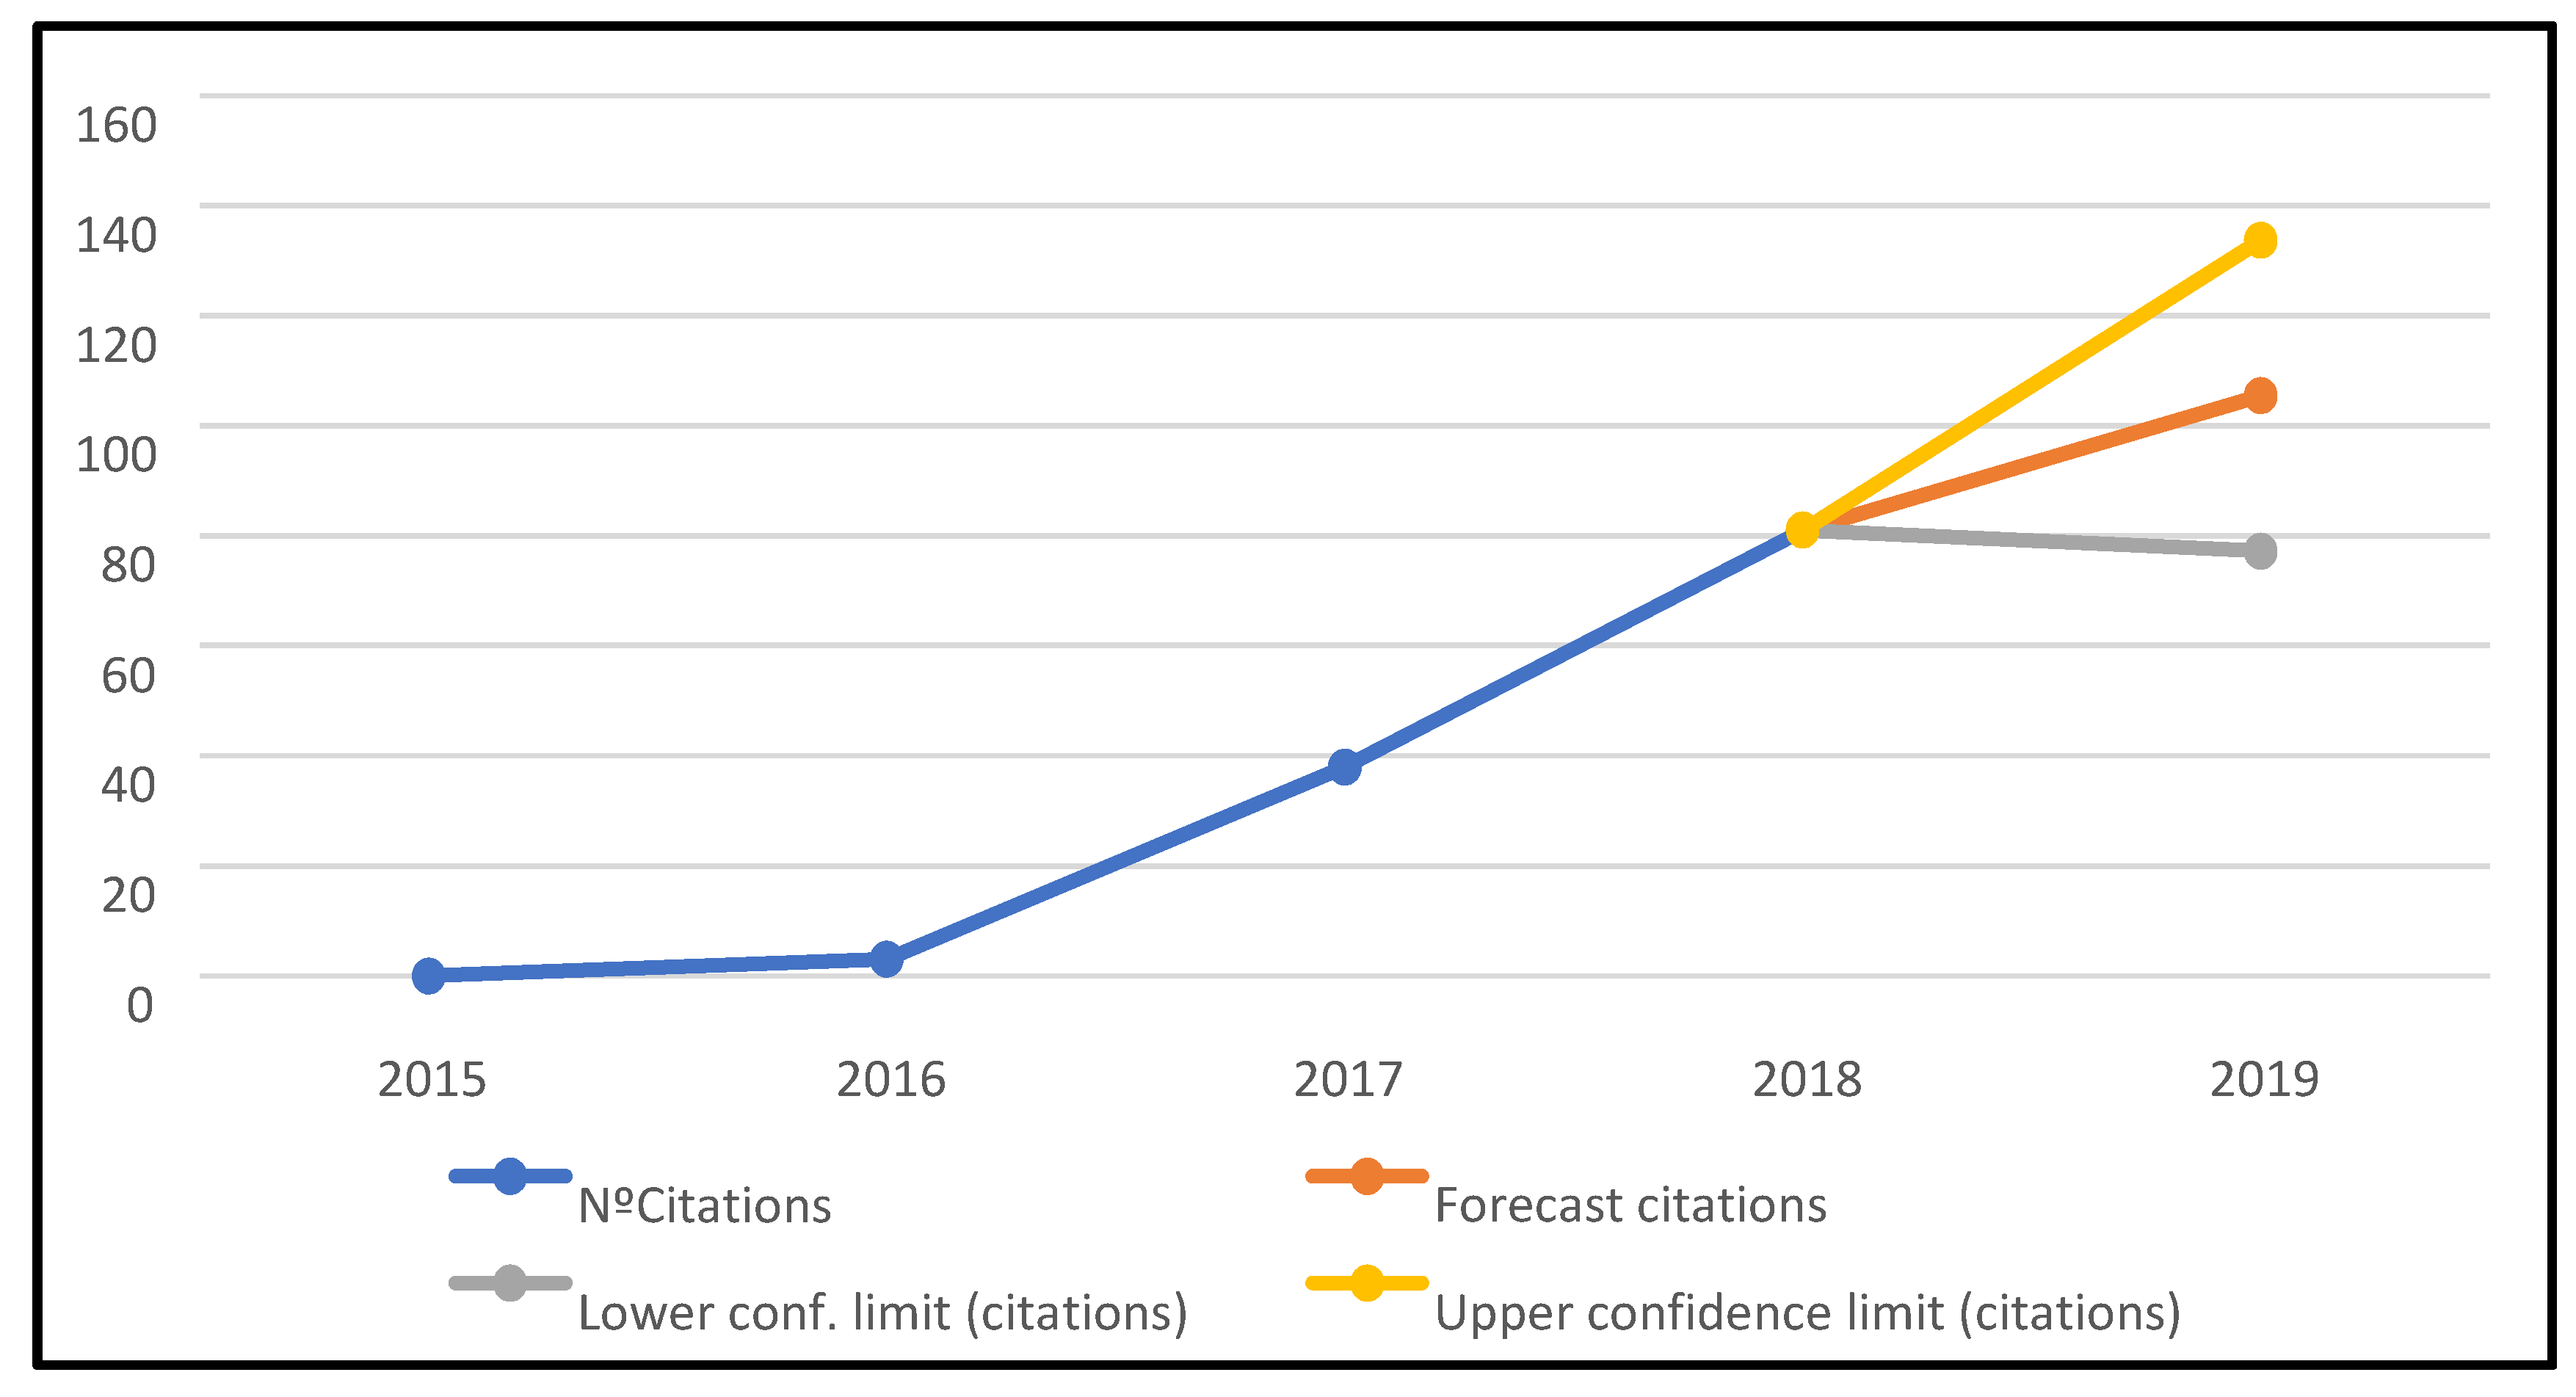
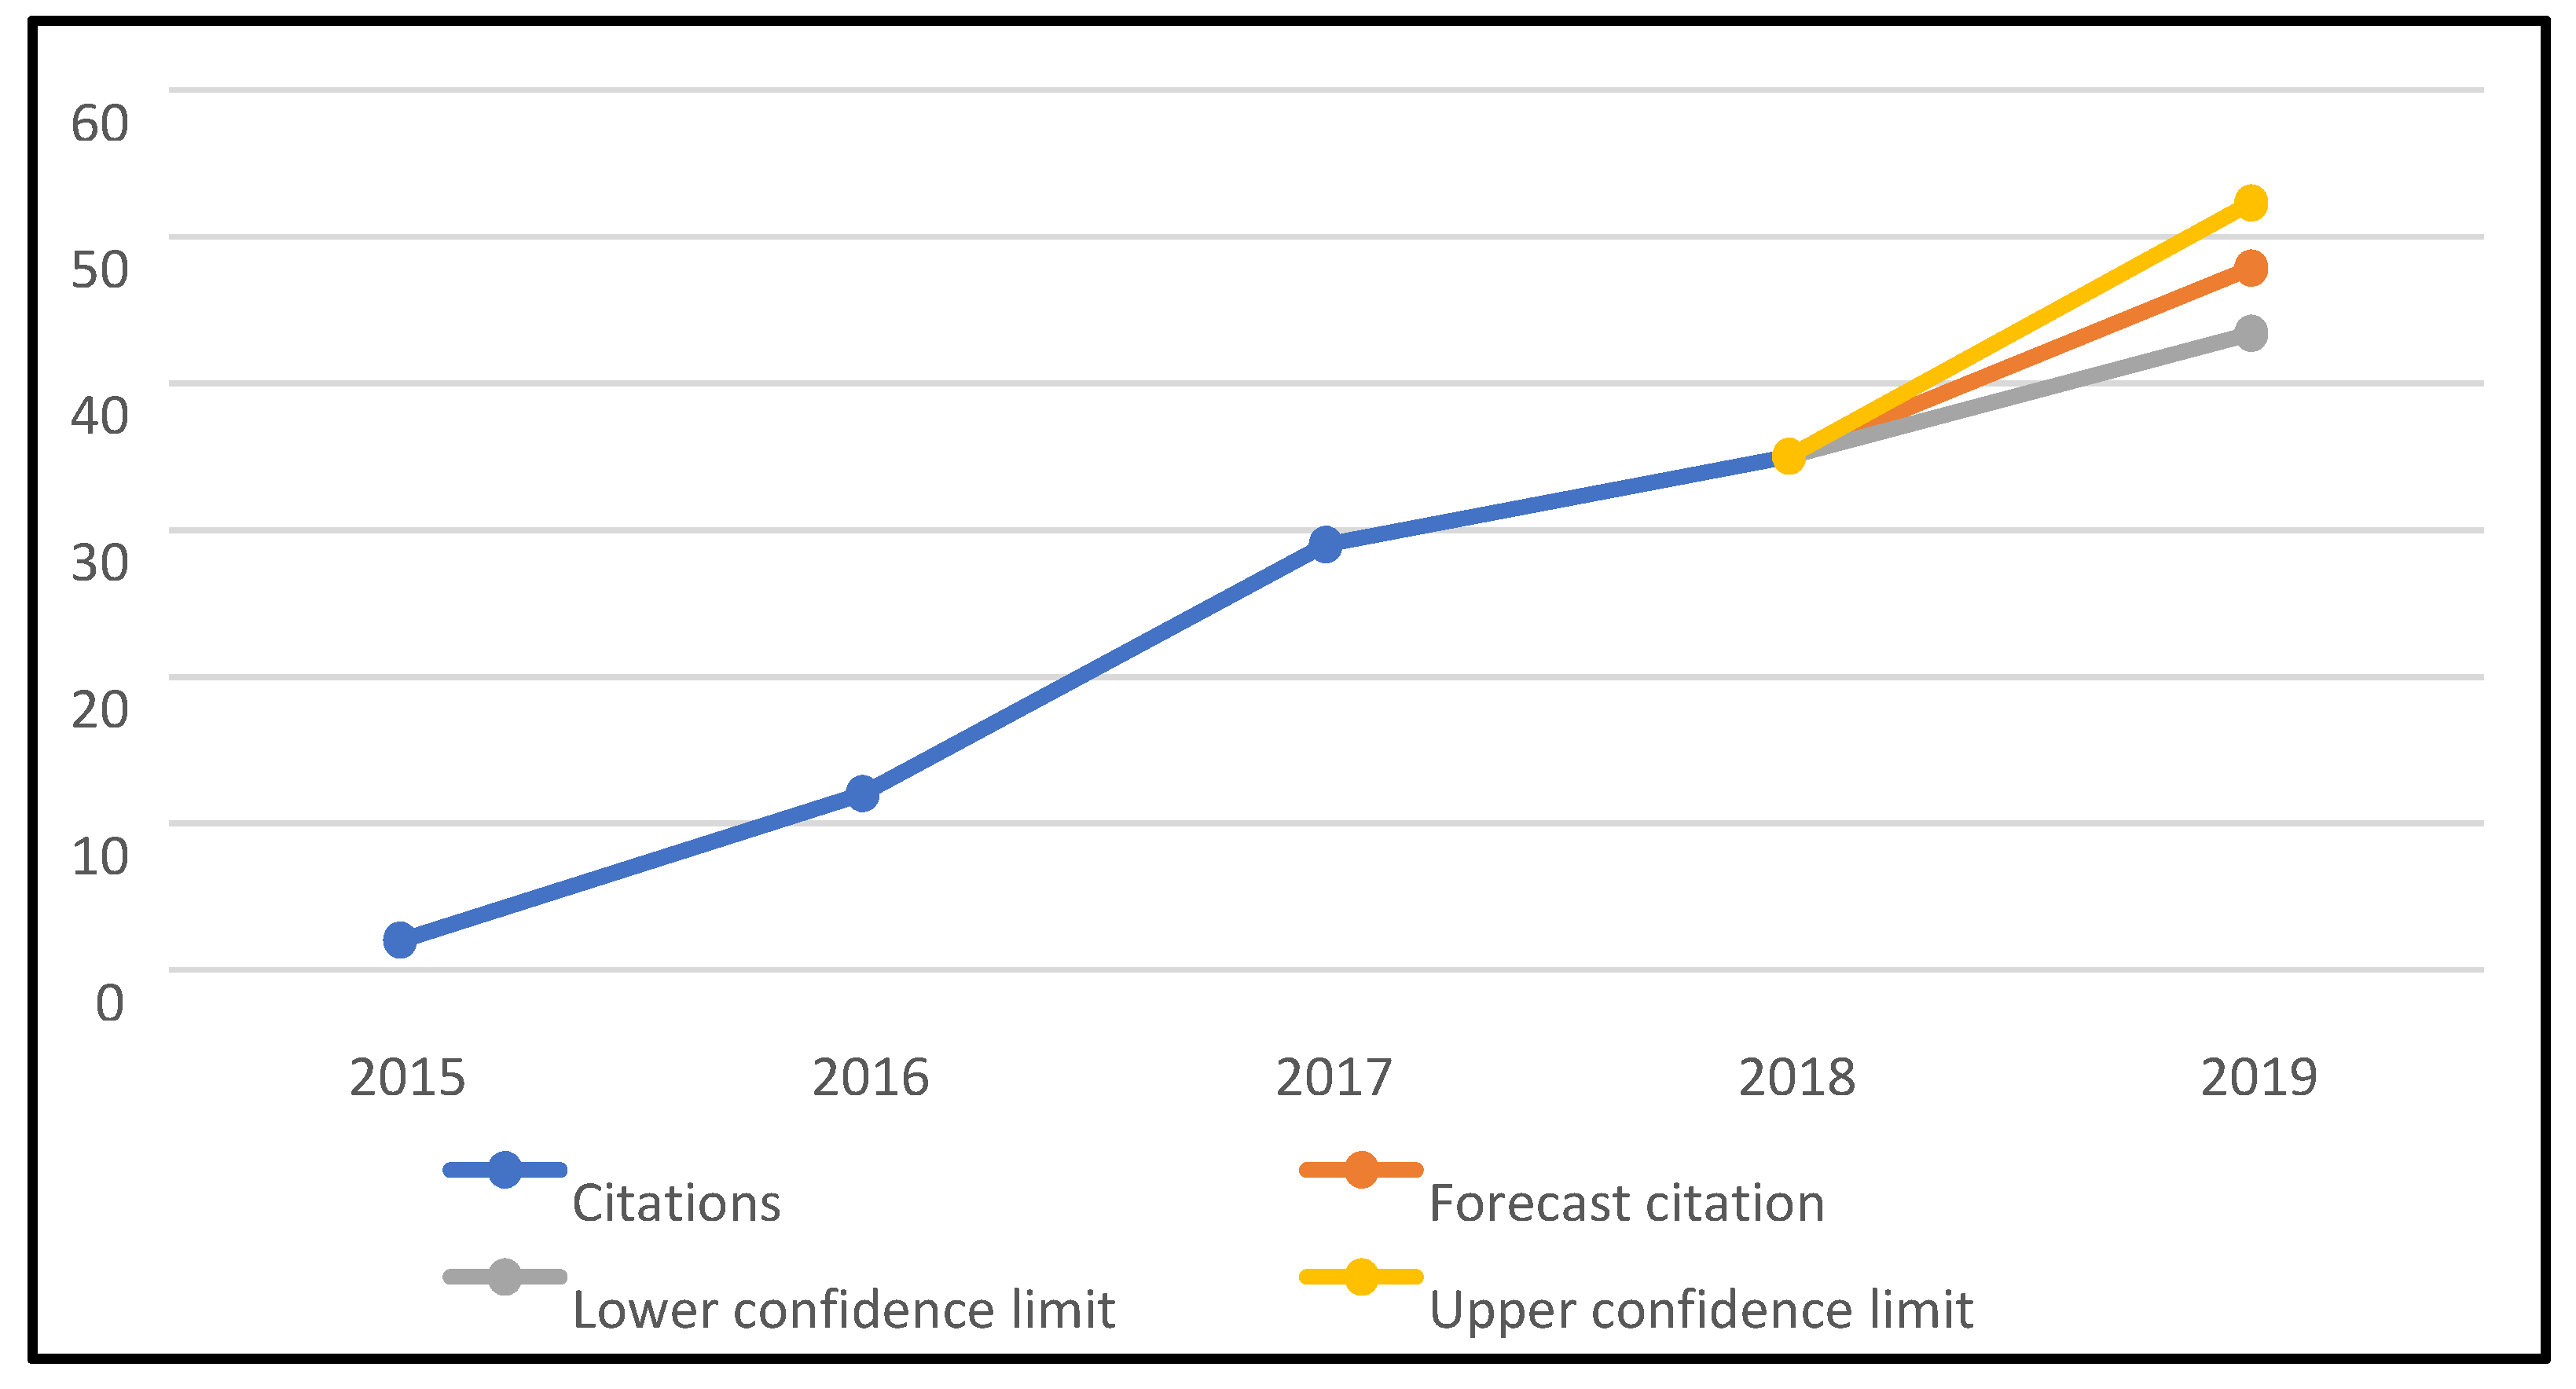
4.1. Initial Results
4.2. Author Influence
4.3. Affiliation Statistics
4.4. Analysis by Institution
4.5. Citation Analysis
4.6. H-index
4.7. Sources Analysis
- i.
- CiteScore: Measures the average number of citations received per document published in the journal. Values are calculated by counting citations over a year for documents published in the three years prior to the calculation and dividing by the number of documents published in those three years. As a comparative reference to the results shown in Table 4, the best score for the year 2018 was 160.19 and the average value was 1.6337.
- ii.
- Impact Factor: This is another widely used impact meter. The difference with respect to the previous one is that, instead of taking the publications of the three previous years, it does it with a time range of two years. The best score for 2018 was 244.585.
- iii.
- Source Normalized Impact per Paper (SNIP): This index measures the impact of citations in a given context. It is based on total citations per field of study. The impact of a citation has a greater value in fields where citations are less likely to occur. The best score for 2018 was 100.014 and the average value was 0.8566.
- iv.
- SCImago Journal Rank (SJR): This measure takes into consideration the prestige of the journal in which the article is published. It uses an algorithm similar to Google to establish rankings between websites. It also takes into account the citations of the article. The best score for 2018 was 72.576 and the average value 0.7244.
4.8. Data Clustering Using Content Analysis
- Applied research: This category includes all the articles whose objective is to develop a framework, model, or system that can be used in some practical context to solve a problem that has been detected. The proposal is validated through its application to a case study.
- Diagnosis: This category encompasses articles that perform a purely theoretical analysis of the status or evolution of a given theme or area of study. The most influential elements are identified and possible future evolutions, patterns, principles, etc., are established.
- Bibliographic study. This category includes articles that perform a review of the published literature that addresses a subject or area in question (usually bounded by keywords). Among other aspects, the number of published articles and their impact and trends over time are analysed. In addition, it also identifies the elements in which more interest is shown and knowledge gaps. The ultimate goal is to give a complete diagnosis of the state of the art in order to influence the trends detected.
- Impact analysis. This category includes articles that analyse the impact that an element has on a real phenomenon. It is a practical application focused on a specific case. The impact referred to is evaluated and contrasted with data and conclusions are drawn based on the results.
- Theoretical postulate: This category includes articles that revolve around the argumentation and foundation of a theoretical proposal that does not constitute a framework for practical application, but instead moves in the field of principles, foundations, and relevant elements linked to an area of study or a phenomenon. No concrete proposal is made that has any practical application.
- Specific solutions. This category comprises articles that present a practical solution to a very specific problem. Apart from explaining the main points of the proposed solution, its functionality is contrasted with real case studies. Within this framework, different programming models, algorithms, or indicators can be found.
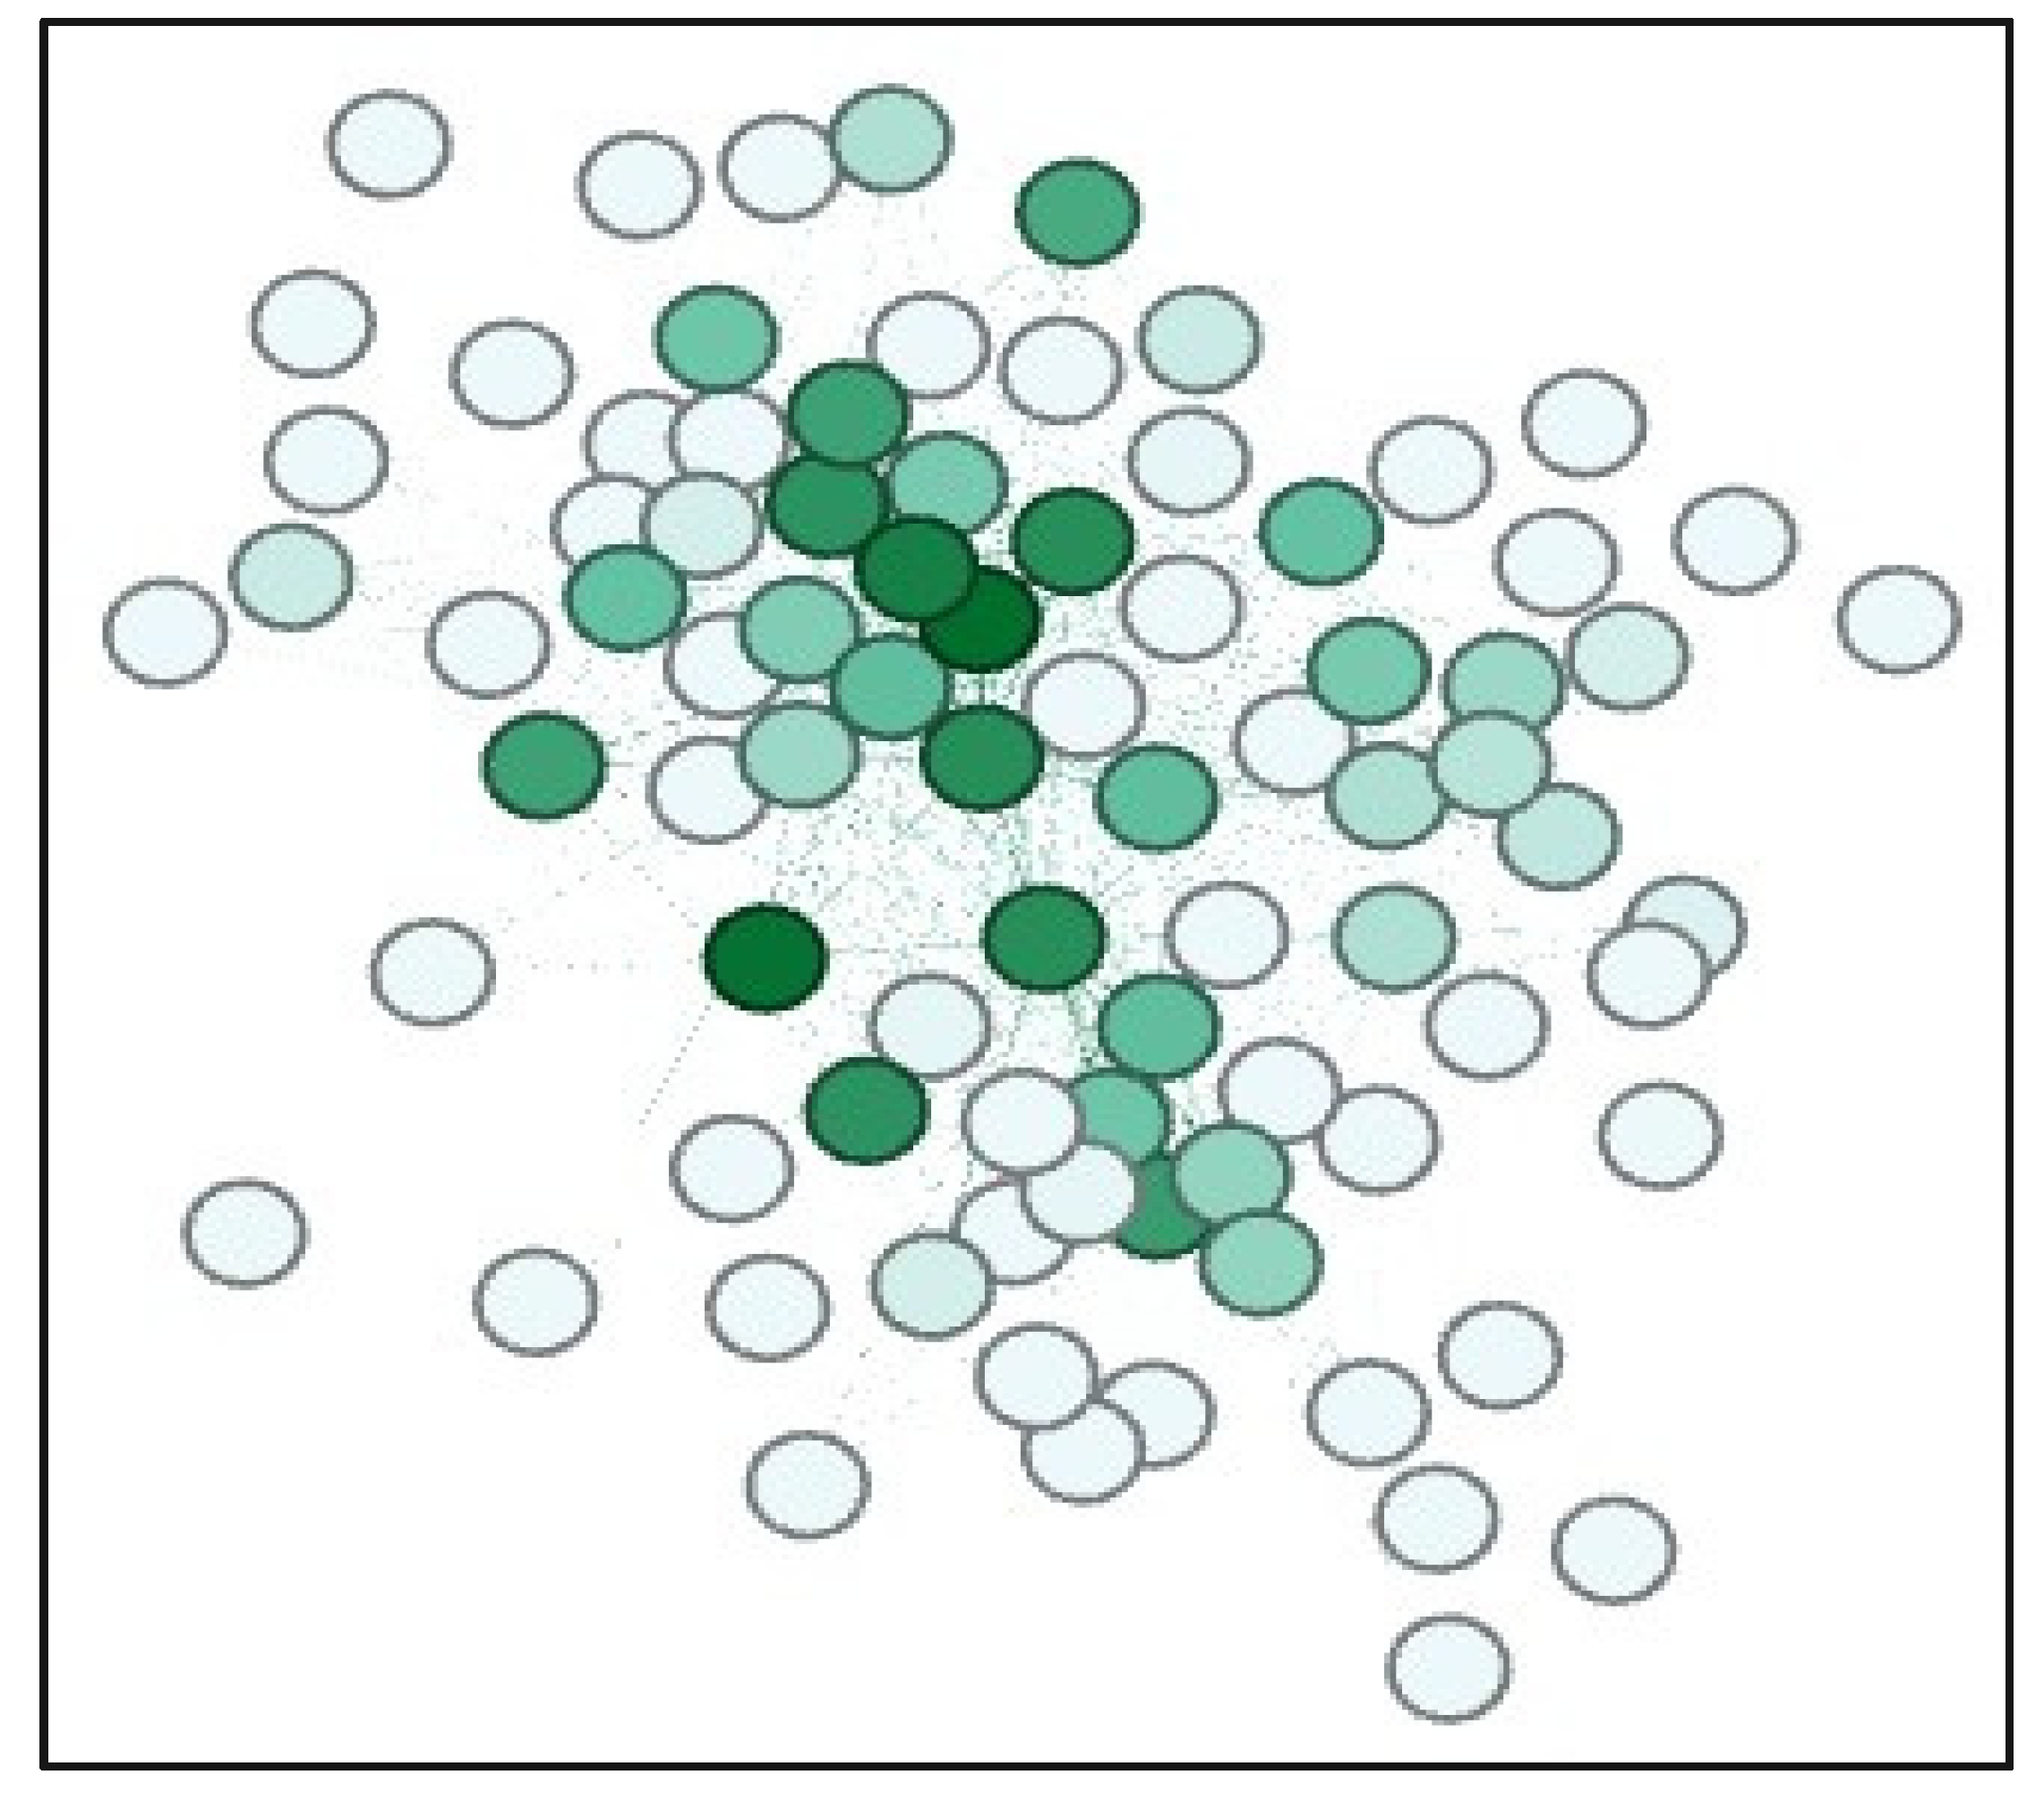
4.9. Network Analysis: Gephi
5. Discussion
5.1. Contributions to Theory
5.2. Contributions to Managerial Practice
6. Conclusions
Author Contributions
Conflicts of Interest
Appendix A
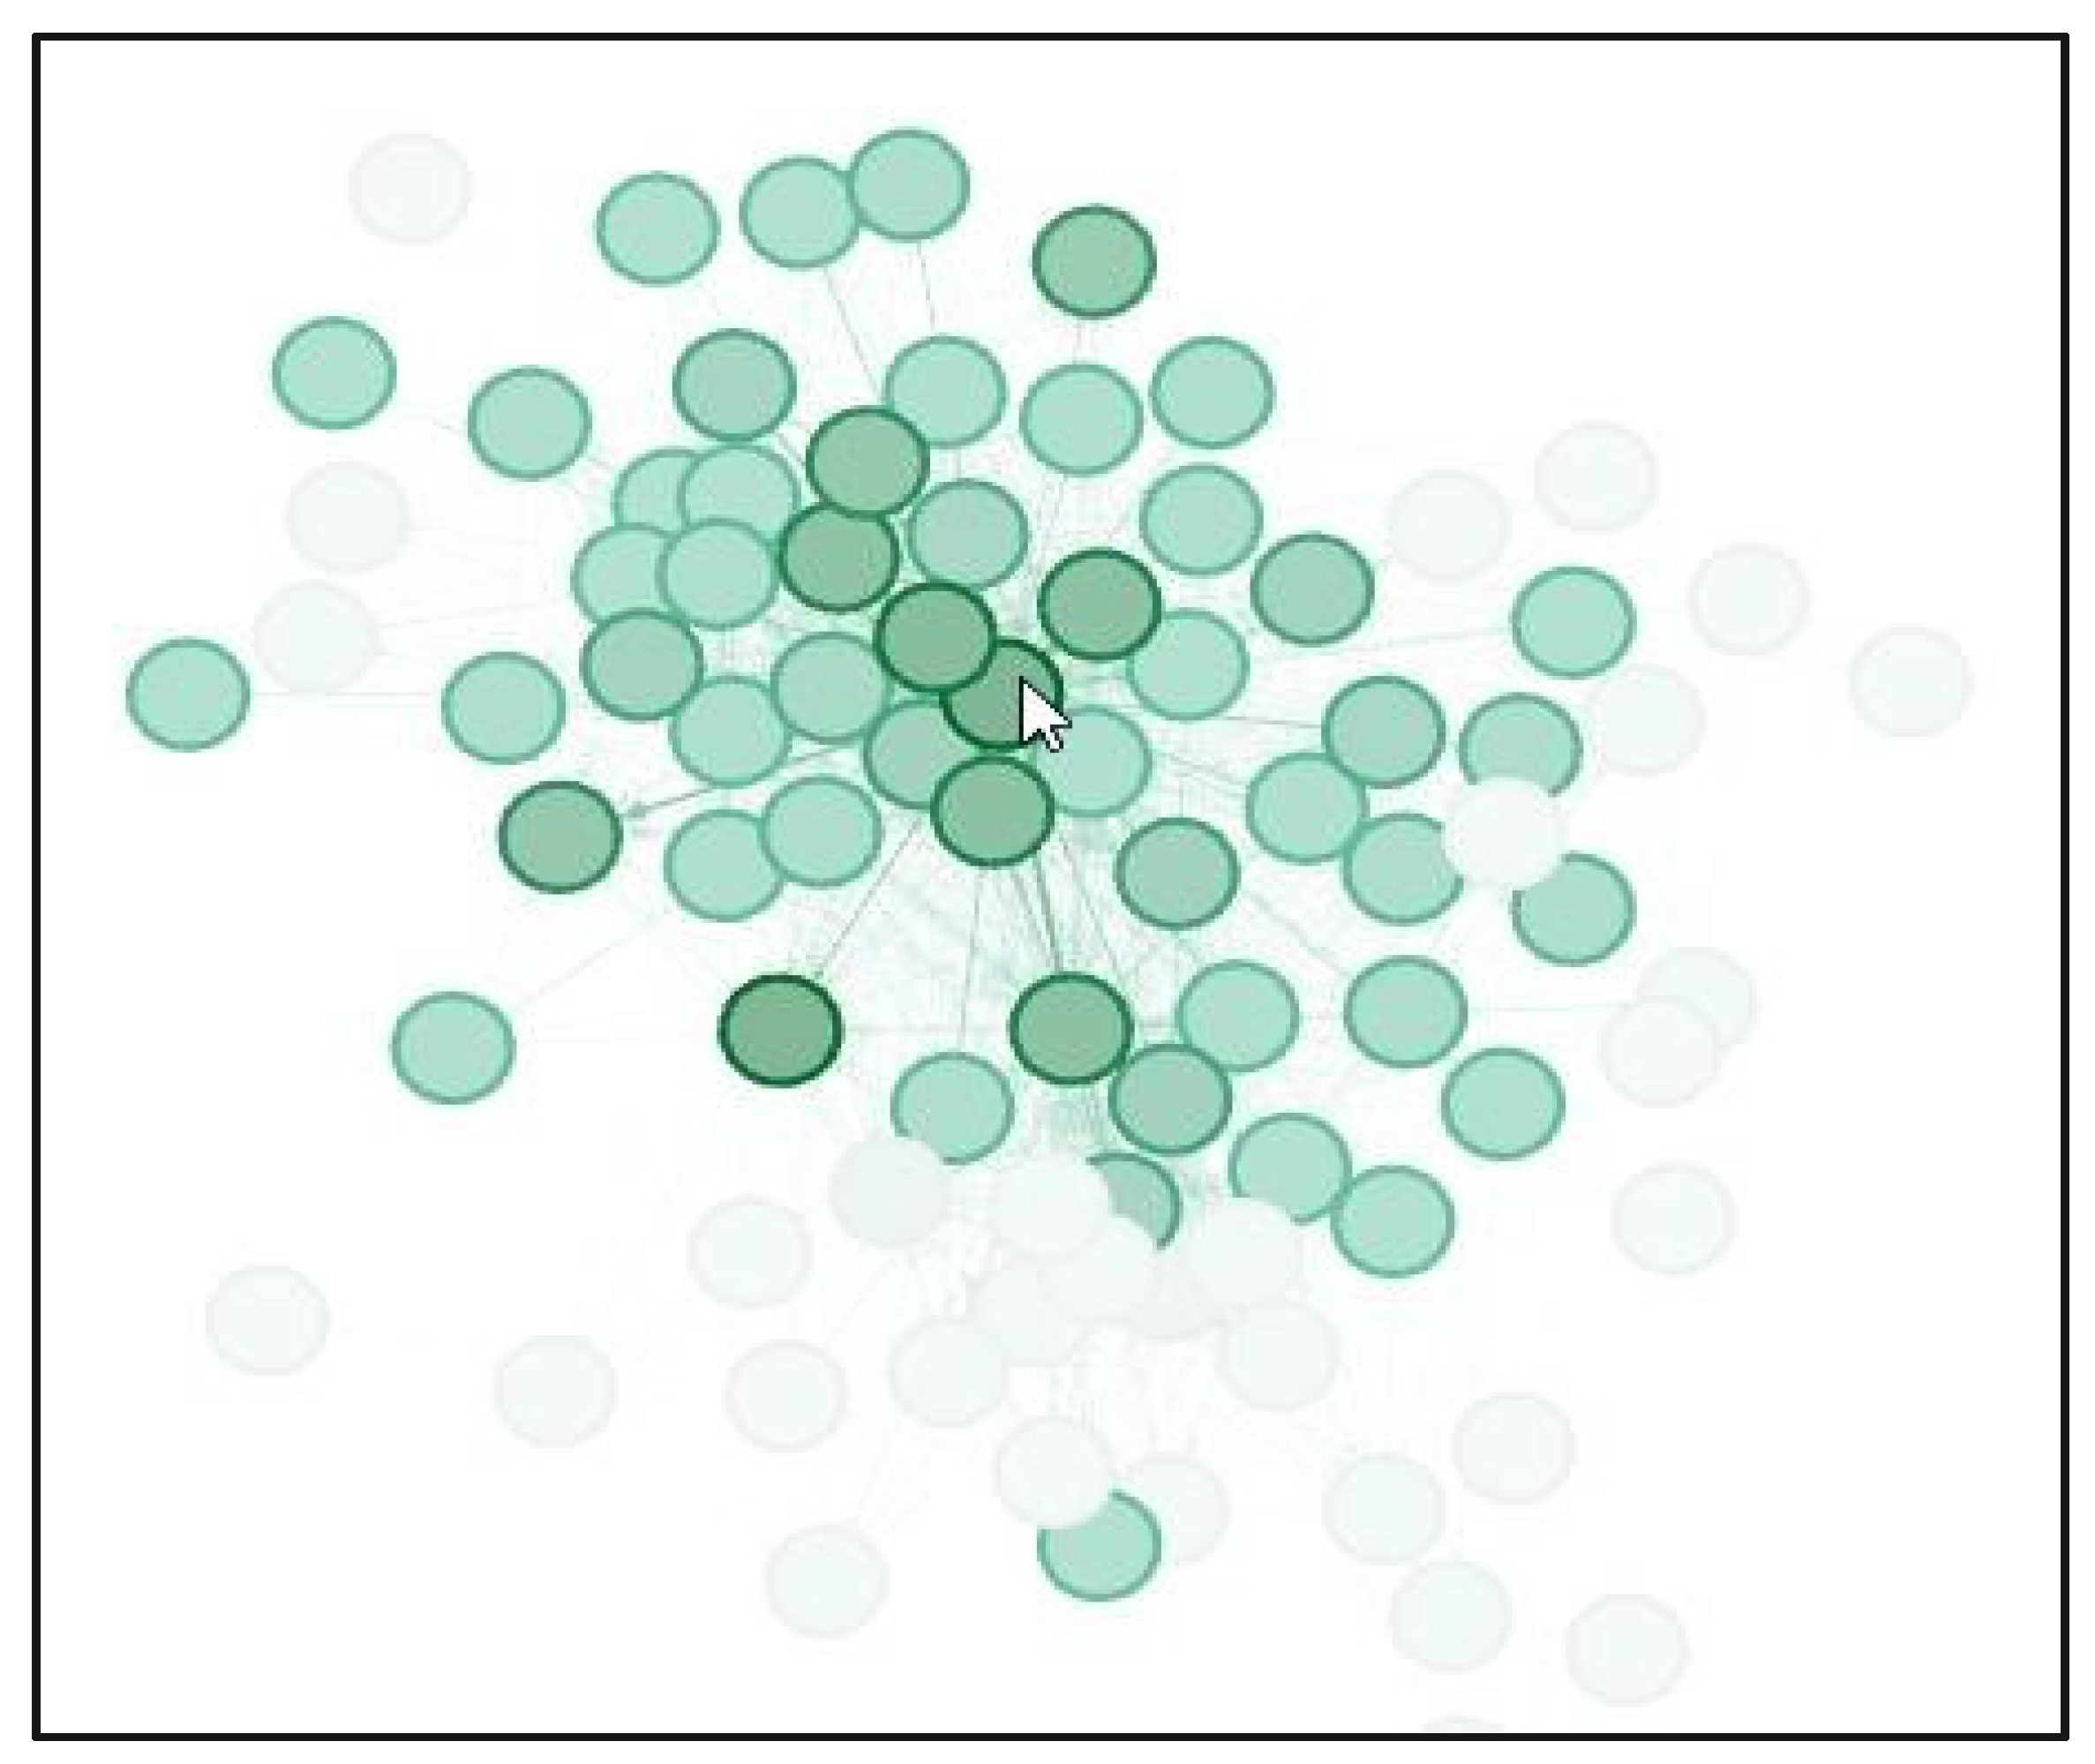
Appendix A.1. Network Analysis: Gephi
Appendix A.1.1. Initial Analysis


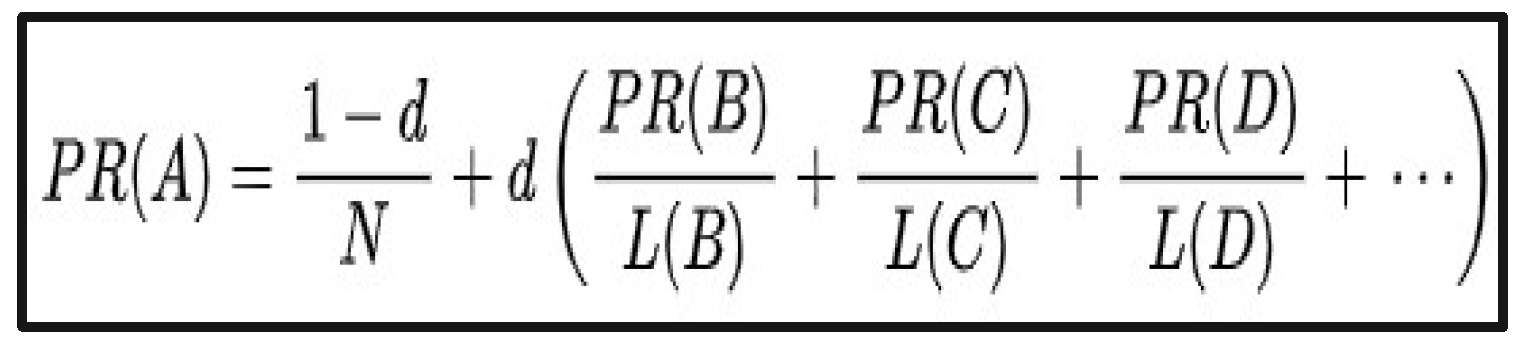
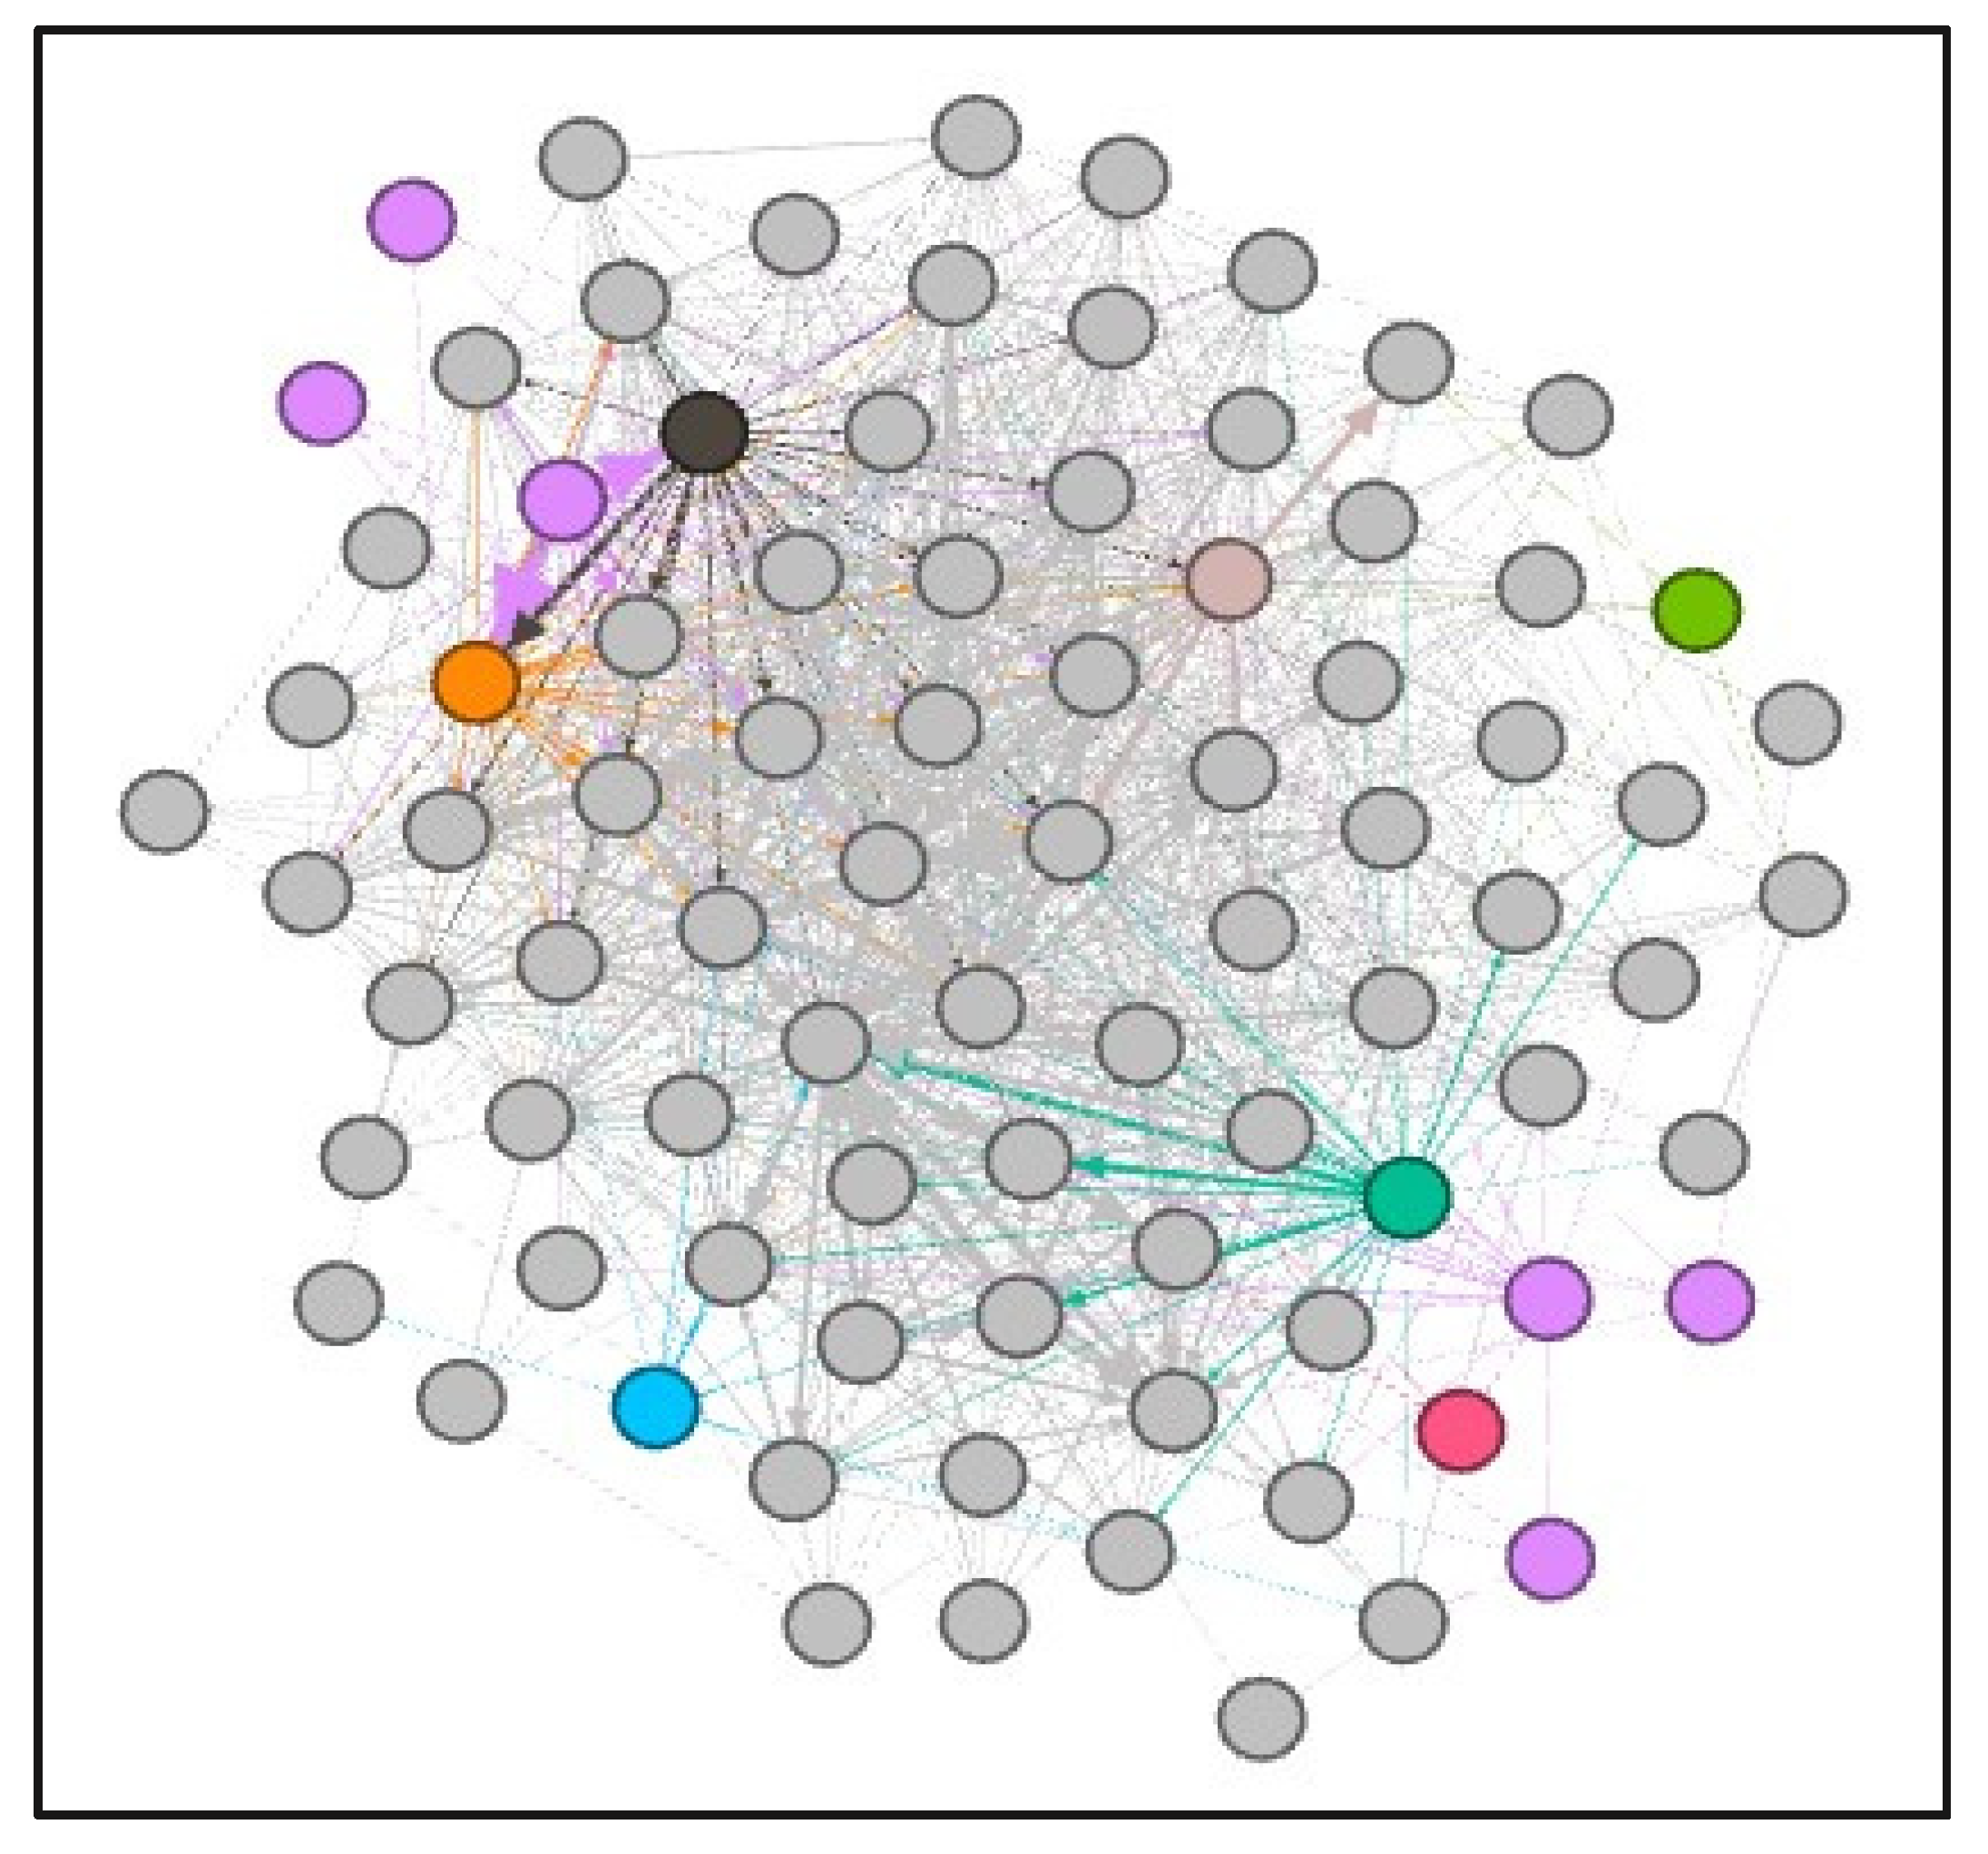
Appendix A.1.2. PageRank


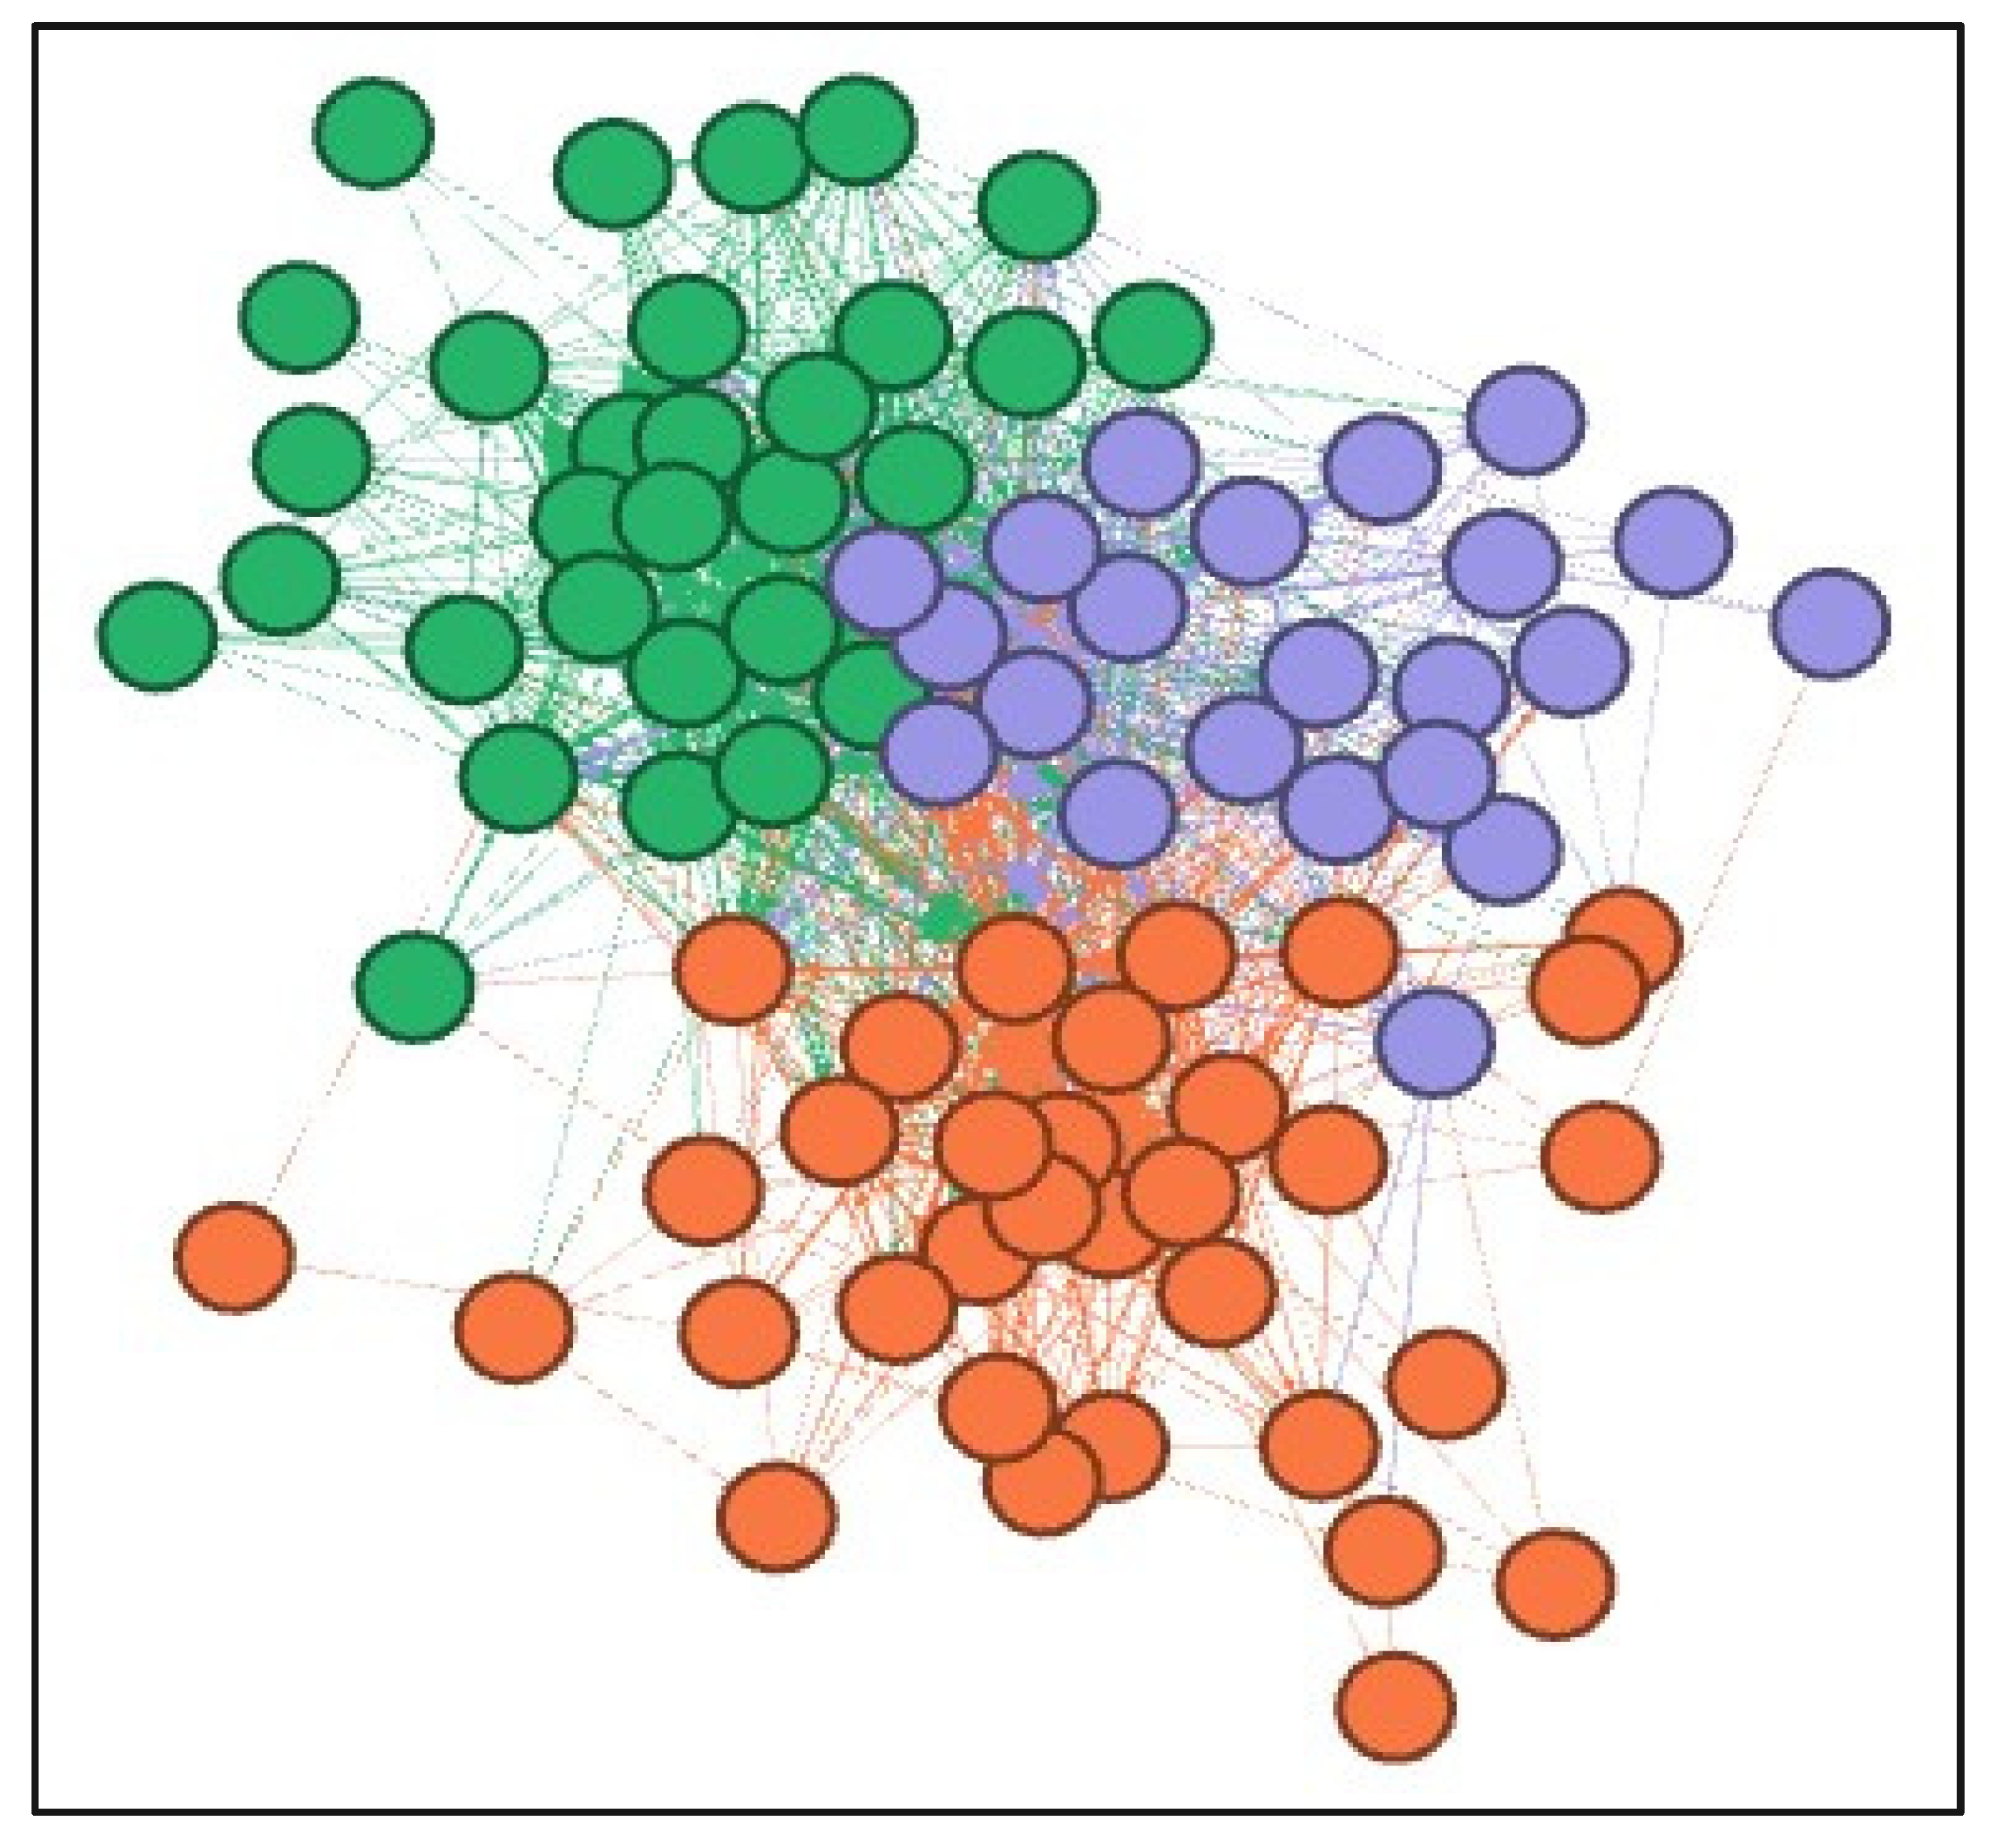
Appendix A.1.3. Data Clustering Using Gephi

References
- Ortiz, O.; Castells, F.; Sonnemann, G. Sustainability in the construction industry: A review of recent developments based on LCA. Constr. Build. Mater. 2009, 23, 28–39. [Google Scholar] [CrossRef]
- Maes, M.J.A.; Jones, G.; Toledano, M.B.; Milligan, B. Mapping synergies and trade-offs between urban ecosystems and the sustainable development goals. Environ. Sci. Policy 2019, 93, 181–188. [Google Scholar] [CrossRef]
- Azevedo, S.G.; Cruz-Machado, V.; Carvalho, H.; Duarte, S. Influence of Green and Lean Upstream Supply Chain Management Practices on Business Sustainability. IEEE Trans. Eng. Manag. 2012, 59, 753–765. [Google Scholar] [CrossRef]
- Srivastava, S.M. Green supply-chain management: A state-of-the-art literature review. Int. J. Manag. Rev. 2007, 9, 53–80. [Google Scholar] [CrossRef]
- Pagell, M.; Shevchenko, A. Why Research in Sustainable Supply Chain Management Should Have no Future. J. Supply Chain Manag. 2014, 50, 44–55. [Google Scholar] [CrossRef]
- Luthra, S.; Mangla, S.K. Evaluating challenges to Industry 4.0 initiatives for supply chain sustainability in emerging economies. Process. Saf. Environ. Prot. 2018, 117, 168–179. [Google Scholar] [CrossRef]
- Rejikumar, G.; Raja, V.; Arunprasad, P.; Jinil, P.; Sreeraj, K.M. Industry 4.0: Key findings and analysis from the literature arena. Benchmarking Int. J. 2019, 26, 2514–2542. [Google Scholar]
- Stock, T.; Seliger, G. Opportunities of sustainable manufacturing in Industry 4.0. Procedia CIRP 2016, 40, 536–541. [Google Scholar] [CrossRef]
- Wang, G.; Gunasekaran, A.; Ngai, E.W.; Papadopoulos, T. Big data analytics in logistics and supply chain management: Certain investigations for research and applications. Int. J. Prod. Econ. 2016, 176, 98–110. [Google Scholar] [CrossRef]
- Dubey, R.; Gunasekaran, A.; Childe, S.J.; Papadopoulos, T.; Helo, P. Supplier relationship management for circular economy. Manag. Decis. 2019, 57, 767–790. [Google Scholar] [CrossRef]
- Witkowski, K. Internet of Things, Big Data, Industry 4.0 – Innovative Solutions in Logistics and Supply Chains Management. Procedia Eng. 2017, 182, 763–769. [Google Scholar] [CrossRef]
- Jabbour, A.B.L.D.S.; Jabbour, C.J.C.; Filho, M.G.; Roubaud, D. Industry 4.0 and the circular economy: A proposed research agenda and original roadmap for sustainable operations. Ann. Oper. Res. 2018, 270, 273–286. [Google Scholar]
- Hazen, B.; Skipper, J.B.; Ezell, J.D.; Boone, C.A. Big data and predictive analytics for supply chain sustainability: A theory-driven research agenda. Comput. Ind. Eng. 2016, 101, 592–598. [Google Scholar] [CrossRef]
- Gosling, J.; Jia, F.; Gong, Y.; Brown, S. The role of supply chain leadership in the learning of sustainable practice: Toward an integrated framework. J. Clean. Prod. 2017, 140, 239–250. [Google Scholar] [CrossRef]
- Kamble, S.S.; Gunasekaran, A.; Gawankar, S.A. Sustainable Industry 4.0 framework: A systematic literature review identifying the current trends and future perspectives. Process. Saf. Environ. Prot. 2018, 117, 408–425. [Google Scholar] [CrossRef]
- Mani, V.; Delgado, C.; Hazen, B.; Patel, P. Mitigating Supply Chain Risk via Sustainability Using Big Data Analytics: Evidence from the Manufacturing Supply Chain. Sustainability 2017, 9, 608. [Google Scholar] [CrossRef]
- Rowley, J.; Slack, F. Conducting a literature review. Manag. Res. News 2004, 27, 31–39. [Google Scholar] [CrossRef]
- Wohlin, C. Guidelines for snowballing in systematic literature studies and a replication in software engineering. In Proceedings of the 18th International Conference on Evaluation and Assessment in Software Engineering, London, UK, 13–14 May 2014. [Google Scholar]
- Mishra, D.; Gunasekaran, A.; Papadopoulos, T.; Childe, S.J. Big Data and supply chain management: A review and bibliometric analysis. Ann. Oper. Res. 2016, 270, 313–336. [Google Scholar] [CrossRef]
- Collier, D. The Comparative Method. Political Science: The State Of Discipline Ii; Finifter, A.E., Ed.; American Political Science Association: Washington, DC, USA, 1993. [Google Scholar]
- Mentzer, J.T.; DeWitt, W.; Keebler, J.S.; Min, S.; Nix, N.W.; Smith, C.D.; Zacharia, Z.G. DEFINING SUPPLY CHAIN MANAGEMENT. J. Bus. Logist. 2001, 22, 1–25. [Google Scholar] [CrossRef]
- Tan, K.C.; Lyman, S.B.; Wisner, J.D. Supply chain management: A strategic perspective. Int. J. Oper. Prod. Manag. 2002, 22, 614–631. [Google Scholar]
- Otto, A.; Kotzab, H. Does supply chain management really pay? Six perspectives to measure the performance of managing a supply chain. Eur. J. Oper. Res. 2003, 144, 306–320. [Google Scholar] [CrossRef]
- Lummus, R.R.; Vokurka, R.J. Defining supply chain management: A historical perspective and practical guidelines. Ind. Manag. Data Syst. 1999, 99, 11–17. [Google Scholar] [CrossRef]
- Gruchmann, T.; Seuring, S. Explaining logistics social responsibility from a dynamic capabilities perspective. Int. J. Logist. Manag. 2018, 29, 1255–1278. [Google Scholar] [CrossRef]
- Rebs, T.; Brandenburg, M.; Seuring, S. System dynamics modeling for sustainable supply chain management: A literature review and systems thinking approach. J. Clean. Prod. 2019, 208, 1265–1280. [Google Scholar] [CrossRef]
- Hussain, M.; Ajmal, M.; Gunasekaran, A.; Khan, M. Exploration of social sustainability in healthcare supply chain. J. Clean. Prod. 2018, 203, 977–989. [Google Scholar] [CrossRef]
- Zimon, D.; Tyan, J.; Sroufe, R. DRIVERS OF SUSTAINABLE SUPPLY CHAIN MANAGEMENT: PRACTICES TO ALIGNMENT WITH UN SUSTAINABLE DEVELOPMENT GOALS. Int. J. Qual. Res. 2020, 14, 219–236. [Google Scholar] [CrossRef]
- Zimon, D.; Tyan, J.; Sroufe, R. Implementing Sustainable Supply Chain Management: Reactive, Cooperative, and Dynamic Models. Sustainability 2019, 11, 7227. [Google Scholar] [CrossRef]
- Gharaei, A.; Karimi, M.; Shekarabi, S.A.H. An integrated multi-product, multi-buyer supply chain under penalty, green, and quality control polices and a vendor managed inventory with consignment stock agreement: The outer approximation with equality relaxation and augmented penalty algorithm. Appl. Math. Model. 2019, 69, 223–254. [Google Scholar] [CrossRef]
- Hao, Y.; Helo, P.; Shamsuzzoha, A. Virtual factory system design and implementation: Integrated sustainable manufacturing. Int. J. Syst. Sci. Oper. Logist. 2016, 5, 116–132. [Google Scholar] [CrossRef]
- Izadikhah, M.; Saen, R.F. Assessing sustainability of supply chains by chance-constrained two-stage DEA model in the presence of undesirable factors. Comput. Oper. Res. 2018, 100, 343–367. [Google Scholar] [CrossRef]
- Tajbakhsh, A.; Hassini, E. A data envelopment analysis approach to evaluate sustainability in supply chain networks. J. Clean. Prod. 2015, 105, 74–85. [Google Scholar] [CrossRef]
- Ansari, Z.N.; Kant, R. Exploring the Framework Development Status for Sustainability in Supply Chain Management: A Systematic Literature Synthesis and Future Research Directions. Bus. Strat. Environ. 2017, 26, 873–892. [Google Scholar] [CrossRef]
- Adolph, L. German Standardization Roadmap: Industry 4.0, Version 2; DKE Deutsche Kommission Elektrotechnik Elektronik Informationstechnik in DIN und VDE: Berlin, Germany, 2016. [Google Scholar]
- Nagy, J.; Oláh, J.; Erdei, E.; Máté, D.; Popp, J. The role and impact of Industry 4.0 and the internet of things on the business strategy of the value chain—the case of Hungary. Sustainability 2018, 10, 3491. [Google Scholar] [CrossRef]
- Plattform Industrie 4.0. Industrie 4.0 Whitepaper FuE-Themen; Plattform Industrie: Berlin, Germany, 2015. [Google Scholar]
- Martínez-Olvera, C.; Mora-Vargas, J. A Comprehensive Framework for the Analysis of Industry 4.0 Value Domains. Sustainability 2019, 11, 2960. [Google Scholar] [CrossRef]
- Birkel, H.S.; Veile, J.W.; Müller, J.M.; Hartmann, E.; Voigt, K.I. Development of a risk framework for Industry 4.0 in the context of sustainability for established manufacturers. Sustainability 2019, 11, 384. [Google Scholar] [CrossRef]
- Lin, K.; Shyu, J.; Ding, K. A cross-strait comparison of innovation policy under industry 4.0 and sustainability development transition. Sustainability 2017, 9, 786. [Google Scholar] [CrossRef]
- Thomas, A.; Haven-Tang, C.; Barton, R.; Mason-Jones, R.; Francis, M.; Byard, P. Smart Systems Implementation in UK Food Manufacturing Companies: A Sustainability Perspective. Sustainability 2018, 10, 4693. [Google Scholar] [CrossRef]
- Varela, L.; Araújo, A.; Ávila, P.; Castro, H.; Putnik, G. Evaluation of the Relation between Lean Manufacturing, Industry 4.0, and Sustainability. Sustainability 2019, 11, 1439. [Google Scholar] [CrossRef]
- Carvalho, N.G.P.; Chaim, O.; Cazarini, E.; Gerolamo, M. Manufacturing in the fourth industrial revolution: A positive prospect in Sustainable Manufacturing. Procedia Manuf. 2018, 21, 671–678. [Google Scholar] [CrossRef]
- Flouris, I.; Giatrakos, N.; Deligiannakis, A.; Garofalakis, M.; Kamp, M.; Mock, M. Issues in complex event processing: Status and prospects in the Big Data era. J. Syst. Softw. 2017, 127, 217–236. [Google Scholar] [CrossRef]
- Orenga-Roglá, S.; Chalmeta, R. Methodology for the Implementation of Knowledge Management Systems 2.0. Bus. Inf. Syst. Eng. 2017, 61, 195–213. [Google Scholar] [CrossRef]
- Orenga-Roglá, S.; Chalmeta, R. Framework for implementing a big data ecosystem in organizations. Commun. ACM 2018, 62, 58–65. [Google Scholar] [CrossRef]
- Shin, N.-H.; Choi, M.J. Ecological views of big data: Perspectives and issues. Telemat. Inform. 2015, 32, 311–320. [Google Scholar] [CrossRef]
- Dubey, R.; Gunasekaran, A.; Papadopoulos, T.; Childe, S.J.; Shibin, K.T.; Wamba, S.F. Sustainable supply chain management: Framework and further research directions. J. Clean. Prod. 2017, 142, 1119–1130. [Google Scholar] [CrossRef]
- De, A.; Wang, J.; Tiwari, M. Hybridizing Basic Variable Neighbourhood Search with Particle Swarm Optimization for Solving Sustainable Ship Routing and Bunker Management Problem. In Proceedings of the IEEE Transactions on Intelligent Transportation Systems, Auckland, New Zealand, 27–30 October 2019. [Google Scholar]
- De, A.; Choudhary, A.; Tiwari, M.K. Multiobjective Approach for Sustainable Ship Routing and Scheduling With Draft Restrictions. IEEE Trans. Eng. Manag. 2017, 66, 35–51. [Google Scholar] [CrossRef]
- Chen, L.; Jia, G. Environmental efficiency analysis of China’s regional industry: A data envelopment analysis (DEA) based approach. J. Clean. Prod. 2017, 142, 846–853. [Google Scholar] [CrossRef]
- Mongeon, P.; Paul-Hus, A. The journal coverage of Web of Science and Scopus: A comparative analysis. Scientometrics 2016, 106, 213–228. [Google Scholar] [CrossRef]
- Brin, S.; Page, L. The anatomy of a large-scale hypertextual Web search engine. Comput. Networks ISDN Syst. 1998, 30, 107–117. [Google Scholar] [CrossRef]
- Ma, N.; Guan, J.C.; Zhao, Y. Bringing PageRank to the citation analysis. Inf. Process. Manag. 2008, 44, 800–810. [Google Scholar] [CrossRef]
- Shrouf, F.; Ordieres, J.; Miragliotta, G. Smart factories in Industry 4.0: A review of the concept and of energy Management Approached in Production Based on the Internet of Things paradigm. In Proceedings of the 2014 IEEE International Conference on Industrial Engineering and Engineering Management, Selangor Darul Ehsan, Malaysia, 9–12 December 2014; pp. 697–701. [Google Scholar]
- Chae, B. (Kevin) Insights from hashtag #supplychain and Twitter Analytics: Considering Twitter and Twitter data for supply chain practice and research. Int. J. Prod. Econ. 2015, 165, 247–259. [Google Scholar]
- Dubey, R.; Gunasekaran, A.; Childe, S.J.; Wamba, S.F.; Papadopoulos, T. The impact of big data on world-class sustainable manufacturing. Int. J. Adv. Manuf. Technol. 2015, 84, 631–645. [Google Scholar] [CrossRef]
- Zhang, Y.; Ren, S.; Liu, Y.; Si, S. A big data analytics architecture for cleaner manufacturing and maintenance processes of complex products. J. Clean. Prod. 2017, 142, 626–641. [Google Scholar] [CrossRef]
- Papadopoulos, T.; Gunasekaran, A.; Dubey, R.; Altay, N.; Childe, S.J.; Wamba, S.F. The role of Big Data in explaining disaster resilience in supply chains for sustainability. J. Clean. Prod. 2017, 142, 1108–1118. [Google Scholar] [CrossRef]
- Zhao, R.; Liu, Y.; Zhang, N.; Huang, T. An optimization model for green supply chain management by using a big data analytic approach. J. Clean. Prod. 2017, 142, 1085–1097. [Google Scholar] [CrossRef]
- Wu, K.-J.; Liao, C.-J.; Tseng, M.-L.; Lim, M.K.; Hu, J.; Tan, K.H. Toward sustainability: Using big data to explore the decisive attributes of supply chain risks and uncertainties. J. Clean. Prod. 2017, 142, 663–676. [Google Scholar] [CrossRef]
- Fawcett, S.E.; Waller, M. Supply Chain Game Changers-Mega, Nano, and Virtual Trends-And Forces That Impede Supply Chain Design (i.e., Building a Winning Team). J. Bus. Logist. 2014, 35, 157–164. [Google Scholar] [CrossRef]
- Rehman, M.H.U.; Chang, V.; Batool, A.; Wah, T.Y. Big data reduction framework for value creation in sustainable enterprises. Int. J. Inf. Manag. 2016, 36, 917–928. [Google Scholar] [CrossRef]
- Hirsch, J.E. An index to quantify an individual’s scientific research output. Proc. Natl. Acad. Sci. USA 2005, 102, 16569–16572. [Google Scholar] [CrossRef]
- Smith, K.M.; Crookes, E.; Crookes, P.A. Measuring research ‘impact’ for academic promotion: Issues from the literature. J. High. Educ. Policy Manag. 2013, 35, 410–420. [Google Scholar] [CrossRef]
- Sanders, A.; Elangeswaran, C.; Wulfsberg, J. Industry 4.0 implies lean manufacturing: Research activities in industry 4.0 function as enablers for lean manufacturing. J. Ind. Eng. Manag. 2016, 9, 811. [Google Scholar] [CrossRef]
- Song, M.; Cen, L.; Zheng, Z.; Fisher, R.; Liang, X.; Wang, Y.; Huisingh, D. How would big data support societal development and environmental sustainability? Insights and practices. J. Clean. Prod. 2017, 142, 489–500. [Google Scholar] [CrossRef]
- Kusiak, A. Smart manufacturing. Int. J. Prod. Res. 2017, 56, 508–517. [Google Scholar] [CrossRef]
- Cerchione, R.; Esposito, E. A systematic review of supply chain knowledge management research: State of the art and research opportunities. Int. J. Prod. Econ. 2016, 182, 276–292. [Google Scholar] [CrossRef]
- Tiwari, S.; Wee, H.; Daryanto, Y. Big data analytics in supply chain management between 2010 and 2016: Insights to industries. Comput. Ind. Eng. 2018, 115, 319–330. [Google Scholar] [CrossRef]
- Kuo, T.C.; Smith, S. A systematic review of technologies involving eco-innovation for enterprises moving towards sustainability. J. Clean. Prod. 2018, 192, 207–220. [Google Scholar] [CrossRef]
- Zhong, R.Y.; Xu, C.; Chen, C.; Huang, G.Q. Big Data Analytics for Physical Internet-based intelligent manufacturing shop floors. Int. J. Prod. Res. 2015, 55, 2610–2621. [Google Scholar] [CrossRef]
- Rodriguez, L.; Da Cunha, C. Impacts of Big Data analytics and absorptive capacity on sustainable supply chain innovation: A conceptual framework. LogForum. 2018, 14, 151–161. [Google Scholar] [CrossRef]
- Hopkins, J.; Hawking, P. Big Data Analytics and IoT in logistics: A case study. Int. J. Logist. Manag. 2018, 29, 575–591. [Google Scholar] [CrossRef]
- Richey, R.G.; Morgan, T.R.; Lindsey-Hall, K.; Adams, F.G. A global exploration of Big Data in the supply chain. Int. J. Phys. Distrib. Logist. Manag. 2016, 46, 710–739. [Google Scholar] [CrossRef]
- Jensen, J.; Remmen, A. Enabling Circular Economy Through Product Stewardship. Procedia Manuf. 2017, 8, 377–384. [Google Scholar] [CrossRef]
- Liu, W.-K.; Yen, C.-C. Optimizing Bus Passenger Complaint Service through Big Data Analysis: Systematized Analysis for Improved Public Sector Management. Sustainability 2016, 8, 1319. [Google Scholar] [CrossRef]
- Keivanpour, S.; Kadi, D.A. Perspectives for application of the internet of things and Big Data analytics on end of life aircraft treatment. Int. J. Sustain. Aviat. 2018, 4, 202–220. [Google Scholar] [CrossRef]
- Hazen, B.; Boone, C.A.; Wang, Y.; Khor, K.S. Perceived quality of remanufactured products: Construct and measure development. J. Clean. Prod. 2017, 142, 716–726. [Google Scholar] [CrossRef]
- Badiezadeh, T.; Saen, R.F.; Samavati, T. Assessing sustainability of supply chains by double frontier network DEA: A big data approach. Comput. Oper. Res. 2018, 98, 284–290. [Google Scholar] [CrossRef]
- How, B.S.; Lam, H.L.; Shen, H.B.; Loong, L.H. Sustainability evaluation for biomass supply chain synthesis: Novel principal component analysis (PCA) aided optimisation approach. J. Clean. Prod. 2018, 189, 941–961. [Google Scholar] [CrossRef]
- Bányai, T.; Illés, B.; Bányai, Á. Smart Scheduling: An Integrated First Mile and Last Mile Supply Approach. Complexity 2018, 2018, 1–15. [Google Scholar]
- Malesios, C.; Psarakis, S. Comparison of the h-index for different fields of research using bootstrap methodology. Qual. Quant. 2012, 48, 521–545. [Google Scholar] [CrossRef][Green Version]
- Gani, A.; Siddiqa, A.; Shamshirband, S.; Hanum, F. A survey on indexing techniques for big data: Taxonomy and performance evaluation. Knowl. Inf. Syst. 2015, 46, 241–284. [Google Scholar] [CrossRef]
- Svensson, G. Aspects of sustainable supply chain management (SSCM): Conceptual framework and empirical example. Supply Chain Manag. Int. J. 2007, 12, 262–266. [Google Scholar] [CrossRef]
- Alfian, G.; Syafrudin, M.; Rhee, J. Real-Time Monitoring System Using Smartphone-Based Sensors and NoSQL Database for Perishable Supply Chain. Sustainability 2017, 9, 2073. [Google Scholar] [CrossRef]
- Ahearn, M.C.; Armbruster, W.; Young, R. Big Data’s Potential to Improve Food Supply Chain Environmental Sustainability and Food Safety. Int. Food Agribus. Manag. Rev. 2016, 19, 155–171. [Google Scholar]
- Akhtar, P.; Khan, Z.; Frynas, J.G.; Tse, Y.K.; Rao-Nicholson, R. Essential Micro-foundations for Contemporary Business Operations: Top Management Tangible Competencies, Relationship-based Business Networks and Environmental Sustainability. Br. J. Manag. 2017, 29, 43–62. [Google Scholar] [CrossRef]
- Ardito, L.; Petruzzelli, A.M.; Panniello, U.; Garavelli, A.C. Towards Industry 4.0: Mapping digital technologies for supply chain management-marketing integration. Bus. Process Manag. J. 2019, 25, 323–346. [Google Scholar] [CrossRef]
- Coble, K.H.; Mishra, A.K.; Ferrell, S.; Griffin, T. Big Data in Agriculture: A Challenge for the Future. Appl. Econ. Perspect. Policy 2018, 40, 79–96. [Google Scholar] [CrossRef]
- Ji, S.; Sun, Q. Low-Carbon Planning and Design in B&R Logistics Service: A Case Study of an E-Commerce Big Data Platform in China. Sustainability 2017, 9, 2052. [Google Scholar]
- Coşkun, S.; Polat, O.; Özgür, L. Analytic hierarchy process and data envelopment analysis methods based model proposal for improving supplier efficiencies and a case study. J. Mehmet Akif Ersoy Univ. Econ. Adm. Sci. Fac. 2019, 11672. [Google Scholar]
- Chen, R.-Y. Intelligent IoT-Enabled System in Green Supply Chain using Integrated FCM Method. Int. J. Bus. Anal. 2015, 2, 47–66. [Google Scholar] [CrossRef]
- Akhtar, P.; Khan, Z.; Rao-Nicholson, R.; Zhang, M. Building relationship innovation in global collaborative partnerships: Big data analytics and traditional organizational powers. R&D Manag. 2016, 49, 7–20. [Google Scholar]
- Akhtar, P.; Tse, Y.K.; Khan, Z.; Rao-Nicholson, R. Data-driven and adaptive leadership contributing to sustainability: Global agri-food supply chains connected with emerging markets. Int. J. Prod. Econ. 2016, 181, 392–401. [Google Scholar] [CrossRef]
- Blondel, V.; Guillaume, J.-L.; Lambiotte, R.; Lefebvre, É. Fast unfolding of communities in large networks. J. Stat. Mech. Theory Exp. 2008, 2008, P10008. [Google Scholar] [CrossRef]


| Author | Total Papers |
|---|---|
| Gunasekaran A. | 5 |
| Papadopoulos T. | 5 |
| Childe S.J. | 4 |
| Dubey R. | 4 |
| Hazen B.T. | 4 |
| Akhtar P. | 3 |
| Khan Z. | 3 |
| Liu Y. | 3 |
| Rao-Nicholson R. | 3 |
| Boone C.A. | 2 |
| Country | Total Papers |
|---|---|
| United States of America | 22 |
| United Kingdom | 21 |
| China | 18 |
| India | 10 |
| Taiwan | 7 |
| France | 6 |
| Finland | 5 |
| Germany | 4 |
| Brazil | 3 |
| Italy | 3 |
| Institution | Total Papers |
|---|---|
| University of Kent | 6 |
| University of Plymouth | 5 |
| University of Hull | 4 |
| University of Tennessee Knoxville | 4 |
| University of Tennessee System | 4 |
| California State University | 3 |
| Dalian University of Technology | 3 |
| Languedoc-Roussillon Universities | 3 |
| Montpellier Business School | 3 |
| Symbiosis International University | 3 |
| Paper | Total Citations |
|---|---|
| Wang, Gunasekaran, Ngai and Papadopoulos [9] | 158 |
| Shrouf, Ordieres and Miragliotta [55] | 123 |
| Chae [56] | 92 |
| Dubey, Gunasekaran, Childe, Wamba and Papadopoulos [57] | 77 |
| Zhang, Ren, Liu and Si [58] | 76 |
| Papadopoulos, Gunasekaran, Dubey, Altay, Childe and Fosso-Wamba [59] | 57 |
| Zhao, Liu, Zhang and Huang [60] | 53 |
| Wu, Liao, Tseng, Lim, Hu and Tan [61] | 52 |
| Fawcett and Waller [62] | 50 |
| Ur, Chang, Batool and Wah [63] | 44 |
| Journal | Total of Papers | CiteScore | Impact Factor | SNIP | SJR |
|---|---|---|---|---|---|
| Journal of Cleaner Production | 13 | 7.32 | 5.651 | 2.308 | 1.62 |
| Sustainability Journal | 10 | 3.01 | 2.592 | 1.169 | 0.55 |
| Computers Industrial Engineering | 4 | 4.68 | 3.518 | 1.755 | 1.334 |
| International Journal of Logistics Management | 4 | 3.28 | 2.226 | 1.134 | 0.871 |
| International Journal of Production Economics | 4 | 7.13 | 4.998 | 2.486 | 2.475 |
| Production Planning Control | 3 | 4.38 | 3.340 | 1.514 | 1.43 |
| International Journal of Production Research | 3 | 4.34 | 3.199 | 1.720 | 1.585 |
| Process Safety and Environmental Protection | 3 | 4.60 | 4.384 | 1.626 | 1.075 |
| Journal of Manufacturing Systems | 2 | 5.45 | 3.642 | 2.234 | 1.592 |
| International Journal of Physical Distribution Logistics Management | 2 | 6.60 | 5.212 | 2.109 | 2.41 |
| Categories | Papers | Top 5 Papers | Future Research Suggestions |
|---|---|---|---|
| Applied research | 26 | Shrouf, et al. [55]; Zhan et al. [58]; Dubey [57]; Zhao et al. [60]; Ur et al. [63] | To embrace Big Data Analytics to redefine the future focus of the advanced manufacturing technology in SSCM, considering new innovations as, for instance, developing new materials such as biodegradable materials |
| Diagnosis | 34 | Fawcett [62]; Wu et al. [61]; Sanders et al. [66]; Song et al. [67]; Kusiak [68] | Application-oriented research; Methodologies and tools to support managers to improve the efficiency and effectiveness of the decision-making process; To analyse the relationship between firms’ capabilities and Industry 4.0 and SSCM |
| Bibliographic study | 7 | Wang et al. [9]; Cerchione and Esposito [69]; Tiwari et al. [70]; Kamble et al. [15]; Kuo and Smith [71] | Collaboration between enterprises and academic researchers to develop new eco-innovative technologies to meet their specific needs; To analyse the factors affecting the adoption of knowledge management practices |
| Impact analysis | 7 | Papadopoulos et al. [59]; Zhong et al. [72]; Rodriguez and Da Cunha [73]; Mani et al. [16]; Hopkins and Hawking [74] | Guidance regarding how organizations might identify future versus present needs; To increase the number of case studies |
| Theoretical postulate | 5 | Lopes de Sousa et al. [12]; Richey et al. [75]; Jensen and Remmen [76]; Liu and Yen [77]; Keivanpour and Kadi [78] | To understand the connections, integration, and mutual benefit between environmentally sustainable manufacturing and Industry 4.0; The Key Success Factors must be developed by researchers, policy makers, and industrialists together; To carry out qualitative research and to convert the research postulates into hypotheses that should be tested through quantitative methods |
| Specific solutions | 8 | Chae [56]; Hazen et al. [79]; Badiezadeh et al. [80]; Shen and Lam [81]; Banyai et al. [82] | To understand social media and social media data in SSCM; To analyse behavioural and marketing-related issues; To analyse consumer perceptions of remanufactured products; To assess SSCM in the presence of fuzzy and stochastic data |
© 2020 by the authors. Licensee MDPI, Basel, Switzerland. This article is an open access article distributed under the terms and conditions of the Creative Commons Attribution (CC BY) license (http://creativecommons.org/licenses/by/4.0/).
Share and Cite
Chalmeta, R.; Santos-deLeón, N.J. Sustainable Supply Chain in the Era of Industry 4.0 and Big Data: A Systematic Analysis of Literature and Research. Sustainability 2020, 12, 4108. https://doi.org/10.3390/su12104108
Chalmeta R, Santos-deLeón NJ. Sustainable Supply Chain in the Era of Industry 4.0 and Big Data: A Systematic Analysis of Literature and Research. Sustainability. 2020; 12(10):4108. https://doi.org/10.3390/su12104108
Chicago/Turabian StyleChalmeta, Ricardo, and Nestor J. Santos-deLeón. 2020. "Sustainable Supply Chain in the Era of Industry 4.0 and Big Data: A Systematic Analysis of Literature and Research" Sustainability 12, no. 10: 4108. https://doi.org/10.3390/su12104108
APA StyleChalmeta, R., & Santos-deLeón, N. J. (2020). Sustainable Supply Chain in the Era of Industry 4.0 and Big Data: A Systematic Analysis of Literature and Research. Sustainability, 12(10), 4108. https://doi.org/10.3390/su12104108