Article

Effects of Correlated Colour Temperature of LED Light on Visual Sensation, Perception, and Cognitive Performance in a Classroom Lighting Environment

Department of Architectural Engineering, Hanyang University, Seoul 04763, Korea
*
Author to whom correspondence should be addressed.
Sustainability 2020, 12(10), 4051; https://doi.org/10.3390/su12104051
Submission received: 10 March 2020 / Revised: 8 May 2020 / Accepted: 13 May 2020 / Published: 15 May 2020

Abstract

:
Illuminance levels have been standardized and regulated for many purposes. However, the effects of correlated colour temperature of lighting have received little attention in the field. This study investigated the effects of correlated colour temperature of lighting on the brightness sensation, lighting perception, and cognitive performance of 60 students under ambient light emitting diodes (LED) lighting conditions (CCT: 3000 K, 4000 K, and 5700 K; illuminance: 650 lx and 1050 lx) in an actual university classroom. An increase in correlated colour temperature (CCT) led to an increase in brightness sensation. However, increased CCT did not linearly increase lighting comfort. A CCT of 4000 K was considered as the optimum for lighting comfort in educational settings. But in comparison to comfort, higher levels of perceptual properties, satisfaction and acceptance were not affected by CCT from 3000 K to 5700 K. Scores on the working memory test were significantly affected by CCT and illuminance level in men only. The effects of gender appeared in glare sensation and the working memory test. Women were sensitive to glare sensation and had a lower mean score in the working memory test than men. Optimal CCT is more beneficial than increased illuminance in moderately ambient indoor lighting, as it provides better lighting comfort. Further research can look at the long-term effects of CCT on lighting perception depending on brain processing levels and more diverse and in-depth cognitive performance.

1. Introduction

Lighting is a fundamental component of school classrooms. The parameters affected by lighting in a classroom include the optimal visibility of all information to the students, the mood or behaviour of the students, and the learning ability and performance of students. Despite its vitality, there have been few empirical studies on the effects of lighting on the academic performance or well-being of school students [1], and not many studies on more specific lighting factors such as correlated colour temperature.
A significant amount of research has focused on the effects of lighting in the work environment. Thus, it can be assumed that these effects already identified in the work environment may also apply to the school setting, and especially to university classrooms. The literature review in this study is based primarily on research conducted in workplace settings.
The two most important characteristics of light that must be considered regarding human perception are correlated colour temperature (CCT) and illuminance level [2]. The effects of illuminance on human perception have been thoroughly investigated, and many governments have established their own recommendations or standards for illuminance levels [3,4,5]. However, the effects of CCT on human perception and learning performance remain less understood compared to the effects of illuminance level. Thus, it is critical to investigate students’ subjective lighting preference in an actual classroom, so as to enable an increase in their learning performance and to enhance their mood to facilitate further learning.
Kruithof [6] conducted a study on human perception of combinations of illuminance and CCT and found that people prefer high colour temperature sources at high illuminance levels and low colour temperature sources at low illuminance levels. Unfortunately, his work has not been extensively reported. What is apparent from the details that are available is that different light sources such as tungsten, daylight, and tubular fluorescent were used to produce the different CCTs. Thus, the light distribution and the colour of the light varied with the CCT. As both spectral distribution and colour temperature are known to affect human perception, the applicability of Kruithof’s curve may be limited [7]. Comfortable indoor lighting conditions have been developed using lamps that are presently available [8]. The effects of CCT on human sensation, perception, and cognitive performance have been studied and the results are still unclear.
Reported effects of CCT on lighting sensation and perception are controversial. Brightness is the sensation obtained by the eyes, and comfort or satisfaction is the process of perception by which the brain selects, organizes, and interprets brightness. These two concepts should be carefully considered.
Multiple studies reveal that rooms illuminated with higher CCT lamps appear brighter than rooms illuminated with lower CCT lamps, assuming other characteristics like illuminance and luminance distribution are held constant [9,10,11,12]. Akashi and Boyce [13] found that the lamp with CCT 6500 K was the most effective in increasing the brightness in an office setting, especially compared to lamps with CCT 3500 K and 5000 K. Wei et al. [14] used a 2 x 2 factorial design in their study, which comprised two levels of CCT (3500 and 5000 K) and lumen output (2330 and 3000 lm) with 26 participants. The luminous conditions at 5000 K were rated to be brighter than those at 3500 K. However, the increase in spatial brightness resulted in lower satisfaction and a decrease in visual comfort. Baniya et al. [15] examined nine configurations combining three illuminance levels (300, 500, and 750 lx) and three CCTs (3000, 4000, 5000 K) with 53 participants belonging to different ethnicities. They found that the impression of brightness increased with a higher CCT at 500 and 750 lx. They further reported that the European group preferred a lighter environment at 4000 K for office lighting, whereas Asian and African groups preferred between 4000 and 5000 K depending upon illuminance levels. Yu and Akita [16] also examined the effect of illuminance (150 and 300 lx) and CCT (2800, 5000, and 6700 K) with 18 participants in a capsule hotel, where the illuminance levels were lower than the two previous studies. They found higher CCT to be associated with higher spatial brightness, and lower CCT with a higher sense of security, restfulness, and positive feelings. Higher CCT was associated with higher brightness and lower CCT was associated with higher satisfaction, visual comfort, restfulness, positive feelings, and self-reported productivity [14,15,16]. Lower CCT was associated with a better mood at lower illuminance levels, while higher CCT was preferred at higher illuminance levels [17]. CCT of 4000 K was found to be preferable as compared to CCT of 6500 K at 500 lx in the office lighting environment [18]. Wang et al. [19] concluded that CCT has a significant impact on the subjective comfort and preference of individuals. The preferable illuminance and CCT vary according to the activities of the users [20,21]. Kocaoğlu [22] compared two different lighting settings, 4000 K and 6500 K, with 14 university students and concluded that 6500 K was better than 4000 K for sustained attention and mood.
On the other hand, other studies have reported that the CCT of lamps had no effect on the brightness of the room’s lighting [7,23,24,25]. Boyce and Cuttle [7] also reported that once the participant has fully adapted to the conditions, the CCT of good colour-rendering lamps in the range of 2700 K to 6300 K had little effect on the participants’ impressions of the room lighting. Davis and Ginthner [23] found that subjective ratings of preference were influenced only by light level and not by colour temperature. Fotios [26] concluded that the one condition to avoid is low illuminance and that the variation in CCT (within the range of approximately 2500 to 6500 K) does not affect pleasing conditions and can be chosen by other criteria. Therefore, it was suggested that the Kruithof graph should show a single curve—a straight line.
There is a dearth of research on the effects of CCT on cognitive performance. Shamsul et al. [2] found that a CCT of 3000 K was detrimental to the alertness level and typing performances in their study on 47 undergraduate students. Mental activity was considered to be more activated under lighting with higher CCT than lighting with lower CCT [27,28,29]. Navvab [30] found that word reading and letter acuity were significantly better at CCT 6500 K compared to 3500 K in their study on 101 young adults. Boyce et al. [31] found that visual task performance was better at CCT 6500 K compared to CCT 3000 K at 500 lx. Yamagishi et al. [32] examined the effects of CCT 2500 K, 5000 K, and 8200 K at 470 lx on the numerical verification performance of 12 elderly people. They found that the LED lighting with 5000 K and 8200 K was better for visual performance. In the recent decade, evidence which supports the effects of CCT on cognitive performance has been reported by Huang et al. [33], who found significantly better focused and sustained attention levels at 4300 K among CCT 2700 K, 4300 K, and 6500 K at 500 lx in a study conducted with 210 undergraduate students. Luo et al. [34] found that the work performance of a youth group was the best at CCT 4000 K as compared to 3000 K and 5000 K at 500 lx. A recent classroom field study by Pulay et al. [35] concluded that the CCT of 4100 K lighting was better for the on task behaviours of students rather than the CCT of 3000 K lighting.
However, other studies did not find any significant effects of CCT on cognitive performance. Boray et al. [36] examined three lighting conditions, 3000, 4150, and 5000 K fluorescent spectra at 500 lx illuminance projected on a table. They found no significant differences in simple verbal and quantitative tasks in the three CCT conditions involving 117 university students. Davis and Garza [37] compared two task lightings with 2700 and 4100 K (1290, 323, and 54 lx) and no differences on cognitive performance were found in their sample of 17 elderly people. Ru et al. [25] concluded that CCT did not have statistical significance regarding subjective alertness and task performance across various cognitive domains, but it did affect the participants’ negative mood.
The purpose of this study was to investigate the optimal CCT of LED lighting for university classrooms considering the students’ sensation, perception and cognitive performance. Sixty university students were exposed to the six lighting configurations (CCT: 3000 K, 4000 K, and 5700 K; illuminance: 650 lx and 1050 lx). The lighting in most school classrooms in Korea has a high colour temperature. Thus, it is necessary to determine whether the typically installed high CCT level of lighting compared to an optimal CCT of lighting influences student sensation, perception, and cognitive performance in a real university classroom.

2. Method

2.1. Participants

Sixty university students (30 men and 30 women) who were all in their early twenties volunteered for the present study. Each participant was involved in six experimental sessions. All participants gave their written informed consent before the start of the study and received financial support in exchange for their participation. All participants had normal or corrected-to-normal vision, and none of them had a colour vision deficiency.

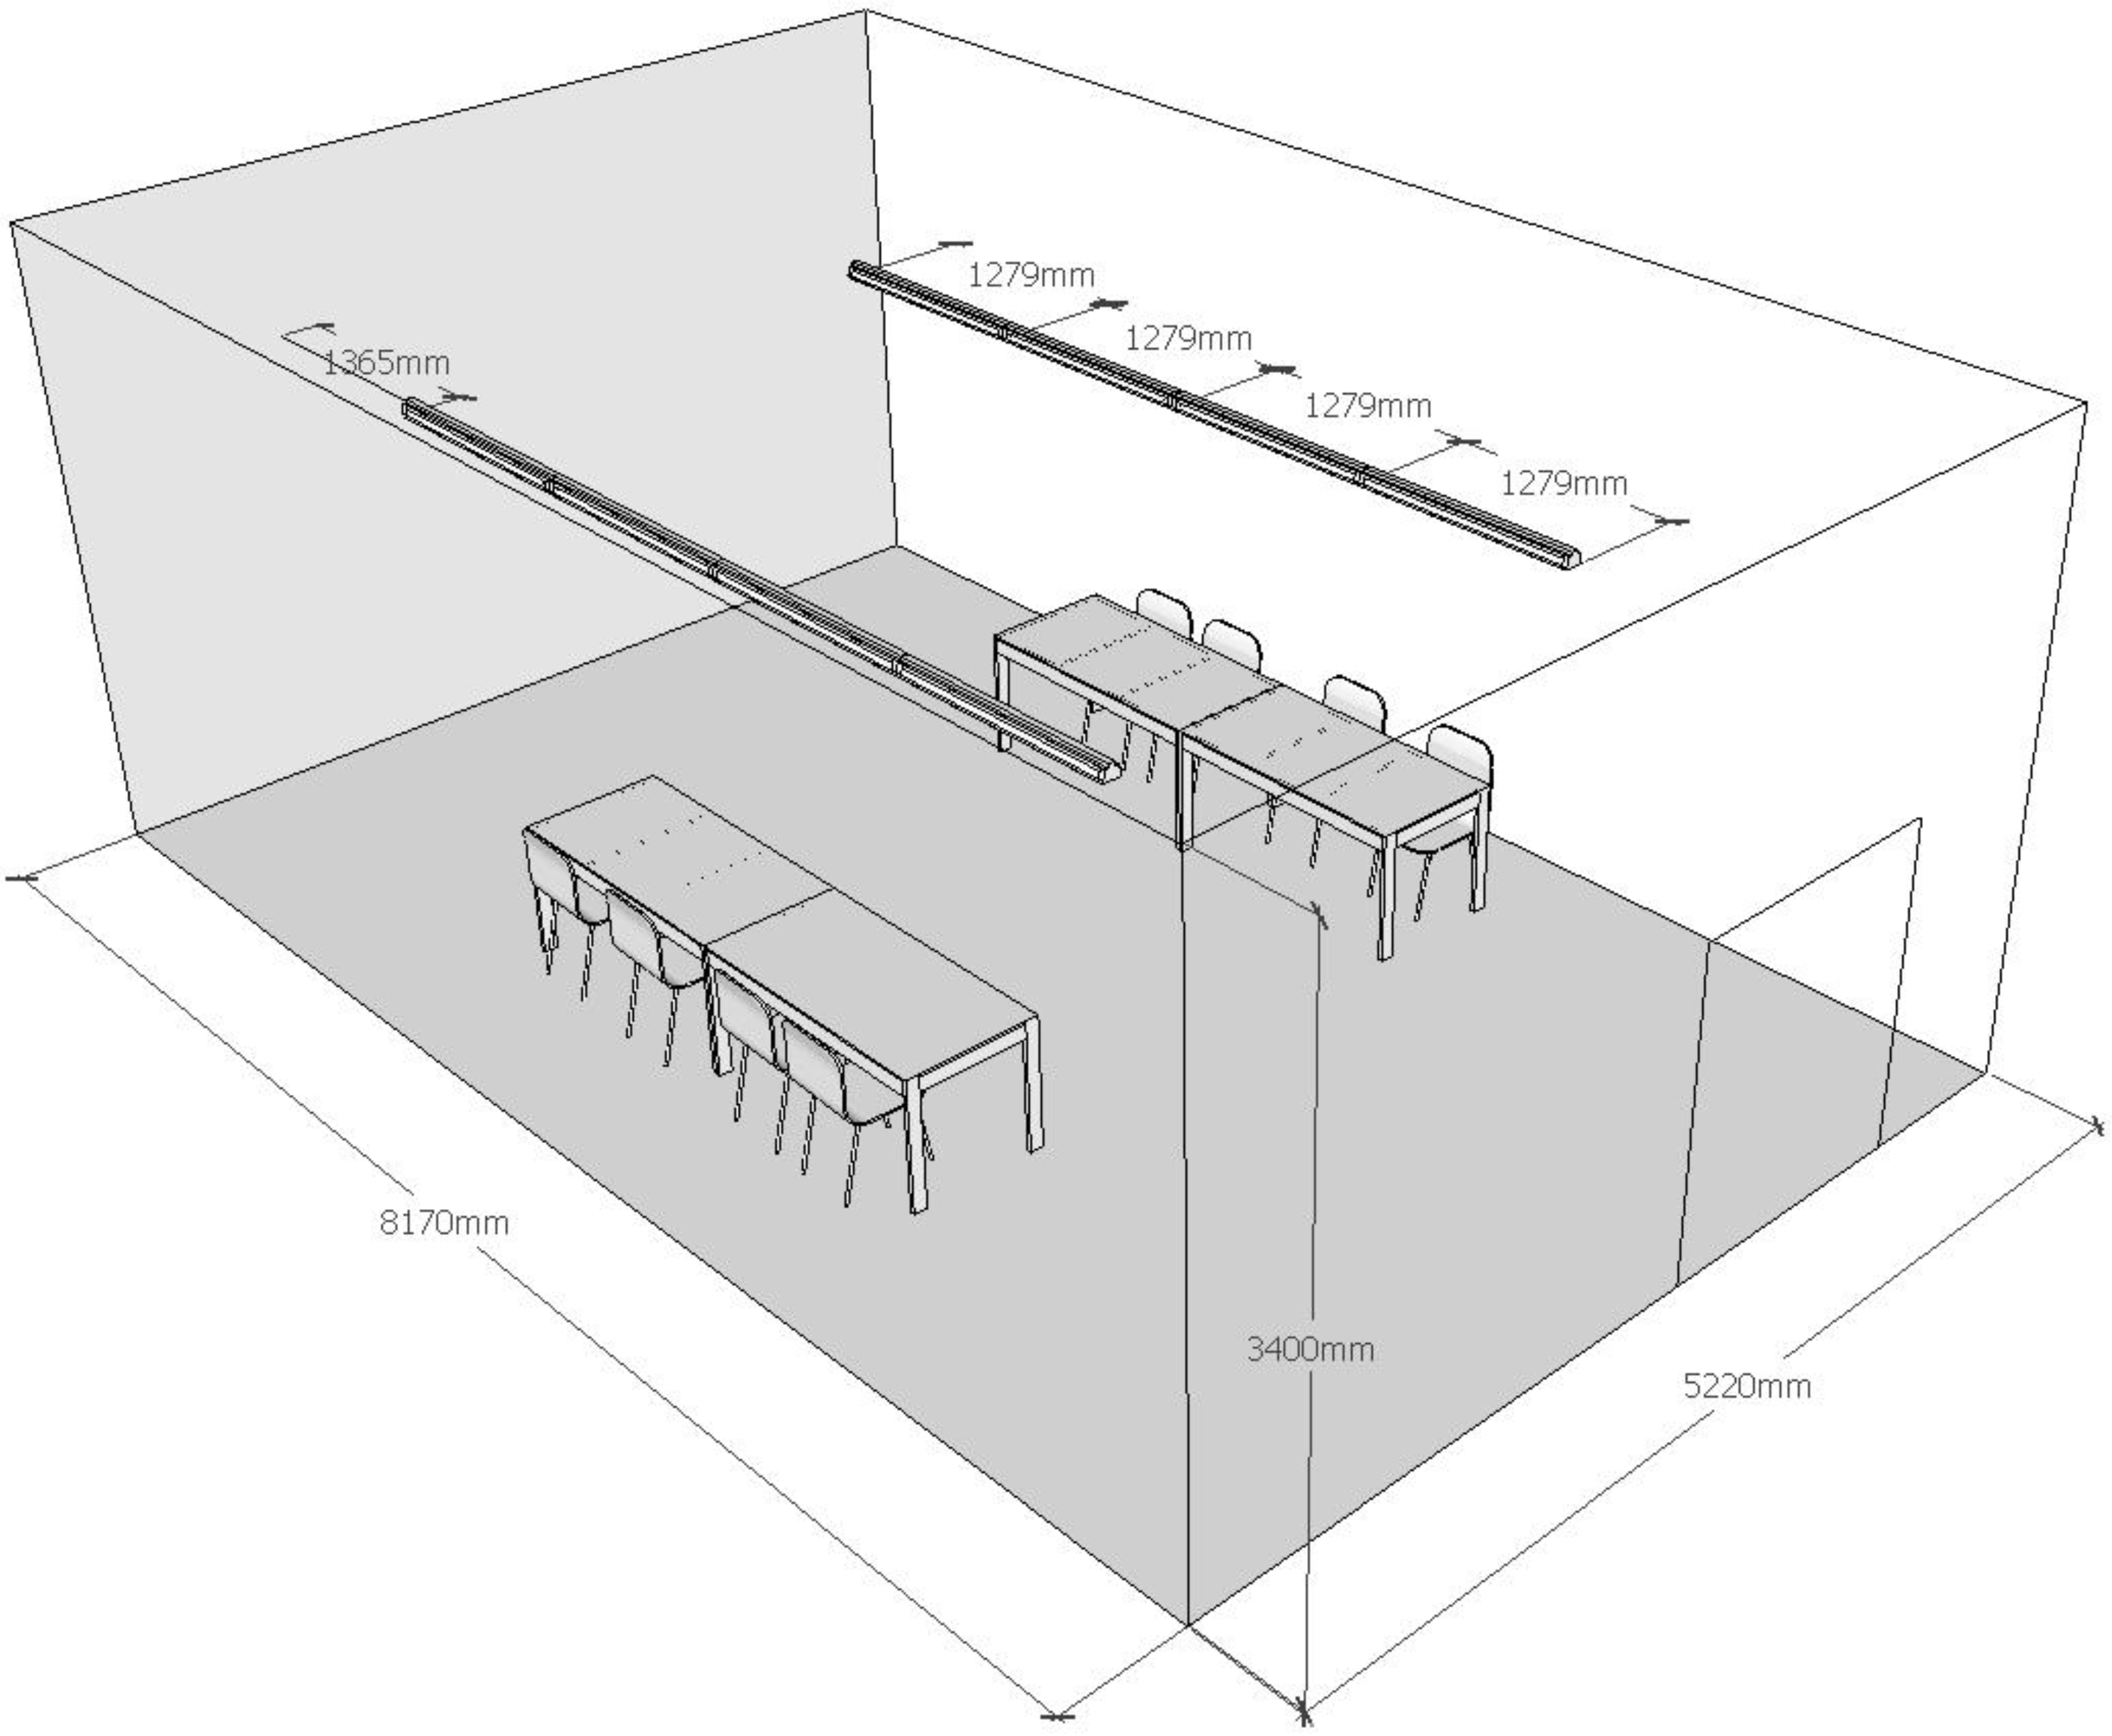
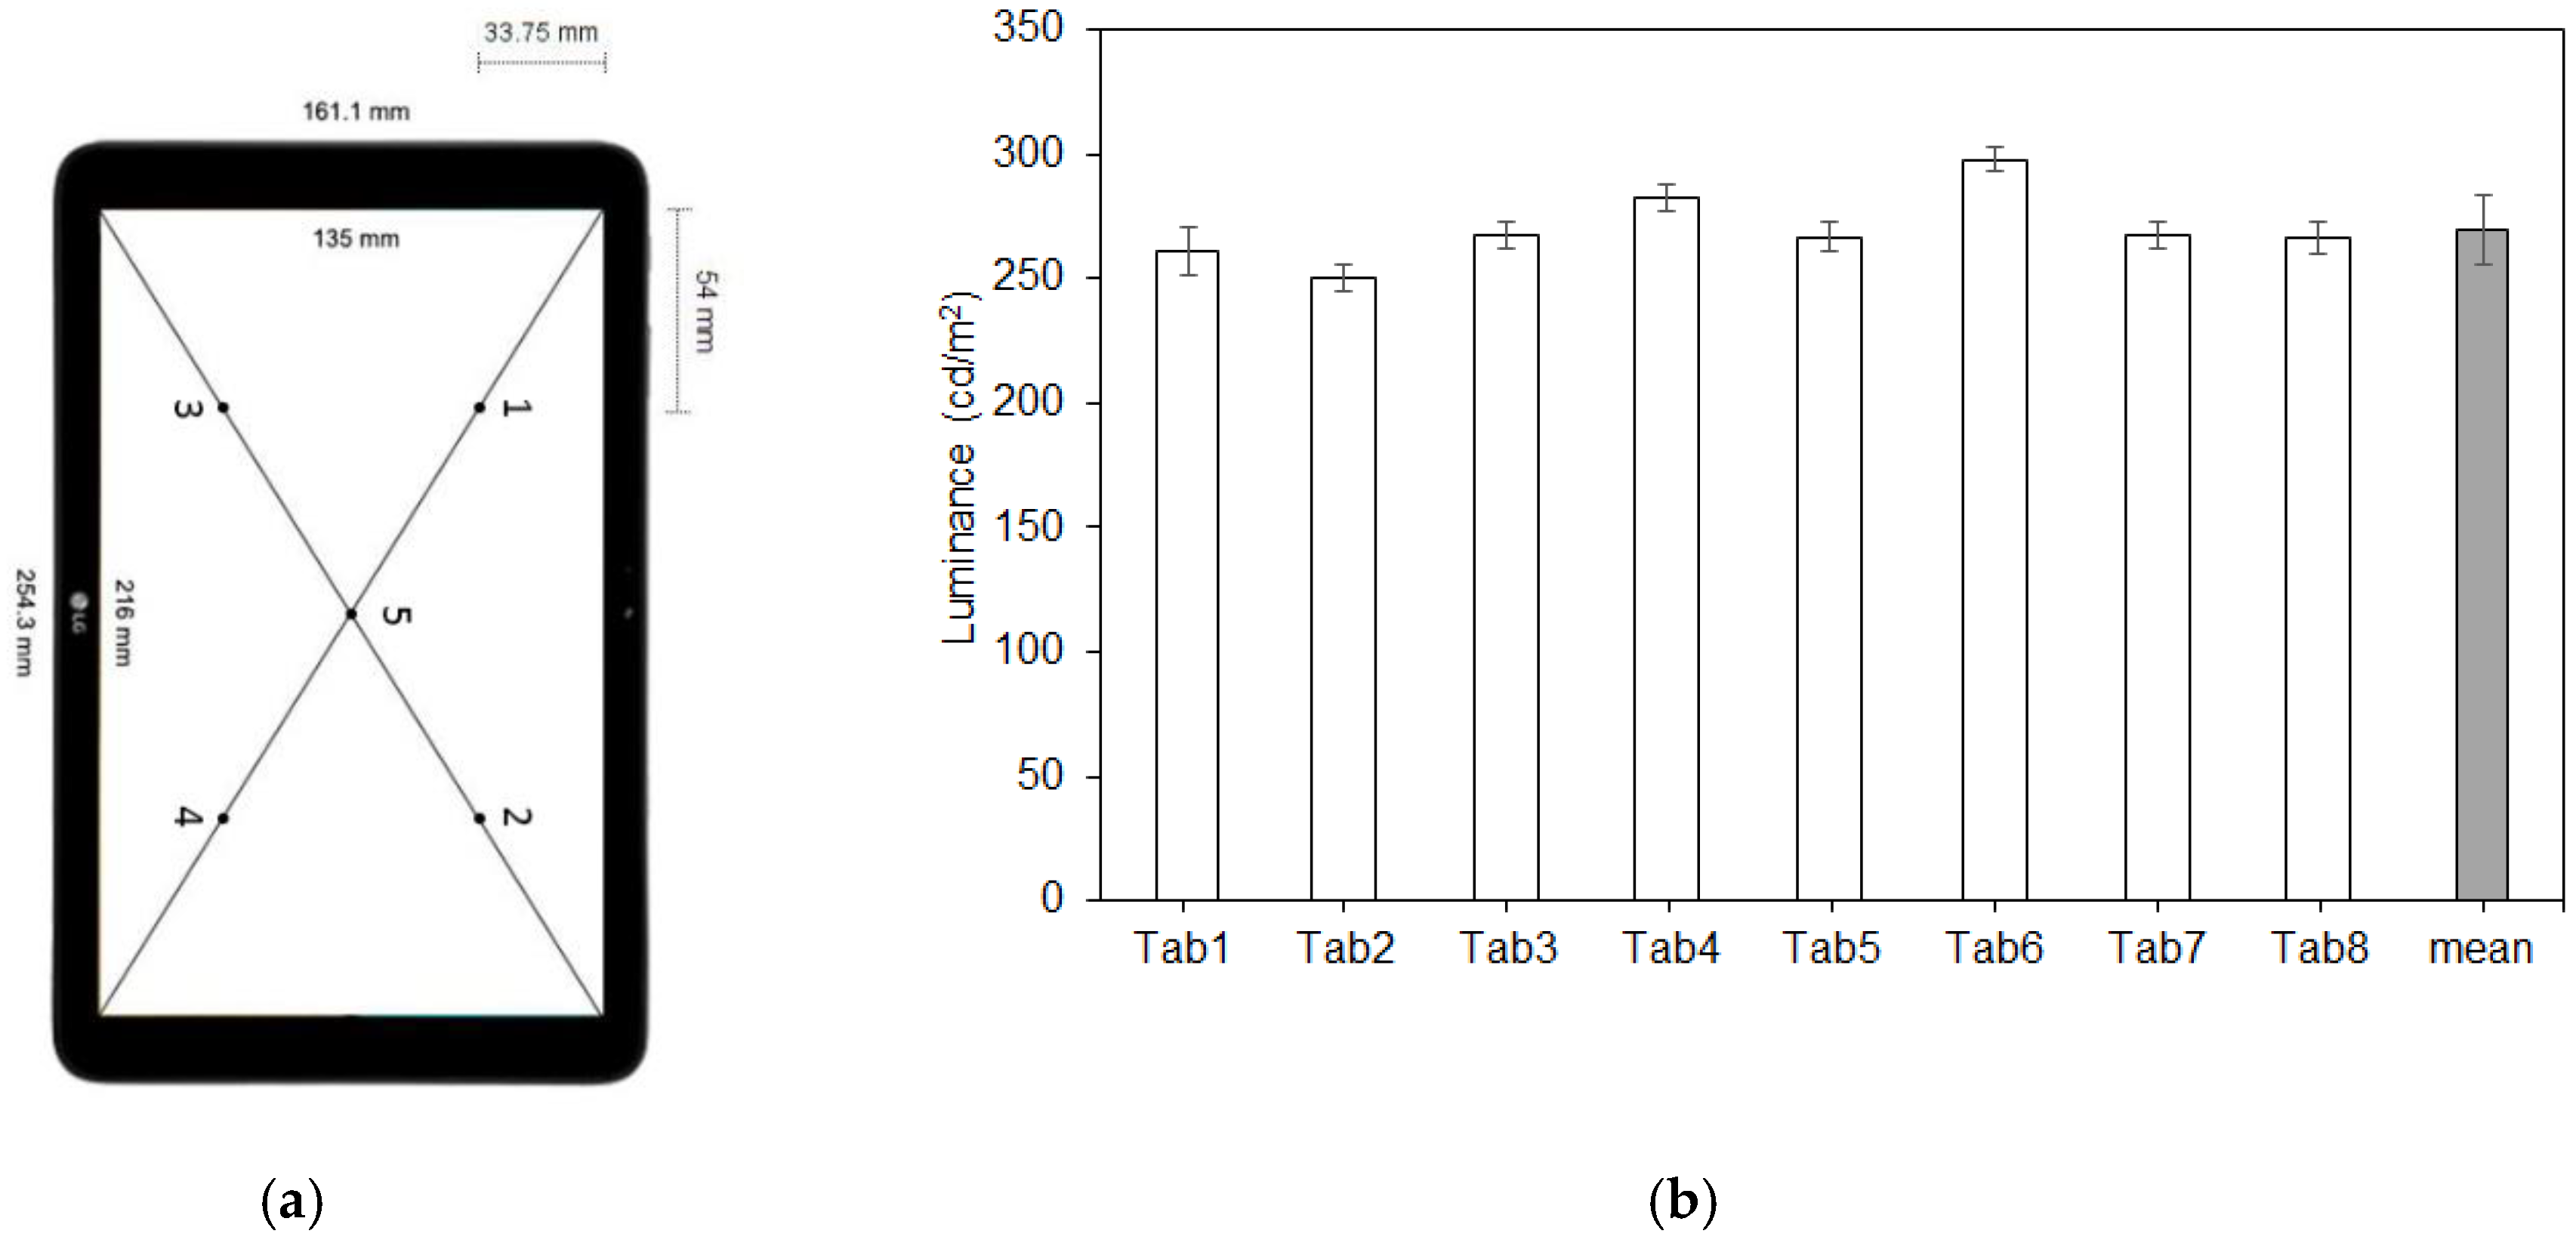
2.2. Experimental Conditions

The experiment was conducted in an actual university seminar classroom located in the second basement, where daylight could be controlled. Eight LED lighting fixtures with two tubes were installed hanging from the ceiling as shown in Figure 1 and Figure 2. The CCT of the lamp varied from 3000, 4000, and 5700 K, and the illuminance levels on the participants’ desk surface were set to 650 and 1050 lx on each CCT. Table 1 lists the values of illuminance and CCT that were measured in six test conditions.
The ventilation system was kept active throughout the experiments, and the background noise level in the classroom was measured as 41 dBA. The room temperature of 25 °C and the relative humidity of 40%, which corresponded to neutral sensation, were set throughout the experiments.

2.3. Working Memory Testing

The Korean Wechsler Adult Intelligence Scale-IV; K-WAIS-IV [38], which is the Korean version of the Wechsler Adult Intelligence Scale-IV [39], was used to develop the working memory test. Five questions were drawn from each of the digit span backward (DSB) and the letter-number sequencing (LNS) sections. Each set of the working memory test consisted of five 3- to 7-digit DSB questions and five 3- to 7-digit LNS questions. In this study, the testing software was developed to automate data collection and to display random test sets per participant. Each number or letter was given to participants at 1 second intervals on a tablet through the use of a testing software.

2.4. Subjective Measurement

The lighting sensation and perception in the classroom were assessed using a visual analogue scale without a central point between the two end points. Visual analogue scales are known to present better metrical features than category scales [40] and are preferred by young participants [41]. The subjective questionnaire used the following semantic adjectives: “bright”, “dark”, “satisfied with illuminance”, “acceptable illuminance”, “warm”, “cool”, “satisfied with colour temperature”, “acceptable colour temperature”, “comfortable”, “satisfied with overall lighting conditions”, “acceptable overall lighting conditions”. Glares from the desk, wall, tablet, and light source were also surveyed. A numerical value of 0.00 to 10.00 was assigned to each attribute responded to by the participants, to facilitate the statistical analyses. The subjective assessment was also conducted using a tablet pad, and the data were automatically saved on a server.

2.5. Experimental Design and Procedure

A factorial within-subject design was employed with three independent variables: CCT (3000, 4000, and 5700 K), illuminance level (650 and 1050 lx), and gender (women and men).
The six sessions were initially conducted at a CCT of 3000 K (1050 and 650 lx), followed by 5700 K (1050 and 650 lx), and thereafter at 4000 K (1050 and 650 lx). The CCT test sequence was in random order. Two illuminance tests with an identical CCT level were tested on different days within each week. Each participant attended the sessions twice days a week for three weeks. The participants had enough time to refresh their memory of the test conditions.
Participants were required to attend all six sessions performed in the classroom. In each session, eight participants (the maximum size of each group) were provided with a quick demonstration regarding how to use the tablet. The experimental conditions were not mentioned to the participants in order to avoid potential experimental bias. In each of the 35-min-long sessions, a 20-min adaptation period [42] was implemented at the beginning for light and dark adaptation, and a 5-min working memory testing was followed by a 10-min subjective measurement, as shown in Figure 3. The working memory test data and the subjective responses provided by the participants were automatically saved on a server. The luminous levels on the eight test devices were set at maximum brightness level with the blue light protection option on and measured (Konica Minolta CS-200) as shown in Figure 4. With the blue light blocking option turned on, the tablet had a CCT of 5229K.
A factorial analysis of variance (ANOVA) was used to test the sensation and perception attributes towards the lighting in the experiment in order to fit the three independent variables, i.e., CCT, desk surface illuminance, and gender. ANOVA was chosen due to being a powerful statistical test, although normality cannot be guaranteed for subjective ratings [43]. Bonferroni’s post hoc test was applied thereafter.

3. Results

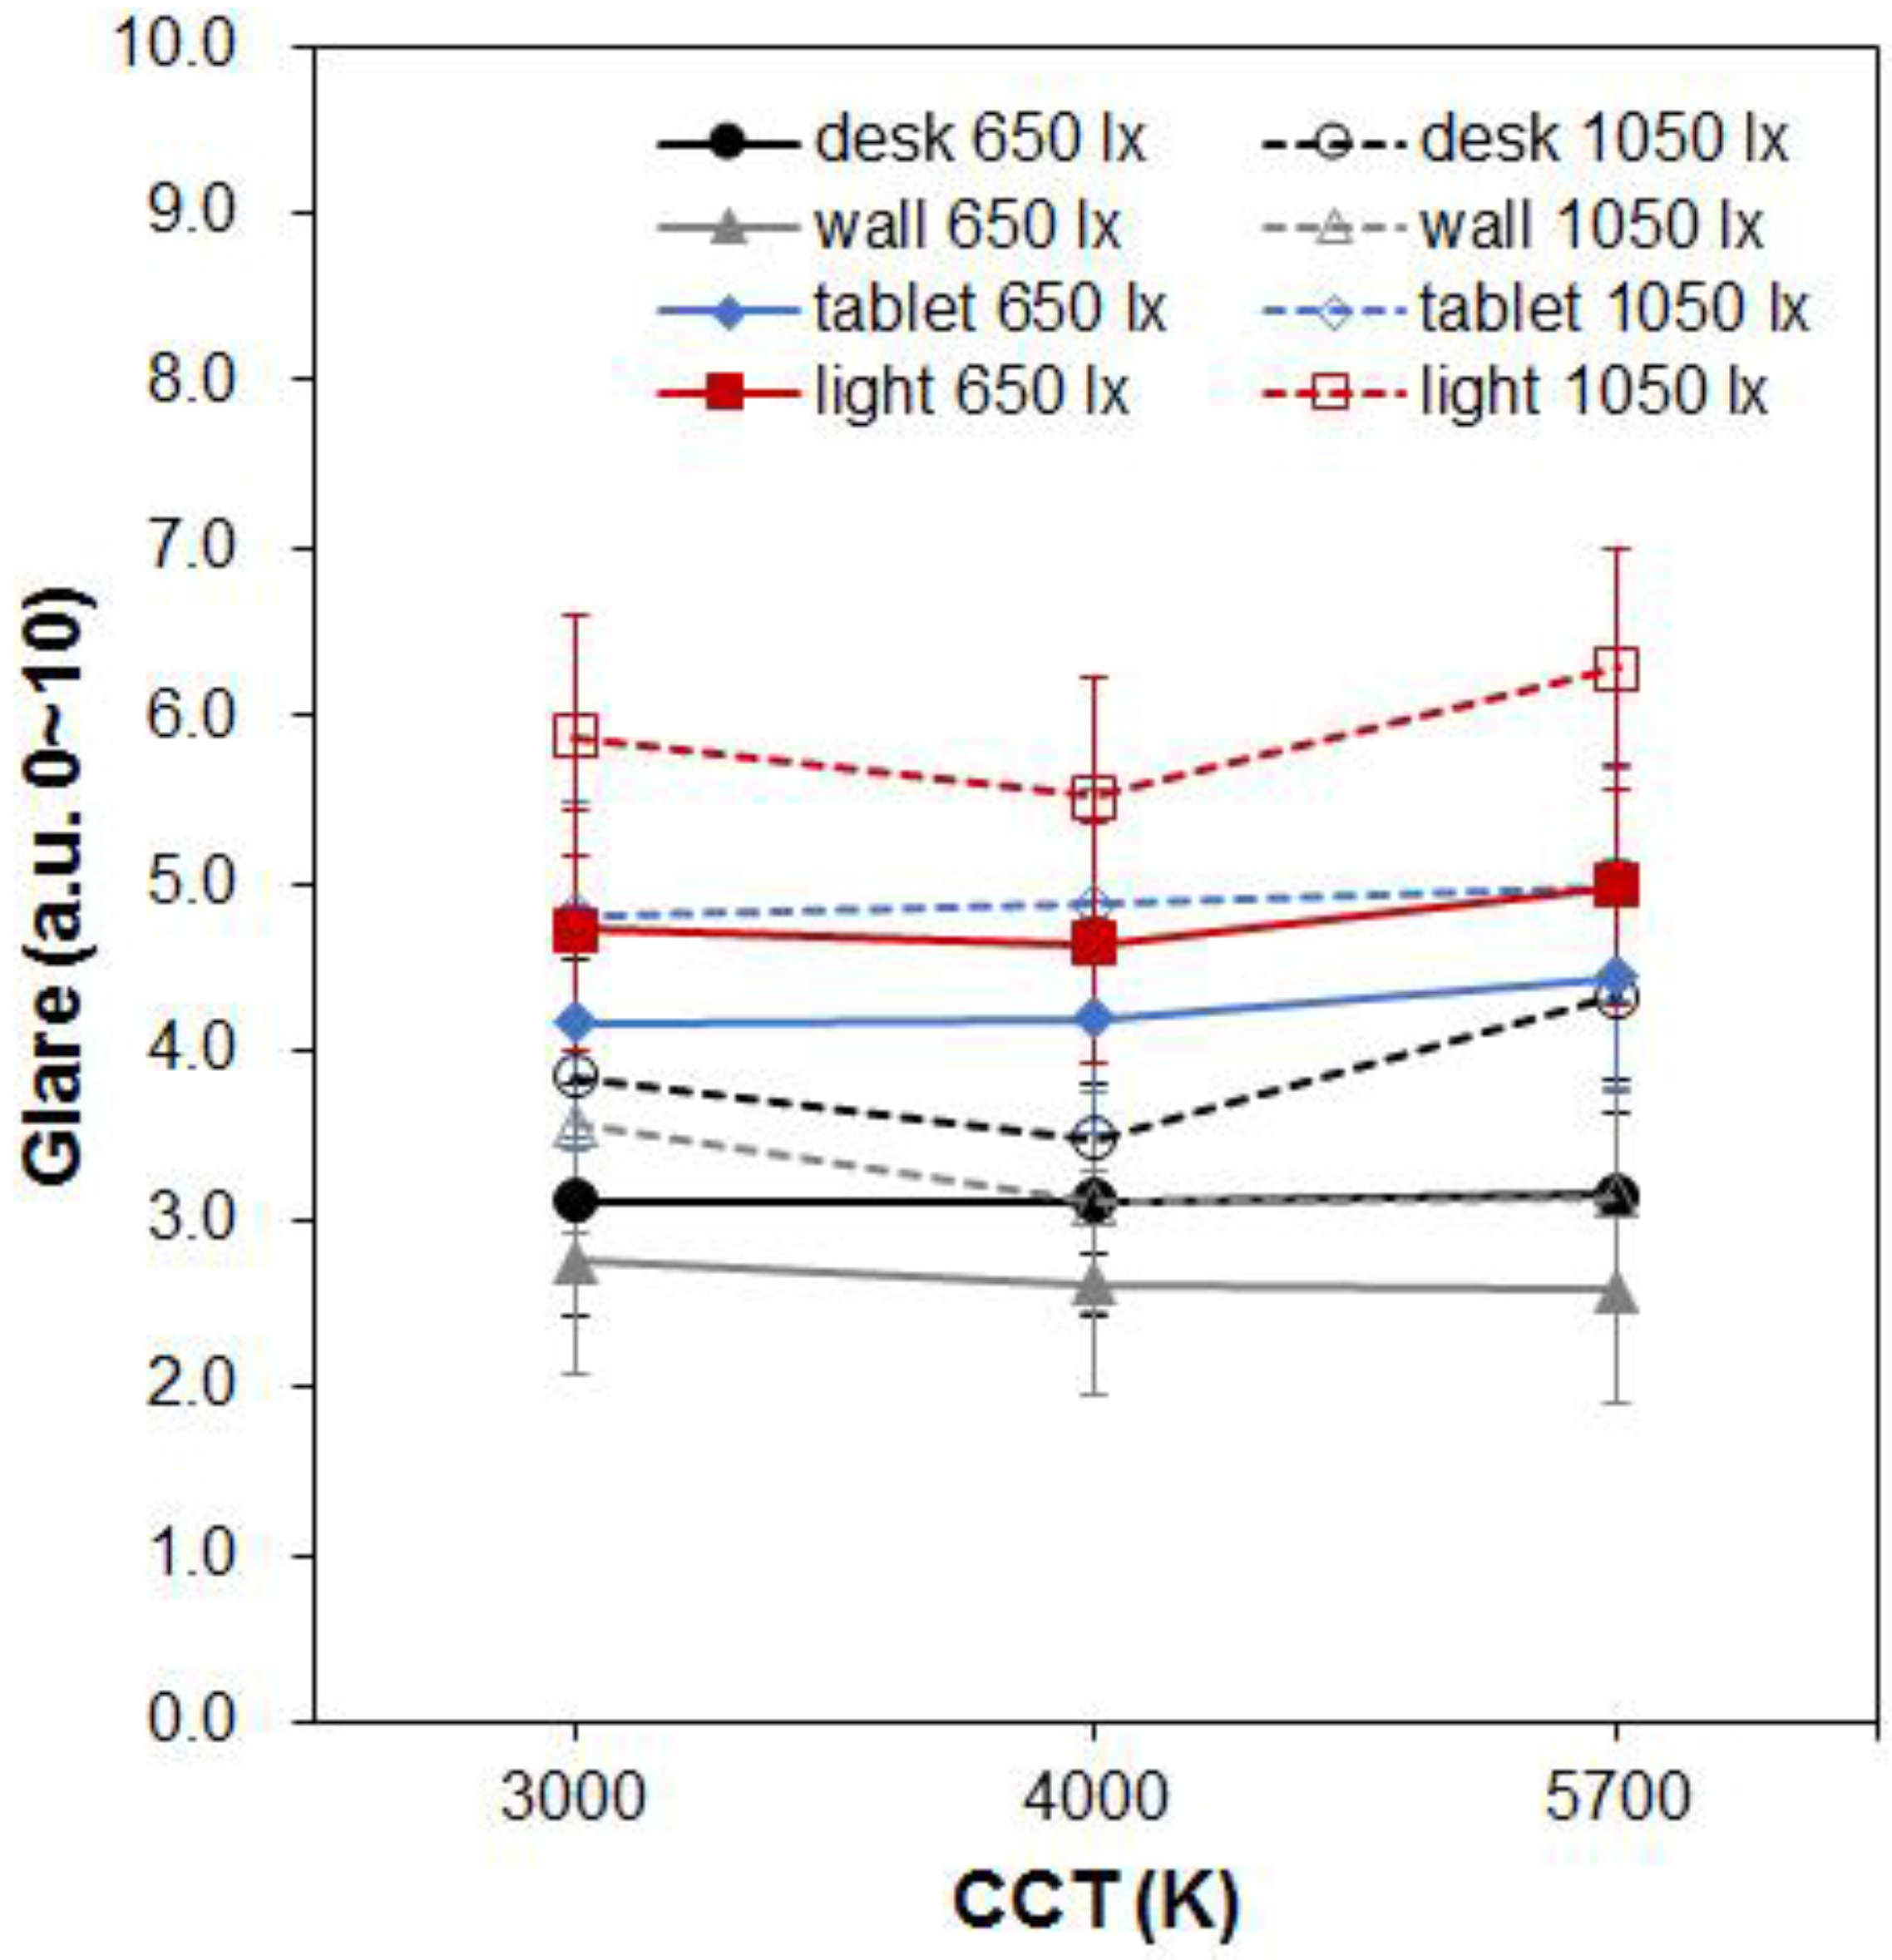
3.1. Sensation: Bright, Dark, Warm, Cool, and Glare

The CCT affected brightness, but no statistical significance was found on darkness (Table 2). Brightness reportedly increased with increased CCT and combined illuminance levels in the overall analysis. The mean brightness values at 3000 K and 5000 K were found to be significantly different (p < 0.05).
Brightness and darkness were dependent on the illuminance level (p < 0.0005) (Figure 5). The 95% confidence intervals of 650 lx and 1050 lx, at 3000 K and 5000 K, in brightness and darkness never overlaid, but at 4000 K the brightness and the darkness values of 650 lx and 1040 lx were not significantly differentiated by illuminance levels.
Increased CCT increased the coolness and decreased the warmth of the lightings (Figure 6). Illuminance did not affect warmth or coolness.
Glare was dependent on both illuminance and gender. Figure 7 shows mean glare values from desk, wall, tablet, and light. A trend of dips at 4000 K was found, but it was not statistically significant. Although the effect of gender was analysed throughout the subjective attributes in the study, glare was the only attribute which showed any gender effects in sensation and perception attributes. Women were found to be more sensitive than men while sensing the glare (Table 3).

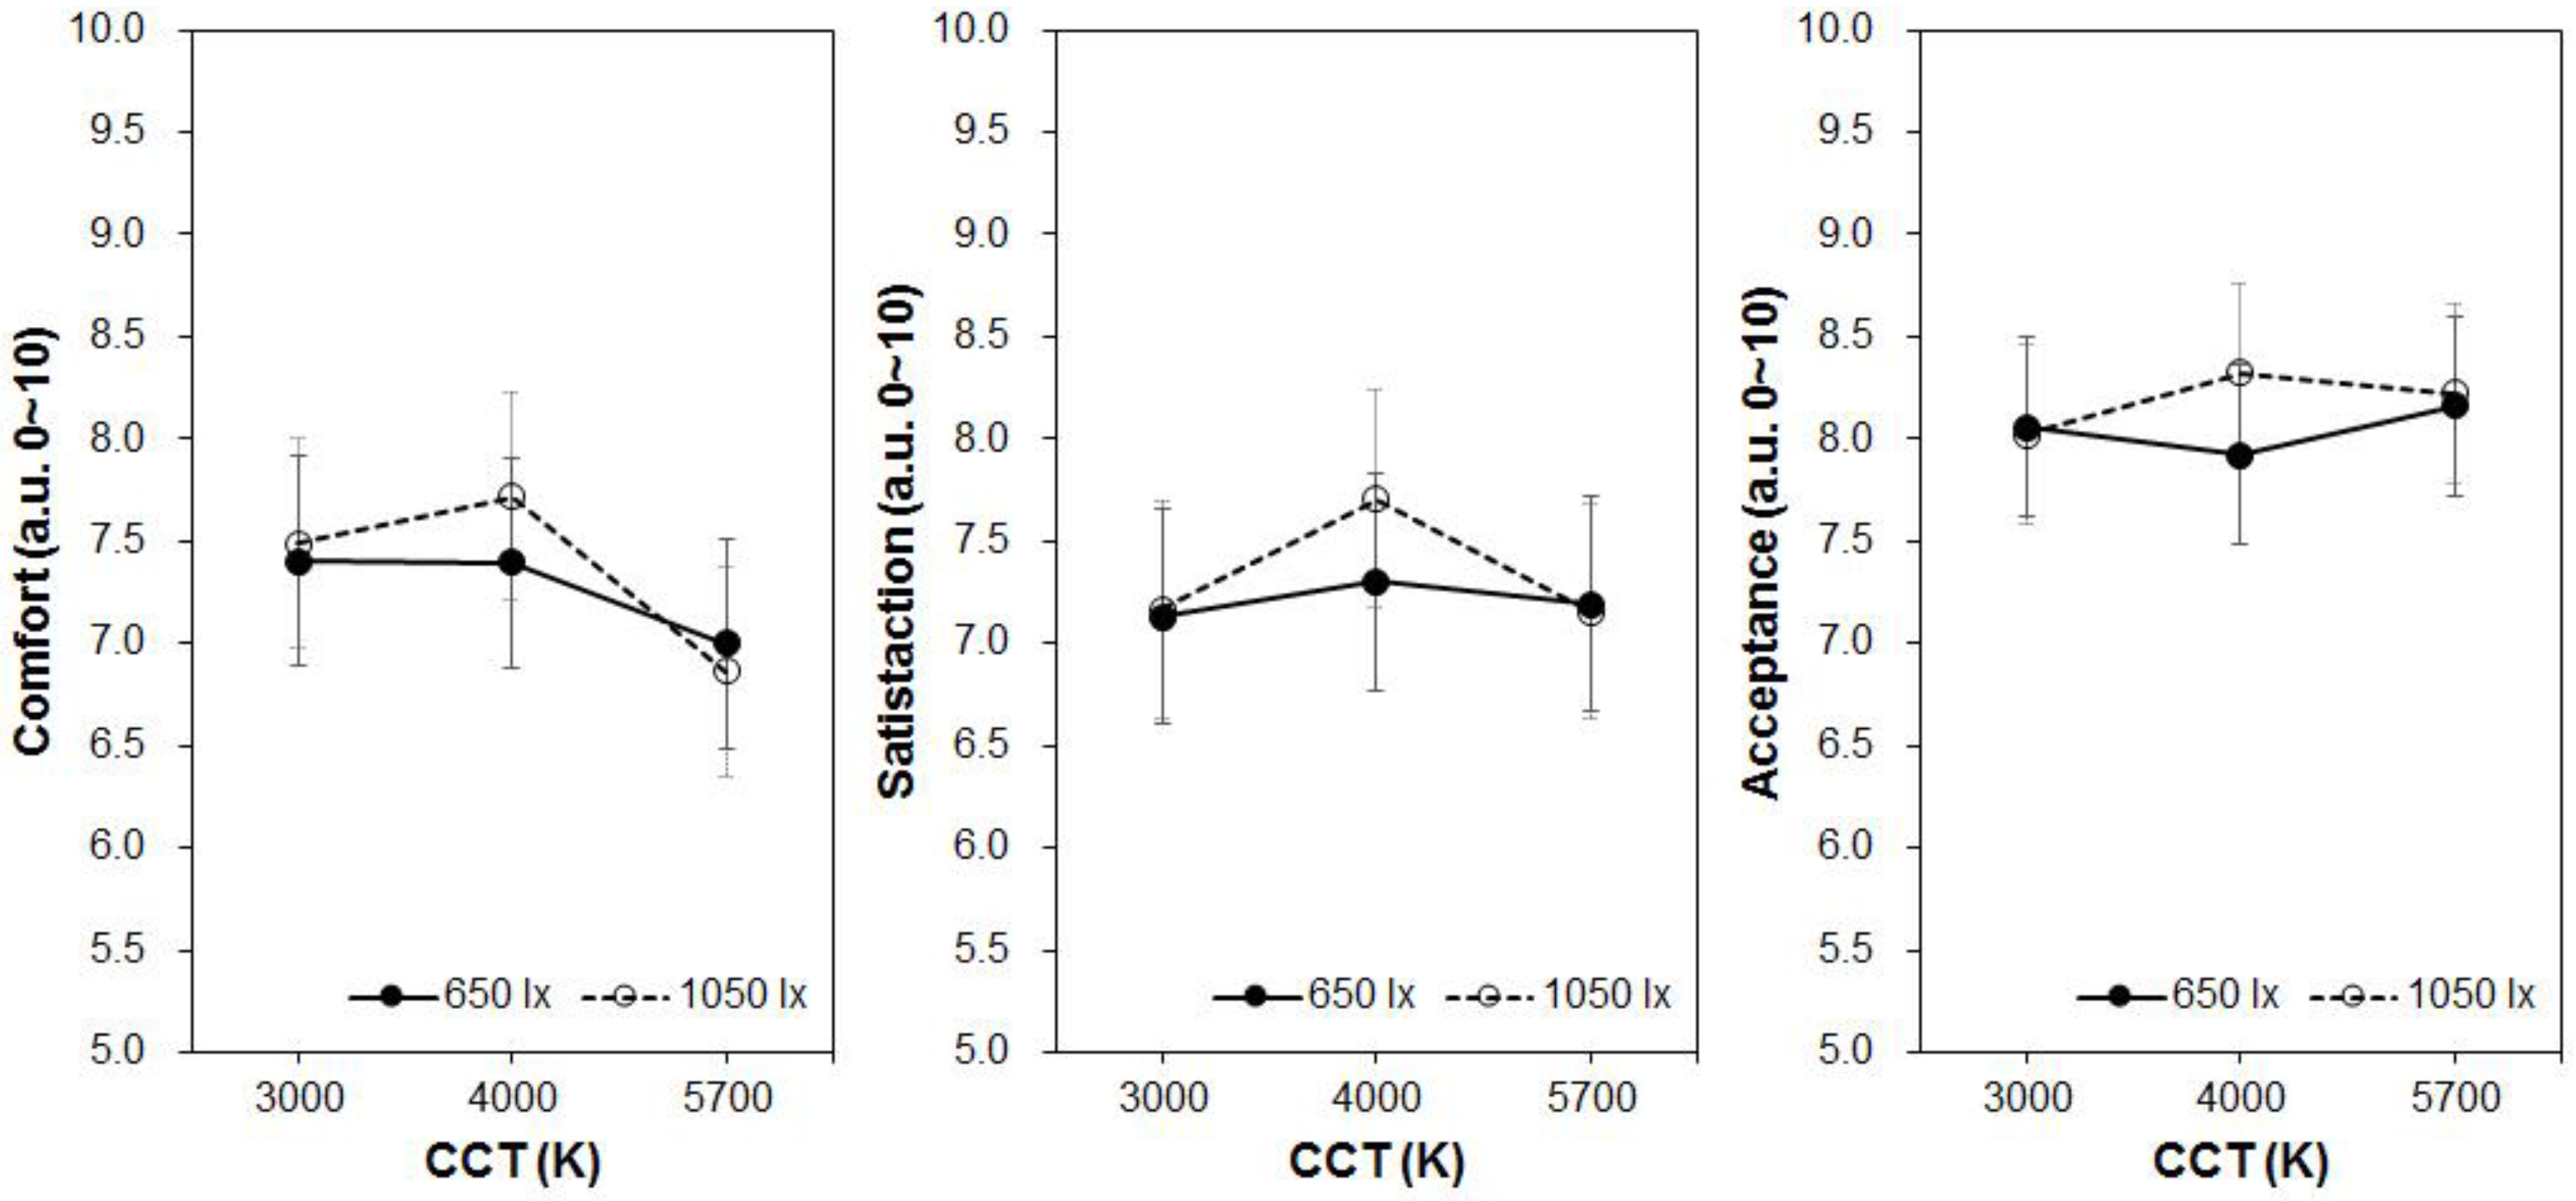
3.2. Perception: Lighting Comfort, Satisfaction, and Acceptance

It was found that CCT affects lighting comfort. In lighting comfort, a CCT of 4000 K presented significant preference over a CCT of 5700 K (see Figure 8). No significant differences were seen between satisfaction and acceptance throughout the test configurations in the study. Table 4 lists mean values of the comfort, satisfaction, and acceptance for the overall lighting environment, and illuminance with 650 lx, and 1050 lx. The preference trend for 4000 K is also shown in Figure 9. However, no statistical significance was demonstrated by illuminance levels in the segmented data analysis. For the separated illuminance analyses per illuminance level, no CCT effects were found in lighting comfort attributes.

3.3. Working Memory Testing: Digit Span Backward and Letter-Number Sequencing

The working memory test scores were found to be unaffected for both CCT and illuminance in the overall analysis (Table 5). Gender effects were seen in scores of the working memory test. Men’s scores were found to be higher than women’s scores, even though the mean scores from both men and women were over 9 points out of 10.
Both the CCT effect and the illuminance effect in the working memory scores had an effect in men. At 3000 K, the working memory scores were significantly lower than those at 4000 or 5700 lx for men. The working memory scores with 650 lx were significantly higher than those with 1050 lx for men. Women had no effects of CCT or illuminance on the working memory scores.

4. Discussion

4.1. The Levels of Brain Processing in the Subjective Attributes and the CCT Effects

Sensation is a mental process resulting from the immediate external stimulation of a sensory organ, and perception is the awareness of elements of the environment through physical sensation [44]. The main difference is that sensation is where our sense organs first encounter raw stimuli, and perception is the process by which the stimuli are interpreted, analysed, and integrated with other sensory information. However, it is sometimes difficult to separate the two processes.
For the subjective attributes in this study, brightness can be categorized into sensation, and comfort, satisfaction, and acceptance into perception. Among the three perceptive attributes, there are differences in the levels of brain processing. Satisfaction is determined by more information than comfort, and acceptance is determined by more information than satisfaction. Or, even without using the sensory or perceptual categories, brightness can be considered to have a lower level of brain processing than comfort. In this case, one can also consider the sequence of brain processing of brightness, comfort, satisfaction, and acceptance. Brightness was affected by the correlated colour temperature of the lighting with statistical significance. Comfort was also affected by the correlated colour temperature upon the number of samples. However, satisfaction and acceptance were not affected by the correlated colour temperature within the test configurations in this study. Mean satisfaction values were almost identical with those of comfort. Mean acceptance values increased compared to those of satisfaction, indicating that the concept of acceptance was more involved than that of satisfaction.
The findings of this study are consistent with previous studies, which reported that lighting with high CCT had stronger brightness [11,12,13,14,15,16]. However, our perception results contradicted those of previous study which were consistent with brightness results, because each study used different perceptive attributes and previous studies did not systematically develop subjective semantic attributes. Manav [45] and Shamsul et al. [2] also found that in terms of visual comfort, which was the same perceptive attribute in this study, respondents reported significantly better comfort at 4000 K as compared to 3000 K or 2700 K. Wei et al. [14] found the CCT affected satisfaction as well as visual comfort. Baniya et al. [15] studied the fact that the participants preferred a lighting environment at 4000–5000 K for office lighting. Yu and Akita [16] concluded that lower CCT was associated with a sense of security, restfulness, and positive feelings.
This study’s findings are partially consistent with previous studies, showing that CCT has no effects on brightness, satisfaction, or acceptance. Boyce and Cuttle [7] demonstrated that a CCT range of 2700–6300 K had no significant effect on the semantic attributes. Davis and Ginthner [23] reported that changes in CCT did not affect preference ratings. Fotios [26] also concluded that CCT had a negligible effect on ratings of brightness and pleasantness.

4.2. The CCT Effects on Cognitive Performance

Only men showed CCT effects with statistical significance on the working memory scores. Furthermore, men also showed illuminance effects on working memory scores. However, for women, the working memory scores were not affected by CCT or illuminance. Previous studies have had controversial results: one was in support of CCT having no effects on cognitive performance [36,37] but another, more recent one, supported the effects of CCT on cognitive performance [30,31,32,33,34,35].
Although working memory score differences were found according to CCT or illuminance for men, note that the least mean scores were high enough in moderate lighting ranges. The digit span backward (DSB) and the letter-number sequencing (LNS) from the K-WAIS-IV [38] were used for working memory testing in this study (see Appendix A). Therefore, it cannot be generalized to cognitive performance. Further research is required on the CCT effects on cognitive performance in classrooms.

4.3. Gender Differences in the Lighting Environment

Gender differences were found in the glare sensation and the working memory test. No effect of gender was observed for brightness sensation or lighting perception. Women were more sensitive than men to glare sensation. Men showed higher working memory scores than women, and only men showed the CCT effects on working memory scores.
Gender differences in CCT have been rarely studied. Huang et al. [33] reported that gender differences in the attention test were not found. However, the attention test results and the self-reported clarity of women were significantly affected by CCTs of 2700 K, 4300 K, and 6500 K, respectively. The self-reported clarity by women was significantly lower when CCT was 2700 K. Kakitsuba [46] investigated comfortable LED lighting conditions with CCTs of 3000 to 5000 K and found no gender difference in the boundary illuminance estimated from psychological and physiological responses.
The glare effect on cognitive performance was not examined in this study. However, our results encourage further research on an issue that has never been systematically and consistently addressed until now [47].

4.4. Optimal CCT in Educational Settings

Smaller differences were observed in illuminance levels as compared to CCT levels for perceptual attributes such as comfort, satisfaction, and acceptance. No significant difference in brightness was observed between 650 lx and 1050 lx at CCT 4000 K (Figure 4). Note that the cognitive performance was better with 650 lx than with 1050 lx, as well as at 4000 K and 5700 K for men. Thus, CCT could be more critical than the illuminance level in moderate lighting conditions, which is consistent with results of Wang et al. [19] stating that illuminance is not a significant factor in influencing the estimations if it is limited to a moderate range. Their study also found that CCT had a significant impact on subjective comfort and preference.
An optimum CCT at 4000 K for lighting perception in office settings was suggested in previous studies. Manav [45] found that, in their test office study, a 4000 K CCT was preferred to one of 2700 K for impressions of comfort and spaciousness, while a CCT of 2700 K was suggested for relaxation. Lee et al. [17] concluded that, out of CCT levels of 3000 K, 4000 K, and 6500 K, 4000 K should be recommended for visual environments in offices where the target illuminance is greater than, or equal to, 500 lx. Islam et al. [18] compared spectral power distributions lower than 4000 K and 6500 K, and found that neutral white light (CCT of 4000 K) was preferable to cool white light (CCT of 6500 K) at 500 lx in the office lighting environment.
An optimum CCT of 4000 K was suggested in previous studies for cognitive performance in the workplace or educational settings. Huang et al. [33] found that the 4300 K condition from CCTs of 2700 K, 4300 K, and 6500 K resulted in significantly better focus levels and sustained attention in a research booth. However, the self-reported comfort did not reveal any significant difference among the three conditions. Shamsul et al. [2] found that CCTs of 4000 and 6500 K, among those of 3000 K, 4000 K, and 6500 K, were more beneficial for alertness and typing performances for both computer-based and paper-based activities. Pulay et al. [35] compared student on-task behaviours in an elementary school classroom with two CCT levels, 3000 K and 4100 K, for a duration of 5 months. They found that 4100 K CCT lighting conditions resulted in more on-task behaviours on the part of the students.

4.5. Limitations

The present study also faced limitations when determining the optimal CCT of 4000 K for educational settings. The study was conducted with a limited educational setting and a limited educational method. Educational activities can be carried out with papers as well as with monitors such as the tablet pad used in this study. There are many types of classrooms for educational settings, from a small seminar room to a large lecture hall. Notwithstanding the efforts to conduct the experiments in a real classroom, the educational setting and method have limited the generalization of the results.
The light reaching the eyes of the participants was not directly measured in this study. Its quantity and wavelength are not known and should be measured in future studies.
The CCT test sequence itself was in random order, but the order of the six sessions was fixed among the participants. Although the participants had enough time to refresh their memory of the test conditions before the next session, repeated participation might have affected the results, which was not considered in this study.

5. Conclusions

The effects of a correlated colour temperature of lighting on the brightness sensation, lighting perception, and working memory performance of students were investigated under moderate steady-state luminous conditions.
Brightness sensation was found to be affected by CCT. An increase in CCT led to an increase in brightness sensation; however, increased CCT did not linearly increase lighting comfort. Among three CCT levels, 3000 K, 4000 K, and 5700 K, the CCT of 4000 K was considered as the optimum level for lighting comfort in the educational settings used in this study. However, in comparison to comfort, higher levels of perceptual properties, satisfaction, and acceptance, were not affected by CCT from 3000 K to 5700 K. The scores on the working memory test were significantly affected by CCT and the illuminance level only for men. The effects of gender appeared in glare sensation and the working memory test. Women were sensitive to glare sensation and had a lower mean score in the working memory test than men. However, these phenomena have not been analysed and interpreted at this stage of the study.
The optimal CCT is more beneficial than increased illuminance in moderate ambient indoor lighting, as it provides better lighting comfort. Further research can look at the long-term effects of CCT on lighting perception depending on brain processing levels and diverse and in-depth cognitive performance, with more precise measurements at the human eye level.

Author Contributions

Conceptualization, W.Y.; methodology, W.Y. and J.Y.J.; formal analysis, W.Y.; investigation, W.Y.; resources, J.Y.J.; writing—original draft preparation, W.Y.; writing—review and editing, W.Y. and J.Y.J.; project administration, W.Y.; funding acquisition, W.Y. and J.Y.J. All authors have read and agreed to the published version of the manuscript.

Funding

This research was funded by the Ministry of Education, Republic of Korea, grant number 2018R1D1A1B07048157, supported by the Basic Science Research Program of the National Research Foundation (NRF). This work was funded by the Ministry of Science and ICT, Republic of Korea, grant number 2020R1A2C2009716, supported by the National Research Foundation of Korea (NRF).

Conflicts of Interest

The authors declare no conflict of interest.

Appendix A

Table A1. Digit span backward (DSB) and letter-number sequencing (LNS) from the K-WAIS-IV [38] (LNS: translated from Korean to English for publication).
NoTypeSet 1Set 2Set 3Set 4Set 5Set 6Set 7
1DSB582694629475316904827
Ans.285496926574613409728
2DSB7286643982794968879248719437
Ans.6827934697288694297817847349
3DSB42731758366584315486469173835862183
Ans.13724638573485668451719648538338126
4DSB392487619473537418724856517936625284728156
Ans.784293374916814735658427639715482526651827
5DSB4179386691742881493624739628757686248254353465182
Ans.6839714824719626394188269374268675753452842815643
6LNS2 Fri 7Tue 963 Thu 7Sat 9 FriWed 6 ThuFri 2 Tue93 Sat
Ans.27fri69tue37thu9frisat6wedthu2tuefri39sat
7LNSSat 3 Wed 57 Fri 4 ThuFri 9 Sat 6Mon 4 Thu 68 Sat 5 FriSat 1 Mon 77 Thu 5 Tue
Ans.35wedsat47thufri69frisat46monthu58frisat17monsat57tuethu
8LNS8 Tue 6 Wed 3Wed 4 Mon 2 Sat5 Fri 3 Tue 69 Wed 7 Thu 4Thu 6 Tue 3 Mon6 Sat 4 Wed 73 Mon 6 Fri Wed
Ans.368tuewed24monwedsat356tuefri479wedthu36montuethu467wedsat36monwedfri
9LNSTue 4 Fri 7 Sat 26 Mon 9 Wed 2 ThuFri 6 Wed 5 Tue 3Wed 5 Sat 8 Mon 37 Tue 1 Thu 3 FriSat 7 Thu 6 Wed 4Sat 2 Mon 4 Thu 3
Ans.247tuefrisat269monwedthu356tuewedfri358monwedsat137tuethufri467wedthusat234monthusat
10LNSMon 7 Fri 4 Sat 8 Tue9 Thu 2 Mon 3 Wed 7Tue 2 Thu 8 Fir 4 MonTue 8 Sat 5 Mon 9 Wed1 Fri 3 Tue 4 Thu 8Wed 3 Fri 9 Sat 5 TueFri 5 Tue 6 Thu 9 Mon
Ans.478montuefrisat2379monwedthu248montuethufri589montuewedsat1348tuethufri359tuewedfrisat569montuethufri

References

  1. Barkmann, C.; Wessolowski, N.; Schulte-Markwort, M. Applicability and efficacy of variable light in schools. Physiol. Behav. 2012, 105, 621–627. [Google Scholar] [CrossRef]
  2. Shamsul, B.; Sia, C.; Ng, Y.; Karmegan, K. Effects of light’s colour temperatures on visual comfort level, task performances, and alertness among students. Am. J. Public Health Res. 2013, 1, 159–165. [Google Scholar] [CrossRef] [Green Version]
  3. CIBSE. SSL Code for Lighting; The Society of Light and Lighting: Oxford, UK, 2012. [Google Scholar]
  4. IES. IESNA Lighting Handbook: Reference & Application; Illuminating Engineering Society of North America: New York, NY, USA, 2011. [Google Scholar]
  5. Korean Standards Association. KS A 3011: 1998 Recommended levels of illumination; KATS: Eumseong, Korea, 1998. [Google Scholar]
  6. Kruithof, A.A. Tubular Luminescence Lamps for General Illumination. Philips Tech. Rev. 1941, 6, 65–96. [Google Scholar]
  7. Boyce, P.R.; Cuttle, C. Effect of correlated colour temperature on the perception of interiors and colour discrimination performance. Light. Res. Technol. 1990, 22, 19–36. [Google Scholar] [CrossRef]
  8. Kakitsuba, N. Comfortable indoor lighting conditions evaluated from psychological and physiological responses. Leukos 2016, 12, 163–172. [Google Scholar] [CrossRef]
  9. Harrington, R. Effect of color temperature on apparent brightness. J. Opt. Soc. Am. 1954, 44, 113–116. [Google Scholar] [CrossRef]
  10. Fotios, S.; Levermore, G. Perception of electric light sources of different colour properties. Light. Res. Technol. 1997, 29, 161–171. [Google Scholar] [CrossRef]
  11. Ju, J.; Chen, D.; Lin, Y. Effects of correlated color temperature on spatial brightness perception. Color Res. Appl. 2012, 37, 450–454. [Google Scholar] [CrossRef]
  12. Kim, I.-T.; Jang, I.-H.; Choi, A.-S.; Sung, M. Brightness perception of white LED lights with different correlated colour temperatures. Indoor Built Environ. 2015, 24, 500–513. [Google Scholar] [CrossRef]
  13. Akashi, Y.; Boyce, P. A field study of illuminance reduction. Energy Build. 2006, 38, 588–599. [Google Scholar] [CrossRef]
  14. Wei, M.; Houser, K.W.; Orland, B.; Lang, D.H.; Ram, N.; Sliwinski, M.J.; Bose, M. Field study of office worker responses to fluorescent lighting of different CCT and lumen output. J. Environ. Psychol. 2014, 39, 62–76. [Google Scholar] [CrossRef]
  15. Baniya, R.R.; Tetri, E.; Halonen, L. A study of preferred illuminance and correlated colour temperature for LED office lighting. Light Eng. 2015, 23, 39–47. [Google Scholar]
  16. Yu, H.; Akita, T. The effect of illuminance and correlated colour temperature on perceived comfort according to reading behaviour in a capsule hotel. Build. Environ. 2019, 148, 384–393. [Google Scholar] [CrossRef]
  17. Lee, J.-H.; Moon, J.W.; Kim, S. Analysis of occupants’ visual perception to refine indoor lighting environment for office tasks. Energies 2014, 7, 4116–4139. [Google Scholar] [CrossRef]
  18. Islam, M.; Dangol, R.; Hyvärinen, M.; Bhusal, P.; Puolakka, M.; Halonen, L. User acceptance studies for LED office lighting: Lamp spectrum, spatial brightness and illuminance. Light. Res. Technol. 2015, 47, 54–79. [Google Scholar] [CrossRef]
  19. Wang, Q.; Xu, H.; Zhang, F.; Wang, Z. Influence of color temperature on comfort and preference for LED indoor lighting. Optik 2017, 129, 21–29. [Google Scholar] [CrossRef]
  20. Nakamura, H.; Karasawa, Y. Relationship between illuminance/color temperature and preference of atmosphere. J. Light Vis. Environ. 1999, 23, 29–38. [Google Scholar] [CrossRef] [Green Version]
  21. Park, B.-C.; Chang, J.-H.; Kim, Y.-S.; Jeong, J.-W.; Choi, A.-S. A study on the subjective response for corrected colour temperature conditions in a specific space. Indoor Built Environ. 2010, 19, 623–637. [Google Scholar] [CrossRef]
  22. Kocaoğlu, R. The Effects of Correlated Color Temperature on Sustained Attention and Mood of University Students in Learning Environments; Bilkent University: Çankaya, Ankara, Turkey, 2015. [Google Scholar]
  23. Davis, R.G.; Ginthner, D.N. Correlated color temperature, illuminance level, and the Kruithof curve. J. Illum. Eng. Soc. 1990, 19, 27–38. [Google Scholar] [CrossRef]
  24. Hu, X.; Houser, K.W.; Tiller, D.K. Higher color temperature lamps may not appear brighter. Leukos 2006, 3, 69–81. [Google Scholar] [CrossRef]
  25. Ru, T.; de Kort, Y.A.; Smolders, K.C.; Chen, Q.; Zhou, G. Non-image forming effects of illuminance and correlated color temperature of office light on alertness, mood, and performance across cognitive domains. Build. Environ. 2019, 149, 253–263. [Google Scholar] [CrossRef]
  26. Fotios, S. A revised Kruithof graph based on empirical data. Leukos 2017, 13, 3–17. [Google Scholar] [CrossRef] [Green Version]
  27. Deguchi, T.; Sato, M. The effect of color temperature of lighting sources on mental activity level. Ann. Physiol. Anthr. 1992, 11, 37–43. [Google Scholar] [CrossRef] [Green Version]
  28. Mukae, H.; Sato, M. The effect of color temperature of lighting sources on the autonomic nervous functions. Ann. Physiol. Anthr. 1992, 11, 533–538. [Google Scholar] [CrossRef] [Green Version]
  29. Noguchi, H.; Sakaguchi, T. Effect of illuminance and color temperature on lowering of physiological activity. Appl. Hum. Sci. J. Physiol. Anthr. 1999, 18, 117–123. [Google Scholar] [CrossRef] [Green Version]
  30. Navvab, M. A comparison of visual performance under high and low color temperature fluorescent lamps. J. Illum. Eng. Soc. 2001, 30, 170–175. [Google Scholar] [CrossRef]
  31. Boyce, P.; Akashi, Y.; Hunter, C.; Bullough, J. The impact of spectral power distribution on the performance of an achromatic visual task. Light. Res. Technol. 2003, 35, 141–156. [Google Scholar] [CrossRef]
  32. Yamagishi, M.; Yamaba, K.; Kubo, C.; Nokura, K.; Nagata, M. Effects of LED lighting characteristics on visual performance of elderly people. Gerontechnology 2008, 7, 243. [Google Scholar] [CrossRef]
  33. Huang, R.H.; Lee, L.; Chiu, Y.A.; Sun, Y. Effects of correlated color temperature on focused and sustained attention under white LED desk lighting. Color Res. Appl. 2015, 40, 281–286. [Google Scholar] [CrossRef]
  34. Luo, M.R.; Wang, M.; Liu, Y. The impact of LED lighting on people’s work performance between different age groups. In Proceedings of the 2018 15th China International Forum on Solid State Lighting: International Forum on Wide Bandgap Semiconductors China (SSLChina: IFWS), Shenzhen, Guangdong, China, 23–25 October 2018. [Google Scholar]
  35. Pulay, A.; Read, M.; Tural, E.; Lee, S. Examining Student Behavior under Two Correlated Color Temperature Levels of Lighting in an Elementary School Classroom. Educ. Plan. 2018, 23, 58–69. [Google Scholar]
  36. Boray, P.F.; Gifford, R.; Rosenblood, L. Effects of warm white, cool white and full-spectrum fluorescent lighting on simple cognitive performance, mood and ratings of others. J. Environ. Psychol. 1989, 9, 297–307. [Google Scholar] [CrossRef]
  37. Davis, R.G.; Garza, A. Task lighting for the elderly. J. Illum. Eng. Soc. 2002, 31, 20–32. [Google Scholar] [CrossRef]
  38. Wechsler, D. Korean Wechsler Adult Intelligence Scale–IV; K-WAIS-IV; Psychology Co., Ltd.: Deagu, Korea, Korea, 2008; Volume 22. [Google Scholar]
  39. Wechsler, D. Wechsler Adult Intelligence Scale–Fourth Edition (WAIS–IV); Pearson Assessments: San Antonio, TX, USA, 2008. [Google Scholar]
  40. Reips, U.-D.; Funke, F. Interval-level measurement with visual analogue scales in Internet-based research: VAS Generator. J. Behav. Res. Methods 2008, 40, 699–704. [Google Scholar] [CrossRef] [PubMed]
  41. Yang, W.; Moon, H.J.; Jeon, J.Y. Comparison of response scales as measures of indoor environmental perception in combined thermal and acoustic conditions. Sustainability 2019, 11, 3975. [Google Scholar] [CrossRef] [Green Version]
  42. Pirenne, M.H. Dark Adaptation and Night Vision. In The Eye; Chapter 5; Davson, H., Ed.; Academic Press: London, UK, 1962; Volume 2. [Google Scholar]
  43. Budescu, D.V.; Appelbaum, M.I. Variance Stabilizing Transformations and the Power of the F Test. J. Educ. Stat. 1981, 6, 55–74. [Google Scholar] [CrossRef]
  44. Goldstein, E.B.; Brockmole, J. Sensation and Perception; Cengage Learning: Boston, MA, USA, 2016. [Google Scholar]
  45. Manav, B. An experimental study on the appraisal of the visual environment at offices in relation to colour temperature and illuminance. Build. Environ. 2007, 42, 979–983. [Google Scholar] [CrossRef]
  46. Kakitsuba, N. Comfortable indoor lighting conditions for LEDlights evaluated from psychological and physiological responses. Appl. Ergon. 2020, 82, 102941. [Google Scholar] [CrossRef]
  47. Rodriguez, R.; Yamín Garretón, J.; Pattini, A. Glare and cognitive performance in screen work in the presence of sunlight. Light. Res. Technol. 2016, 48, 221–238. [Google Scholar] [CrossRef]
Figure 1. Classroom layout.
Sustainability 12 04051 g001
Figure 2. Classroom photos (a) 1050lx 3000 K, (b) 1050lx 4000 K, (c) 1050lx 5700 K, (d) 650lx 3000 K, (e) 650lx 4000 K, (f) 650lx 5700 K.
Sustainability 12 04051 g002
Figure 3. Experimental procedure.
Sustainability 12 04051 g003
Figure 4. Measurement points for luminance levels on tablets: (a) Measurement points, (b) Mean luminance of 7 tablets at 5700 K and 1050 lx.
Sustainability 12 04051 g004
Figure 5. Brightness and darkness according to the correlated colour temperature (CCT) at each illuminance level (means and 95% confidence intervals).
Sustainability 12 04051 g005
Figure 6. Warmness and coolness according to CCT at each illuminance level (means and 95% confidence intervals).
Sustainability 12 04051 g006
Figure 7. Glare from desk, wall, tablet, and light according to CCT at each illuminance level (means and 95% confidence intervals).
Sustainability 12 04051 g007
Figure 8. Comfort, satisfaction, and acceptance according to CCT at each illuminance level (means and 95% confidence intervals).
Sustainability 12 04051 g008
Figure 9. Working memory test scores (means and 95% confidence intervals).
Sustainability 12 04051 g009
Table 1. Lighting configurations (mean measurement values).
3000 K3000 K4000 K4000 K5700 K5700 K
650 lx1050 lx650 lx1050 lx650 lx1050 lx
Illuminance (lx)653106063710446411080
CCT (K)306630804046406757895778
Table 2. Results of the ANOVA and Bonferroni post hoc test for bright, dark, warm, and cool (Means with different letters are significantly different. A > B > C in a column).
CCTNBrightDarkWarmCool
3000 KMean1206.77B2.088A8.124A1.389C
4000 KMean1207.25AB2.111A7.154B2.245B
5700 KMean1207.35A1.753A3.003C6.553A
F 3.171.10207.84206.61
P 0.0430.3340.0000.000
IlluminanceNBrightDarkWarmCool
650 lxMean1806.601B2.546A6.133A3.309A
1050 lxMean1807.643A1.422B6.053A3.482A
F 26.6827.860.140.6
P 0.0000.0000.7120.439
Table 3. Results of the ANOVA and Bonferroni post hoc test for glare according to gender (Means with different letters are significantly different. A > B in a column).
GenderNDeskWallTabletLight
WomenMean1804.14674A3.59669A5.12652A5.81955A
MenMean1802.88198B2.33956B4.05747B4.87637B
F 4.565.424.9414.05
P 0.0060.020.0270.000
Table 4. Results of the ANOVA and Bonferroni post hoc test for comfort, satisfaction, and acceptance (Means with different letters are significantly different. A > B in a column).
CCT, OverallNComfortSatisfactionAcceptance
3000Mean1207.45AB7.15A8.04A
4000Mean1207.56A7.50A8.12A
5700Mean1206.93B7.18A8.19A
F 3.341.070.23
P 0.0360.3430.797
CCT, 650 lxNComfortSatisfactionAcceptance
3000Mean607.404A7.133A8.061A
4000Mean607.396A7.306A7.920A
5700Mean606.999A7.195A8.163A
F 0.790.400.29
P 0.4570.9010.752
CCT, 1050 lxNComfortSatisfactionAcceptance
3000Mean607.491A7.168A8.023A
4000Mean607.720A7.705A8.321A
5700Mean606.864A7.158A8.223A
F 2.951.350.48
P 0.0550.2620.622
Table 5. Results of the ANOVA and Bonferroni post hoc test for working memory score (Means with different letters are significantly different.).
GenderNScoreScore By CCTScore by Illuminance
3000 K4000 K5700 K 650 lx1050 lx
N = 60N = 60N = 60FPN = 90N = 90FP
MenMean1809.5289.2889.6679.6333.290.0409.6899.3715.720.018
WomenMean1809.2919.4509.6339.3002.520.0839.2339.3480.640.426
F 5.98
P 0.015

