Reciprocity and Veto Power in Relation-Specific Investments: An Experimental Study


Abstract
1. Introduction
2. Literature
2.1. Relation-Specific Investment and the Hold-up Problem
2.2. Economics Experiments on Hold-up Game
2.3. Behavioral Game Theory and Hold-up Game
2.4. Sustainability and Hold-up Game
3. Experiment Design and Hypotheses
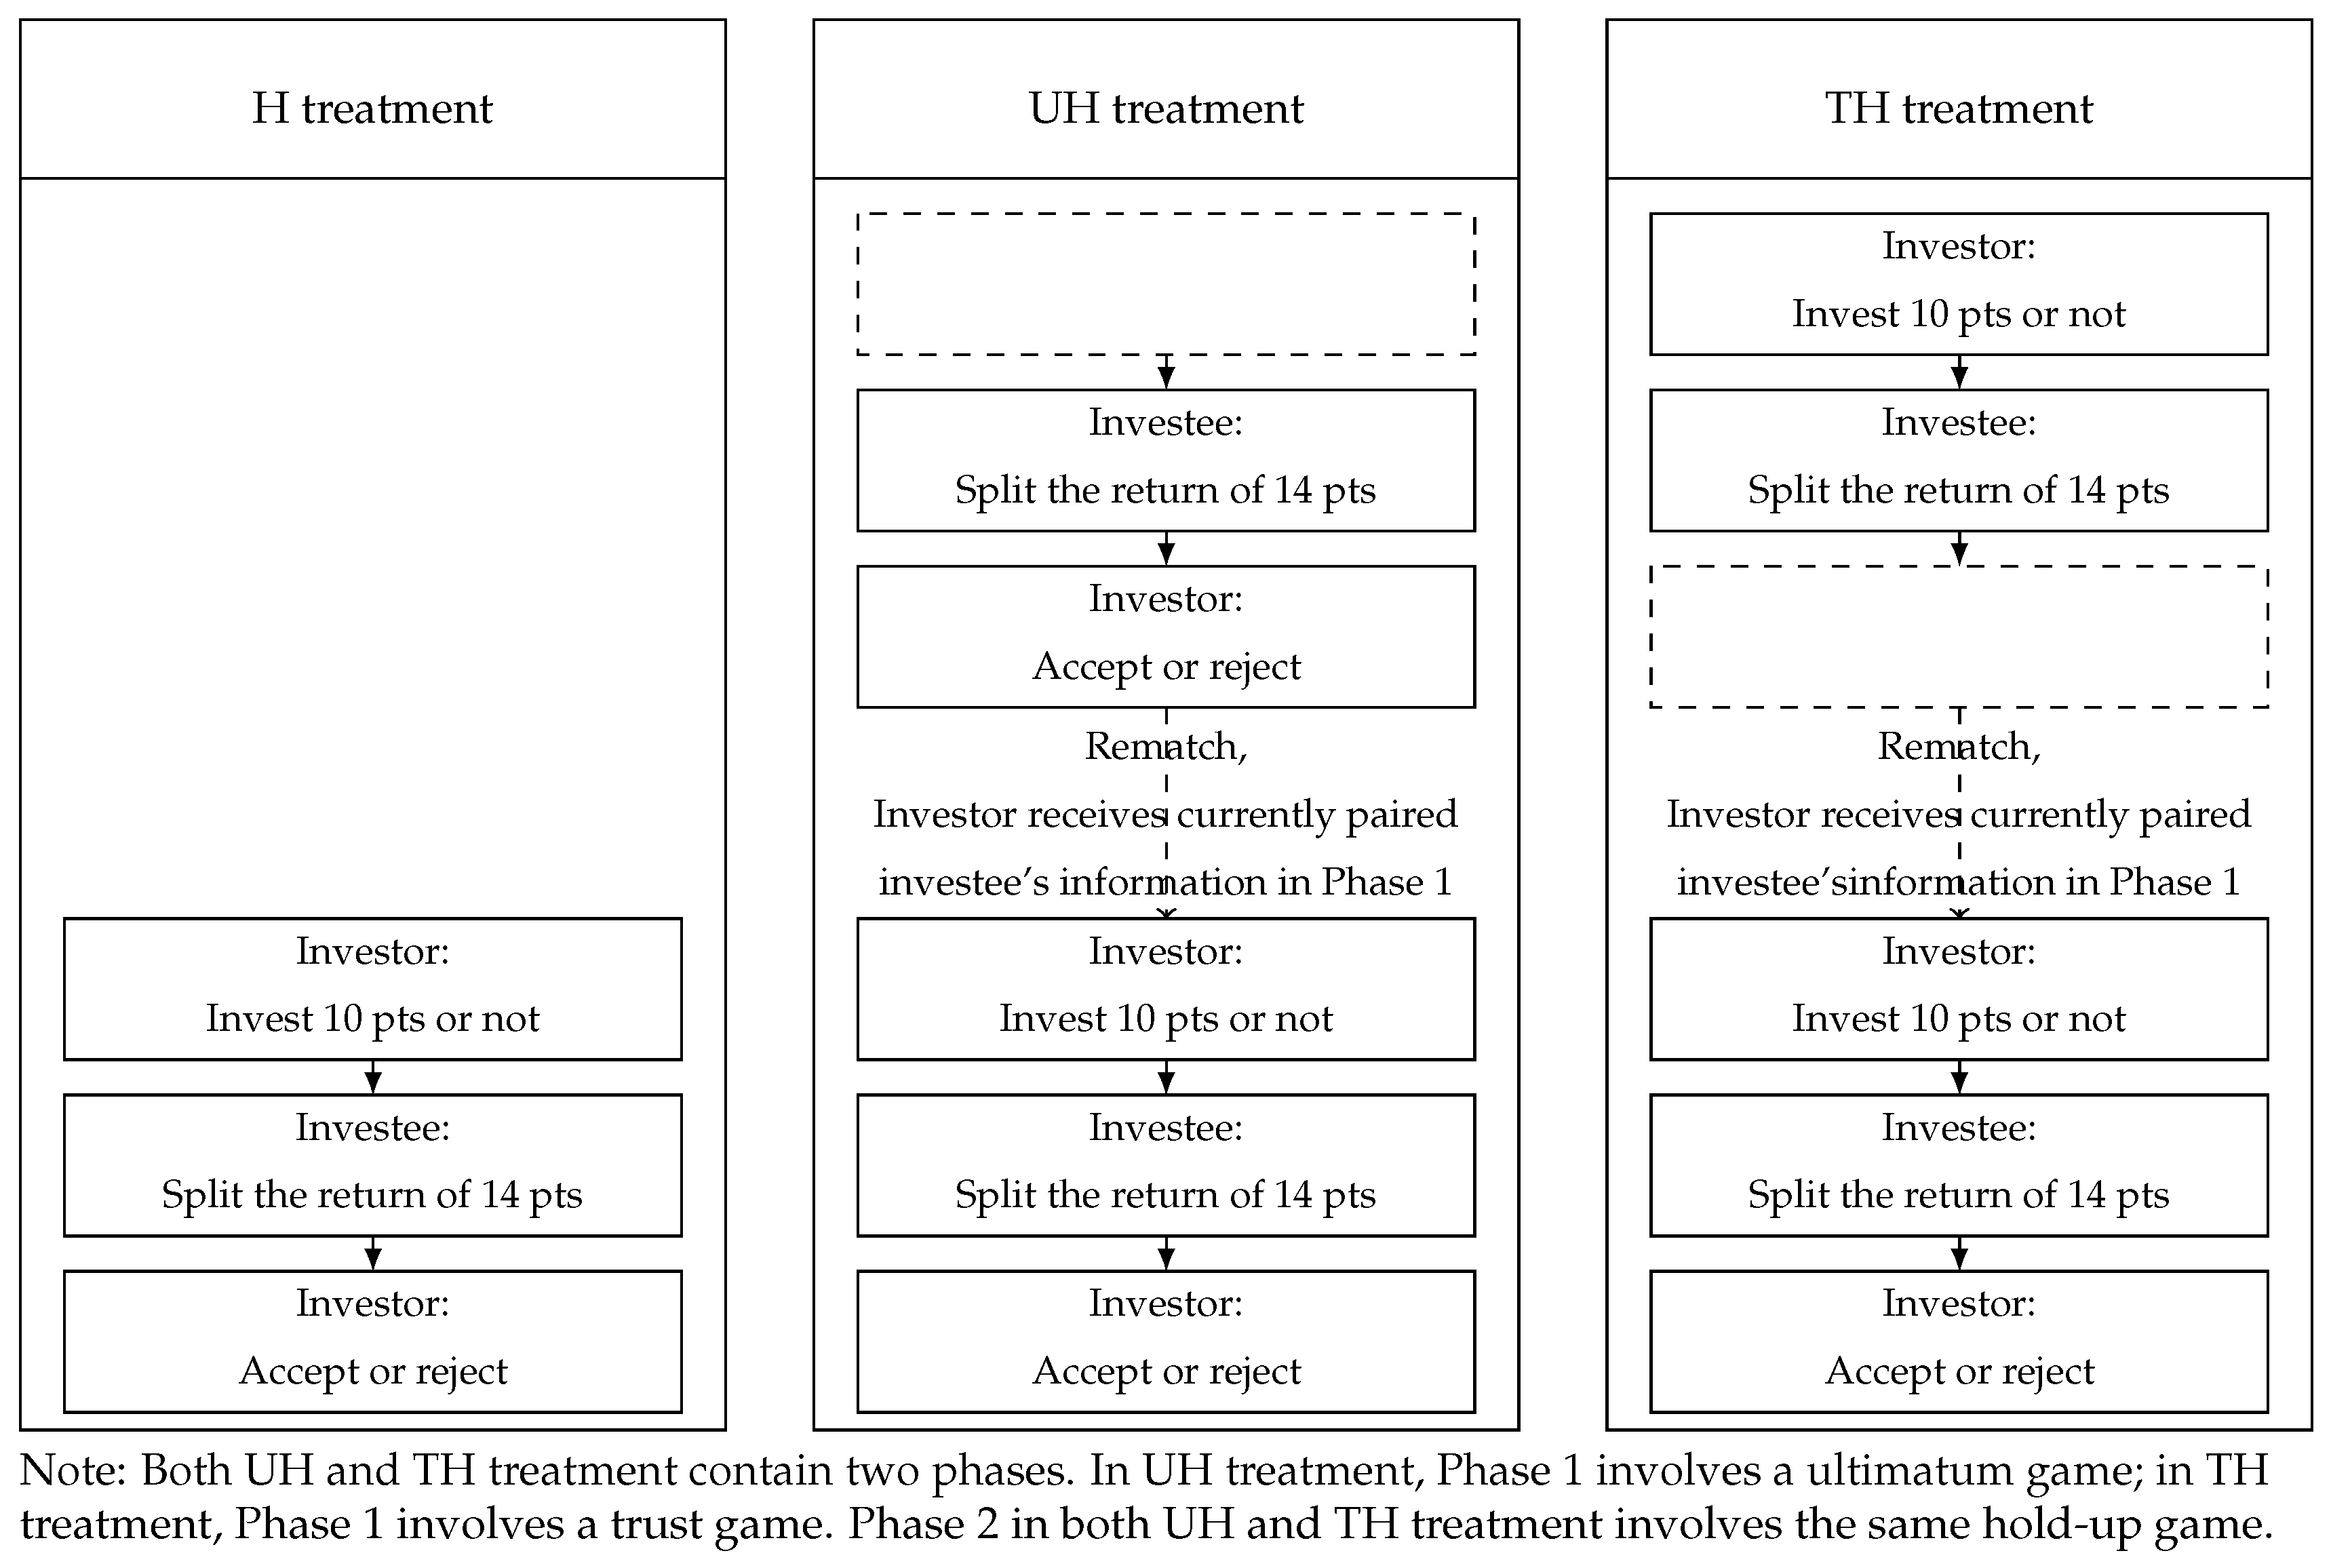
3.1. Design and Procedures
3.2. Hypotheses
4. Results
4.1. The Effects of Reciprocity and Veto Option on Investees’ Choices
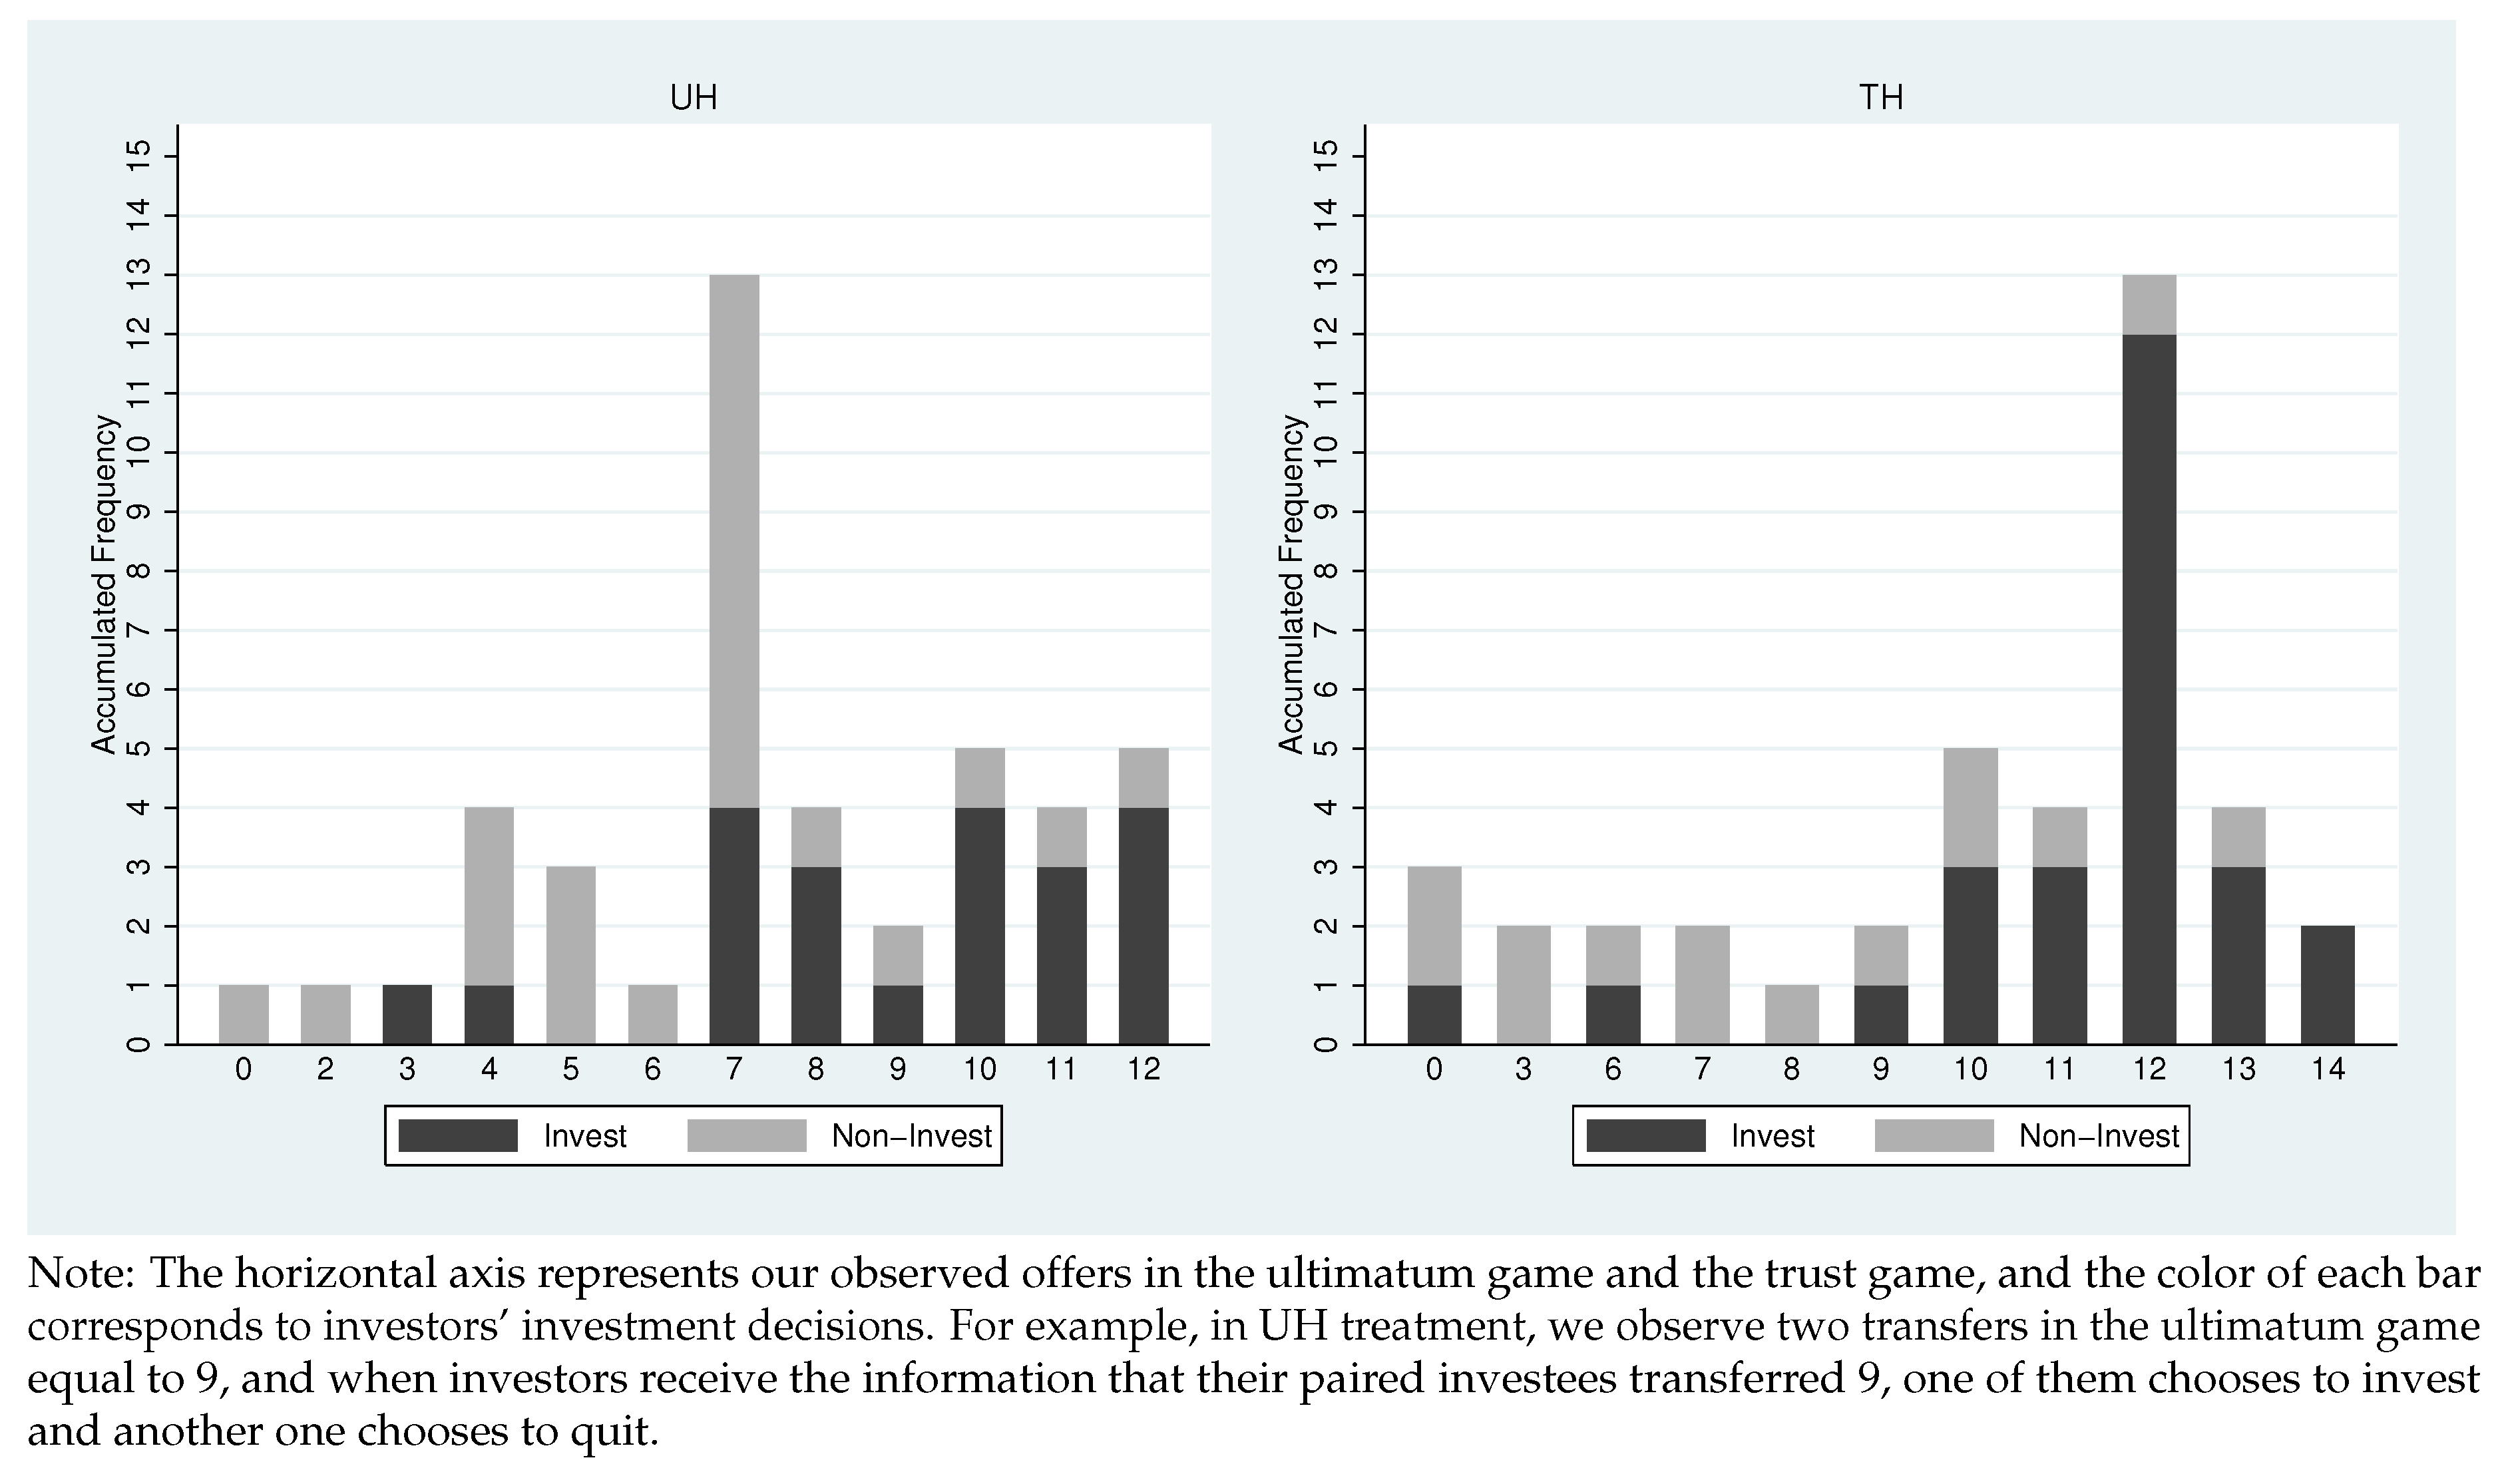
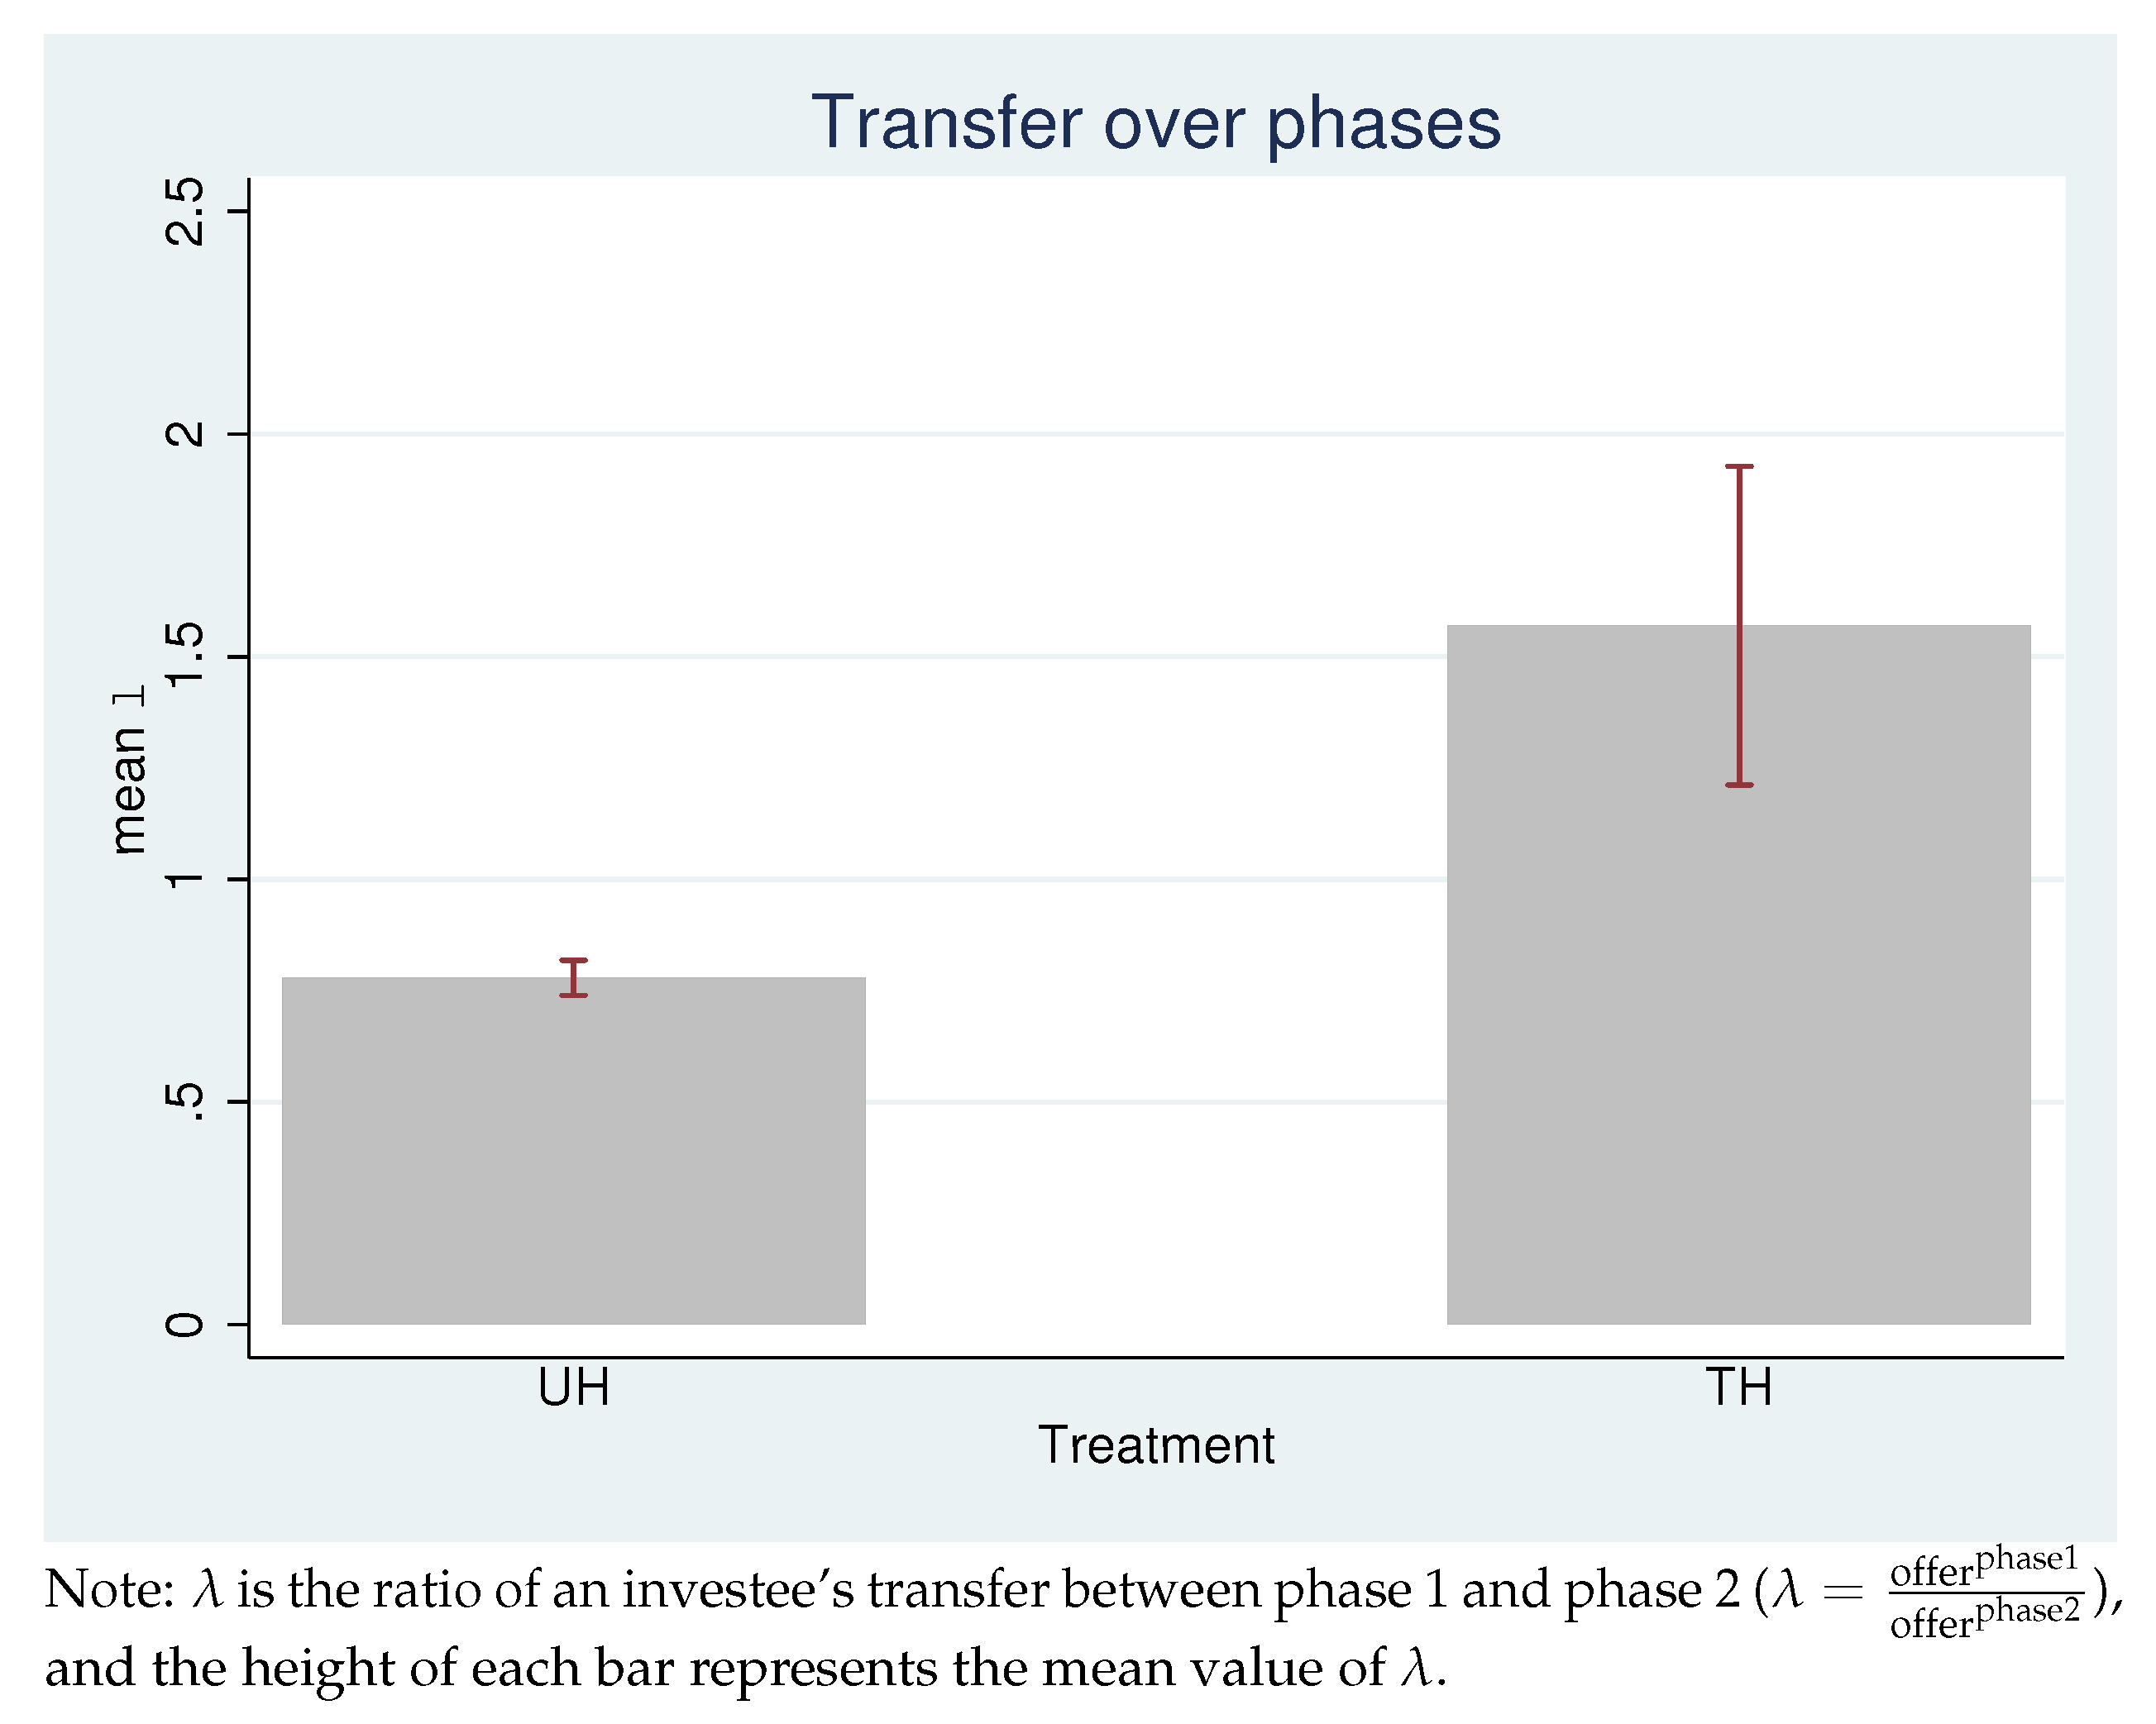
4.2. Investors’ Performance under the Controlled Information Disclosure
4.3. Investors’ Optimal Choices and Their Real Choices
5. Discussion and Conclusions
Author Contributions
Funding
Acknowledgments
Conflicts of Interest
Appendix A. Additional Analysis

Appendix B. Translation of the Experimental Instruction
- At the beginning of the first stage, Role A will be randomly paired with another Role B.
- There is zero experimental token in the initial account of role A, and 10 experimental tokens in the initial account of Role B.
- There exists a revenue of 14 experimental tokens, and Role B will determine how to distribute the revenue between Role A and Role B.
- How to distribute the 14 experimental tokens will be explained below:
- (a)
- The first step: Role B proposes an allocation: A gets X experimental tokens and B gets 14-X experimental tokens.
- (b)
- The second step: A chooses to accept or reject B’s proposal.
- If A accepts B’s proposal, then A obtains X of the 14 experimental tokens, and B gets 14-X experimental tokens. In this case, A’s return is X experimental tokens, and B’s return is 10+ (14-X) experimental tokens.
- If A rejects B’s proposal, the 14 experimental tokens will disappear, and neither A nor B can obtain this revenue (zero experimental token). A’s return in this decision is zero experimental token, and B’s return is 10 experimental tokens, which is his initial account balance.
- At the beginning of the first stage, Role A will be randomly paired with another Role B.
- All Role A and B will have 10 experimental tokens in initial accounts at the beginning of the first phase.
- Each pair of A and B will make an investment-distribution decision. The rules are as follows:
- (a)
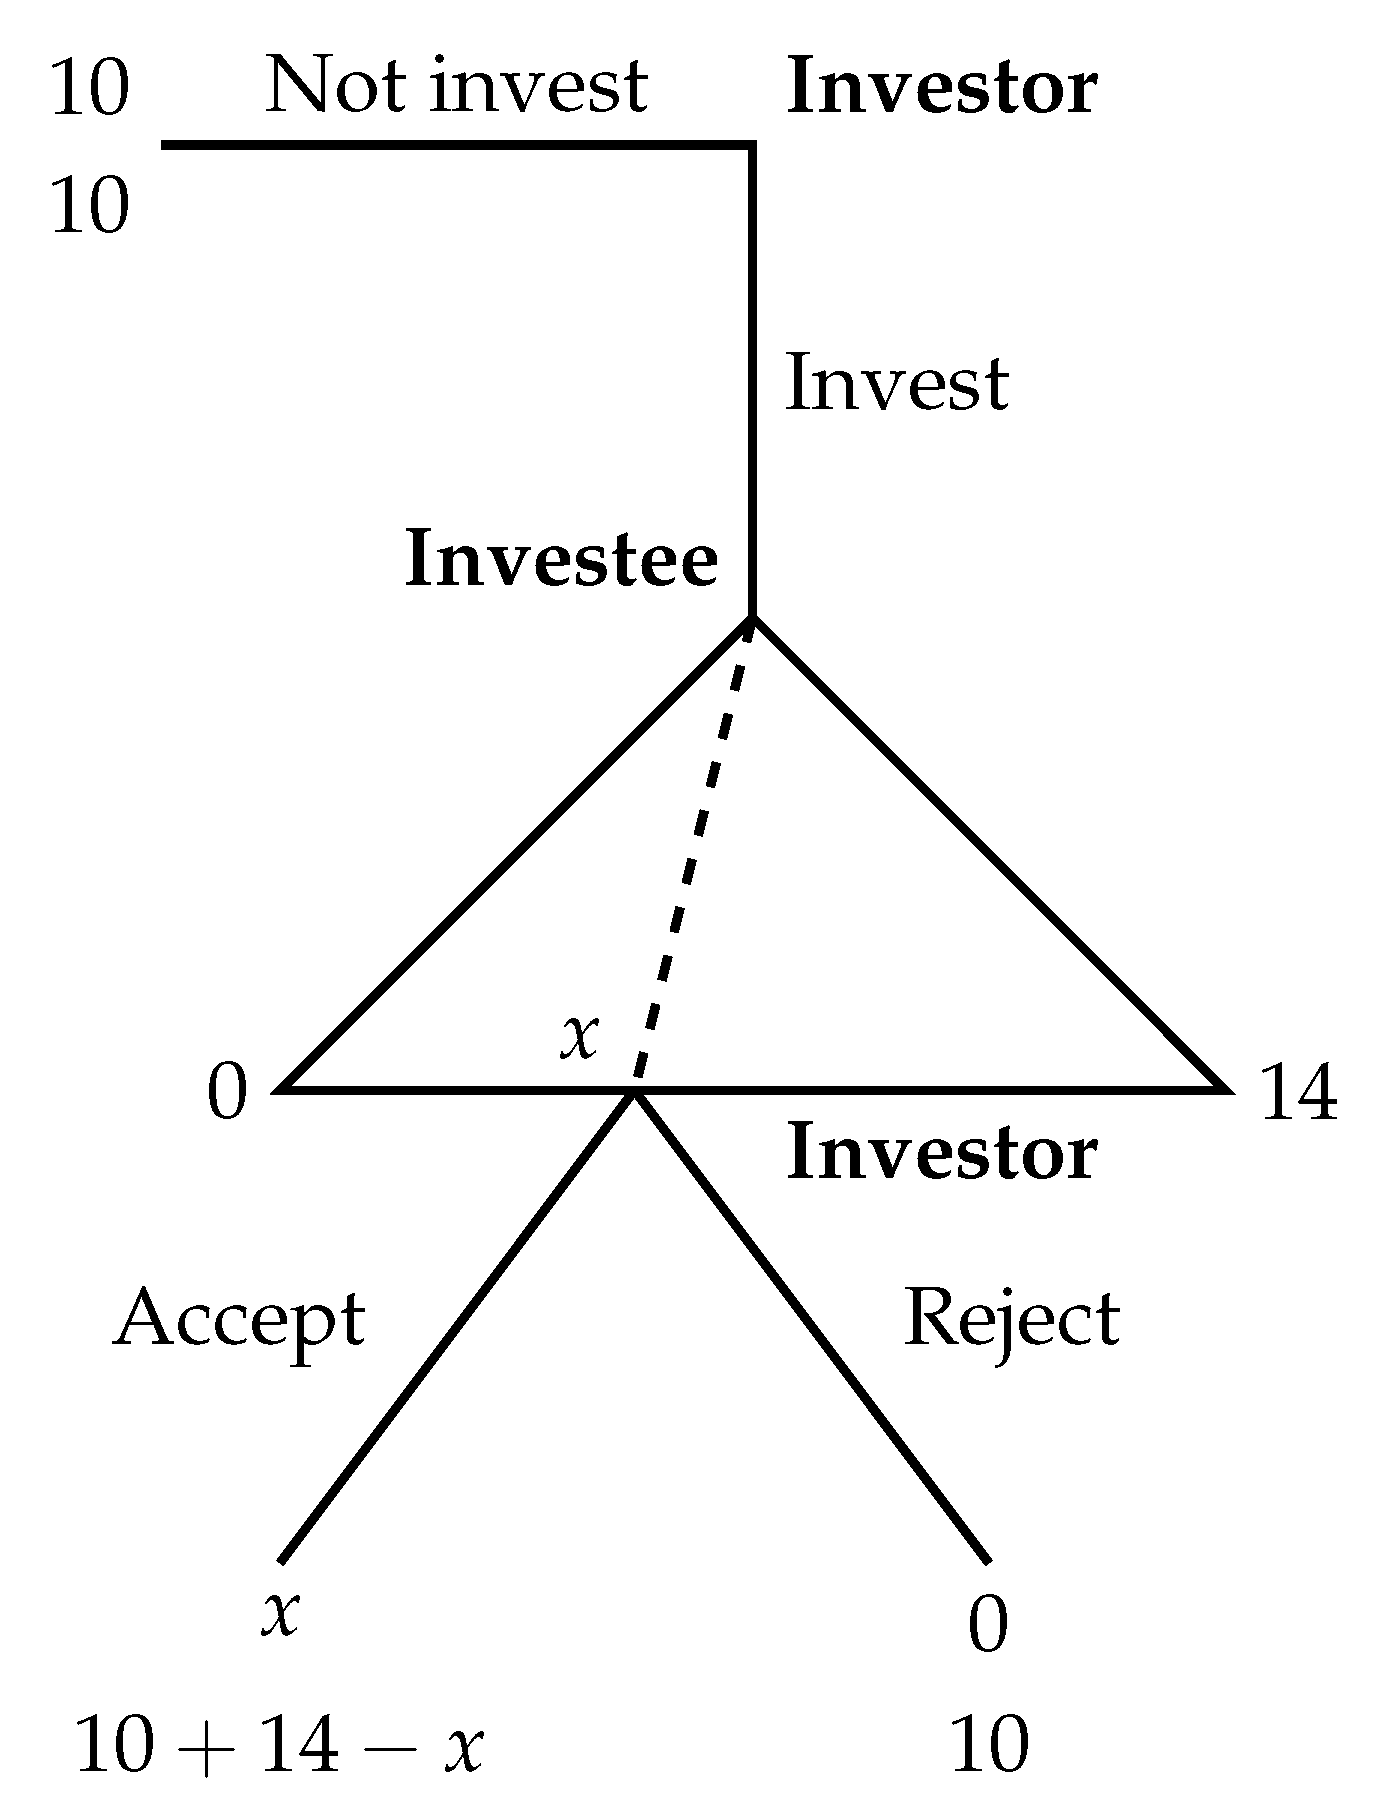
- If Role A decides not to invest, the experiment is ended. Both A and B’s earnings are 10 experimental tokens, which equal the initial account balance.
- (b)
- If Role A decides to invest (the investment costs 10 experimental tokens), the investment will generate a revenue value of 14 experimental tokens.
How to distribute the 14 experimental tokens will be explained below:- (a)
- The first step: Role B proposes an allocation: A gets X experimental tokens and B gets 14-X experimental tokens.
- (b)
- The second step: Roles A and B divide the revenue value of 14 experimental tokens according to A’s proposal.
- (c)
- A’s return is X experimental tokens, and B’s return is 10+ (14-X) experimental tokens.
- At the beginning of the second phase, Role A will be randomly paired again with another Role B.
- All Role A and B will have 10 experimental tokens in initial accounts at the beginning of the second phase.
- Each pair of A and B will make an investment-distribution decision. The rules are as follows:
- (a)
- If Role A decides not to invest, the experiment is ended. Both A and B’s earnings are 10 experimental tokens, which equal the initial account balance.
- (b)
- If Role A decides to invest (investment costs 10 experimental tokens), the investment will generate a revenue value of 14 experimental tokens.
How to distribute the 14 experimental tokens will be explained below:- (a)
- The first step: Role B proposes an allocation proposal: A gets X experimental tokens and B gets 14-X experimental tokens.
- (b)
- The second step: A chooses to accept or reject B’s proposal.
- If A accepts B’s proposal, then A obtains X of the 14 experimental tokens, and B gets 14-X experimental tokens. In this case, A’s return in this decision is X experimental tokens, and B’s return is 10+ (14-X) experimental tokens.
- If A rejects B’s proposal, the 14 experimental tokens will disappear, and neither A nor B can obtain this revenue (0 experimental token). In this case, A’s return in this decision is 0 experimental token, and B’s return is 10 experimental tokens, which is his initial account balance.
References
- Williamson, O.E. The Vertical Integration of Production: Market Failure Considerations. Am. Econ. Rev. 1971, 61, 112–123. [Google Scholar]
- Klein, B.; Crawford, R.G.; Alchian, A.A. Vertical integration, appropriable rents, and the competitive contracting process. J. Law Econ. 1978, 21, 297–326. [Google Scholar] [CrossRef]
- Grossman, S.J.; Hart, O.D. The costs and benefits of ownership: A theory of vertical and lateral integration. J. Political Econ. 1986, 94, 691–719. [Google Scholar] [CrossRef]
- Holmstrom, B.; Roberts, J. The boundaries of the firm revisited. J. Econ. Perspect. 1998, 12, 73–94. [Google Scholar] [CrossRef]
- Hart, O.; Moore, J. Contracts as reference points. Q. J. Econ. 2008, 123, 1–48. [Google Scholar] [CrossRef]
- Maskin, E.; Moore, J. Implementation and renegotiation. Rev. Econ. Stud. 1999, 66, 39–56. [Google Scholar] [CrossRef]
- Hart, O. Incomplete Contracts and Control. Am. Econ. Rev. 2017, 107, 1731–1752. [Google Scholar] [CrossRef]
- Yang, Y. A Survey of the Hold-up Problem in the Experimental Economics Literature; SSRN Scholarly Paper ID 3203629; Social Science Research Network: Rochester, NY, USA, 2018. [Google Scholar] [CrossRef]
- Haruvy, E.; Katok, E.; Ma, Z.; Sethi, S. Relationship-specific investment and hold-up problems in supply chains: Theory and experiments. Bus. Res. 2019, 12, 45–74. [Google Scholar] [CrossRef]
- Dufwenberg, M.; Smith, A.; Van Essen, M. Hold-Up: With a Vengeance. Econ. Inq. 2013, 51, 896–908. [Google Scholar] [CrossRef]
- Ellingsen, T.; Johannesson, M. Promises, threats and fairness. Econ. J. 2004, 114, 397–420. [Google Scholar] [CrossRef]
- Sloof, R.; Oosterbeek, H.; Sonnemans, J. Does making specific investments unobservable boost investment incentives? J. Econ. Manag. Strategy 2007, 16, 911–942. [Google Scholar] [CrossRef][Green Version]
- Berg, J.; Dickhaut, J.; McCabe, K. Trust, reciprocity, and social history. Games Econ. Behav. 1995, 10, 122–142. [Google Scholar] [CrossRef]
- Brown, M.; Falk, A.; Fehr, E. Relational contracts and the nature of market interactions. Econometrica 2004, 72, 747–780. [Google Scholar] [CrossRef]
- Attanasi, G.; Battigalli, P.; Nagel, R. Disclosure of Belief-Dependent Preferences in a Trust Game; Technical Report 506; IGIER (Innocenzo Gasparini Institute for Economic Research), Bocconi University: Milan, Italy, 2013. [Google Scholar]
- Attanasi, G.; Battigalli, P.; Manzoni, E.; Nagel, R. Belief-dependent preferences and reputation: Experimental analysis of a repeated trust game. J. Econ. Behav. Organ. 2019, 167, 341–360. [Google Scholar] [CrossRef]
- Ellingsen, T.; Johannesson, M. Is There a Hold-up Problem? Scand. J. Econ. 2004, 106, 475–494. [Google Scholar] [CrossRef]
- Hoppe, E.I.; Schmitz, P.W. Can contracts solve the hold-up problem? Experimental evidence. Games Econ. Behav. 2011, 73, 186–199. [Google Scholar] [CrossRef]
- Morita, H.; Servátka, M. Group identity and relation-specific investment: An experimental investigation. Eur. Econ. Rev. 2013, 58, 95–109. [Google Scholar] [CrossRef]
- Güth, W.; Schmittberger, R.; Schwarze, B. An experimental analysis of ultimatum bargaining. J. Econ. Behav. Organ. 1982, 3, 367–388. [Google Scholar] [CrossRef]
- Selten, R. Die Strategiemethode zur Erforschung des eingeschränkt rationalen Verhaltens im Rahmen eines Oligopolexperiments; JCB Mohr (Paul Siebeck): Tübingen, Germany, 1967; pp. 136–168. [Google Scholar]
- Regner, T. Reciprocity under moral wiggle room: Is it a preference or a constraint? Exp. Econ. 2018, 21, 779–792. [Google Scholar] [CrossRef]
- Joskow, P.L. Vertical Integration. Antitrust Bull. 2012. [Google Scholar] [CrossRef]
- Williamson, O.E. Transaction-cost economics: The governance of contractual relations. J. Law Econ. 1979, 22, 233–261. [Google Scholar] [CrossRef]
- Shleifer, A.; Vishny, R.W. A Survey of Corporate Governance. J. Financ. 1997, 52, 737–783. [Google Scholar] [CrossRef]
- Wagner, A.F.; Wenk, C. Agency versus Hold-up: Benefits and Costs of Shareholder Rights. Agency versus Hold-up: Benefits and Costs of Shareholder Rights. SSRN Sch. Pap. 2019. [Google Scholar] [CrossRef]
- Hitt, M.A.; Hoskisson, R.E.; Johnson, R.A.; Moesel, D.D. The Market for Corporate Control and Firm Innovation. Acad. Manag. J. 1996, 39, 1084–1119. [Google Scholar]
- Lundstrum, L.L. Corporate investment myopia: A horserace of the theories. J. Corp. Financ. 2002, 8, 353–371. [Google Scholar] [CrossRef]
- Hart, O.; Moore, J. Default and Renegotiation: A Dynamic Model of Debt. Q. J. Econ. 1998, 113, 1–41. [Google Scholar] [CrossRef]
- Hart, O.; Moore, J. A Theory of Debt Based on the Inalienability of Human Capital. Q. J. Econ. 1994, 109, 841–879. [Google Scholar] [CrossRef]
- Aghion, P.; Bolton, P. An Incomplete Contracts Approach to Financial Contracting. Rev. Econ. Stud. 1992, 59, 473. [Google Scholar] [CrossRef]
- Cox, J.C. How to identify trust and reciprocity. Games Econ. Behav. 2004, 46, 260–281. [Google Scholar] [CrossRef]
- Fehr, E.; List, J.A. The hidden costs and returns of incentives–trust and trustworthiness among CEOs. J. Eur. Econ. Assoc. 2004, 2, 743–771. [Google Scholar] [CrossRef]
- Cox, J.C.; Friedman, D.; Sadiraj, V. Revealed Altruism. Econometrica 2008, 76, 31–69. [Google Scholar] [CrossRef]
- Cox, J.C.; Ostrom, E.; Walker, J.M.; Castillo, A.J.; Coleman, E.; Holahan, R.; Schoon, M.; Steed, B. Trust in Private and Common Property Experiments. South. Econ. J. 2009, 75, 957–975. [Google Scholar]
- Cox, J.C.; Hall, D.T. Trust with Private and Common Property: Effects of Stronger Property Right Entitlements. Games 2010, 1, 527–550. [Google Scholar] [CrossRef]
- Cox, J.C.; Servátka, M.; Vadovič, R. Status quo effects in fairness games: Reciprocal responses to acts of commission versus acts of omission. Exp. Econ. 2017, 20, 1–18. [Google Scholar] [CrossRef]
- Cox, J.C.; Friedman, D.; Gjerstad, S. A tractable model of reciprocity and fairness. Games Econ. Behav. 2007, 59, 17–45. [Google Scholar] [CrossRef]
- Geanakoplos, J.; Pearce, D.; Stacchetti, E. Psychological games and sequential rationality. Games Econ. Behav. 1989, 1, 60–79. [Google Scholar] [CrossRef]
- Attanasi, G.; Nagel, R. A survey of psychological games: Theoretical findings and experimental evidence. In Games, Rationality and Behavior. Essays on Behavioral Game Theory and Experiments; Palgrave McMillan Houndmills: London, UK, 2008; pp. 204–232. [Google Scholar]
- Rabin, M. Incorporating fairness into game theory and economics. Am. Econ. Rev. 1993, 83, 1281–1302. [Google Scholar]
- Dufwenberg, M.; Kirchsteiger, G. A theory of sequential reciprocity. Games Econ. Behav. 2004, 47, 268–298. [Google Scholar] [CrossRef]
- Bacharach, M.; Guerra, G.; Zizzo, D.J. The Self-Fulfilling Property of Trust: An Experimental Study. Theory Decis. 2007, 63, 349–388. [Google Scholar] [CrossRef]
- Stanca, L.; Bruni, L.; Corazzini, L. Testing theories of reciprocity: Do motivations matter? J. Econ. Behav. Organ. 2009, 71, 233–245. [Google Scholar] [CrossRef]
- Toussaert, S. Intention-based reciprocity and signaling of intentions. J. Econ. Behav. Organ. 2017, 137, 132–144. [Google Scholar] [CrossRef]
- Fehr, E.; Hart, O.; Zehnder, C. Contracts as Reference Points—Experimental Evidence. Am. Econ. Rev. 2011, 101, 493–525. [Google Scholar] [CrossRef]
- Hart, S.L.; Milstein, M.B. Creating Sustainable Value. Acad. Manag. Perspect. 2003, 17, 56–67. [Google Scholar] [CrossRef]
- Florea, L.; Cheung, Y.H.; Herndon, N.C. For All Good Reasons: Role of Values in Organizational Sustainability. J. Bus. Ethics 2013, 114, 393–408. [Google Scholar] [CrossRef]
- Fassin, Y. Stakeholder Management, Reciprocity and Stakeholder Responsibility. J. Bus. Ethics 2012, 109, 83–96. [Google Scholar] [CrossRef]
- Ortmann, A. Deception. In Handbook of Research Methods and Applications in Experimental Economics; Edward Elgar Publishing: Cheltenham, UK, 2019; ISBN 9781788110563. [Google Scholar]
- Charness, G.; Samek, A.; van de Ven, J. To Deceive or Not to Deceive: The Debate about Deception in Economics. 2019. Available online: https://healthpolicy.usc.edu/evidence-base/to-deceive-or-not-to-deceive-the-debate-about-deception-in-economics/ (accessed on 13 May 2020).
- Fischbacher, U. z-Tree: Zurich toolbox for ready-made economic experiments. Exp. Econ. 2007, 10, 171–178. [Google Scholar] [CrossRef]
- Roth, A.E. Bargaining experiments. In Handbook of Experimental Economics; Princeton University Press: Princeton, NJ, USA, 1995; pp. 253–348. [Google Scholar]
- Gneezy, U.; Rustichini, A. Pay enough or don’t pay at all. Q. J. Econ. 2000, 115, 791–810. [Google Scholar] [CrossRef]
- Attanasi, G.; Boun My, K. Jeu du dictateur et jeu de la confiance: Préférences distributives vs préférences dépendantes des croyances. L’Actualité Econ. 2016, 92, 249–287. [Google Scholar]
- Shepherd, D.A.; Zacharakis, A. The venture capitalist-entrepreneur relationship: Control, trust and confidence in co-operative behaviour. Ventur. Cap. Int. J. Entrep. Financ. 2001, 3, 129–149. [Google Scholar] [CrossRef]
- Huang, L.; Knight, A.P. Resources and Relationships in Entrepreneurship: An Exchange Theory of the Development and Effects of the Entrepreneur-Investor Relationship. Acad. Manag. Rev. 2015, 42, 80–102. [Google Scholar] [CrossRef]


| H Treatment | UH Treatment | TH Treatment | ||
|---|---|---|---|---|
| (No Information) | (Information) | (Information) | ||
| Number of Subject Pairs | ||||
| Phase 1 | Investment rate | - | - | 0.63 |
| Average offer | - | 7.66 | 9.70 | |
| Investee’s belief on investor’s WTA | - | 6.57 | - | |
| Investors’ average WTA | - | 5.18 | - | |
| Acceptance rate | - | 0.77 | - | |
| Phase 2 | Investment rate | 0.67 | 0.48 | 0.65 |
| Average offer | 9.56 | 9.86 | 8.78 | |
| Investee’s belief on investor’s WTA | 8.14 | 9.45 | 9.15 | |
| Investors’ average WTA | 6.69 | 6.00 | 5.77 | |
| Acceptance rate | 0.79 | 0.90 | 0.85 |
| Coefficients | UH Treatment | TH Treatment | H Treatment | |
|---|---|---|---|---|
| Phase One | 0.6415(0.1784) | 1.0514(0.0597) | - | |
| 0.7810(0.1291) | 1.1877(0.0484) | - | ||
| Phase Two | 0.6285(0.2112) | 0.7358(0.2319) | 1.0887(0.1324) | |
| Average | 1.1206(0.0785) | 0.9993(0.1231) | 0.5446(0.3156) | |
| Constant | 0.4211(0.4040) | 0.4323(0.3675) | - | |
| Past offer | 0.0999(0.0616) | 0.0572(0.0317) | - | |
| N | 43 | 44 | 40 |
© 2020 by the authors. Licensee MDPI, Basel, Switzerland. This article is an open access article distributed under the terms and conditions of the Creative Commons Attribution (CC BY) license (http://creativecommons.org/licenses/by/4.0/).
Share and Cite
Zheng, K.; Wang, X.; Ni, D.; Yang, Y. Reciprocity and Veto Power in Relation-Specific Investments: An Experimental Study. Sustainability 2020, 12, 4027. https://doi.org/10.3390/su12104027
Zheng K, Wang X, Ni D, Yang Y. Reciprocity and Veto Power in Relation-Specific Investments: An Experimental Study. Sustainability. 2020; 12(10):4027. https://doi.org/10.3390/su12104027
Chicago/Turabian StyleZheng, Kaiming, Xiaoyuan Wang, Debing Ni, and Yang Yang. 2020. "Reciprocity and Veto Power in Relation-Specific Investments: An Experimental Study" Sustainability 12, no. 10: 4027. https://doi.org/10.3390/su12104027
APA StyleZheng, K., Wang, X., Ni, D., & Yang, Y. (2020). Reciprocity and Veto Power in Relation-Specific Investments: An Experimental Study. Sustainability, 12(10), 4027. https://doi.org/10.3390/su12104027