Article

Change Management, Digital Maturity, and Green Development: Are Successful Firms Leveraging on Sustainability?

Corvinus University of Budapest, 1093 Budapest, Hungary
*
Author to whom correspondence should be addressed.
Sustainability 2020, 12(10), 4019; https://doi.org/10.3390/su12104019
Submission received: 9 April 2020 / Revised: 8 May 2020 / Accepted: 11 May 2020 / Published: 14 May 2020
(This article belongs to the Section Economic and Business Aspects of Sustainability)

Abstract

:
The purpose of this paper is to capture firms’ perceptions on the relationship between change management, digitalization, business performance, and green development. The adaptation of digital technologies has challenged the business environment, leading to a major incorporation of the role of entrepreneurs in the process of fostering green development. Building on data from a survey study with 270 Small and Medium Enterprises (SMEs) and large companies located in a relatively developed Hungarian region and adopting the Strategic Action Field (SAF) theory, firms’ perceptions on change management, digital maturity, and green development were explored. The data was analyzed using partial least squares structural equation modelling (PLS-SEM). Results revealed that change management has a direct positive effect on digital maturity and on business performance and has a small effect on companies’ commitment towards green development. This paper contributes to the debate on the relationship between digitalization and green development within entrepreneurial organizations.

1. Introduction

The investigation of change and development in organizations is one of the most relevant themes in management studies [1,2]. Recently, the global scenario has radically been transformed due to the ongoing pandemic of coronavirus disease and the economic fallout generated by the lockdown in different countries. It seems that the embracing of digitalization and the transformation of business organizations integrating digital technologies have become paramount for the survival of firms [3]. In this study, digital maturity refers to the competitive advantages gained by a firm in transforming its fundamental business processes into digital processes. Such transformation is led by change management integrated within the organizational culture [4]. Prior research has suggested that digital maturity embedded across the business processes can increase benefits from current strategic assets when it is integrated within a wider corporate strategy [5]. Furthermore, digital maturity entails organization transformation, thus, changes in strategy and structure need to be managed to improve business performance [6].
Digitalization is considered to be an efficient tool to support sustainable environmental, social, and economic development [7]. Information and communication technologies (ICT) can improve emission reduction, waste management, and production cleanliness, and can enhance the implementation of green development strategies to benefit the ecosystem in which firms operate. To reach sustainability goals, green development needs to be supported by organizational change within a firm [8]. Still, as it has been acknowledged, organizational change is difficult to implement, and a wide range of firms struggle to cope with digitalization connected to products, services, and business operations in general [1,9,10]. As Li et al. [5] argued, SME entrepreneurs’ capabilities are often limited, and the firms’ digital transformation is enforced by the ecosystem in which they operate. In the case of SMEs, the founders, owners, or top managers are in charge to lead digital transformation and analyze the position the firm holds compared to their competitors. Thus, a better understanding of their views on digital transformation and sustainability is essential to capture the ongoing processes in moderately competitive regions. The discussion on SMEs and large companies’ digitalization has revealed the managerial and operational challenges of this transformation [4].
Based on the above mentioned studies, this research aims to investigate the relationship between digital maturity, change management, green development, and business performance in a region where foreign direct investments and state-led investments are key to the survival of firms. The main contribution of this research is the empirical investigation of the role digital maturity plays in the commitment to invest in green development to foster sustainability. The article is structured as follows: In Section 2, change management, digitalization, and sustainability are framed, adopting the Strategic Action Field (SAF) theory, and hypotheses are discussed. In Section 3, the research design and methods explain the constructs and scales applied in the survey and justify the use of partial least squares structural equation (PLS-SEM) to investigate the relationship between digital maturity, change management, green development, and business performance. In Section 4, the results show that change management has a direct positive effect on digital maturity and on green development. Finally, managerial implications, research limits, and future research paths are discussed.

2. Theoretical Background

Globalization has generated the interconnectedness of industries, but business processes and activities are still concentrated regionally. In relatively developed but dynamically growing European regions, the creation of industrial hubs and targeted financial incentives enhance economic performance [11]. Policymakers in several European regions have recognized the role firms and entrepreneurs play in regional development and have stimulated the creation of a supportive ecosystem [11,12]. Regional productivity is associated with creativity, innovation, change management, and digital skills linked to entrepreneurship. The complexity of change management within the public and private sector across different industries is strongly influenced by the economic, political, social, and cultural environment of the ecosystem in which firms operate [13]. A firm’s capability to allocate resources to manage change in structure, strategy, and processes in a continuously evolving business scenario evolves through the actions of business actors, managers, and employees [3].
Adopting Fligstein and McAdam’s [14] Strategic Action Field (SAF) theory to change management, we argue that digitalization can be perceived as either a threat or an opportunity and challenges the rules and practices that were once taken for granted. To leverage on digitalization as an opportunity, collective action within the firm needs to be based on shared understandings of the benefits of digitalization. In SAF theory, a firm is a strategic action field that interacts in the ecosystem with its competitors, different market forces, and social movements [14,15]. Fruitful exploitation of resources, capabilities, and the path development to renew business processes can be achieved when change management is led by intrafirm communication and the sharing of common interests and benefits [3]. As prior research has evidenced, pitfalls along this transformation process cannot be avoided, thus, change management needs to be implemented to gain competitive advantage within the industry [3,4,5].
This leads to our first hypothesis:
Hypothesis 1.
Change management has a positive effect on digital maturity.
Applying SAF theory, it can be identified that the successful introduction of structural, strategic, or production changes highly rely on the capabilities of top-managers/founders to make change part of the firms’ organizational culture [5,14]. Searching for continuous improvement requires firms to develop new competencies and to use resources and capabilities to reach competitive advantage. Thus, how and what the firm is able to perform is determined by such capabilities. A firm with strong capabilities and commitment is able to deploy proactive strategies that benefit the firm and its environment. Having a commitment to green development is unlikely to create financial benefits, but in combination with managerial capabilities to drive organizational change and to implement new structural, strategic, or productive processes, financial benefits may be gained [14,16]. Thus, we predict that:
Hypothesis 2.
Change management has a positive effect on business performance.
Hypothesis 3.
Change management has a positive effect on green development.
Firms across different sectors have recognized that investments in infrastructures to foster the digital transformation of operations, production processes, and strategy are paramount to gaining competitive advantage and generating increased business performance [3,4,8]. The digital maturity of a firm means that the managers/owners of the company are familiar with existing digital tools and applications and are better at adopting and deploying such tools and applications compared to their competitors. Thus, we can postulate that:
Hypothesis 4.
Digital maturity has a positive effect on business performance.
Digitalization-led sustainability transition can act on multiple levels and can have micro- and macro-perspectives linked to the firm’s sustainability goals. As Stuart Hart already claimed in 1995, the interaction between a firm’s organization and the surrounding natural environment is compelling and will allow it to gain competitive advantage in the long-term. For this reason, Hart and Dowell [16] position sustainable development among the three key strategic capabilities following pollution-prevention and product stewardship. Firms adopting a sustainable development strategy do less environmental damage and consider the wider social as well as the economic sustainability aspects of their operations [17]. As prior research has evidenced, firms and organizations are hesitant to adopt sustainability strategies because the financial benefits of such investment can hardly be traced in the short-term [16]. The exhaustive digitalization firms are undergoing, and the digital maturity of successful companies, can foster the adaptation of sustainability strategies as well. Thus, in line with the above considerations, the following hypotheses are proposed:
Hypothesis 5.
Digital maturity has a positive effect on green development.
A firm’s proactive environmental commitment is often referred to as a moral obligation towards society and as a contribution to reach sustainable development goals (www.un.org). Past literature shows that investment in green development has costs and can occur due to pressure or as part of a corporate social responsibility strategy [17,18]. The question whether green development could lead to better business performance has been widely debated [19,20,21]. The debate is centered around the issue of whether high-cost scheme activities such as investment in renewable energy and waste management—which do not lead to immediate economic benefit—create competitive advantage in the long run [22]. Zeng et al. [21] evidenced the strong relationship between business performance and environmental performance while analyzing firms in the Chinese manufacturing industry. Cantele and Zardini [22] highlighted the fact that sustainability should be approached strategically, not only in large companies but also in SMEs, to attain improved performance. Past literature [23,24] evidences that the optimal condition to invest in sustainability (green development) occurs when change management is part of the organizational culture and business performance is solid. Thus, we should expect that healthy business performance perceived by firm owners and top managers could stimulate the intention of firms to invest in green development.
Hypothesis 6.
Business performance has a positive effect on green development.

3. Research Design and Methods

3.1. Research Instrument

A structured questionnaire survey with multi-item scales for construct measurement was employed as a research instrument. For the survey development, the evidence-based guidelines of Churchill and Peter [25] and Diamantopoulos et al. [26] were followed. In this section, we provide a rational of the selection and a definition of each construct. The four constructs (business performance, change management, digital maturity, green development) used in this study were elaborated based on a review of literature streams in strategic management and sustainability [1,2,27]. These initial definitions were tested to assess answer scale validity using short open-ended interviews with a sample of (n = 10) managing directors of different SMEs who were asked about green development, change management, and digitalization. Based on the data from the short interviews, multiple (n = 17) items to measure the four constructs were elaborated. In the next phase, five experts from business and academia were asked to validate the items’ consistency. Only the 13 items on which all the experts agreed were inserted in the survey. The items used in the survey were all pre-tested on a smaller sample size of entrepreneurs and business owners, and then a pilot study with a sample of firms situated in the region under scrutiny was performed.

3.2. Construct Definition

For the constructs, the guidelines set out by Diamantopoulos et al. [26] were followed. For each scale-item, we assessed respondents’ perceptions on a 4-point and 5-point Likert-type scale, respectively, as explained in the next paragraphs. The decision to use different point-scales is due to the specific features of this survey design, which is a joint questionnaire measuring many other constructs that are not analyzed in this study. According to Hair et al. [28] “PLS-SEM applications must use standardized data for the indicators as an input for running the algorithm.” In the survey, the estimation procedure was standardized, which eliminated the apparent incongruity of using 4-point and 5-point scales.

3.2.1. Change Management

Change management is understood as a firm’s capability to allocate resources to manage strategic change in a continuously evolving business scenario [15,19,20,28]. Change management refers to the extent to which such capability is embedded within corporate culture [29]. The construct was modelled as a reflective construct using four self-developed items based on prior literature. The self-developed items to measure the construct were: “In our company, change management is recognized as part of our corporate culture”, “Our firm has the capability to manage strategic change in ongoing processes”, “Our managing directors/founders are constantly looking for innovation opportunities”, and “In comparison with our competitors, our company has significantly more capability in change management” (Cronbach α = 0.93).

3.2.2. Digital Maturity

Firms of almost all industries have introduced a series of initiatives to exploit digital transformation to increase business performance, productivity, or sales [30]. We use the term digitalization to refer to the transition from traditional business activities to the conducting of business in a digital form [3]. Thus, digital maturity can be defined as the degree of completion of the digital transformation of a firm compared to its industry peers [31]. This construct is conceived as highly relevant to help firms survive in the current social and economic crisis caused by the COVID-19 pandemic. Self-developed scale items were: “In comparison with other firms in our industry, digital solutions in our firm are more developed”, “In comparison with our competitors, digital transformation in our firm is substantially more advanced”, and “Our firm is a leader in digital transformation within the sector.” Scale validity is good (Cronbach α = 0.96).

3.2.3. Business Performance

Business performance is defined by the most relevant financial metrics of a firm [31,32]. In line with prior studies, using the most common measures of the output of a firm’s performance, in our survey, business performance was captured by three widely used measures: market share, revenue-to profit, and return on equity [31,32]. Congruent with prior studies, and because objective measures are confidential, we relied on perceptual performance measures [33,34]. Past studies show that the correlation between perceived performance and objective business performance is high and, in some cases, perceived performance even proves to be more reliable [22]. In this specific survey, respondents (owners or top-managers) are key decision-makers in their firms; thus, it can be reasonably assumed that they are aware of the current operational condition of their companies [35]. The opinions of key decision makers are considered to be expert judgements and are based on more complex layers than objective performance indicators. Respondents expressed their opinion of whether these indicators had increased or decreased in the last five years (1 = significantly decreased, 5 = significantly increased). Scale validity is good (Cronbach α = 0.93).

3.2.4. Green Development

Green development is indicated by a firm’s future willingness to engage in different green development projects such as green energy investments, waste management, and green environmental development [36,37]. The three self-developed items aim to measure the extent to which a firm is engaged in investments fostering green development. These investments are highly relevant for environmental sustainability and for corporate social responsibility as well [4]. Scale items were: “Our firm is committed to invest in public sector development projects in green energy”, “Our firm is committed to invest in public sector development projects in waste-management”, and “Our firm is committed to invest in public sector development projects in green environmental development (e.g., parks)”. Scale validity is good (Cronbach α = 0.90). These items were measured on a 4-point Likert-scale.

3.3. Sample Description

Hungary, a Central-Eastern-European country, presents strong national disparities between the capital city, Budapest, and rural areas [38]. The Central Transdanubian Region, with a population of 1,055,570, is relatively developed and presents moderate productivity growth, according to Organisation for Economic Co-operation and Development OECD [39]. The Central Transdanubian Region consists of three country seats—Székesfehérvár, Veszprém, and Tatabánya—and the region is an important hub for mechatronic, logistical, and environment industry [40]. During the economic and financial crisis in 2008, firms operating in the Central Transdanubian Region experienced deep decline and slow recovery [41]. Recently, this region has experienced a significant infrastructural and economic development due to the Hungarian Goverment’s Modern Cities Program (2015–2022), which allocated structural funds to territorial development [40]. In 2020, Central Transdanubian has been the Hungarian region with the highest GDP, but firms are heavily dependent on foreign direct investment and strategic state-led investments [40,41]. Thus, this region is particularly interesting to explore the relationship between change management, digitalization, and green development within entrepreneurial organizations.
Our survey targeted mechatronic, logistical, and manufacturing SMEs and large companies in the Central Transdanubian Region of Hungary (Table 1), situated along the Vienna-Budapest axis, which provides companies with a favorable location.
To minimize data bias, firms relative to the region under scrutiny were randomly selected from the database of the Chamber of Industry and Commerce in Hungary, in which membership is mandatory. The structured questionnaire was administered to the firms’ managing directors, founders, or owners by data collectors. All data collectors were provided with a detailed survey protocol to assure consistency. The constructs were measured based on respondents’ perceptions, a technique that has been widely applied in studies on management, e.g., [22,42,43]. A total of 270 SMEs and large companies were surveyed. The data was collected using a hard copy of the questionnaire between 9 December 2019 and 15 February 2020; thus, before the lockdown.

3.4. Data Analysis

The exploratory study investigated the perceived influence of change management, digital maturity, and business performance on green development. The model was tested using Partial Least Scale Structural Equation Modeling (PLS-SEM), which is suitable where theory is less developed [28]. PLS-SEM has been widely used in business and strategic management studies [28,44]. The use of PLS-SEM is justified by (1) the exploratory nature of this study; (2) the small (270) sample size; (3) the scale development assessed in this study in which items are measured on a 5-point and 4-point Likert-type scale, respectively (se, e.g., [28]). According to Henseler et al. [45] “PLS path modeling requires metric data for the dependent variables. Dependent variables are the indicators of the factor model(s) as well as the endogenous constructs. Quasi-metric data stemming from multi-point scales such as Likert scales or semantic differential scales is also acceptable as long as the scale points can be assumed to be equidistant.” ADANCO software was employed for data analysis; internal consistency, convergent validity, and discriminant validity were measured in order to avoid the risk of systematic measurement error.

4. Results

4.1. Model Measurement

Factor loadings were used to assess the properties of constructs to test convergent validity. All factor loadings were well above the favorable 0.7 value in each case [28]. Dijkstra and Henseler’s [46] ρA values provide evidence of internal consistency, and ρA is the most important reliability measure. The index applied to measure convergent validity is average variance extracted (AVE), where values should be above 0.5 in each construct [28]. The AVE can be found on the diagonal of Table 2, and shows that our data meet this required criteria.
Discriminant validity was examined using two methods. First, with Fornell and Larcker’s test, which demonstrated that, in all cases, the AVE measurement was larger than the squared latent variable correlations (Table 2). Second, in accordance with the established guidelines [28], the heterotrait-heteromethod ratio of correlations (HTMT) was measured. As shown in Table 3, all HTMT ratios were significantly smaller than one, and thus discriminant validity was found to be appropriate.
In sum, enough statistical evidence was found to verify (a) the existence of the four constructs, (b) that the measured variables are appropriate indicators of the related factors, and (c) that the constructs are distinct.

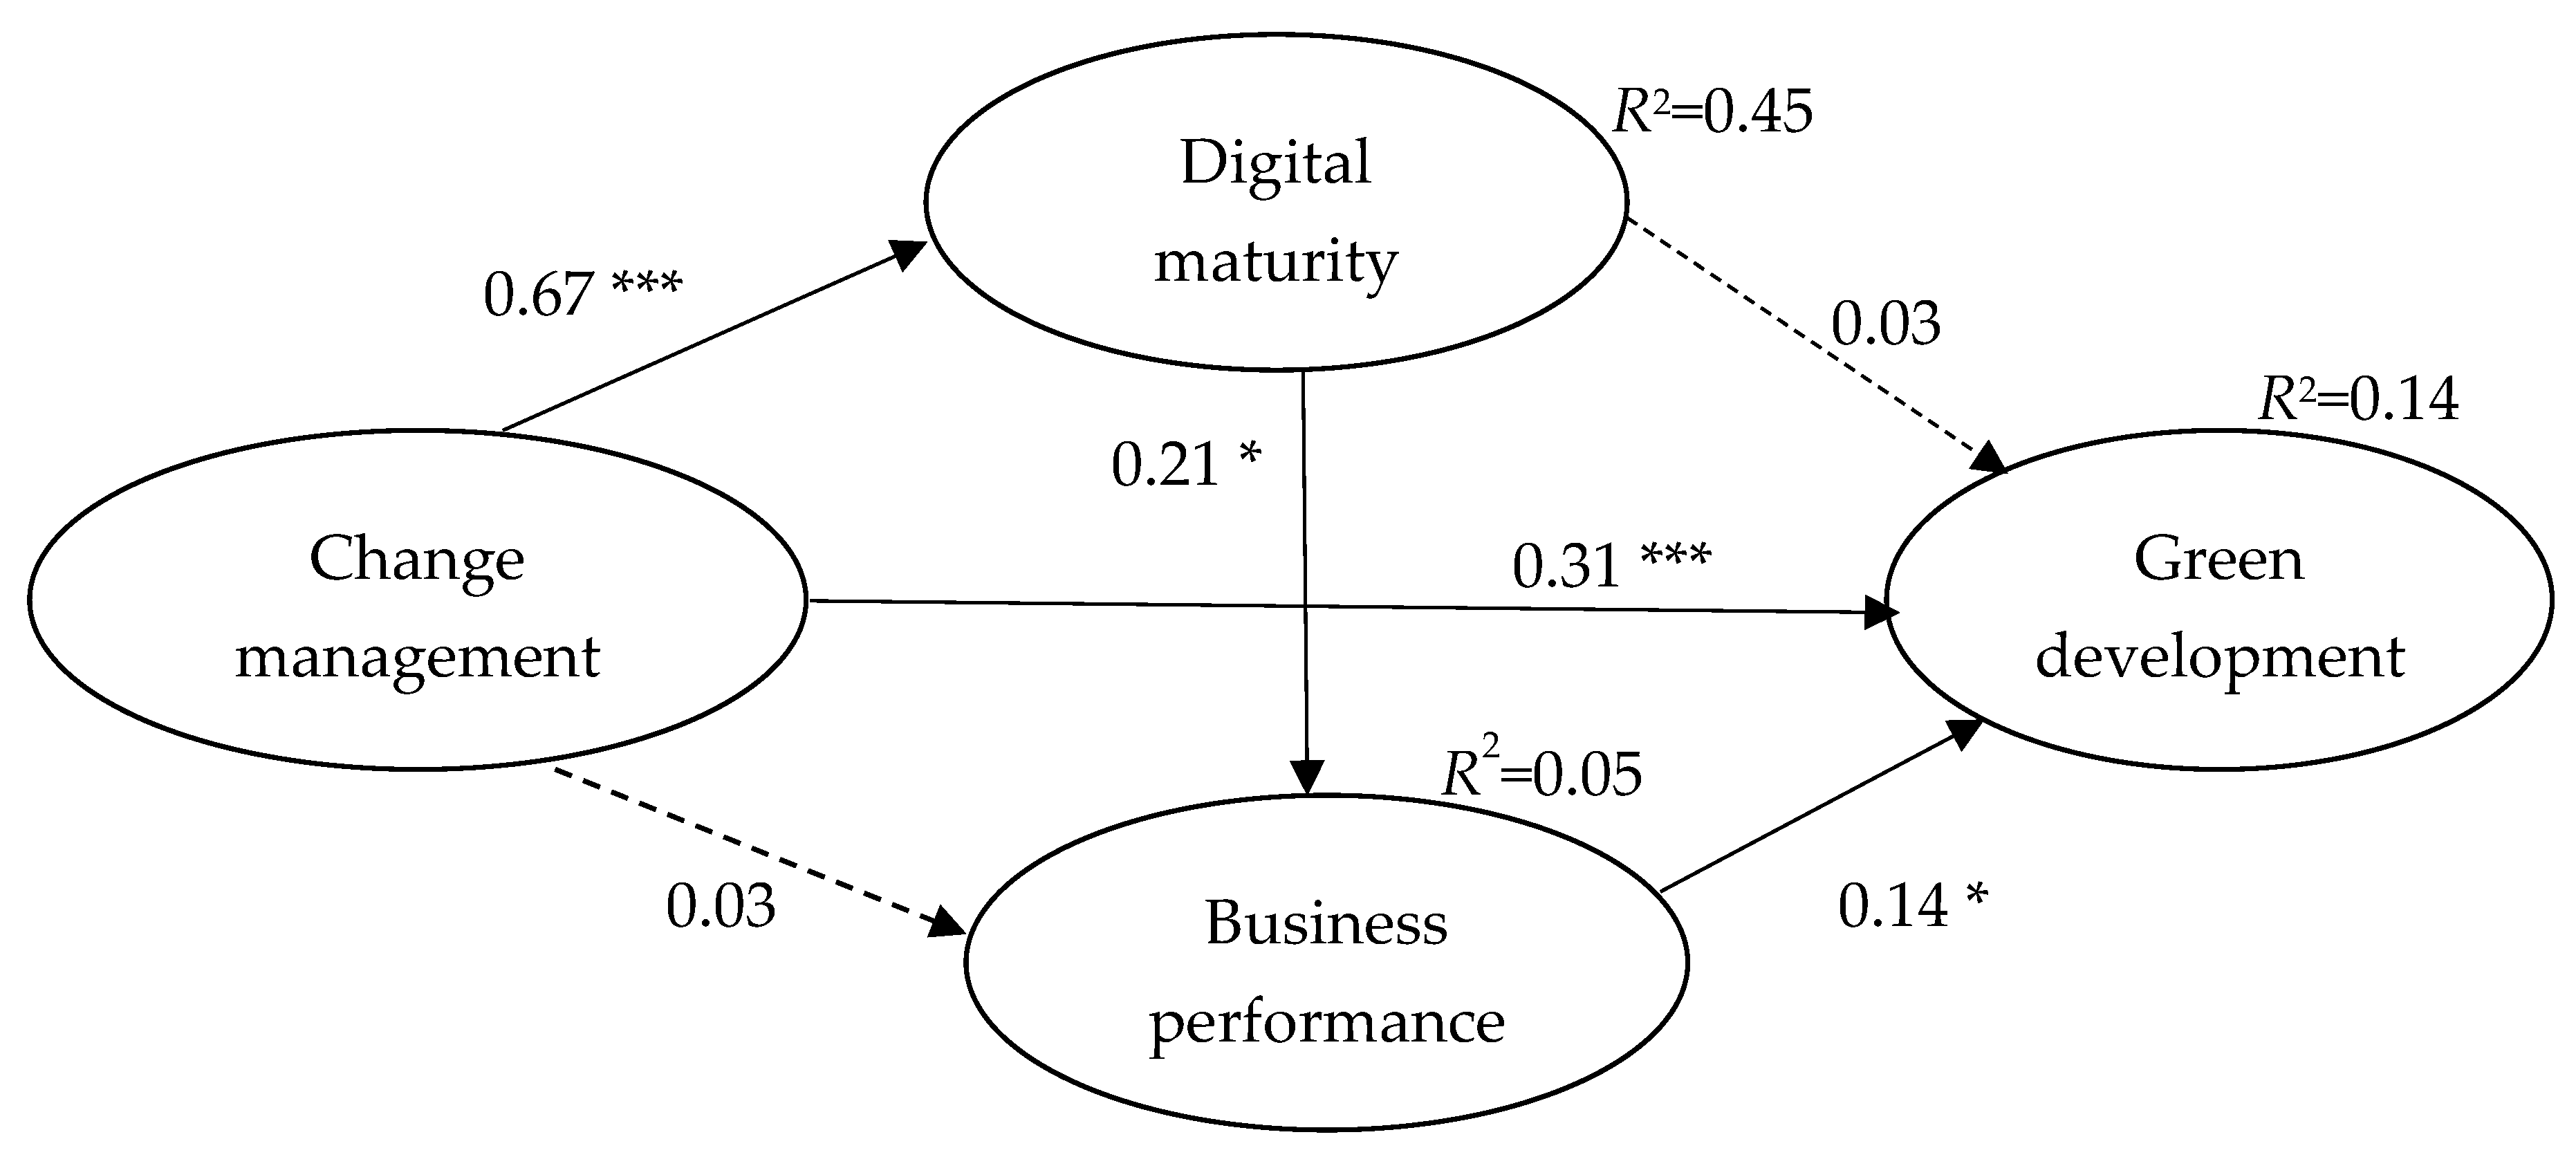
4.2. Structural Model and Hypothesis Testing

As shown in Figure 1, the structural model was evaluated using R2 estimates, standardized path coefficients (β), t-test (t values), and significance (p values). R2 values indicate the percentage of variability and, thus, the predictive power of the structural model. The standardized root mean square residual (SRMR), with its cut-off value of 0.08, was applied in PLS modelling. The SRMR value for the model (0.047) was deemed acceptable [28]. PLS path models contain exogenous and endogenous constructs and show the relationship between the constructs [44,45]. Change management is an exogenous construct and its value is expected to come from outside the model (Figure 1). Table 4 shows standardized path coefficients, t-values, and p-values for the model. The results (Table 4 and Figure 1) demonstrate that some hypotheses were supported, and some were rejected.
Change management has a significant positive effect on digital maturity (β = 0.67; p-value = 0.000), which supports Hypothesis 1. This means that the more change management is part of the organizational culture of a firm, the more the firm is committed towards digital development; thus, considering digital maturity, these firms are more advanced compared to their competitors. In the current social and economic crisis generated by the COVID-19 pandemic and the lockdown, digital maturity can be crucial to guarantee the survival of firms. In this period (March–May 2020), most firms are obliged to rely on digital technology to assure their operation from home-office and to extensively exploit any opportunities provided by digitalization. At the same time, firms that were unorganized failed to incorporate strategic change management into their organizational culture according to SAF theory and had less propensity to engage in digitalization and have turned out to be more vulnerable in this crisis. In the current situation, low-level digitalization provides firms with little chances of survival.
Change management has no direct effect on business performance (β = 0.03; p-value = 0.402); consequently, Hypothesis 2 is rejected. This result is surprising because it shows that incorporating change management into organizational culture does not lead to better business performance. One of the reasons for this result could be that managing change consumes profit or generates less favorable profit ratios. On one hand, this is a kind of short-term strategic perspective because the financial metrics of a firm surveyed through the perceptual performance measures of participants can be considered as short-term hard metrics. On the other hand, capability in change management is a long-term soft indicator. In a crisis, like the current pandemic situation and the consequent economic lock-down, soft indicators play an increasingly important role in the survival of companies. Although no direct effects can be detected between change management and business performance, significant indirect effects are revealed (β = 0.14; t-value = 2.29; p-value = 0.022), leading to a significant total effect (β = 0.17). Digital maturity, thus, has a significant mediating effect (all direct and indirect effects are in Table 5). In order to test the mediation effect, inference statistics (using bootstrap), which are considered to be more rigorous and powerful than the Sobel-test, were applied [45]. Indirect effects are important for mediation analysis [44].
Change management has a positive direct effect on green development (β = 0.31); this means that the more incorporated change management is in organizational culture, the more it is engaged in green development (Hypothesis 3 is supported). The constructs of change management are more powerful engines to green development than business performance. Digital maturity has a positive effect on business performance (β = 0.21). This means that the more digitally developed a firm is compared to other firms in the industry, the better its business performance (Hypothesis 4 is supported). Data also reveals that digital maturity is not the primary exploratory factor of an increased business performance. Digital maturity has no direct effect on green development (β = 0.03); this means that digital development per se fails to trigger firms to implement green development (Hypothesis 5 is rejected). These results are consistent with existing digitalization and green development literature [3,4,16]. In the perspective of SAF theory, digital maturity is a results of intrafirm development, and green investment is associated with environmental—extrafirm—development. Therefore, digital maturity does not mean implementation of green solutions. Business performance has a positive effect on green development (β = 0.14); this direct effect is statistically significant (Hypothesis 6 is supported), but the effect is not strong.
In addition to evaluating the R2 values of all the endogenous constructs, the effects of Cohen’s f2 were used. Table 5 shows a large effect size (f2 = 0.815) between change management and digital maturity, and a tiny effect on green development (f2 = 0.060). The effect of digital maturity on green development is not significant (f2 = 0.001). Thus, digitally mature firms are not necessarily environment-conscious, and change management is much more an internal driving force rather than a factor to enhance green development implemented by a firm. Still, digital development might have several effects that foster sustainability, such as reducing pollution and waste. These aspects seem to be less relevant for the managing directors and founders questioned in our survey (Table 6). Change management per se fails to be sufficient to enhance green development because change management is intrafirm-focused, sustains internal operation, and hardly considers environmental sustainability. Successful firms fail to pay attention to green development even if they have the opportunity to do so.

5. Conclusions

Using data obtained from 270 SMEs and large companies, we investigated these firms’ perceptions of the relationship between change management, digitalization, business performance, and green development by applying the Strategic Action Field theory [14]. First, based on a careful definition of change management and digitalization, we analyzed how these are seen to contribute to business performance. In this current coronavirus pandemic crisis, and the economic lockdown that has forced managers and employees to be stuck at home and has led them to work remotely, more than ever, a firm’s digital maturity is paramount for survival. Second, we identified green development as an underestimated strategic intervention area that could be deployed to create competitive advantage. Our results are consistent with the findings of prior studies in management [16,17,18,19] and show that green development of the ecosystem in which firms operate and in which social actors live is not considered as a strategic intervention. Simply put, top managers think that it does not pay to be green. Short-term financial performance can hardly be improved by green development. Sustainability commitment is for the long-term, aiming to contribute to the regional development of moderately competitive industrial regions. Yet, in regions where industrial development is the top priority, either for public or private local enterprises or for foreign owned companies, the environmental improvement of the ecosystem, unfortunately, lags behind.
The findings of our study support several results of past research and introduce new perspectives. Concerning Hypothesis 1 (change management has a positive effect on digital maturity) and Hypothesis 3 (change management has a positive effect on green development) is the study’s theoretical contribution to the benefits of incorporating change management into corporate strategies using the Strategic Action Field theory [14]. The results show that multiple and interconnected digital transformation within a firm is considered as a competitive advantage in terms of managerial capability. Digital maturity is not a strategic asset in itself, rather, it enables firms to better face transforming challenges in uncertain times. We can state that a firm’s competitive advantage lies in an efficient change management process integrated within the corporate structure, understood and shared by the firms’ business actors. We suggest incorporating green development as a managerial implication in long-term strategies, defining the long-term goals and sharing the benefits within the ecosystem.
This study has some limitations. The research was conducted in a moderately developed Central-Eastern-European region, and the period of data-gathering might threaten the generalizability of the study. The questionnaire-based research aimed to investigate top-managerial responses and firms’ perceptions, but employees’ opinion and perception on change management strategies should also be investigated.
The global pandemic has taken a heavy toll on lives, health services, jobs, and mental health [47]. The lockdown of businesses has led to some unexpected consequences such as “good quality air” due to the fact that air pollution has drastically fallen, even in the most polluted regions such as the Po Valley in northern Italy (news.un.org). According to World Meteorological Organization expectations, once the global economy recovers, greenhouse gas emissions will again increase. Due to the coronavirus outbreak, industries, travel networks, and businesses were forced to close down (March–May 2020 in Europe), and most companies had to focus on actions to avoid decline through short-run cost reduction such as asset and employee reduction. When the pandemic eventually subsides, firms—with a high level of digital maturity and/or good financial performance—will need time to return to their original levels of productivity; thus, resource allocation to assure the survival of firms, employee retention, operational reorganization, and intrafirm development will take precedence over investments in green development. Presumably, in the immediate post-COVID-19 period, the economic recovery for firms will be the most pressing concern, regardless of the negative impact of economic growth on the environment. Once the pandemic eases, governments should re-stimulate their economies mindfully in order to foster green development and provide support to firms in the digitalization of production processes and remote working.

Author Contributions

A.I. and A.M. equally contributed to research conceptualization, research design, and writing. A.M. contributed to methodology and data analysis, A.I. contributed to the theoretical background, writing, and editing. All authors have read and agreed to the published version of the manuscript

Funding

The publication was prepared within the Széchenyi 2020 program framework (EFOP-3.6.1-16-2016-00013) under the European Union project titled: “Institutional developments for intelligent specialization at the Székesfehérvár Campus of Corvinus University of Budapest”.

Conflicts of Interest

The authors declare no conflict of interest

References

  1. Rafferty, A.E.; Jimmieson, N.L.; Armenakis, A.A. Change readiness: A multilevel review. J. Manag. 2013, 39, 110–135. [Google Scholar] [CrossRef] [Green Version]
  2. Pettigrew, A.M.; Woodman, R.W.; Cameron, K.S. Studying organizational change and development: Challenges for future research. Acad. Manag. J. 2001, 44, 697–713. [Google Scholar]
  3. Peter, M.K.; Kraft, C.; Lindeque, J. Strategic action fields of digital transformation. An exploration of the strategic action fields of Swiss SMEs and large enterprises. J. Strategy Manag. 2020, 13, 160–180. [Google Scholar] [CrossRef]
  4. Ukko, J.; Nasiri, M.; Saunira, M.; Rantala, T. Sustainability strategy as a moderator in the relationship between digital business strategy and financial performance. J. Clean. Prod. 2019, 236, 117626. [Google Scholar] [CrossRef]
  5. Li, L.; Su, F.; Zhang, W.; Mao, J. Digital transformation by SME entrepreneurs: A capability perspective. Inf. Syst. J. 2017, 28, 1129–1157. [Google Scholar] [CrossRef]
  6. Cha, K.J.; Hwang, T.; Gregor, S. An integrative model of IT-enabled organizational transformation. Manag. Decis. 2015, 53, 1755–1770. [Google Scholar] [CrossRef]
  7. Seele, P.; Lock, I. The game-changing potential of digitalization for sustainability: Possibilities, perils, and pathways. Sustain. Sci. 2017, 12, 183–185. [Google Scholar] [CrossRef] [Green Version]
  8. Park, K. The Relationship between BPR Strategy and Change Management for the Sustainable Implementation of ERP: An Information Orientation Perspective. Sustainability 2018, 10, 3080. [Google Scholar] [CrossRef] [Green Version]
  9. Tripsas, M.; Gavetti, G. Capabilities, cognition and inertia: Evidence from digital imaging. Strateg. Manag. J. 2000, 21, 1147–1161. [Google Scholar] [CrossRef]
  10. D’Aveni, R.A. Hyper-competition; Free Press: New York, NY, USA, 1994. [Google Scholar]
  11. Szerb, L.; Acs, Z.; Autio, E.; Ortega-Argiles, R.; Komlosi, E. REDI: The Regional Entrepreneurship and Development Index—measuring Regional Entrepreneurship. 2013 Final report. Available online: http://ec.europa.eu/regional_policy/sources/docgener/studies/pdf/regional_entrepreneurship_development_index.pdf (accessed on 2 April 2020).
  12. Audretsch, D.B.; Belitski, M.; Desai, S. Entrepreneurship and economic development in cities. Ann. Reg. Sci. 2015, 55, 33–60. [Google Scholar] [CrossRef]
  13. Acs, Z.J.; Stam, E.; Audretsch, D.B.; O’Connor, A. The lineages of the entrepreneurial ecosystem approach. Small Bus. Econ. 2017, 49, 1–10. [Google Scholar] [CrossRef]
  14. Fligstein, N.; McAdam, D. Toward a General Theory of Strategic Action Fields. Sociol. Theory 2011, 29, 1–26. [Google Scholar] [CrossRef]
  15. Tsoukas, H.; Chia, R. On Organizational Becoming: Rethinking Organizational Change. Organ. Sci. 2002, 13, 567–582. [Google Scholar] [CrossRef]
  16. Hart, S.; Dowell, G. A natural-resource-based view of the firm: Fifteen years after. J. Manag. 2011, 37, 1464–1479. [Google Scholar]
  17. Hart, S.L. A natural-resource-based view of the firm. Acad. Manag. Rev. 1995, 20, 986–1014. [Google Scholar] [CrossRef] [Green Version]
  18. Schaltegger, S.; Wagner, M. Managing the Business Case for Sustainability. In The Integration of Social, Environmental and Economic Performance; Routledge: New York, NY, USA, 2017. [Google Scholar]
  19. Konar, S.; Cohen, M.A. Does the Market Value Environmental Performance? Rev. Econ. Stat. 2001, 83, 281–289. [Google Scholar] [CrossRef]
  20. López-Gamero, M.D.; Molina-Azorin, J.F.; Claver-Cortés, E. The whole relationship between environmental variables and firm performance: Competitive advantage and firm resources as mediator variables. J. Environ. Manag. 2009, 90, 3110–3121. [Google Scholar] [CrossRef] [Green Version]
  21. Zeng, S.; Meng, X.; Yin, H.; Tam, C.M.; Sun, L. Impact of cleaner production on business performance. J. Clean. Prod. 2010, 18, 975–983. [Google Scholar] [CrossRef]
  22. Cantele, S.; Zardini, A. Is sustainability a competitive advantage for small businesses? An empirical analysis of possible mediators in the sustainability–financial performance relationship. J. Clean. Prod. 2018, 182, 166–176. [Google Scholar] [CrossRef]
  23. Weaver, G.R.; Treviño, L.K.; Cochran, P.L. Integrated and decoupled corporate social performance: Management commitments, external pressures, and corporate ethics practices. Acad. Manag. J. 1999, 42, 539–552. [Google Scholar]
  24. Morioka, S.N.; Carvalho, M.M. A systematic literature review towards a conceptual framework for integrating sustainability performance into business. J. Clean. Prod. 2016, 136, 134–146. [Google Scholar] [CrossRef]
  25. Churchill, G.A., Jr.; Peter, J.P. Research design effects on the reliability of rating scales: A meta-analysis. J. Mark. Res. 1984, 21, 360–375. [Google Scholar] [CrossRef]
  26. Bombiak, E.; Marciniuk-Kluska, A. Green Human Resource Management as a Tool for the Sustainable Development of Enterprises: Polish Young Company Experience. Sustainability 2018, 10, 1739. [Google Scholar] [CrossRef] [Green Version]
  27. Rafiq, M.; Zhang, X.P.; Yuan, J.; Naz, S.; Maqbool, S. Impact of a balanced scorecard as a strategic management system to improve sustainable development: Measuring the mediation of organizational performance through PLS-Smart. Sustainability 2020, 12, 1365. [Google Scholar] [CrossRef] [Green Version]
  28. Hair, J.F.; Hult, G.T.M.; Ringle, C.M.; Sarstedt, M. A Primer on Partial Least Squares Structural Equation Modelling (PLS-SEM); Sage: London, UK, 2017. [Google Scholar]
  29. Higgs, M.; Rowland, D. Building change leadership capability: ‘The quest for change competence’. J. Chang. Manag. 2000, 1, 116–130. [Google Scholar] [CrossRef]
  30. Agárdi, I. A digitalizáció mint a kiskereskedelmi tevékenységet integráló tényező. Vezetéstudomány 2018, 12, 50–57. [Google Scholar] [CrossRef]
  31. Remane, G.; Hanelt, A.; Wiesboeck, F.; Kolbe, L. Digital maturity in traditional industries–An exploratory analysis. In Proceedings of the 25th European Conference on Information Systems (ECIS), Guimarães, Portugal, 5–10 June 2017. [Google Scholar]
  32. Clark, B. Managerial perceptions of marketing performance: Efficiency, adaptability, effectiveness and satisfaction. J. Strateg. Mark. 2000, 8, 3–24. [Google Scholar] [CrossRef]
  33. Edeling, A.; Himme, A. When does market share matter? New empirical generalizations from a meta-analysis of the market share-performance relationship. J. Mark. 2018, 82, 1–24. [Google Scholar] [CrossRef]
  34. Gruber, M.; Heinemann, F.; Brettel, M.; Hungeling, S. Configurations of resources and capabilities and their performance implications: An exploratory study on technology ventures. Strateg. Manag. J. 2010, 31, 1337–1356. [Google Scholar] [CrossRef]
  35. Chandler, G.N.; Hanks, S.H. Measuring the performance of emerging businesses: A validation study. J. Bus. Ventur. 1993, 8, 391–409. [Google Scholar] [CrossRef]
  36. Aldieri, L.; Vinci, C.P. Green economy and sustainable development: The economic impact of innovation on employment. Sustainability 2018, 10, 3541. [Google Scholar] [CrossRef] [Green Version]
  37. Berrone, P.; Fosfuri, A.; Gelabert, L.; Gomez-Mejia, L.R. Necessity as the mother of green inventions: Institutional pressures and environmental innovations. Strateg. Manag. J. 2013, 34, 891–909. [Google Scholar] [CrossRef]
  38. Nemes-Nagy, J.; Tagai, G. Regional inequalities and the determination of spatial structure. Reg. Stat. 2011, 14, 15–28. [Google Scholar]
  39. The Organisation for Economic Co-operation and Development. OECD Economic Surveys: Hungary; OECD Publishing: Paris, France, 2019. [Google Scholar]
  40. Rechnitzer, J.; Berkes, J.; Filep, B. The most important city development initiatives of Hungary. Reg. Stat. 2019, 9, 1–25. [Google Scholar]
  41. Barta, G.; Lőcsei, H. The effect of the recent economic crisis on the spatial structure of Hungarian industry. Reg. Stat. 2011, 14, 99–109. [Google Scholar]
  42. Alvarado-Herrera, A.; Bigne, E.; Aldas-Manzano, J.; Curras-Perez, R. A scale for measuring consumer perceptions of corporate social responsibility following the sustainable development paradigm. J. Bus. Ethics 2017, 140, 243–262. [Google Scholar] [CrossRef]
  43. Lu, W.; Chau, K.W.; Wang, H.; Pan, W. A decade’s debate on the nexus between corporate social and corporate financial performance: A critical review of empirical studies 2002–2011. J. Clean. Prod. 2014, 79, 195–206. [Google Scholar] [CrossRef] [Green Version]
  44. Henseler, J.; Dijkstra, T.K.; Sarstedt, M.; Ringle, C.M.; Diamantopoulos, A.; Straub, D.W.; Ketchen, D.J.; Hair, J.F.; Hult, G.T.M.; Calantone, R.J. Common beliefs and reality about PLS: Comments on Rönkkö and Evermann (2013). Organ. Res. Methods 2014, 17, 182–209. [Google Scholar] [CrossRef] [Green Version]
  45. Henseler, J.; Hubona, G.; Ray, P.A. Using PLS path modelling in new technology research: Updated guidelines. Ind. Manag. Data Syst. 2016, 116, 2–20. [Google Scholar] [CrossRef]
  46. Dijkstra, T.K.; Henseler, J. Consistent partial least squares path modeling. MIS Q. 2015, 39, 297–316. [Google Scholar] [CrossRef]
  47. Hakovirta, M.; Denuwara, N. How COVID-19 redefines the concept of sustainability. Sustainability 2020, 12, 3727. [Google Scholar] [CrossRef]
Figure 1. The structural model and results. Note: All coefficients are standardized (*** p < 0.000; * p < 0.05). Source: the authors’ own elaboration, 2020.
Sustainability 12 04019 g001
Table 1. Description of the sample.
CharacteristicsCategoryPercentage of Firms
Number of employees 10–49 employees44.2%
50–99 employees24.8%
100–259 employees20.0%
over 250 employees13.0%
OwnershipHungarian state-owned firms5.3%
Hungarian private firms74.3%
Foreign-owned private firms20.4%
Type of settlementCounty seats46.9%
Cities33.0%
Other settlements17.4%
Source: the authors’ own elaboration, 2020.
Table 2. Discriminant validity: Fornell–Larcker criterion.
ConstructGreen DevelopmentBusiness PerformanceDigital MaturityChange Management
Green Development0.8389
Business Performance0.03950.8744
Digital Maturity0.07010.05040.9197
Change Management0.12090.02730.44920.8228
Note: Average variance extracted (AVE) values can be found on the diagonal; values under the diagonal are the squared latent variable correlations of each construct. Source: the authors’ own elaboration, 2020.
Table 3. Heterotrait-heteromethod ratio of correlations (HTMT).
ConstructGreen DevelopmentBusiness PerformanceDigital MaturityChange Management
Green Development
Business Performance0.2148
Digital Maturity0.28390.2389
Change Management0.37880.17370.7084
Note: All values are significantly less than one.
Table 4. Direct effects in the model.
The Hypothesed Pathβt-Valuesp-Values
Business Performance→Green Development (Hypothesis 6)0.14191.94790.0257
Digital Maturity→Green Development (Hypothesis 5)0.02830.34980.3632
Digital Maturity→Business Performance (Hypothesis 4)0.20662.34250.0096
Change Management→Green Development (Hypothesis 3)0.30533.53130.0002
Change Management→Business Performance (Hypothesis 2)0.02680.24780.4021
Change Management→Digital Maturity (Hypothesis 1)0.670217.45310.0000
Source: the authors’ own elaboration using Adanco software.
Table 5. Effect overview in the model.
EffectBetaIndirect EffectsTotal Effectp-Value Cohen’s f2
Business Performance→Green Development0.1419 0.14190.02570.0223
Digital Maturity→Green Development0.02830.02930.05760.23620.0005
Digital Maturity→Business Performance0.2066 0.20660.00960.0248
Change Management→Green Development0.30530.04240.34770.00000.0598
Change Management→Business Performance0.02680.13840.16520.02220.0004
Change Management→Digital Maturity0.6702 0.67020.00000.8154
Source: the authors’ own elaboration.
Table 6. Measurement of the model constructs and reliability.
Construct (Rho)StatementsMean Standard Deviation Factor Loading
Business performance (ρA = 0.891)The growth rate of revenue-to profit.3.420.8020.9020
The growth rate of Return on Equity.3.360.6940.9678
Our market share growth rate in comparison with other firms in our industry.3.300.6140.9343
Change management (ρA = 0.868)In our company, change management is recognized as part of our corporate culture.3.171.0900.8854
Our firm has the capability to manage strategic change in ongoing processes.3.141.1630.9253
Our managing directors/founders are constantly looking for innovation opportunities.3.611.0400.8965
In comparison with our competitors, our company has significantly more capability in change management.3.271.0120.9206
Digital maturity (ρA = 0.814)In comparison with other firms in our industry, digital solutions in our firm are more developed.3.000.9350.9635
In comparison with our competitors, digital transformation in our firm is substantially more advanced.3.020.9180.9744
Our firm is a leader in digital transformation within the sector.2.950.9630.9387
Green development (ρA = 0.833)Our firm is committed to invest in public sector development projects in green energy.1.600.8740.9195
Our firm is committed to invest in public sector development projects in waste-management.1.610.9130.9259
Our firm is committed to invest in public sector development projects in green environmental development (e.g., parks).1.640.8860.9022
Note: Items were measured with a 5-point Likert-type scale (1 = totally disagree, 5 = fully agree). The items of green development were measured on a 4-point Likert-type scale. Source: authors’ own elaboration.

