Article

China’s Arable Land Investment in the “Belt and Road” Region: An Empirical Study of Overseas Arable Land Resources

1
School of Economics, Yunnan University of Finance and Economics, Kunming 650221, China
2
Institute of Land & Resources and Sustainable Development, Yunnan University of Finance and Economics, Kunming 650221, China
3
China Center for Special Economic Zone Research, Shenzhen University, Shenzhen 518060, China
*
Authors to whom correspondence should be addressed.
Sustainability 2020, 12(1), 97; https://doi.org/10.3390/su12010097
Submission received: 6 October 2019 / Revised: 15 December 2019 / Accepted: 16 December 2019 / Published: 21 December 2019
(This article belongs to the Section Economic and Business Aspects of Sustainability)

Abstract

:
Arable land resources are essential for food security and sustainable agricultural development, and an objective and comprehensive evaluation of overseas arable land resources is indispensable to the decision-making of various Chinese enterprises. However, overseas arable land resources and factors influencing China’s investment therein have rarely been investigated. In the present study, the authors select eight indexes related to the quantity and quality of arable land and utilize the entropy weighting method and technique for order preference by similarity to ideal solution (TOPSIS) method to comprehensively evaluate arable resources in 48 “Belt and Road” countries for the period 2008–2016. Renewable internal freshwater resources and irrigated farmland area are found to be the primary factors affecting the wealth of arable land resources. Based on this evaluation, the authors conduct empirical tests concerning the main factors affecting the scale of China’s investment in foreign arable land using a panel Tobit model. The results show that Chinese companies tend to invest in countries with high levels of arable land resources and low corruption risk. Based on these findings, this study concludes that Chinese enterprises should engage in joint development with host countries and support the sustainability of long-term investment in cultivated land.

1. Introduction

In recent years, there has been a worldwide boom in overseas arable land investment [1,2]. This denotes foreign enterprises acquiring the right to use arable land in the host country (for short-term or long-term use) by means of purchase or lease and engaging in agricultural production investment activities [3,4]. There are three different performances of investment modes, including “public to public” mode, “public to private” mode, and “private to private” mode [5]. For investors, overseas arable land investment can secure external food security, ensure the supply of industrial raw materials, and yield investment profits [6]. For the host country, some studies consider investment in overseas farmland as a kind of “land grab” [7,8], and indicate that the rights of farmers in the host country are not effectively protected [8]. However, the Food and Agriculture Organization of the United Nations (FAO) reports indicate that overseas arable land investment is actually a kind of transnational investment [9], and other studies conclude that overseas arable land investment brings employment opportunities to farmers [10], and improves agricultural output levels by sharing agricultural science and technology in underdeveloped areas [6,11]. Although there are both supporters and opponents of investment in overseas farmland, as a developing country with poor arable land resources China’s investment in overseas arable land has attracted great attention from international researchers [7,10,11,12].
Under the guidance of the Chinese government’s “going out” and “two types of resources and two markets” strategies, China has actively engaged in the process of allocation of global agricultural resources [5]. China’s Ministries of Finance and Commerce jointly issued documents and notices giving financial support to overseas enterprises and investment-oriented Chinese enterprises [9]. In 2013, for the first time, the scale of China’s investment in foreign agriculture exceeded the scale of investment by foreign entities in Chinese agriculture [10,11,12]. As part of its agricultural investment, China’s investment in overseas arable land is expected to accelerate due to the country’s “Belt and Road” initiative and the continuous increase in China’s comprehensive national power [10].
With the rapid development of multinational corporations, economics scholars have conducted extensive research in the field of foreign direct investment. Vernon’s [13] international product life cycle theory and Kojima’s [14] comparative advantage theory holds that international direct investment flows from countries with capital, management, technology, and other advantages to countries that do not have such comparative advantages. The market internalization theories proposed by Buckley [15] and Rugman [16] focus on the imperfections of the intermediate product market. According to Dunning’s [17] eclectic theory of international production, having a location advantage is the main factor that determines the direction of investment flows.
Based on the above international investment theories, and in particular on location choice theory [17], many scholars have conducted investigations into the effects of the characteristics of host countries’ locations on China’s outward foreign direct investment (OFDI) [18,19,20]. However, it is still necessary to analyze the location characteristics and influencing factors of China’s overseas arable land investment. On the one hand, before the economic reform and opening-up of China in 1978, China’s overseas investment in agriculture was mainly aid-based [10,12], and many of its investments flowed to countries with which it shared close political ties, such as Algeria. However, with the establishment of the modern enterprise system of state-owned enterprises, private enterprises have since entered the field of overseas cultivated land investment on a large scale [12,21].
On the other hand, while China’s overseas arable land investment has been evaluated by scholars in recent years [21,22,23], the existing literature does not draw consistent conclusions on the correlation between the scale of Chinese overseas arable land investment and the arable land resources of the host country. Some scholars argued that the resource-seeking characteristics of China’s outward direct investment are not obvious [21,24], and Wan and Lu [21] find that the scale of agricultural land in the host country is not the decisive factor behind investing in cultivated land outside of China. However, Jiang [4] points out that Chinese enterprises tend to invest in countries with high irrigation rates and low levels of development, together with an economic environment that is receptive to international trade. Moreover, Wang et al. [22] find that Chinese enterprises prioritize the agricultural resource endowment of the host country in the production process, and they prioritize market size and development opportunities in sales operations.
We propose that the inconsistent results of the existing empirical research have a lot to do with scholars’ methods of evaluating the arable land resources of the host country. For this reason, this paper attempts to establish a host country evaluation system for cultivated land resources. Based on the literature, we argue that three aspects merit further study. First, in the existing studies, the evaluation of overseas arable land resources is limited to assessments of arable land quantity [4,21]. Second, due to the availability of data on overseas arable land investment, prior research has used literature analyses [10] and case studies [23] to explore China’s overseas investment in cultivated land, rather than engaging in empirical analyses. Third, the existing studies in this field have not conducted research on the Belt and Road countries.
Based on the abovementioned research gaps in the existing arable land investment literature, this article contributes to the field in three ways. First, because carrying out a comprehensive assessment of the arable land in the host country is challenging for the reason that some of the indicators related to the quality of arable land are difficult to obtain (e.g., indicators of soil ecology), this study collects and uses eight indicators related to arable land quality and quantity to conduct a quantitative analysis. Second, due to the lack of valid data regarding China’s overseas arable land investments [5], empirical analyses of arable land resource panel data have rarely been performed. By using the panel Tobit model, we find that the arable land resources and corruption level of the host country are the main factors that affect China’s overseas investment in arable land. Third, the Belt and Road initiative is a key factor enabling China to carry out agricultural cooperation [25]. According to our empirical results, and with the aim of supporting future sustainable development, we explore proposals for long-term mutually beneficial cooperation between China and other Belt and Road countries.

2. Materials and Methods

2.1. Study Area

The Belt and Road initiative connects the booming Asia-Pacific market in the east with the developed European market in the west [26]. The Big Data Report of Trade Cooperation under the Belt and Road Initiative (2017) [27] divides the Belt and Road Initiative into 64 countries. However, due to limitations on the availability of data (on matters such as land lease rights (According to the Foreign Investment Cooperation Country (Region) Guide [28] issued by the Chinese Ministry of Commerce, there are four countries in the Belt and Road region that explicitly prohibit foreign investment in arable land. These are: Thailand, Bahrain, Uzbekistan, and Turkmenistan) and arable land indicators), 48 countries were ultimately chosen as the research subjects for this study (see Table 1). It is noted that China’s stock of outbound direct investment in these 48 countries accounts for 93.89% of the country’s total outbound direct investment in the Belt and Road by 2016 [29]. In addition, among the 48 countries, 10 have received Chinese investment in arable land and the others have not. In such circumstances, some scholars [4] simply ignore zero data and would only study the countries in which China invests in arable land. However, this approach is more appropriate to random samples. If the occurrence of zero-investment in certain countries is not random, but is related to the variables in the equation, then ignoring them may result in the loss of useful information, and this may bias the estimation results [30]. For example, if zero trade occurs more frequently between countries that are far apart and lack historical linguistic ties, then neglecting these countries would underestimate the impact of distance and cultural barriers on trade [31]. Therefore, we have included all 48 countries in the empirical analysis. The aim is to explore the choice of location for Chinese investment in arable land in countries in the Belt and Road region, and to investigate factors impacting the scale of arable land investment.

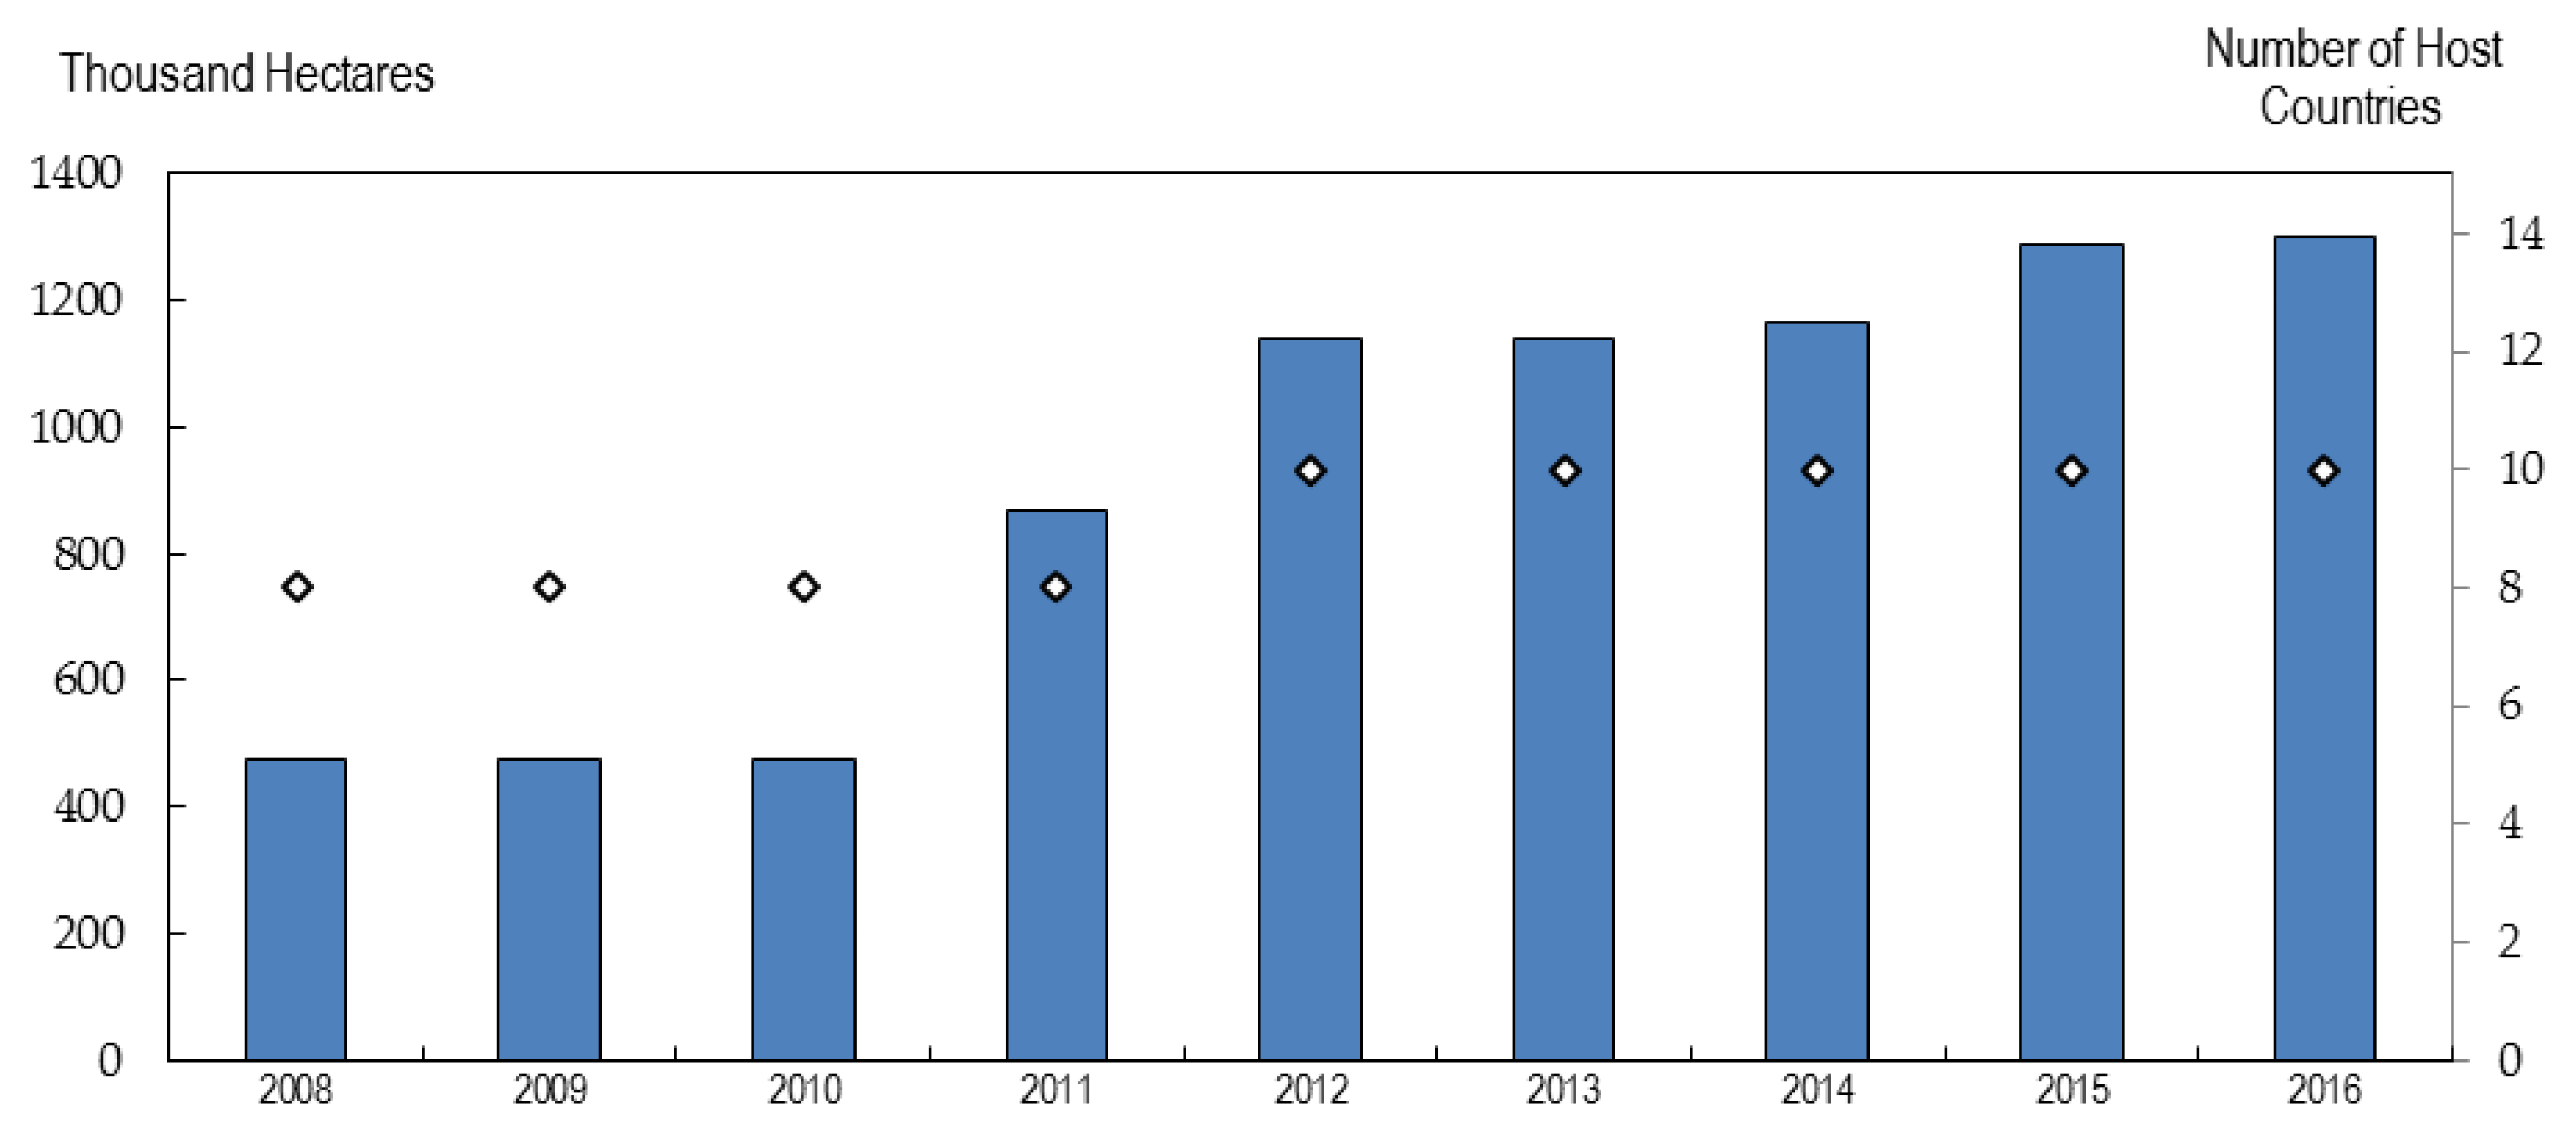
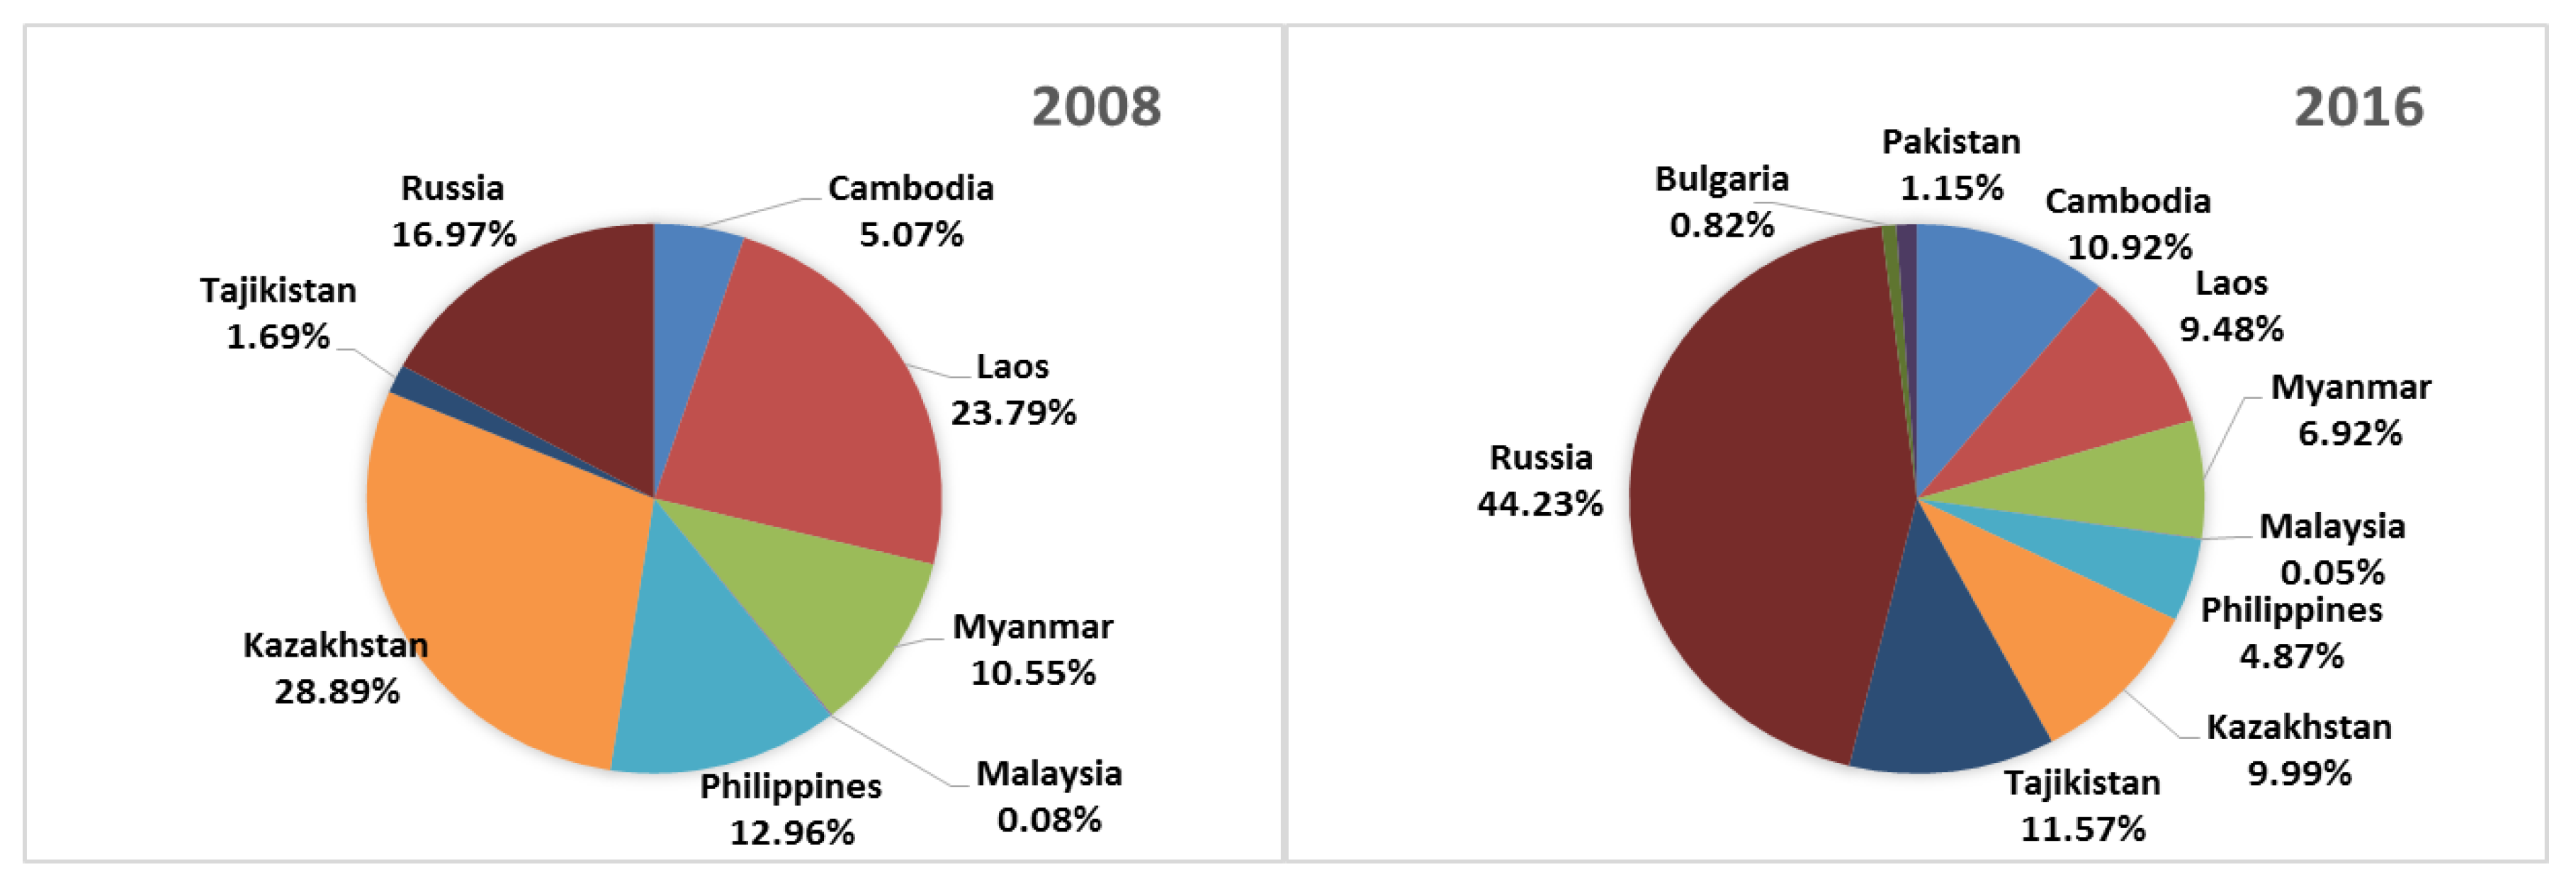
2.2. Chinese Arable Land Investment Status and Data Sources

Data regarding the scale of Chinese foreign investment in arable land is available from several sources. First, the Land Matrix database [32], initiated by the International Land Coalition, records overseas farmland investment contracts for areas exceeding 200 hectares. Second, the GRAIN database [33,34] has been updated three times, in 2008, 2012, and 2015, with the latest available arable land transaction information, listing data on arable land transactions of more than 500 hectares. Third, Sun [35] has established databases in 2008, 2012, and 2015 for Chinese overseas farmland investment, which were compiled using data for the China Overseas Economic and Trade Cooperation Zone. Based on these three sources, we have collated data regarding the confirmed scale (measured by the contract area) of Chinese investment in overseas arable land. The statistics compiled show that China’s investment in arable land in Belt and Road countries very rapidly increased in the period from 2008 to 2016. In 2008, China’s investment in arable land in Belt and Road countries covered an area of 473,800 hectares, and by 2016 this had increased to 1,300,900 hectares. In 2016, the record of cultivated land investment transactions involved 10 countries along the Belt and Road route. From the perspective of national distribution, the target countries for China’s investment in arable land are mainly Russia and countries in Southeast Asia. The annual investment in Russia increased over the period from 2008 to 2016, and the average annual investment for this period was the largest for a single country, approximately 55,000 hectares. This was followed by Tajikistan and Cambodia, which recorded average annual investment increased in their contract area of approximately 158,300 hectares and 131,100 hectares, respectively.
Figure 1 shows the total contract area of Chinese cultivated land investments in the Belt and Road route from 2008 to 2016. Figure 2 shows the distribution of arable land contracts between China and 10 other countries in 2008 and 2016. The history of China’s investment in overseas arable land is not long [35], and many countries in the region received nil investment in arable land from Chinese companies in certain years [32]. As of 2016, only 10 host countries had formally signed and implemented arable land investment contracts with China (for land transactions with areas greater than 200 hectares), as evidenced by the Land Matrix database [32] and by Sun [35].
Moreover, comparing data on the total contract area of such investments for the periods 2008–2012 and 2013–2016, it is not obvious whether the promotion of the Belt and Road initiative has affected the scale of Chinese investment in overseas cultivated land. In addition, the growth rate of China’s overseas arable land investment slowed down after 2013; one possible explanation for this is that after rapid growth in arable land investment during 2008–2012, some Chinese companies have focused on improving yields while ignoring the host country’s ecological environment and land use, which has had a negative impact on Chinese companies’ overseas investment [6,11,36]. Further studies are needed to uncover the possible mechanisms behind the trend.

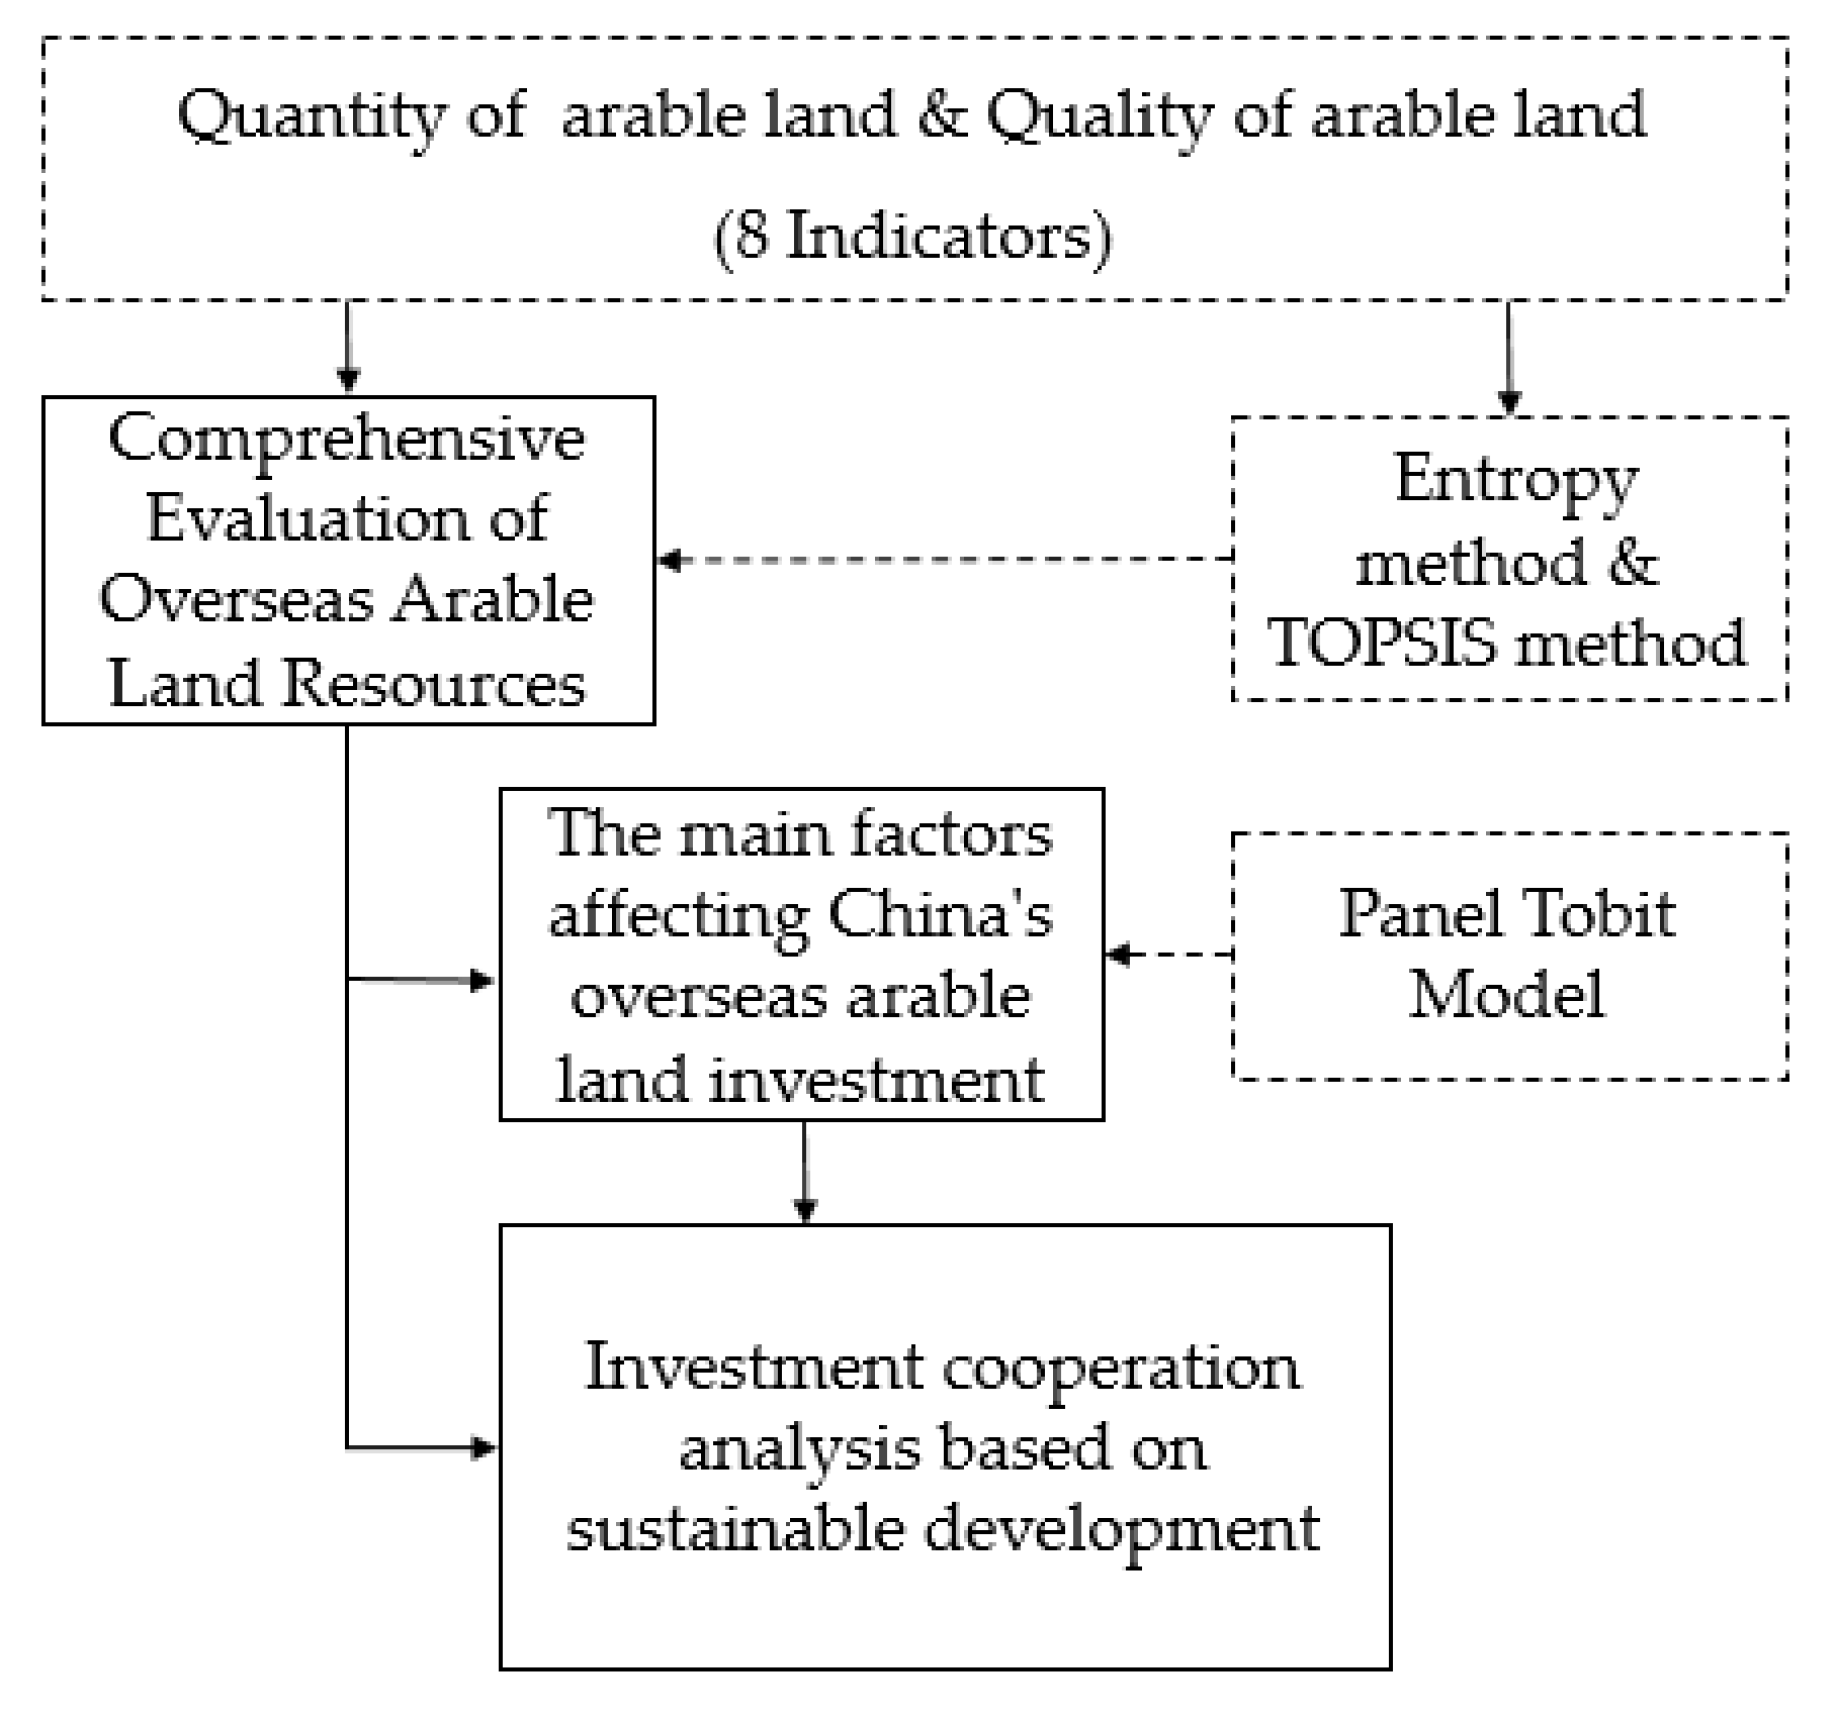
2.3. Theoretical Framework

The entropy weighting method (EWM) is based on Shannon entropy [37], which was proposed as a measure of information uncertainty, formulated in terms of probability theory. As a tool for decision analysis, the technique for order preference by similarity to ideal solution (TOPSIS) [38] attempts to identify an alternative that should simultaneously have the closest geometric distance from the positive ideal solution and the farthest geometric distance from the negative ideal solution. The EWM has been applied in evaluating agricultural sustainable development capability [25]. In addition, TOPSIS has been used in evaluating the performance of multiple neighborhood renewal projects [39] and green suppliers [40]. In this investigation, we formulate an entropy-TOPSIS method to evaluate arable land resources in countries in the Belt and Road region from quantity and quality perspectives.
Moreover, we classify the arable land investment environment by means of a model construction and evaluation. Figure 3 shows the framework of our methodology. Each module is explained in the following sections.

2.4. Formulation of the Methodological Approach and Outputs

2.4.1. Index System of Arable Land Resources

The indicators selected for the construction of the arable land resource system used in this study are related to land resources and water resources. Their selection is based on the fact that land and water resources are important to social development and agricultural production [41]. Additionally, water is necessary to ensure irrigation of crops (e.g., cereals) grown by Chinese enterprises on arable land in countries along the Belt and Road route [36]. The quantitative and qualitative indicators used by this study’s arable land resources evaluation system are taken from the World Bank database [42] and the FAO database [43] of the United Nations (see Table 2).

2.4.2. The Entropy Weight and TOPSIS Method

The modeling steps of the entropy-TOPSIS method are as follows. The original evaluation index matrix for arable land in the countries listed in Table 1 can be formulated as an information decision matrix. The original evaluation index matrix for arable land in the area is X (xi is the original value of data), where i = 1, 2, …, m; m is the number of evaluation indicators; j = 1, 2, …, n; and n is the number of evaluation samples. Thus:
X = [ x 11 x 12 x 1 n x 21 x 22 x 2 n x m 1 x m 2 x m n ]
We use Equation (2) to conduct a normalized evaluation matrix:
r i j = x i j i = 1 n x i j
The weighted matrix can be calculated as:
w i = 1 H i m i = 1 m H i
H i = 1 ln n f i ln f i
where wi is the entropy weight of the indicator i and wi ∈ [0,1]. Hi is the information entropy, fi is the characteristic weight of the index, and fi = ri/∑ri.
Subsequently, we establish a weighted normalized evaluation matrix based on the entropy weight wi. The index entropy weight wi constitutes the weight vector W, and the weighted normalized matrix V is calculated in association with the normalized matrix R. The calculation is as follows:
V = R W = [ v i j ] m n
V+ and V represent the positive solution (ideal solution) and the negative solution for index i in the sample countries. Their methods of calculation are shown in Equations (6) and (7):
V + = { max V i j | i = 1 , 2 , , m } = { V 1 + , V 2 + , V m + , }
V = { min V i j | i = 1 , 2 , , m } = { V 1 , V 2 , V m , }
For each country j, the geometric distance from the positive ideal solution (D+) and the negative ideal solution (D) can be calculated as:
D j + = i = 1 m ( v i + v i j ) 2
D j = i = 1 m ( v i v i j ) 2
Finally, the comprehensive evaluation of arable land resource Resj can be calculated as:
R e s j = D j D j + + D j

2.4.3. Results Discussion: A Comprehensive Evaluation of Arable Land Resources

The entropy method is used to calculate the weight of each indicator to achieve a comprehensive and objective evaluation. Following Equations (1)–(10), we obtain the weights of each index of arable land resources for the period 2008 to 2015. The weights of the metrics are arranged as follows: W6 > W4 > W1 > W7 > W5 >W2 > W3> W8 (see Appendix A). The weights of the two indicators denote the quality of arable land, namely renewable internal freshwater resources (W6) and agricultural irrigated land (W4), and so they are the main factors for evaluation of the wealth of arable land resources in the Belt and Road region. In other words, the quality factors of arable land resources are not evenly distributed across the geographic range of the sample. In contrast, the weights of the two indicators arable land as a percentage of land area (W3) and crop production index (W8) are relatively low, suggesting that countries in the Belt and Road region do not have obvious differences in terms of the ratio of farmland to total territory or the expandable ratio of farmland.
According to the relative closeness calculated in the TOPSIS method, we obtain comprehensive arable land resources figures for 48 countries along the Belt and Road (see Appendix B). We list the top five countries for the period from 2008 to 2016 in Table 3. Comparing this list with the data in Figure 2, we observe that China has invested substantially in arable land in these top five countries. Based on the above analysis, we conclude that the wealth of arable land resources in the host countries is related to the choice of location for China’s investment in arable land. We use this arable land resource data as a core variable in the measurement model in order to further our research on the influential factors associated with arable land resources and other related decisive factors affecting China’s choice of countries in which to invest in overseas arable land.

2.5. Factors Influencing China’s Investment in Overseas Arable Land Based on the Tobit Model

2.5.1. Tobit Model

In this paper, we not only examine the Chinese scale of arable land investment, but we also explore why China only invests in some but not all countries in the Belt and Road. We note that in the Land Matrix database [32], land transaction information for the period from 2008 to 2016 only includes transactions greater than 200 hectares. According to the data characteristics of this paper, we adopt the Tobit model to analyze the factors impacting the scale of arable land investment. Tobit [44] proposed a censored regression model using the maximum likelihood method to make consistent estimates of censored data, and we use this method to counteract the limitations of our dataset. In our Tobit model, we assume a linear structural equation, as follows:
y i * = β X + ε
where β X =   β 0 +   β 1 x 1 + +   β n x n . β is a n + 1 dimensional vector, y i * is a latent variable, and {x1, …, xn} are explanatory variables. The error term has a normal distribution with mean μ = 0 and standard deviation б. It is assumed that the merge point is c. The observed value yi is defined by:
y i = { y i * , y i * > c 0 , y i * c
Deaton [45] points out that likelihood estimates have a small standard deviation despite their small sample bias. Therefore, using a likelihood estimation is a suitable technique for the analysis of small samples.

2.5.2. Theoretical Assumptions

We further explore the influence of the locational characteristics of different countries along the Belt and Road route on Chinese investment in arable land by means of additional empirical tests. Based on existing foreign direct investment research [13,14,15,16,17], the following hypotheses are presented.
Hypothesis 1.
The endowment of arable land resources in the host country is positively correlated with the scale of Chinese investment in that country’s arable land.
Over the past 30 years, the rapid growth of China’s economy has led to an increase in China’s demand for food, putting pressure on the carrying capacity of its arable land resources [4,12]. On the other hand, due to the long cycle of investment in overseas arable land, the arable land resources of the host country will play an essential role in the sustainable operations and development of multinational enterprises [20,46].
Hypothesis 2.
A good institutional environment in the host country promotes the scale of China’s investment in the country’s arable land.
Under the condition that the arable land in a host country has not been fully commercialized, the country’s government may transfer land use rights from one party to another as an expropriator, broker, and/or mediator, and so in some countries, it may intervene frequently in land transactions [47]. Moreover, investment in arable land has a long investment cycle. Thus, the host country’s institutions and regulations may represent sources of risk for investors, especially for enterprises with the motive of seeking natural resources in target countries. Since the exploitation of natural resources brings a considerable amount of rental income to the local government, corruption or deterioration of the institutional environment of host countries that have abundant resources may tend to occur [48,49].
Hypothesis 3.
The geographical distance between the two countries is negatively correlated with the tendency of Chinese enterprises to invest in the host country’s arable land.
Tobler’s first law of geography states that “everything is interrelated, but near things are more closely linked than distant things” [50]. Some studies show that the distance between countries is the primary determinant of bilateral international trade and international investment flows [4,21]. Some scholars believe that increases in geographical distance are followed by increases in communication and transportation costs, which in turn lead to higher costs for the coordination and management of overseas investments [51].
Hypothesis 4.
China’s GDP level is positively related to the scale of its annual investment in foreign arable land.
The level of economic development of a country is an important factor in promoting its OFDI [21,49]. Therefore, if a country’s GDP level rises, it may increase its level of foreign direct investment. Following Wan and Lu [21], this study uses total GDP as a proxy of China’s national economic power.

2.5.3. Empirical Analysis

We study the factors impacting China’s arable land investment in the countries in the Belt and Road region for the period from 2008 to 2016 by means of a panel Tobit model and set the left merge point to 200 hm2. Consistent with the theory and hypotheses formulated, our empirical specification includes measures of arable land resources, institutional environment, a distance factor, and China’s GDP as explanatory variables. More precisely, the Tobit model-estimated equation is:
o f d i i t = β 0 + β 1 r e s i t + β 2 c o r i t + β 3 ln d i s c a p i t + β 4 ln c g d p i t + γ Controls i t + ε i t
In Equation (13), ofdi represents the arable land area in which China has invested in countries in the Belt and Road region. The variable res denotes countries’ arable land resources and takes a value ranging from zero to one. In recognition of the particular nature of Chinese investment in overseas arable land, we primarily examine the host country’s institutional environment and risk level from the government’s perspective. We quantify political corruption based on International Country Risk Guide ratings to reflect the risk level of the host country (represented by cor) using averaged monthly values to produce annual figures. lndiscap is the natural logarithm of the distance between the capital cities of China (Beijing) and the host country, representing the transport and time costs resulting from geographical distance. China’s GDP (cgdp) represents China’s economic conditions in a given year. Moreover, i is the number assigned to each host country, taking a value between one and 48; t represents the year, taking a value between 2008 and 2016; and εit is the error item.
We include some control variables that have been recognized as important in previous studies concerning the host country determinants of Chinese OFDI flows [50,51]. The main control variables are the GDP of the host country and the trade openness and infrastructure levels of the host country. The host economy control variable (hgdp) reflects the host country’s market size, which may influence the market-seeking behavior of investors. The level of trade openness (trade) is measured as the proportion of host country merchandise exports and imports divided by the value of GDP. The infrastructure of the host country, represented by elec, will affect the efficiency of operations and management of investments by enterprises. It is measured as the percentage of the population with access to electricity.
To eliminate the impact of dimensional inconsistencies, we use logarithms to study the indexes of geographical distance, China’s GDP, and the GDP of the host country [21]. The regression parameter of each index may objectively measure the impact of the index on Chinese investment in arable land in the countries in the Belt and Road region.

3. Empirical Analysis

3.1. Summary Statistics of the Variables Employed in This Study

Table 4 displays the correlation matrix for the study variables, and Table 5 presents the definitions and data sources of the main explanatory variables in the study. Table 6 presents statistical descriptions of each variable.

3.2. Empirical Results

For Tobit panel data with a certain number of zero dependent values, we utilize a mixed effects panel Tobit model and a random effects panel Tobit model and use maximum likelihood ratios to test the models selected. According to the regression results presented in Table 7, all maximum likelihood ratios for the equation reject the indifferent estimation results of the random panel Tobit and mixed panel Tobit models. The data indicate that the random effects panel Tobit model should be adopted. The empirical analysis in this study is performed using Stata 15 software.
In the Tobit regression results (Table 7), we first test the impact of the independent variable (res) to the outcome in Regression 1 and find a significance level of 5%. Then, we add the three indicators of the hypotheses (cor, lndiscap, and lncgdp) and find that the independent variable is significant at the 1% level. After adding the three control variables of lnhgdp, trade, and elec, the significance level of res declines to 5%, but with a higher coefficient value.

3.3. Robustness Check

To further evaluate the validity of the Tobit model regressions, we consider the effects of hysteresis and abnormal sample points on the main study model [52].
In light of the fact that the host country’s cultivated land resources and other control variables may have a certain time lag effect on China’s overseas cultivated land investment, we replace the current term of cultivated land resources and other control variables with their respective one year lagged values.
Because the arable land resources of many of the countries involved in the Belt and Road Initiative undergo unbalanced development, the unbalanced distribution of arable land quality in these countries may lead to abnormal sample points in terms of the arable land resources assessed in this study. Therefore, to find out whether the regression results may be affected by abnormal sample points, we conduct a winsorized (tail-end) test on the variable arable land resources with 1% extreme value processing.
The results of these robustness tests, which are presented in Table 8, show that the signs and values of the main explanatory variables are almost unchanged in the revised model. This demonstrates that the regression results are robust.

4. Discussion

The results show that res, which represents the arable land resources in countries in the Belt and Road region, is one of the most stable and influential variables in our study. Arable land resources in the host country, a measure which is calculated comprehensively based on the quantity and quality of the arable land, has played a substantial and positive role in China’s investment in arable land in the countries along the Belt and Road route. This result supports hypothesis 1 and indicates that investment by Chinese enterprises in overseas arable land is successful in selecting land that contributes to the sustainable supply of the input elements needed for food production.
In the indexes that represent host country institutions and risks, corruption level (cor) has a significant negative influence on the scale of Chinese investment in arable land in countries in the Belt and Road region. This result supports hypothesis 2 and suggests that Chinese enterprises demonstrate risk aversion in their investments in cultivated land, which is consistent with Wan and Lu [21]. With the recent establishment of China’s modern enterprise system, Chinese enterprises have become more market oriented in their approach to overseas arable land investment [12,21].
The geographical distance (lndiscap) variable has a strong negative correlation with investment, which is consistent with the results obtained by other scholars [21]. This result confirms that geographical distance hinders cross-border investment.
The sign of the coefficient on the host country market variable (lnhgdp) is negative, but the coefficient is not found to be statistically significant. Therefore, the results indicate that the economic conditions of the host country have no significant impact on the tendency of Chinese enterprises to invest in arable land in the countries studied, and thus hypothesis 3 is not supported. One possible explanation for this is that although some of the crops invested in and developed by Chinese enterprises in the host countries are sold directly in the local market, some enterprises engage in export trade, capitalizing on the geographic advantages or policy environment of the host country, and therefore the host country’s economic conditions are not of high importance [4].
China’s gross domestic product (lncgdp) is positively correlated with the scale of investment in host countries’ arable land (ofdi) at the 1% significance level, which indicates that China’s economic power can also significantly increase the tendency for investment in overseas arable land, which supports hypothesis 4.
The coefficient of the infrastructure variable (elec) is negative and significant at the 10% level. A possible reason for this is that most of the countries along the Belt and Road are developing countries for which electric power systems are generally not well developed, and those that are least developed may be the countries in which there is the greatest availability of unutilized arable land [53]. In such countries, China can use its own infrastructure experience and capital advantages to offer complementary advantages in the use of arable land resources in underdeveloped areas.
In summary, our research results show that Chinese companies tend to invest in countries with abundant arable land resources and low corruption risks. Our findings are also consistent with Dunning’s [17] resource-seeking foreign investment characteristics and Kojima’s theory of comparative advantage [14].

5. Conclusions, Policy Implications, and Future Research Directions

5.1. Conclusions

This study explores the main factors affecting the scale of China’s investment in foreign arable land in 48 Belt and Road countries during the period 2008–2016. We establish the evaluation of arable resource systems based on the quantity and quality of arable land, using a measure comprised of eight sub-indicators. Our findings show that arable land resources in the host country significantly and positively affect China’s investment in overseas farmland and increases in China’s economic power also significantly increase its investment. The host country’s corruption level and geographical distance have significant negative impacts on China’s overseas farmland investment.

5.2. Policy Implications

By means of overseas arable land investment, China can alleviate the pressure on its domestic arable land resources and can, to a certain extent, ensure food security [12]. At the same time, it can effectively allocate domestic and foreign resources [5,54]. According to our findings and the location characteristics of countries studied, this paper proposes the following three policy implications.
First, Chinese enterprises should protect the local ecological environment to pursue long-term benefit. Because the period of investment in cultivated land is long and the quality of cultivated land accounts for an important part of the evaluation system of cultivated land resources, Chinese enterprises should take good care of local land and water resources, should take their social responsibilities seriously in order to increase the proportion of locals in employment, for example, and create a good ecological environment for their project’s operations. In addition to their ethical merits, these actions will support the sustainability of the long-term investments in arable land.
Second, Chinese enterprises should pay more attention to the “high-risk” and underdeveloped countries and engage in joint development with them. Countries with abundant land resources have attracted attention from developed countries for many years, making it difficult for emerging countries like China to benefit from new investment opportunities. Thus, more attention should be paid to less-developed nations with insufficient investment in agricultural production in Asia and Africa, such as Myanmar. While profits may be low in the short term, and losses may even arise initially, they will be profitable in the long run. For example, overseas investment by enterprises in China can provide funds to those countries and share the benefits of China’s agricultural research, development techniques, and know-how. This may advance the “international development” of China’s supply chains relating to seeds, agricultural machinery, and fertilizers, while also promoting the development of host countries’ local economies.
Third, in addition to considering situations of local government corruption, more information should be collected regarding the wider cultural context of the host country, such as local religious beliefs, before investment decisions are made. Chinese enterprises should make a detailed plan and fully study the investment environment of the host country, choose the appropriate mode of overseas investment, protect the legitimate rights and interests of local farmers, and reduce their own investment risks.

5.3. Limitations and Future Research Directions

This article uses macro-level data to analyze the selection of host countries and influencing factors of China’s overseas arable land investment in the Belt and Road region. In so doing, the paper has the following two shortcomings.
First, due to limitations of the available data, the study’s model of investment in arable land resources does not include ecological indicators (e.g., Greenhouse gas emissions from crop residues). Such indicators may be important factors relevant to Chinese firms’ investment behavior.
Second, China’s overseas arable land investment activities are mainly undertaken by business enterprises. Due to the limited availability of corporate information, this article is not able to analyze in detail the scale or industry status of the Chinese enterprises that engage in these activities.
Future research can also enrich the research in this area from other perspectives, such as by comparing the location choices for overseas arable land investment from China to the equivalent choices made by other countries (e.g., America, [55]), thus providing a reference for Chinese companies to develop their future overseas cultivated land investment decisions.

Author Contributions

The corresponding author, Z.Y., proposed the topic and spearheaded the data analysis and methodological design. Q.S. helped in the design and analysis, and R.T. primarily contributed to the research implementation, analysis, and the writing of the manuscript. All authors have read and agreed to the published version of the manuscript.

Funding

This research received no external funding.

Conflicts of Interest

The authors declare no conflicts of interest.

Appendix A

Table A1. Weight (Wi) change trends for each sub-indicator during the period 2008 to 2016.
W1W2W3W4W5W6W7W8
20080.19950.07180.05500.23450.08970.24140.10690.0011
20090.19880.07210.05470.23610.08940.24060.10640.0020
20100.19790.07250.05410.23610.08950.24090.10630.0027
20110.19750.07320.05380.23560.08930.24030.10590.0043
20120.19740.07380.05360.23800.09000.23890.10180.0066
20130.19710.07440.05270.23720.09000.23890.10520.0046
20140.19660.07470.05240.23660.09030.23920.10520.0049
20150.19700.07450.05290.23830.09070.23900.10170.0058
20160.19620.05200.07460.23740.09010.23900.10500.0057

Appendix B

Table A2. The output Resj for 48 countries in the Belt and Road region during the period 2008 to 2016.
Country200820092010201120122013201420152016
Brunei0.05760.05680.05660.05620.05200.05480.05480.05140.0532
Indonesia0.27160.26940.27000.27000.26550.26540.26670.26510.2657
Cambodia0.03290.03250.03260.03240.03100.03170.03170.03060.0314
Laos0.08440.08310.08270.08230.07680.08060.08080.07640.0805
Myanmar0.14640.14510.14560.14560.14220.14320.14390.14220.1434
Malaysia0.09400.09280.09270.09240.08900.09050.09070.08860.0904
Philippines0.07020.06960.06970.06970.06890.06920.06960.06920.0693
Singapore0.00040.00040.00040.00060.00080.00060.00060.00060.0005
Vietnam0.07910.07870.07890.07890.07740.07700.08090.07770.0766
Kazakhstan0.09710.09600.09620.09750.09700.09670.09620.09520.0949
Kyrgyzstan0.03000.02970.02960.02950.02790.02880.02860.02740.0285
Tajikistan0.02870.02830.02810.02780.02640.02710.02700.02600.0269
Mongolia0.03690.03550.03520.03490.03240.03360.03340.03140.0332
Russia0.50410.49880.49830.49880.49100.49210.49430.49120.4921
Poland0.03600.03570.03240.03310.03240.03190.03220.03190.0317
Czech Republic0.02150.02120.02110.02110.02080.01670.01660.02050.0165
Slovakia0.01780.01730.01730.01730.01660.01640.01630.01630.0160
Hungary0.02850.02820.02700.02710.02710.02660.02660.02710.0266
Slovenia0.02500.02470.02480.02490.02330.02490.02520.02370.0251
Croatia0.01000.01010.01070.01070.02490.01050.00990.02520.0106
Romania0.04870.04860.04940.04920.04830.04790.04800.04810.0476
Bulgaria0.02200.02240.02280.02340.02370.02500.02520.02510.0253
Serbia0.01950.01910.01950.01950.01890.01920.01940.01920.0194
Albania0.03500.03470.03500.03520.03390.03540.03660.03560.0366
Estonia0.03050.03050.03160.03180.03040.03220.03290.03190.0336
Lithuania0.02800.03050.03210.03360.03460.03580.03700.03440.0348
Latvia0.02970.03010.03090.03150.03120.03310.03370.03310.0351
Ukraine0.08770.08690.08720.08720.08670.08680.08670.08590.0863
Belarus0.02950.02960.02970.02990.02960.03010.03060.03040.0306
Moldova0.02980.02960.02950.02950.02940.02940.02950.02940.0295
Turkey0.08450.08340.08350.08210.08130.08070.08080.08070.0801
Iran0.10320.10360.10470.10460.10600.10470.10470.10520.1047
Iraq0.05040.05120.05150.05170.04970.04710.04840.04880.0475
UAE0.03180.01970.01970.01970.01900.01890.01900.01700.0169
Saudi Arabia0.01940.01890.01890.01890.01860.01830.01870.01890.0188
Qatar0.01450.01570.01570.01570.01560.01530.01560.01580.0157
Lebanon0.01330.01350.01330.01340.01360.01360.01360.01370.0136
Oman0.00340.00350.00350.00350.00350.00340.00340.00350.0035
Yemen0.00840.00820.00840.00820.00830.00810.00810.00810.0081
Jordan0.00750.00740.00740.00740.00750.00800.00810.00820.0081
Israel0.03320.03330.03340.03340.03350.03380.03300.03350.0333
Armenia0.01620.01640.01640.01650.01670.01680.01690.01680.0169
Azerbaijan0.03010.03020.03020.03020.03030.03030.03050.03070.0306
Egypt0.08260.08130.08150.08150.08220.08190.08220.08330.0825
India0.66760.67100.67040.67020.67590.67480.67310.67580.6745
Pakistan0.21430.21460.21450.21510.21340.21130.21070.21160.2119
Bangladesh0.07400.07440.07500.07480.07660.07830.07840.07850.0783
Sri Lanka0.02200.02230.02260.02290.02170.02240.02320.02320.0231

References

  1. Cotula, L.; Vermeulen, S. Deal or no deal the outlook for agricultural land investment in Africa. Int. Affairs 2009, 85, 1233–1247. [Google Scholar] [CrossRef]
  2. Antonelli, M.; Siciliano, G.; Turvani, M.E.; Rulli, M.C. Global investments in agricultural land and the role of the EU: Drivers, scope and potential impacts. Land Use Policy 2015, 47, 98–111. [Google Scholar] [CrossRef]
  3. Choi, D. “Land Grab” or Development Opportunity? The Effect of Transnational Farmland Investments on the Ghanaian Economy. Dev. Econ. 2018, 56, 3–34. [Google Scholar] [CrossRef] [Green Version]
  4. Jiang, X.; Chen, Y.; Wang, L. The location characteristics and influencing factors of China’s overseas arable land investment. Chin. J. Agric. Resour. Reg. Plan. 2018, 39, 46–53. [Google Scholar] [CrossRef]
  5. Han, J.; Li, Y.; Lu, X. Analysis on the sector collaboration type of overseas farmland investment. Res. Agric. Mod. 2017, 38, 241–249. [Google Scholar]
  6. Alden, C. China and the long march into African agriculture. Cah. Agric. 2013, 22, 16–21. [Google Scholar] [CrossRef]
  7. Campesina; GRAIN. It’s Time to Outlaw Land Grabbing, Not to Make It ‘Responsible’. Available online: https://www.grain.org/article/entries/4227-it-s-time-to-outlaw-land-grabbing-not-to-make-it-responsible (accessed on 21 November 2019).
  8. Grajales, J. The rifle and the title: Paramilitary violence, land grab and land control in Colombia. J. Peasant Stud. 2011, 38, 771–792. [Google Scholar] [CrossRef]
  9. Food and Agriculture Organization (FAO). On Horizon 2050-Billions Needed for Agriculture: High-level Forum to Weigh Investment Needs. Available online: http://www.fao.org/news/story/en/item/36107/icode.html (accessed on 21 November 2019).
  10. Jiang, X.; Chen, Y.; Wang, L. Can China’s Agricultural FDI in Developing Countries Achieve a Win-Win Goal?—Enlightenment from the Literature. Sustainability 2018, 11, 41. [Google Scholar] [CrossRef] [Green Version]
  11. Buckley, L. Chinese Land-Based Interventions in Senega. Dev. Chang. 2013, 44, 429–450. [Google Scholar] [CrossRef]
  12. Chen, Y.; Li, X.; Wang, L.; Wang, S. Is China different from other investors in global land acquisition? Some observations from existing deals in China’s going global strategy. Land Use Policy 2017, 60, 362–372. [Google Scholar] [CrossRef]
  13. Vernon, R. International investment and international trade in the product cycle. Q. J. Econ. Act. 1966, 80, 190–207. [Google Scholar] [CrossRef]
  14. Kojima, K. Direct Foreign Investment: A Japanese Model of Multinational Business Operations; Croom Helm: London, UK, 1978. [Google Scholar]
  15. Buckley, P.J.; Casson, M. The Future of the Multinational Enterprise; Holmes and Melers: New York, NY, USA, 1976. [Google Scholar]
  16. Rugman, A.M. Inside the Multinationals; Croom Helm: London, UK, 1987. [Google Scholar]
  17. Dunning, J.H. Explaining the international direct investment position of countries. Int. Trade J. 1982, 117, 30–64. [Google Scholar] [CrossRef]
  18. Ramasamy, B.; Yeung, M.; Laforet, S. China’s outward foreign direct investment: Location choice and firm ownership. J. World Bus. 2012, 47, 17–25. [Google Scholar] [CrossRef]
  19. Ivar, K.; Arne, W. What determines Chinese outward FDI? J. World Bus. 2008, 47, 1–9. [Google Scholar] [CrossRef]
  20. Aleksynska, M.; Harylchyk, O. FDI from the south: The role of institutional distance and natural resources. Eur. J. Polit. Econ. 2013, 29, 38–53. [Google Scholar] [CrossRef] [Green Version]
  21. Wan, K.; Lu, X. Research on the Impact Factors on Selecting Host Countries of China’s Overseas Farmland Investment. China Land Sci. 2018, 6, 75–81. [Google Scholar] [CrossRef]
  22. Wang, J.; Ma, H.; Tang, H. Empirical Analysis on Determinants for Location Choice of China’s Overseas Agricultural Investment. J. Bus. Econ. 2017, 8, 88–97. [Google Scholar]
  23. Friis, C.; Nielsen, J. Small-scale land acquisitions, large-scale implications: Exploring the case of Chinese banana investments in Northern Laos. Land Use Policy 2016, 57, 117–129. [Google Scholar] [CrossRef] [Green Version]
  24. Cheung, Y.; Qian, X. The Empirics of China’s Outward Direct Investment. Pac. Econ. Rev. 2009, 14, 312–341. [Google Scholar] [CrossRef] [Green Version]
  25. Li, M.; Wang, J.; Chen, Y. Evaluation and Influencing Factors of Sustainable Development Capability of Agriculture in Countries along the Belt and Road Route. Sustainability 2019, 11, 2004. [Google Scholar] [CrossRef] [Green Version]
  26. Zou, J.; Liu, W. Trade Network of China and Countries along “Belt and Road Initiative” Areas from 2001 to 2013. Sci. Geogr. Sin. 2016, 36, 1629–1636. [Google Scholar] [CrossRef]
  27. State Information Center. Big Data Report of Trade Cooperation under the Belt and Road Initiative (2017). Available online: http://www.sic.gov.cn/News/79/7811.htm (accessed on 21 November 2019).
  28. Chinese Ministry of Commerce. Foreign Investment Cooperation Country (Region) Guide. Available online: http://fec.mofcom.gov.cn/article/gbdqzn/ (accessed on 21 November 2019).
  29. National Bureau of Statistics of China. China Commerce Yearbook; National Bureau of Statistics of China: Beijing, China, 2017.
  30. How, J.; Ma, H. Gravity Equation: A Literature Review and Applications to China’s Foreign Trade. J. Quant. Econ. 2012, 10, 53–69. [Google Scholar]
  31. Rauch, J.E.; Trindade, V. Ethnic Chinese Networks in International Trade. Rev. Econ. Stat. 2002, 84, 116–130. [Google Scholar] [CrossRef] [Green Version]
  32. Landmatrix, 2019. Available online: https://landmatrix.org/ (accessed on 21 November 2019).
  33. GRAIN, Squeezing Africa Dry: Behind Every Land Grab Is A Water Grab. 2012. Available online: https://www.grain.org/en/article/4516-squeezing-africa-dry-behind-every-land-grab-is-a-water-grab (accessed on 21 November 2019).
  34. GRAIN, The Global Farmland Grab in 2016: How Big, How Bad? 2016. Available online: https://www.grain.org/en/article/5492-the-global-farmland-grab-in-2016-how-big-how-bad (accessed on 21 November 2019).
  35. Sun, Z.; Jia, S.F.; Lv, A. The status of China’s overseas farmland investment. Resour. Sci. 2018, 40, 1495–1504. [Google Scholar] [CrossRef]
  36. Lagerkvist, J. As China returns: Perceptions of land grabbing and spatial power relations in Mozambique. J. Asian Afr. Stud. 2014, 49, 251–266. [Google Scholar] [CrossRef]
  37. Shannon, C.E. A mathematical theory of communication. Bell Labs Tech. J. 1948, 27, 379–423. [Google Scholar] [CrossRef] [Green Version]
  38. Lai, Y.J.; Liu, T.Y.; Hwang, C.L. TOPSIS for MODM. Eur. J. Oper. Res. 1994, 76, 486–500. [Google Scholar] [CrossRef]
  39. Zhu, S.; Li, D.; Feng, H.; Gu, T.; Zhu, J. AHP-TOPSIS-Based Evaluation of the Relative Performance of Multiple Neighborhood Renewal Projects: A Case Study in Nanjing, China. Sustainability 2019, 11, 4545. [Google Scholar] [CrossRef] [Green Version]
  40. Dos Santos, B.M.; Godoy, L.P.; Campos, L. Performance evaluation of green suppliers using entropy-TOPSIS-F. J. Clean. Prod. 2019, 207, 498–509. [Google Scholar] [CrossRef]
  41. Zou, J.; Wu, Q. Spatial Analysis of Chinese Grain Production for Sustainable Land Management in Plain, Hill, and Mountain Counties. Sustainability 2017, 9, 348. [Google Scholar] [CrossRef] [Green Version]
  42. World Bank Database. Available online: http://data.worldbank.org.cn/ (accessed on 21 November 2019).
  43. Food and Agriculture Organization Database of the United Nations. Available online: http://www.fao.org/statistics/databases/zh/ (accessed on 21 November 2019).
  44. Tobin and James. Estimation of Relationships for Limited Dependent Variables. Econometrica 1958, 26, 24–36. [Google Scholar] [CrossRef] [Green Version]
  45. Deatan, A. The Analysis of Household Surreys; The Johns Hopkins Press: Baltimore, MD, USA, 1997. [Google Scholar]
  46. Hofman, I.; Ho, P. China’s “developmental outsourcing”: A critical examination of Chinese global “land grabs” discourse. J. Peasant Stud. 2012, 39, 1–48. [Google Scholar] [CrossRef]
  47. Li, T.M. Transnational Farmland Investment: A Risky Business. J. Agrar. Chang. 2015, 15, 560–568. [Google Scholar] [CrossRef]
  48. Fredriksson, P.G.; List, J.A.; Millimet, D.L. Bureaucratic corruption, environmental policy and inbound us FDI: Theory and evidence. J. Public Econ. 2003, 87, 1407–1430. [Google Scholar] [CrossRef] [Green Version]
  49. Ivar, K.; Arne, W. Is Transparency the Key to Reducing Corruption in Resource-Rich Countries? World Dev. 2009, 37, 521–532. [Google Scholar]
  50. Tobler, W. A computer movie simulating urban growth in the Detroit region. Econ. Geogr. 1970, 46, 234–240. [Google Scholar] [CrossRef]
  51. Daniels, J.P.; Marc, V.D.R. Transportation costs and us manufacturing FDI. Rev. Int. Econ. 2014, 22, 299–309. [Google Scholar] [CrossRef]
  52. Tao, X.; Jin, T.; Yang, Y. The Enlightenment of the East Asian Model and the Revelation of China’s Economic Growth Structure Puzzle. Econ. Res. J. 2017, 52, 45–60. [Google Scholar]
  53. Wu, S.; Liu, Y.; Liu, L.; Gao, J. Geographical patterns and environmental change risks in terrestrial areas of the Belt and Road. Acta Geogr. Sin. 2018, 7, 1214–1225. [Google Scholar] [CrossRef]
  54. Zhao, Y. China–Africa development cooperation in the rural sector: An exploration of land tenure and investments linkages for sustainable resource use. Environ. Dev. Sustain. 2013, 15, 355–366. [Google Scholar] [CrossRef]
  55. Han, J.; Yang, C.; Ke, N.; Lu, X. Analysis of the Spatial Difference and Impact Factors of China and America’s Overseas Farmland Investment Host Country Selections in Africa. China Land Sci. 2018, 32, 39–45. [Google Scholar] [CrossRef]
Figure 1. Total contract areas of Chinese investments in overseas arable land for the 48 target countries from 2008 to 2016, excluding land transaction areas under negotiation or in a delayed state.
Sustainability 12 00097 g001
Figure 2. Country distribution of arable land investment in 2008 and 2016.
Sustainability 12 00097 g002
Figure 3. Research framework.
Sustainability 12 00097 g003
Table 1. Countries within the Belt and Road initiative.
AreaCountries
Southeast AsiaBrunei, Indonesia, Cambodia, Laos, Myanmar, Malaysia, Philippines, Singapore, Vietnam
Central AsiaKazakhstan, Kyrgyzstan, Tajikistan
Mongolia and RussiaMongolia, Russia
West Asia and Middle EastTurkey, Iran, Iraq, United Arab Emirates, Saudi Arabia, Qatar, Lebanon, Oman, Yemen, Jordan, Israel, Armenia, Azerbaijan, Egypt
South AsiaIndia, Pakistan, Bangladesh, Sri Lanka
Central and Eastern EuropePoland, Czech Republic, Slovakia, Hungary, Slovenia, Croatia, Romania, Bulgaria, Serbia, Albania, Estonia, Lithuania, Latvia, Ukraine, Belarus, Moldova
Note: Countries in the Belt and Road area are grouped in accordance with Zou’s [26] classification.
Table 2. Comprehensive index system of arable land resources.
SystemSubsystemIndex Level
Arable land resourcesQuantitative factorsTotal arable land area (×1)
Arable land (hectares per person) (×2)
Arable land (% of land area) (×3)
Qualitative factorsAgricultural irrigated land (×4)
Agricultural irrigated land (% of total arable land) (×5)
Renewable internal freshwater resources (×6)
Renewable internal freshwater resources per capita (cubic meters) (×7)
Crop production index (×8)
Source: World Bank Database [42] and FAO Statistics [43].
Table 3. Top five countries ranked by arable land resources (Resj).
Country200820092010201120122013201420152016
India0.66760.67100.67040.67020.67590.67480.67310.67580.6745
Russia0.50410.49880.49830.49880.49100.49210.49430.49120.4921
Indonesia0.27160.26940.27000.27000.26550.26540.26670.26510.2657
Pakistan0.21430.21460.21450.21510.21340.21130.21070.21160.2119
Myanmar0.14640.14510.14560.14560.14220.14320.14390.14220.1434
Table 4. Correlation matrix for all study variables.
ofdirescorlndiscaplncgdplnhgdptradeelec
ofdi1.000
res0.4021.000
cor−0.216−0.0461.000
lndiscap−0.182−0.1980.1301.000
lncgdp0.100−0.0020.1250.0001.000
lnhgdp0.1250.5230.3230.1770.0631.000
trade−0.184−0.3420.4490.041−0.02−0.0981.000
elec−0.147−0.1640.1110.4980.0800.1580.2071.000
Table 5. Details of the variables.
VariableMeaningData Source
ofdiChinese arable land investment scale (ten thousand hectares) Land Matrix database, GRAIN database, and Sun et al. (2018).
resComprehensive evaluation of arable land resource (0–1). World Bank database and UN Food and Agriculture Organization database
corCorruption level in the host country (0–6). Higher scores represent more corruption.International Country Risk Guide
discapLinear distance between capital cities CEPII database. http://www.cepii.fr/
cgdpChina’s GDP (adjusted to 2010 US$)World Bank database
hgdpMarket scale of host country (adjusted to 2010 US$)World Bank database
tradeTotal import and exports as share in GDP (%)World Bank database
elecPercentage of the population with access to electricity (%)World Bank database
Table 6. Statistical descriptions of variables.
VariableMeanStd. Dev.MinMax
ofdi1.92716.69890.000057.5400
res0.07240.11940.00040.6758
cor2.24990.74001.00004.5000
lndiscap8.57340.39227.06658.9519
lncgdp29.58730.206729.240529.8823
lnhgdp25.14111.492222.266928.5337
trade83.544646.436618.8031342.2827
elec93.022913.540526.4000100.0000
Table 7. Tobit regression results.
Regression 1Regression 2Regression 3
res53.2050 **62.6913 ***88.6743 **
(2.51)(2.73)(2.19)
cor −21.3416 ***−20.8693 ***
(−4.39)(−4.04)
lndiscap −24.8085 ***−16.9537 *
(−3.29)(−1.86)
lncgdp 20.8088 ***27.9401 ***
(6.71)(6.02)
lnhgdp −2.2948
(−0.62)
trade 0.1153
(1.55)
elec −0.3419 **
(−1.99)
sigma_u28.1980 ***23.8403 ***24.8512 ***
sigma_e(6.01)
7.5249 ***
(12.66)
(4.31)
5.7446 ***
(12.44)
(3.80)
5.5977 ***
(12.42)
Number of observations432432432
Note: *** p < 0.01, ** p < 0.05, * p < 0.1; the Z value of the regression coefficient is in brackets.
Table 8. Results of the robustness test using the Tobit model.
(1) Explanatory Variable (lag 1 Period)(2) Tail Shrinkage Test
Z-StatisticCoefficientZ-StatisticCoefficient
res2.3398.9252 **2.1888.7992 **
cor−3.22−20.2646 ***−4.05−20.8639 ***
lndiscap−2.11−17.6085 **−1.86−16.9687 **
lncgdp5.4727.0361 ***6.0227.9426 ***
lnhgdp−0.85−2.9817−0.62−2.3014
trade1.530.11531.550.1152
elec−1.71−0.2884 *−1.99−0.3417 *
sigma_u3.9925.0946 ***3.8124.8499 ***
sigma_e11.755.4377 ***12.425.5980 ***
Number of observations384384432432
Note: *** p < 0.01, ** p < 0.05, * p < 0.1.

